Page 1
Paul Bunyan Scenic Byway:
Awareness, impact on quality of life & economy
Rachel S. Liechty, Graduate Research Assistant
Ingrid E. Schneider, Ph.D.
University of Minnesota Tourism Center,
A collaboration of University of Minnesota Extension &
College of Food, Agricultural & Natural Resource Sciences
&
Brigid Tuck, M.S.
University of Minnesota Extension: Center for Community Vitality
December, 2010
Page 2
2
Acknowledgements
The Paul Bunyan Scenic Byway project was funded in part by the Central Regional
Sustainable Development Partnership, the Carlson Chair for Travel, Tourism & Hospitality, and
Explore Minnesota Tourism. Thank you to all the local businesses and organizations that
participated in the project. Also, a heartfelt thank you to the volunteers who collected data. This
project could not have been completed without the tireless assistance of Linda Ulland, Central
Sustainable Development Partnership Executive Director and Lynn Scharenbroich, Paul Bunyan
Scenic Byway.
Page 3
3
Executive Summary
In 2009, the Paul Bunyan Scenic Byway undertook a study with a three-fold foci to
identify: 1) consumer awareness of the byway, 2) the byway‟s impact on quality of life among
residents, and 3) the economic impact of byway travelers to the regional economy. The project
was supported by the Central Regional Sustainable Development Partnership, the Carlson Chair
for Travel, Tourism and Hospitality at the University of Minnesota, and Explore Minnesota
Tourism.
Methods
A total of 337 systematically selected people completed a short questionnaire while on or
near the Paul Bunyan Scenic Byway summer and fall 2010. The completed questionnaire data
were entered, cleaned, and checked in SPSS version 17.0. Descriptive analysis ensued. Although
the goal was to collect 400 completed questionnaires, challenges with volunteer staffing existed
and thus, the sample size is smaller than desired.
Select Results
Consumer awareness
Residents: Eight of ten residents were aware of the byway: more than half of
residents were very much aware of its presence (58%) and a quarter were somewhat
aware (28%). Residents most frequently found out about the byway through word of
mouth (39.1%), signs (35.3%), a local newspaper (30.4%), or maps (21.3%).
Travelers: Five of ten travelers were aware of the byway: 21% very and 31%
somewhat aware. Between fifteen and 20% were not aware of this byway (15.8%) or of
byways in general (19.4%). Travelers most frequently found out about the byway
Page 4
4
through word of mouth (26.4%), signs (18.6%), a map (14.3%), or in a local newspaper
(9.3%). Of the 37% of respondents whose travel plans were affected by the byway,
about one of five indicated they intended to visit again to experience the byway (17.1%).
One of ten travelers visited the region to use the byway (8.6%). Five percent visited the
region primarily because of the byway and two percent stayed longer in the region to
experience the byway. However, more than half of travelers indicated the byway had no
effect on their travel plans (63%).
Byways impact on resident’s quality of life
Residents were asked to rate the importance of fourteen diverse community
attributes and the impact of scenic byways on each one. The majority of residents
identified all fourteen listed community attributes as important or very important. Feeling
safe was rated as the most important community attribute, followed by natural area
preservation, recreation opportunities, good jobs for residents, preservation of
cultural/historical sites, community beauty, and property value. Of these attributes,
residents indicated the byway contributed most to recreation opportunities, natural area
preservation, and preservation of cultural/historical sites.
Economic impact of travelers to the byway economy
In 2010, an estimated 23,800 travel parties visited the region specifically because
of the byway. These travel parties spent a total of $21.6 million dollars while in the
region including $14.6 million on locally produced goods and services. An analysis
indicates that as a result of this spending, byway travelers created a total of $21.2 million
in economic output (sales) in the regional economy, including 331 full-time, part-time,
Page 5
5
and seasonal jobs and $7.2 million in labor income. The lower than desired sample size
introduced some uncertainty into the economic impact analysis. Varying the assumptions
used in the analysis can substantially alter the resulting economic impact estimates. One
variation – reducing the non-resident portion of byway traffic to account for
methodological concerns – results in estimates of $12.7 million in economic impact
(including 199 jobs and $4.3 million in labor income). Another variation – combining
the assumptions in the first variation with an expanded definition of byway travelers to
include all travelers for whom the byway factored into their travel plans – results in
estimates of $38.2 million in economic impact (including 560 jobs and $13.1 million in
labor income).
Page 6
6
Table of Contents
Acknowledgements.............................................................................................................. 2
Executive Summary............................................................................................................. 3
Introduction.......................................................................................................................... 8
Brief Literature Review............................................................................................. 10
Methods............................................................................................................................... 14
Study Setting............................................................................................................ 14
Screener & Questionnaire........................................................................................ 14
Sampling & Response Rate...................................................................................... 15
Analysis................................................................................................................... 16
Results................................................................................................................................. 19
Resident Respondents............................................................................................. 19
Demographic profile & area experience..................................................... 19
Byway awareness & tourism‟s importance in the community..................... 19
Importance of community attributes & byway impact on attributes............ 20
Traveler Respondents............................................................................................... 21
Demographic profile & area experience....................................................... 21
Byway awareness & impact on visitation.................................................... 22
Economic Impact...................................................................................................... 22
Discussion............................................................................................................................. 27
Limitations & Future Opportunities.......................................................................... 28
Page 7
7
References............................................................................................................................. 30
Appendices............................................................................................................................ 36
Appendix A. Screener Questionnaire....................................................................... 36
Appendix B. Survey Instruments.............................................................................. 37
Appendix C. List of Tables....................................................................................... 41
Appendix D. List of Figures..................................................................................... 51
Appendix E. At a Glance Summary.......................................................................... 59
Page 8
8
Introduction
Driving in the United States is more than a road leading to an end: it is a way of life as
well as a significant source of leisure travel and revenue. Scenic byways are a foundation for
leisure travel, providing both residents and travelers with opportunities to learn about heritage
and experience scenic resources. Similarly, these pleasure trips generate economic impacts for
the communities along and adjacent to scenic byways. Leisure travel accounts for nearly one -
third of all long-distance trips taken in the U.S. (30.1%; where leisure includes rest or relaxation,
sightseeing, outdoor recreation, and entertainment; U.S. Department of Transportation (USDOT,
2010; USDOT, 2005c).
Pleasure driving is engrained in U.S.travel and scenic byways are part of that pleasure
driving. According to the National Survey on Recreation and the Environment, 49.7% (116.9
million) of the U.S. population (people 16 and older) participated in “driving for pleasure” from
2005-2009 (Cordell, 2009). According to the USDOT 2005 Traveler Opinion Survey, 40% of
travelers who traveled outside of their local region had used a scenic byway (USDOT, 2005c). In
2008, the U.S. National Park Service (NPS) received 30,165,232 recreational visits on its
national parkways, which are designated scenic roadways running through the parklands (Unrau
& Williss, 1983; U.S. Census Bureau, 2008). In Minnesota, pleasure driving is consistently a
frequently engaged in activity and, in the most recent data available, driving on scenic byways
accounted for approximately 13% of all travel activities (Explore Minnesota Tourism (EMT),
2008; EMT Online, 2010; Gartner, Love, & Erkkila, 2002).
Page 9
9
Visitor experiences along scenic drives speak to the relationship between transportation
and driving for pleasure (Draper & Petty 2001; Hallo & Manning, 2009). Hallo and Manning
suggest, “automobiles and roads are as much of a way of experiencing national parks as they are
a means of conveyance,” (p. 491). In their study of Acadia National Park visitors, surveys
revealed important experiential indicators included “travel freedom and convenience,” “vehicle
crowding,” and “scenery.” In a similar vein, Canton and Santos (2007) found visitors were able
to identify unique attributes when driving Route 66: the roadway design, historical significance
of the road, intimate experiences, and active interactions with people and landscapes.
The U.S. scenic byway system was introduced to Congress in 1989 through the
Intermodal Surface Transportation Efficiency Act (ISTEA) (USDOT, 1991a). Byways serve to
preserve and enhance unique resources, provide continuous assessments of economic impact,
and recognize selected roads for future scenic drives across the U.S. (Eby & Molnar, 2002;
USDOT, 1991b; Sipes et al., 1997). The National Scenic Byways Program (NSBP) has the
Secretary of Transportation designate scenic byways, recognized as “roadways having
outstanding qualities of scenic, historic, cultural, natural, recreational, and archeological
qualities” (Kelley, 2004; USDOT (U.S. Code, Title 23, Section 162, TEA-21), 1998). As of
2010, the Secretary of Transportation recognized a total 151 of America‟s Byways in 46 states
that represent the most scenic and rarest of landscapes, culture, and history preserved in the U.S.
(NSBP Online, 2009). Administered through the Federal Highway Administration by the U.S.
Secretary of Transportation, scenic byways are marketed based on one or more of their intrinsic
qualities. State transportation programs provide assistance with recreational areas and public
lands and scenic byway organizations are largely volunteer-based.
Page 10
10
Originally, the Transportation Equity Act for the 21st century (TEA-21) set aside $148
million for scenic byway programs and related projects along designated byways (USDOT,
1998). In 2005, the Safe, Accountable, Flexible, Efficient Transportation Equity Act: A Legacy
for Users (SAFETEA-LU) extended funding for the preservation of scenic roadways and
transportation in the U.S. The SAFETEA-LU provided a total of $244.1 billion for all highways,
safety, and other transportation infrastructures. Through 2009, the SAFETEA-LU funded $175
million toward scenic byways. The grants were dispersed to nominated states and Indian tribes to
develop a scenic byway program or improve a byway project. An additional $13.5 million within
the SAFETEA-LU supports educational activities and consultation provided by the America‟s
Byways Resource Center (USDOT, 2005d). The National Scenic Byways program also provides
merit-based funding (grants) for any byway-related projects developed by a state‟s department of
transportation for roadway planning, designing, and developing (NSBP Online, 2010).
Brief Literature Review
Scenic byways are relatively new in terms of transportation planning and design and are
similarly new within the published literature. Very few published studies focus on byways and,
as such, research directly involving scenic byways is needed.
Several authors stress concern about current research available related to scenic byways,
both nationally and in Minnesota (Gustafson, 2009; Petraglia & Weisbrod, 2001; Tuck, 2009a).
Byways are broadly examined under tourism and transportation umbrellas. For example, existing
studies mainly focus on highway transportation systems at a regional position or address the
national and state-designated scenic byway programs themselves (e.g., America‟s Byway
Resource Center; National Scenic Byway Foundation; National Scenic Byways Program). This
Page 11
11
review of academic literature focuses on scenic byway research (found under “scenic byway(s),”
“recreational driving,” “scenic driving,” “scenic route(s),” “driving for pleasure,” “drive
tourism,” and “themed routes”) that relates to economic impacts, quality of life and awareness.
Economic Impact of Scenic Byways
The overall economic impact of scenic byways has been broadly explored and remains
complex due to the nature of the tourism and the methods used (Davidson-Peterson Associates,
2004; Tuck, 2009a; Tuck, 2009b; Petraglia & Weisbrod, 2001). Economic research has primarily
focused on aspects of tourism impacts and consumer expenditures along roads with scenic
designation (e.g., Crompton, 2006; Davidson-Peterson Associates, 2004; Dean Runyan
Associates, 1990; Deller, Tsung-Hsiu, & Marcouiller, 2001; Gartner et al., 2002; Hampton,
2004; Shrestha, Burns, Graefe, & Gaydos, 2009). Tuck‟s 2009 review for Minnesota byways
provides a strong foundation for this work and, as such, only highlights of economic impact
studies are presented here. Scenic byways users are distinct users related to consumer
expenditures and economic activity (Gartner et al., 2002). Gartner et al. (2002) point to the
importance of understanding scenic roadway users‟ decisions, preferences, and benefits-sought
as they can greatly influence travel-related expenditures. Gartner‟s results indicate scenic road
users preferred low cost and roadway accessible activities (such as pull-offs that offer
recreational opportunities) and are attracted to small towns and cultural attractions. Travelers
showed strong preferences for “commercial-free corridors,” favoring commercial establishments
clustered together in small communities.
Scenic byways connect scenic, natural, and cultural sites (highly desirable amenities).
These amenities are of significant importance and are associated to regional economic growth
Page 12
12
(Deller, Tsung-Hsiu, & Marcouiller, 2001; Hampton, 2004; Kruger, 2006). Residents identify
scenic, natural, and water-based resources (such as land, lakes, and rivers), as well as
recreational opportunities, as significant indicators of local economic performance (e.g., jobs,
income, and property value) (Kruger, 2006; Marcouiller, Kwang-Koo, & Deller, 2004).
Essential to accurate economic analysis is that only travelers whose primary purpose is to
use a scenic byway should be included in the economic impact analysis (Crompton, 2006; Tuck,
2009a; Tuck, 2009b).
Quality of Life
Within tourism broadly, research indicates tourism impacts quality of life across a variety
of community amenities: roadway planning and design, job and income distribution, property
values, cultural and historical sites, and recreational opportunities (e.g, Allen, Long, & Perdue,
1988; Besculides & McCormick, 2002; Canton & Santos, 2007; Deller et al., 2001; Dickenson,
Robbins, & Fletcher, 2008; Wang & Pfister, 2002). Research suggests that both residents and
travelers migrate towards communities that contain natural, cultural, and recreational resources
(Besculides & McCormick, 2002; Deller et al., 2001; Diener, 1995; McCool & Martin, 1994).
However, as Gustafson (2009) points out, there is a paucity of research related to quality
of life and scenic byways. The definition of quality of life has been considered both subjectively
and objectively and is subject to change depending on context. Still, several researchers outlined
variables that affect perceptions of quality of life for both resident communities along scenic
byways and roadway travelers: attitudes and preferences towards tourism, available amenities,
travel motivations and experiences, and transportation quality (e.g., Diener, 1995; Gartner &
Erkkila, 2004; Gartner et al., 2002; Gilbert, & Abdullah, 2004; Hallo & Manning 2009; Kent,
Page 13
13
1993; Kruger, 2006). For example, Gilbert and Abdullah (2004) suggest that those who
participated in the activity of “holiday taking” (vs. non-holiday takers) had positive impacts on
levels of overall life satisfaction and happiness, as well as a higher sense of subjective well-being
prior to and post travel experience. Other studies (Gartner et al., 2002; Hallow & Manning, 2009;
Neal, Uysal, & Sirgy, 2007) point to experiential aspects, benefits sought, and tourism services
that impact travelers‟ quality of life (e.g., levels of acceptability for crowding, ability to escape
from the demands of life, amount of scenic vistas, concepts of freedom and convenience during
travel, to be with members of a particular group, levels of satisfaction with tourism services and
leisure life).
Consumer Awareness
The least explored topic within scenic byway research is consumer awareness. As of
2010, there were no academic studies that directly address consumer awareness of scenic
byways. However, previous literature suggests users choose a route because it carries scenic
byway designation (Eby & Molnar, 2002; Gartner & Erkkila, 2004; Gartner et al., 2002).
Awareness is an important component to route choice: from the initial route choice to the
travel experience itself (Li, 2000). Traveler experiences, motivations, and roadway preferences
play an integral role within the travelers‟ route choice and destination preferences (Hallo &
Manning 2009; Li, 2000). Eby and Molnar (2002) found that driving travelers are most
concerned with certain route characteristics: directness, safety, congestion and distance.
Travelers indicated scenic byways of secondary importance when choosing a route to a
destination. Among travelers, scenic byway designation was a more important feature for route
choice among those on vacation, those on a long-distance and duration trip, those staying in a
hotel or camping, and those who have planned the trip in advance.
Page 14
14
Our literature review reveals an uneven treatment of scenic byways in the research
literature. Particular opportunities exist to better understand the contribution of scenic byways to
local residents‟ quality of life and economies. As such, the purpose of this study was to assess
consumer awareness of select byways, byway‟s impact on quality of life among residents as well
as the economic impact of travelers along the Paul Bunyan Scenic Byway in Minnesota.
Methods
Study Setting
The Paul Bunyan National Scenic Byway is one of Minnesota‟s 22 designated scenic
byways: a double-circle route spanning 54 miles through the Brainerd Lakes area of north central
Minnesota. The byway area offers various opportunities: outdoor recreation experiences, events
and festivals, local area attractions, artistic and cultural sites, restaurants, lodges and resorts,
historical sites, as well as scenic and natural sites.
Screener & Questionnaire
First, respondents were screened regarding residency based on self-identification,
distance from primary residence and number of nights in the area (Appendix A). Then,
depending on their answer, residents and travelers received tailored questionnaires (Appendix
B). The two page questionnaire characterized respondent 1) travel and travel party, 2) level of
awareness regarding the Paul Bunyan Scenic Byway and if/how they knew about it, as well as 3)
personal characteristics such as zip code, gender, age, and household income.
As the interest with residents focused on quality of life perceptions, the tailored
questionnaire included these questions and residential history. The resident questionnaire asked
Page 15
15
respondents to indicate how many years they had lived in the area as well as in Minnesota.
Residents were queried regarding employment in the tourism industry (yes or no) as well as the
importance of tourism to the economy (on a scale where 1 = Not at all important and 5 =
Extremely important). Similarly, residents identified the extent byways contribute to local
tourism (on a scale where 1 = Not at all and 5 = To a great extent). Residents identified the
importance of and byway contribution to fourteen select community attributes on a 5 point scale
of importance (where 1 = Not at all and 5 = Extremely important) and 5 point scale of
contribution (where 1 = Greatly decreases to 5 = Greatly increases). Example attributes include
property value, good jobs for residents, and preservation of cultural/historical sites.
In contrast to residents, travelers were prompted about their spending in the area rather
than impact on quality of life. Expenditures within the past 24 hours and total dollar amount per
item, per party, were requested. Expenditure data categories included arts/entertainment, food
stores, dining/drinking out, lodging, recreational use fees, retail and services (e.g. spas, outfitters,
etc.) purchases, souvenirs, gas and other transportation costs. The traveler instrument asked
respondents to characterize their visit from a list of choices regarding 1) their primary mode of
transportation, 2) their length of stay (daytrip or overnight) and lodging where appropriate, and
3) area experience.
Sampling & Response Rate
Respondents were approached at a variety of local businesses and intercept sites along
the Paul Bunyan Scenic Byway: resorts, hotels and campgrounds; retail establishments, such as
food stores and gas stations; local area attractions and festivals; restaurants and bars; and
recreation areas or special events (Table C1). The intercept sites were located in the cities of
Page 16
16
Pequot Lakes, Breezy Point, Crosslake, Pine River, Jenkins, as well as the townships of Jenkins
and Ideal.
Questionnaires were distributed by trained local area volunteers from June 2010 through
October 2010. Sampling times were proportioned across month and weekday to capture a
breadth of visitors. A systematic sample was implemented where every third group was
approached and the person with the most recent birthday was asked to complete the
questionnaire. A total of 337 people completed the questionnaire: 198 as residents and 139 as
travelers. The goal was to collect 400 completed questionnaires. The lower than desired sample
size does introduce some uncertainty into the research, particularly the economic impact
analysis. Sample size may be smaller than desired due to the challenges of scheduling volunteers
for data collection.
Analysis
Respondent awareness & quality of life
Completed questionnaires were entered; the data were then cleaned and checked in SPSS
version 17.0. Extreme outliers were winsorized to bring highly skewed variables into usable
ranges. Descriptive analysis provided means, standard deviations, and frequencies to describe the
sample and provide information on variables of interest.
Economic impact
The completed traveler surveys were tabulated using Microsoft Excel. During
data cleaning, several response and data point outliers were removed from the dataset: a response
was considered an outlier if it was plus or minus three times the standard deviation. Average
spending per person was derived by dividing total reported spending by reported total number of
Page 17
17
people in the travel party. If average spending per person exceeded the outlier metric, the
individual‟s entire response was dropped from the dataset. No responses were dropped as a
result of this process. If a particular data point exceeded the outlier metric, the individual data
point was dropped. This resulted in five dropped data points: four lodging expenditure responses
and one recreational fees expenditure. Respondents who did not answer any of the expenditure
questions were also dropped from the dataset for purposes of the economic impact analysis.
The responses were then classified into three groups: 1) paid accommodations, 2) unpaid
accommodations, and 3) day-trippers. Those categorized as “paid” accommodations reported
staying in a hotel, motel, inn, bed and breakfast, resort, rented vacation home, private
campground or RV park, or a national, state, or county park. Individuals classified as staying in
“unpaid” accommodations reported staying with friends and/or family or in their own vacation
home. Day-trippers were respondents who indicated they did not overnight in the region.
An economic impact analysis has three components. These components are direct
impacts, indirect and induced impacts, and total impacts. Direct impacts trigger the initial
economic activity. In this study, the direct impact is spending by byway travelers. Byway
travelers are people using the byway solely because the byway exists and would not otherwise be
in the study area. Direct impacts can then be entered into input-output modeling software.
Input-output modeling software, in this study IMPLAN, traces the flow of goods and services
through the economy. Thus is it possible to quantify the ripple effects created by the new
spending in the study area economy. These ripples are called the indirect and induced effects.
Indirect effects are those associated with business-to-business spending. Induced effects are
Page 18
18
those associated with business-to-consumer spending. Total impacts equal direct plus indirect
and induced effects. The study area here includes Cass and Crow Wings counties.1
The direct impact for this study, as explained, is equal to expenditures by byway
travelers. Byway traveler spending is “new money” in the economy. In other words, these
dollars would not have been spent in the study area economy if not for the byway. The
following formula calculated byway traveler expenditures:
DI = STP * NTP
where:
DI = Direct Impact
STP = Spending per Travel Party during Trip = Average Expenditure per Travel Party * Length
of Trip
NTP = Number of Travel Parties = Total Number of Travelers * Percent Byway Travelers
Survey data provided an estimate of Average Expenditures per Travel Party, Length of
Trip, and Percent Byway Travelers. Percent byway travelers was calculated using the number of
respondents who indicated they “visited the region specifically because of the byway”. Total
Number of Travelers was calculated using the Minnesota Department of Transportation‟s Traffic
Volume Program data. Average annual daily traffic (AADT) counts were obtained for the length
of the byway. The traffic counts along each segment were then averaged to get an estimate of
total traffic flow on the byway. Heavy commercial annual daily traffic (HCADT) counts were
1 County-level IMPLAN data was used for Crow Wing county. Zip code data was used in Cass County to include
only the areas of the county intersected by the Paul Bunyan Scenic Byway.
Page 19
19
subtracted from the count to eliminate commercial traffic on the byway. Given average party
size was less than five people it was assumed one travel party per vehicle.
Results
Resident Respondents
Demographic profile & area experience
Residential respondents reported an average age of 55.52 years (SD=15.65), with a range
of 20 to 93 years (Table C2; Figure D1). Fall visitors were significantly older than summer
visitors. On average, residents had lived in the byway area for 22.55 years (SD=17.54) and in
Minnesota for an average of 46.50 years (SD=21.19). More than half of residents along the
byway were female (63.5%). The annual household income was approximately normally
distributed: nearly one-quarter (22.9%) reported earning between $25,000 and $49,999, almost
one-third of residents (29.9%) earned between $50,000 and $74,999; and over one-tenth (13.4%)
between $75,000 and $99,999.
More than a third (43%) of residents had two people in their travel party (Table C3).
Between 20 and 30 percent identified themselves as a couple (29.6%) or a family unit (22.6%).
Still, nearly a third of residents were alone (29.6%).
Byway awareness & tourism’s importance in the community
A vast majority of residents indicated that tourism was extremely important (81.6%) or
very important (14.8%) to the local area economy. Those employed in the tourism industry
(16.8 %) indicated tourism was significantly more important to the economy than those who
were not. However, less than one-third of residents indicated the byway greatly contributed to
local area tourism (30.7%; Figures D3 and D4).
Page 20
20
Eight of ten residents were aware of the byway: more than half of residents were very
much aware of its presence (58%) and a quarter were somewhat aware (28%). About 6% were
neither aware of this byway (5.7%) or of byways in general (6.7%; Figure D2).
Residents most frequently found out about the byway through word of mouth (39.1%),
signs (35.3%), a local newspaper (30.4%), or maps (21.3%; Table C5; Figure D8).
Importance of community attributes & byway impact on attributes
Of the fourteen community attributes respondents rated, all fourteen were identified as
important or extremely important by at least 50% or more of respondents (Table C6; Figures D5-
D7). Approximately 90% or more of residents rated two attributes as important: “Feeling safe”
(93.6%) and “natural area preservation” (90.1%). Between 75% and 89% of residents rated seven
of the fourteen community attributes as important: “quality recreation opportunities” (86.2%),
“good jobs for residents” (85.7%), “preservation of cultural/historical sites” (85.8%), and
“community beauty” (84.9%) “my property value” (82.3%), “a variety of community amenities”
(78.4%), and “a sense of area unity” (77.8%). Between 50% and 74% of residents rated five
community attributes as important: “traffic control” (74.8%), “a diverse economy” (72%),
“proper zoning” (68.1%), “plenty of fairs, festivals and museums,” (61.3%) and “good public
transportation” (50%).
Of these important attributes, respondents reported the byway contributed to eight of
them: “community beauty” (67.5%), natural area preservation” (64.7%), “quality recreation
opportunities” (66.3%), “preservation of cultural/historical sites” (61.8%), “variety of
community amenities” (57.5%), “traffic control” (51.1%), “plenty of fairs, festivals, and
museums (50.8%), and “a sense of area unity” (49.4%).
Page 21
21
Traveler Respondents
Demographic profile & area experience
Traveler respondents reported an average age of 52.47 years (SD=14.21), with a range of
18 to 87 years (Table C2; Figure D1). On average, travelers indicated they had visited the byway
region 2.83 times in the last 12 months (SD=2.63) and 4.83 times in the last 5 years (SD=2.81).
Travelers were rather evenly split between male and female (female 51.5%). Travelers indicated
higher incomes than residents. More than one-quarter of travelers (27.3%) earned between
$50,000 and $74,999, while 18.2% made more than$150,000; 15.7% reported earning between
$100,000 and $124,000, and 14.9% earned between $75,000 and $99,999.
Like residents, travelers most frequently had two people in their travel party (41.8%).
However, average group size was higher than residents as 13.4% of travelers had four people in
their party. About one-third of travelers were couples (30.2%) or family groups (33.1%).
Approximately one-tenth reported friends (12.2%) or family and friends (10.1%) as their travel
party type.
Travelers came to the region mostly by car, van, or truck (84.2%) but one-tenth arrived
by bicycle (10.8%; Table C3). Most visitors were overnight guests who stayed an average of
3.85 nights (SD=2.24): 27% in their own vacation home/condo/cabin, 20.6% with
friends/relatives, 15.1% in a resort, 11.9% in a hotel/motel/Inn/B&B, and 10.3% in a
National/state/county park or a private campground/RV park (9.5%). Ten percent of byway
visitors were day visitors (Table C4).
Page 22
22
Byway awareness & impact on visitation
Half of travelers were aware of the byway: 21% very and 31% somewhat aware.
Between fifteen and 20% were not aware of this byway (15.8%) or of byways in general (19.4%)
(Table C5; Figure D2). Travelers most frequently found out about the byway through word of
mouth (26.4%), a sign (18.6%), a map (14.3%), or a local newspaper (9.3%; Figure D8).
More than half of travelers claimed the byway had no effect on their travel plans (63%).
One of five travelers indicated they intend to visit again in order to experience the byway
(17.1%). One of ten travelers visited the region to use the byway (8.6%). Five percent visited
primarily because of the byway and two percent stayed longer in the region to experience the
byway (Table C5).
Economic Impact
Paid accommodations
On average, travel parties staying in paid accommodations spent $303 during the 24-
hours prior to the survey. Lodging accounts for 35% of the total and is the largest single
expenditure for travel parties. Those in more formal, paid accommodations spent more on dining
and drinking out than other types of travel parties. On average, travel parties in paid
accommodations had larger party sizes (5.3) than those in unpaid (3.4) and day-trippers (2.6).
Unpaid accommodations
Travel parties staying in unpaid accommodations spent an average of $173 during the
24-hour period with the largest single expenditure on dining and drinking out (29%). Not
surprisingly, those staying in informal unpaid accommodations tended to spend more on food
Page 23
23
stores. Those in unpaid accommodations stayed longer (4.6 nights) than those in paid
accommodations (4.0 nights).
Day-trippers
Finally, day-trippers spent $33 during the period. Day-trippers spent significantly less on
gasoline purchases. Day-trippers also reported no spending on arts/entertainment, recreational
use fees, services purchases, and other miscellaneous expenditures. There were a relatively low
number of day-trippers who provided answers to the expenditure questions and thus their
expenditures may be skewed downward. These averages are based on the respondents who
answered the expenditure questions and may not be equal to averages of the total sample (Table
C7).
Average annual daily traffic (AADT) minus heavy commercial average annual daily
traffic (HCAADT) along the byway averaged to 3,037 vehicles per day.2 Thus, the estimated
number of non-commercial vehicles along the byway in a given year is 1,108,505. Survey
results indicated that 41% of these vehicles were travelers (non-residents). Thus, an estimated
456,704 travelers drive the byway annually. Of those travelers, survey results indicated five
percent “visited the region specifically because of the byway”. Therefore, there were an
estimated 23,749 Paul Bunyan Scenic Byway travel parties in 2010.
Based on the responses of those who completed the expenditure section of the survey,
46% of those byway travelers stayed in paid accommodations, 43% in unpaid accommodations,
and 10% were day-trippers. Applying these percentages to the total number of byway travel
parties in 2010, there were an estimated 10,945 travel parties in paid accommodations, 10,325
parties in unpaid accommodations, and 2,478 day-trippers.
2 Average traffic was calculated on byway segments outside of the city limits.
Page 24
24
Given these parameters, total expenditures by byway travelers in 2010 was an estimated
$21.6 million with $13.2 million from travel parties in paid accommodations, $8.2 million from
parties in unpaid accommodations and $82,800 from day-trippers (as detailed in Table C8).
Of this $21.6 million, a significant portion was spent on retail items and on gasoline
purchases. Retail and gas purchases must be margined in the impact analysis. The process of
margining involves assigning a dollar value to all the individual components of a retail sale.
When a person makes a retail purchase, they pay a price that includes the raw cost of the item,
along with a mark-up for the retailer and a cost for transportation and storage of the product.
Typically, the item is not produced locally, so the only portion of the spending that benefits the
local economy is the mark-up to the retailer and perhaps a portion of the transportation and
storage expenditure. The input-output modeling software used for this analysis has an average
breakdown for each of these components and thereby performs margining calculations.
Given the margining calculations, the total direct impact of spending by Paul Bunyan
Scenic Byway travelers was $14.6 million in 2010. The modeling software estimates that 266
employees were paid $5.1 million in labor income to produce this output, as shown in Table C9.
It is important to note that the software treats one job as one job. Therefore, full-time, part-time,
and seasonal employees are all given equal weight in the model. The relatively low labor
income to employment ratio (19,000) indicates that the 266 jobs are likely to be part-time and/or
seasonal. Since these are mostly retail and service jobs in a tourism-dependent area of the state,
these findings seem likely (Table C9).
The total economic impact of Paul Bunyan Scenic Byway travelers was $21.2 million in
2010. This included 331 jobs and $7.3 million in labor income. As a result of spending by
Page 25
25
byway travelers “rippling” through the economy, an additional $3.4 million in sales and 32 jobs
were created as a result of business-to-business sales and $3.2 million in sales and 34 jobs from
consumer-to-business sales.
Sensitivity analysis
Certain assumptions, derived from the best data sources available, affect the results of the
analysis. Sensitivity analysis allows for the change a few of the key, established parameters to
see how the results may change. In this study, there are two assumptions that are worthy of
examination. First, the survey responses indicated that 41% of the respondents were travelers
and 59% residents. This may be high. Second, the results are based on only those survey
respondents who “visited the region specifically because of the byway”. These people fit the
strictest definition of byway travelers. However, an additional 11% of survey respondents
indicated the byway affected their travel plans either by making the trip longer or influencing the
route taken on their travels. An argument could be made that those travelers should also be
included in the analysis.
The first sensitivity analysis decreases the estimated number of travelers on the byway.
Our research indicates travelers generate 41% of the non-commercial traffic on the byway in a
given year. This percentage is derived from the intercept survey where people were at random
asked to participate in a survey and then to identify themselves as a resident or a traveler.
Although other research has demonstrated similar ratios (Davidson-Peterson Associates, 2004),
there are reasons to believe the ratio of travelers to residents may be high. There are three
reasons the intercept survey results may not accurately reflect the true proportion of residents to
travelers: 1) travelers may be more inclined to participate in the survey as they are typically on a
Page 26
26
vacation or trip, inclining them to have more time to stop and participate; 2) the survey sites
selected are traveler-oriented-Since scenic byways are an element of local tourism, many
establishments along them are tourist destinations; and finally, 3) the survey was conducted
during summer and early fall of 2010, which are heavy travel periods in the region.
Therefore, instead of assuming that 41% of non-commercial vehicles traveling on byway
roads are non-residents, the sensitivity analysis assumes that 25% are travelers. Under this new
assumption, the total economic impact of the Paul Bunyan Scenic Byway is $12.7 million,
including 199 jobs and $4.3 million in labor income (Table C10).
The second sensitivity analysis increases the number of byway travelers. In the current
analysis, five percent of travelers are considered byway travelers based on their response of
“visited the region specifically because of the byway”. Given the relatively small sample size,
the use of five percent is questionable. Previous research by Explore Minnesota Tourism (2008)
reported that 13% of visitors in the northcentral/west region selected “driving on designated
scenic byways” as one of their activities during a recent visit to the region. In the survey
conducted for this research, an additional 11% of respondents indicated the byway factored into
their travel plans.
Therefore, this sensitivity analysis assumes that 16% of travelers were byway travelers.
The assumptions of the first sensitivity analysis are further carried over to this sensitivity
analysis. Under this new assumption, the total economic impact of the Paul Bunyan Scenic
Byway is $38.2 million, including 560 jobs, and $13.4 million in labor income (Table C10).
Page 27
27
Discussion
A systematically selected sample of people on the byway revealed residents are more
aware of the byway than visitors, common byway information sources exist and opportunities
exist to enhance byway awareness and residents‟ perceptions of its contribution to quality of life.
In 2010, byway travelers added $21.2 million in sales, 331 jobs, and $7.2 million in labor income
to the region. This estimate is higher than a $12.7 million estimate resulting from a downward
adjustment to the non-resident portion of byway traffic, and lower than a $38.2 million estimate
resulting from an expanded definition of byway travelers to include all travelers for whom the
byway factored into their travel plans.
Intuitively, it makes sense that residents are more aware of the byway than visitors due to
their repeated exposure to information sources. Also, the finding that those employed in tourism
indicate it is more important than others mirrors past research (Lankford & Howard, 1993;
Harrill, 2004; McGehee & Andereck, 2004). However, a gap appears with residents connecting
the byway to local tourism and important community attributes. For, while residents identified
the importance of tourism to the local economy, the perceptions of the byway‟s contribution to
tourism was lower. Similarly, residents indicated the byway contributed to about half of the
community attributes they thought were important and were generally uncertain of the byway‟s
impacts on important community attributes. Given the byway‟s mission and apparent
contribution to various community attributes that residents value, implementing an integrated
and coordinated communication plan for residents seems an important step to make these
connections and increase awareness of byway contributions to both economy and community
attributes.
Page 28
28
Maximizing and enhancing the currently used information sources of signs, maps and
newspapers will be important to keep current and potential users informed and engaged with the
byway. Given the high use of internet among leisure travelers and the general public, its
relatively low use among byway visitors seems unusual. Understanding the place internet
information has for byway travelers is of interest for future research. Similarly, given the very
low identification of print and television as information sources, future use of these should be
carefully evaluated.
Economic impact analysis results reveal that while travelers are aware of the byway, the
byway still has a relatively limited influence on travel plans. More than half of the travelers
surveyed indicated the byway had no influence on their travel plans. Only 5 in 100 travelers said
the byway was their sole purpose for traveling to the region. Despite these relatively low
influence levels, byway travelers do contribute to the economy of the counties bisected by the
byway. Lower than desired sample sizes does affect confidence in the economic impact results,
but sensitivity analysis provides a framework for exploring that confidence.
Limitations & Future Opportunities
Like any study, limitations exist that may have affected the study. First, the data
collection period took place during the summer and early fall of 2010 – a heavy travel period for
travelers and convenience for data collection. As such, understanding the seasonal breadth of
visitors and their perceptions is limited. Second, only visitors on or near the byway were
questioned leaving out non-visitors who may still view the byway as important or be aware of
the byway. Identifying non-visitor opinions would therefore be of interest. Third, this work
assesses perceptions at one point in time and because perceptions change, assessing changes
Page 29
29
across seasons and time would be useful. Fourth, the project occurred during a time of
heightened fiscal constraints across the U.S. and Minnesota. Certainly it is possible that
expenditures are compacted due to the financial situation of 2010. Fifth, the propensity for
residents versus travelers to participate in the survey may have affected the ratio of residents to
travelers, which influences the economic impact study. Sixth, day-trippers appear to much less
likely than overnighters to complete the expenditure questions. This resulted in a low response
rate for day-trippers. Future research should look more closely at day-tripper expenditures.
Overall sample sizes were lower than desired which affects confidence in the results, particularly
with the economic impact analysis. Sensitivity analysis provides a method for exploring how the
sample sizes may have affected the analysis, but future research should strive for a larger sample
size. Finally, future research should explore additional ways to estimate the non-resident portion
of byway traffic.
Page 30
30
References
Allen, L. R., Long, P., & Perdue, R. (1988). The impact of tourism development on
residents perception of community life. Journal of Travel Research, 27, 16-21.
Besculides, M. L., & McCormick, P. (2002). Residents‟ perceptions of cultural benefits of
tourism. Annals of Tourism Research, 29, 303-319.
Caton, K., & Santos, C. (2007). Heritage tourism on Route 66: Deconstructing nostalgia.
Journal of Travel Research, 45, 371-386.
Crompton, J. L. (2006). Economic impact studies: Instruments for political shenanigans?
Journal of Travel Research, 45, 67-82.
Davidson-Peterson Associates. (2004). Economic impact study and marketing analysis of
Wisconsin’s national scenic byway: The great river road. Kennebunk, ME.
Dean Runyan Associates. (1990). Scenic byway development on the Oregon coast: Economic
benefits and user preferences. Prepared for the Oregon Department of Transportation
Portland, OR.
Deller, S., Tsung-Hsiu, & Marcouiller, D. (2001). The role of amenities and quality of life
in rural economic growth. American Journal of Agricultural Economics, 83, 352-365.
Dickenson, J., Robbins, D., & Fletcher, J. (2008). Representation of transport: A rural
destination analysis. Annals of Tourism Research, 36, 103-123.
Diener, E. (1995). A value based index for measuring national quality of life. Social
Indicators Research, 36, 107-127.
Draper, R., & Petty, K. (2001). The National Scenic Byways Program: On the road to
recreation. Journal of Physical Education, Recreation & Dance, 72(1), 27.
Page 31
31
Eby, D.W., & Molnar, L.J. (2002). Importance of scenic byways in route choice: a survey
of driving tourists in the United States. Transportation Research Part A, 36, 95–
106.
Explore Minnesota Tourism. (2008). Minnesota’s northcentral/west region – economic
impact and traveler profile. Research & Reports: Traveler Profiles. Explore Minnesota
Tourism Industry. Retrieved from http://www.exploreminnesota.com/explore-minnesota-
reports.
Explore Minnesota Tourism. (2010). Paul Bunyan Scenic Byway. Scenic Byways Online.
Retrieved from http://www.exploreminnesota.com/scenic-byways.
Gartner, W. C., & Erkkila, D. L. (2004). Attributes and amenities of highway systems
important to tourists. Journal of the Transportation Research Board, 1890, 97–105.
Gartner, W. C., Love, L. L., & Erkkila, D. L. (2002). Attributes and amenities of Minnesota’s
highway system that are important to tourists. Minnesota Department of Transportation,
No. MN/RC, 2003-2022.
Gustafson, K. (2009). Scenic byways and quality of life: An annotated bibliography. Draft
report. University of Minnesota Tourism Center, an Extension Community Economics
Program: St. Paul, MN.
Hallo, J. C., & Manning, R. E. (2009). Transportation and recreation: A case study of visitors
driving for pleasure at Acadia National Park. Journal of Transport Geography, 17, 491-
499.
Hampton, M. (2004). Heritage, local communities, and economic development. Annals of
Tourism Research, 32, 735-739.
Page 32
32
Harrill, R. (2004). Residents' attitudes toward tourism development: A literature review with
implications for tourism planning. Journal of Planning Literature, 18, 251-266.
Kelley, W. J. (2004). National scenic byways: Diversity contributes to success. Journal of the
Transportation Research Board, 21, 174-180. doi: 10.3141/1880-21
Kent, R. L. (1993). Attributes, features and reasons for enjoyment of scenic routes: A
comparison of experts, residents, and citizens. Landscape Research, 18, 92–102.
Kruger, L. (2006). Quality of life attributes spur growth in high amenity communities.
Western Land Use, (1) 1-5.
Lankford, S. V., & Howard, D. R. (1993). Developing a tourism impact attitude
scale. Annals of Tourism Research, 21, 121-139.
Li, Y. (2000). Geographical consciousness and tourism experience. Annals of Tourism
Research, 27, 863-883.
Marcouiller, D., Kwang-Koo, K. & Deller, S. (2004). Natural amenities, tourism, and
income distribution. Annals of Tourism Research, 31, 1031-1050.
McCool S. F., & Martin, S. R. (1994). Community attachment and attitudes towards tourism
development. Journal of Travel Research, 32, 29-34.
McGehee, N.G., & Andereck, K.L. (2004). Factors predicting rural resident„s support of tourism.
Journal of Travel Research, 43, 131-140.
National Scenic Byways Program (NSBP) (2010). NSBP online presents resources to the byway
community, information for better management, and collaboration of byway
organizations. Retrieved from http://www.bywaysonline.org/
Page 33
33
National Survey on Recreation and the Environment (NSRE). (2000–2002). The Interagency
National Survey Consortium. Coordinated by the USDA Forest Service, Recreation,
Wilderness, and Demographics Trends Research Group, Athens, GA and the Human
Dimensions Research Laboratory. University of Tennessee: Knoxville, TN.
Neal, J., Uysal, M. & Sirgy, M. J. (2007). The effect of tourism services on
travelers quality of life. Journal of Travel Research, 46, 154-163.
Petraglia, L., & Weisbrod, G. (2001). A review of impact studies related to scenic byway
designation. National Scenic Byways Resource Center: Duluth, MN.
Shrestha, S. K., Burns, R. C., Graefe, A. R., & Gaydos, K. R. (2009). Visitor use patterns and
satisfaction along the Rougue-Umpqua Scenic Byway, Oregon. Proceedings of the 2008
Northeastern Recreation Research Symposium, GTR-NRS-P-42, 283-291.
Sipes, J. L., James, A. P., Lindley, J., Campbell, T., Gragg, R., & Harbert, C. (1997).
Scenic byways: A review of processes, administration, and economic
impacts. Journal of the Transportation Research Board, 1599, 96–103.
Tuck, B. (2009a). The economic impact of scenic byways: A literature review of methods and
processes. Draft report. University of Minnesota Tourism Center, an Extension
Community Economics Program: St. Paul, MN.
Tuck, B. (2009b). The economic impact of investments in the intrinsic qualities of the Paul
Bunyan and Lake Country Scenic Byways. Draft report. University of Minnesota
Tourism Center. Extension Community Economics Program: St. Paul, MN.
Page 34
34
Unrau, H. D., & Williss, G. F. (1983). Expansion of the National Park Service in the 1930s: An
administrative history. In chapter four: New initiatives in the field of recreation and
recreational area development, national parkways. U.S. Department of the Interior,
National Park Service. Mount Olympus, NM: Denver Service Center. Retrieved
from http://www.nps.gov/history/history/online_books/unrau-williss/adhi4j.htm
U.S. Census Bureau. (2008). National Park Service visits and acreage by type of area: 2008.
Retrieved from
http://www.census.gov/compendia/statab/cats/arts_recreation_travel/travel_and_tourism.
html
U.S. Department of the Interior, National Park Service. (1999). Transportation planning
guidebook. Washington, D.C.
U.S. Department of Transportation. (1998). Transportation equity act for the 21st century: A
summary-protecting our environment. Retrieved from
www.fhwa.dot.gov/tea21/sumenvir.htm#rtp.
U.S. Department of Transportation, Bureau of Transportation Statistics (2010). National
transportation statistics. Research and Innovative Technology Administration. Retrieved
from www.bts.gov/publications/national_transportation_statistics/pdf/entire.pdf
U.S. Department of Transportation, Federal Highway Administration. (1991a). National scenic
byways legislation: Intermodal surface transportation efficiency act of 1991. U.S.
Code, Title 23, Section 162. Washington, DC.
U.S. Department of Transportation, Federal Highway Administration. (1991b). National scenic
byways study. Washington, DC.
Page 35
35
U.S. Department of Transportation, Federal Highway Administration. (2005c). 2005 traveler
opinion and perception (TOP) survey. Washington, DC. Retrieved from
http://www.fhwa.dot.gov/reports/traveleropinions/index.htm
U.S. Department of Transportation, Federal Highway Administration. (2005d). Safe,
accountable, flexible, efficient transportation equity act: A legacy for users
(SAFETEA-LU). Washington, DC. Retrieved from
http://www.fhwa.dot.gov/safetealu/safetea-lu_summary.pdf.
Wang, A., & Pfister, R. (2002). Resident„s attitudes toward tourism and perceived
personal benefits in a rural community. Journal of Travel Research, 47, 84-93.
Page 36
36
Appendices
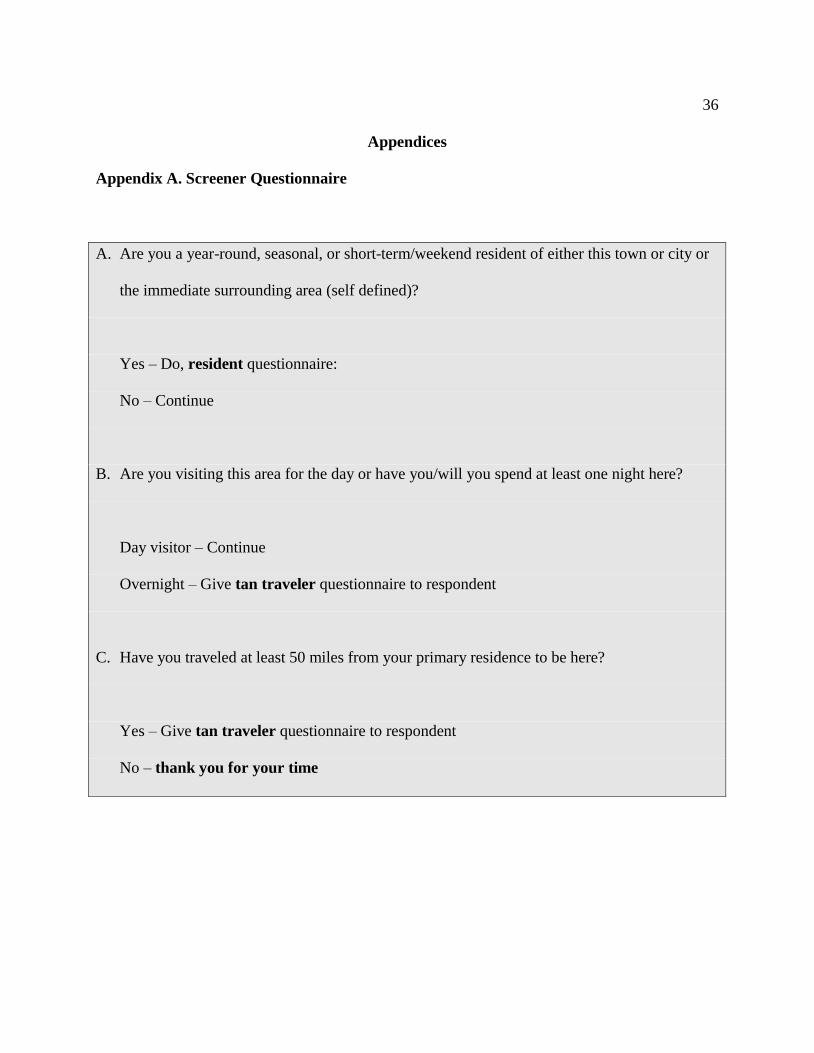
Appendix A. Screener Questionnaire
A. Are you a year-round, seasonal, or short-term/weekend resident of either this town or city or
the immediate surrounding area (self defined)?
Yes – Do, resident questionnaire:
No – Continue
B. Are you visiting this area for the day or have you/will you spend at least one night here?
Day visitor – Continue
Overnight – Give tan traveler questionnaire to respondent
C. Have you traveled at least 50 miles from your primary residence to be here?
Yes – Give tan traveler questionnaire to respondent
No – thank you for your time
Page 37
37
Appendix B. Survey Instruments
Resident Questionnaire
Page 39
39
Traveler Questionnaire
Page 41
41
Appendix C. List of Tables
Table 1
Percent of Surveys Completed by Season & Type of Site among Byway Residents & Travelers in
2010
Season/Site Summer1 Fall
2
Residents3
Travelers4
Residents3
Travelers4
% (n) % (n)
Events/festivals 34.2 (38) 48.1 (50) 62.1 (36) 85.7 (12)
Attractions 27.0 (30) 21.2 (22) - -
Restaurant/bar 16.2 (18) 15.4 (16) 20.7 (12) 14.3 (2)
Accommodations 14.4 (16) 5.8 (6) 1.7 (1) -
Retail 8.1 (9) 9.6 (10) 15.5 (9) -
Total 100 (111) 100 (104) 100 (58) 100 (14) 1Summer season June-August
2Fall season September -October
3Residents defined as year-round, seasonal, or short-term/weekend residents of the town or city
in the immediate surrounding area. 4Travelers defined as visiting the area for the day or have/will have spent at least one night in the
immediate surrounding area; or visitor has traveled at least 50 miles from primary residence to
be in the immediate surrounding area.
Page 42
42
Table 2
Demographic Profile of Scenic Byway Visitors during Summer & Fall 2010
Residents1
Travelers2
% (n) % (n)
Gender
Female 63.5 (122) 51.5 (70)
Male 36.5 (70) 48.5 (68)
Total 100 (192) 100 (138)
Age (years; Residents x̄ = 55.5, S.D.=15.64 ; Travelers x̄ = 52.5, S.D. 14.21)
18-30 3.8 (7) 8.8 (12)
31-40 14.0 (26) 6.6 (9)
41-50 24.2 (45) 29.9 (41)
51-60 19.4 (36) 25.5 (35)
61-70 19.9 (37) 19.0 (26)
>71 18.8 (35) 10.2 (14)
Total 100 (186) 100 (137)
Income
<$25,000 8.9 (14) 5.0 (6)
$25,000-49,999 22.9 (36) 12.4 (15)
$50,000-74,999 29.9 (47) 27.3 (33)
$75,000-99,999 13.4 (21) 14.9 (18)
$100,000-124,999 11.5 (18) 15.7 (19)
$125,000-149,999 2.5 (4) 6.6 (8)
> $150,000 10.8 (17) 18.2 (22)
Total 100 (157) 100 (121) 1Residents defined as year-round, seasonal, or short-term/weekend residents of the town or city
in the immediate surrounding area. 2Travelers defined as visiting the area for the day or have/will have spent at least one night in the
immediate surrounding area; or visitor has traveled at least 50 miles from primary residence to
be in the immediate surrounding area.
Page 43
43
Table 3
Visitation along the Byway Region by Season in 2010
Season/Attribute Summer1 Fall
2
Residents3 Travelers4 Residents3 Travelers4
% (n) % (n)
Travel Party
Myself 36.2 (42) 9.3(10) 18.6 (13) 12.5 (4)
Couple 27.6 (32) 29.0 (31) 32.9 (23) 34.4 (11)
Family 21.6 (25) 37.4 (40) 24.3 (17) 18.8 (6)
Friends 2.6 (3) 8.4 (9) 5.7 (4) 25.0 (8)
Family & friends 7.8 (9) 10.3 (11) 15.7 (11) 9.4 (3)
Tour group 1.7 (2) 4.7 (5) - -
Other 2.6 (3) 0.9 (1) 2.9 (2) -
Total 100 (n=116 ) 100 (n=107) 100 (n=70) 100 (n=32)
Primary Transportation
Car, van, truck - 80.4 (86) - 96.9 (31)
Bicycle - 14.0 (15) - 0
RV/camper - 4.7 (5) - 0
Motorcycle - 0.9 (1) - 0
Airplane - 0 - 3.1 (1)
Hiking/foot - 0 - 0
Boat - 0 - 0
Other - 0 - 0
Total - 100 (n=107) - 100 (n=32) 1Summer season June-August 2Fall season September -October
3Residents defined as year-round, seasonal, or short-term/weekend residents of the town or city
in the immediate surrounding area. 4Travelers defined as visiting the area for the day or have/will have spent at least one night in the
immediate surrounding area; or visitor has traveled at least 50 miles from primary residence to be in the immediate surrounding area.
Page 44
44
Table 4
Length, Frequency of Visit, & Lodging by Season among Travelers1 in 2010
Season/Attribute Summer2 Fall
3
Mean (SD) % (n) Mean (SD) % (n)
Length & frequency
Daytrip - 7.1 (7) - 20.7 (6)
Overnight - 92.9 (91) - 79.3 (23)
Number of nights spent 4.08 (2.33) - 2.82 (1.38) -
Number of visits in last 12 months
(Summer x̄ =2.54, Mdn =1.00, S.D.=2.51; Fall x̄ = 3.77, Mdn= 3.00, S.D. 2.81)
1 visit - 53.5 (38) - 27.3 (6)
2 - 19.7 (14) - 18.2 (4)
3 - 5.6 (4) - 9.1 (2)
4 - 4.2 (3) - 9.1 (2)
5 (+) visits - 16.8 (12) - 36.3 (8)
Number of visits in last 5 years (Summer x̄ =5.06, Mdn = 5.00, S.D.=2.85; Fall x̄ = 3.14, Mdn=2.00, S.D. 1.77)
1 visit - 5.7 (3) - 14.3 (1)
2 - 15.1 (8) - 42.9 (3)
3 - 15.1 (8) - -
4 - 5.7 (3) - -
5 (+) visits - 58.6 (31) - 42.9 (3)
Lodging
Own vacation
home/condo/cabin - 26.0 (26) - 30.8 (8)
Resort - 17.0 (17) - 7.7 (2)
With friends/relative - 16.0 (16) - 38.5 (10)
National/state/county
park - 13.0 (13) - 0
Hotel/motel/Inn/B&B - 11.0 (11) - 15.4 (4)
Private campground/RV
park - 11.0 (11) - 3.8 (1)
Rent home/condo/cabin - 6.0 (6) - 3.8 (1) 1Travelers defined as visiting the area for the day or have/will have spent at least one night in the
immediate surrounding area; or visitor has traveled at least 50 miles from primary residence to
be in the immediate surrounding area. 2Summer season June-August
3Fall season September-October
Page 45
45
Table 5
Awareness, Information Sources & Impact on Trip among Byway Residents & Travelers in 2010
Residents1 Travelers
2
% (n) % (n)
Awareness of this and other byways
Very much aware 58.0 (112) 20.9 (29)
Somewhat aware 28.0 (54) 30.9 (43)
Not aware of byways 6.7 (13) 19.4 (27)
Not aware of this byway 5.7 (11) 15.8 (22)
Was aware, but forgot 1.6 (3) 4.3 (6)
Learned during trip - 8.6 (12)
Information source
Word of mouth 39.1 (81) 26.4 (37)
Sign 35.3 (73) 18.6 (26)
Local newspaper 30.4 (63) 9.3 (13)
Map 21.3 (44) 14.3 (20)
State/local tourism website 7.2 (15) 5.0 (7)
National/state program guide 6.3 (13) 4.3 (6)
Lives near byway 6.3 (13) -
Direct mail/email 3.4 (7) 0
Print/TV ad 2.9 (6) 2.9 (4)
National/state program website 2.4 (5) 2.1 (3)
Scenic Byway impact on visit
No effect - 63.6 (89)
Intend to visit again because of byway - 17.1 (24)
Traveling through to somewhere else to
use/because of byway - 8.6 (12)
Visited because of byway - 5.0 (7)
Stayed longer in region to experience
byway - 2.1 (3)
1Residents defined as year-round, seasonal, or short-term/weekend residents of the town or city
in the immediate surrounding area. 2Travelers defined as visiting the area for the day or have/will have spent at least one night in the
immediate surrounding area; or visitor has traveled at least 50 miles from primary residence to
be in the immediate surrounding area.
Page 46
46
Table 6
Resident Assessment of the Importance of & Byway Contribution to Various Community
Attributes in 2010
Attributes (n = 188-191) Importance of
attribute
Byway impact on
attribute
Mean
1 S.D. Mean
2 S.D.
Feeling safe 4.64 0.63 3.52 0.83
Natural area preservation 4.53 0.70 3.95 0.97
Quality recreation opportunities 4.43 0.76 3.99 0.90
Good jobs for residents 4.42 0.85 3.55 0.87
Preservation of cultural/historical sites 4.37 0.84 3.92 0.91
Community beauty 4.32 0.77 3.94 0.90
Property value 4.32 0.94 3.65 0.80
Traffic control 4.13 0.90 3.67 0.92
Sense of area unity 4.12 0.86 3.62 0.86
Variety of community amenities 4.07 0.95 3.74 0.79
Diverse economy 3.97 0.97 3.62 0.78
Proper zoning 3.97 0.98 3.59 0.87
Plenty of fairs, festivals & museums 3.84 0.99 3.69 0.93
Good public transportation 3.55 1.22 3.47 0.86
1Rated on a scale where 1 = not at all important and 5 = extremely important 2Rated on a scale where 1 = Greatly decreases, 2 = decreases, 3 = unsure, 4 = increases, and 5 =
greatly increases
Page 47
47
Table 7
Paul Bunyan: Expenditures among Travelers1 per Travel Party per 24 Hour Period2
Paid Accommodations
Unpaid Accommodations Daytrippers
Arts/Entertainment 3.96 7.72 0.00
Food Stores 39.06 44.80 1.67
Lodging 107.00 14.20 0.00
Recreational Use Fees 8.11 4.42 0.00
Services Purchases 1.32 0.70 0.00
Dining and Drinking Out 65.98 50.60 11.33
Gas Stations 31.42 35.24 8.75
Other Transportation 2.83 0.00 5.00
Retail Purchases 27.92 11.84 5.83
Souvenirs 9.87 1.50 0.83
Other 5.75 2.16 0.00
Total 303.22 173.18 33.42
Average Length of Stay 4.0 4.6 0
Average Travel Party Size 5.3 3.4 2.6
1Travelers defined as visiting the area for the day or have/will have spent at least one night in the
immediate surrounding area; or visitor has traveled at least 50 miles from primary residence to
be in the immediate surrounding area. 2Average length of stay and average travel party size based on those who responded to the
expenditure questions.
Page 48
48
Table 8
Paul Bunyan: Total Expenditures
Paid Nights Unpaid Nights Daytrips Total
Number of Travelers
10,945 10,325 2,478 23,749
Arts/Entertainment $ 173,468 $ 366,679 $ -
Food Stores $ 1,709,900 $ 2,127,876 $ 4,130
Lodging $ 4,684,465 $ 674,461 $ -
Recreational Use
Fees $ 355,056 $ 209,938 $ -
Services Purchases $ 57,823 $ 33,248 $ -
Dining and
Drinking Out $ 2,888,657 $ 2,403,359 $ 28,085
Gas Stations $ 1,375,354 $ 1,673,802 $ 21,684
Other
Transportation $ 123,906 $ - $ 12,391
Retail Purchases $ 1,222,537 $ 562,367 $ 14,456
Souvenirs $ 432,018 $ 71,246 $ 2,065
Other $ 251,942 $ 102,594 $ -
Total $ 13,275,127 $ 8,225,569 $ 82,810 $21,583,506
Page 49
49
Table 9
Economic Impact of Paul Bunyan Scenic Byway in Cass & Crow Wing Counties, 2010
Direct Indirect Induced Total
Output $14.6 million $3.4 million $3.2 million $21.2 million
Employment 266 32 34 331
Labor Income $5.1 million $1.1 million $1.1 million $7.3 million
Page 50
50
Table 10
Economic Impact of Paul Bunyan Scenic Byway in Crow Wing & Cass Counties, 2010:
Sensitivity Analysis
Direct Total
Sensitivity Analysis 1
Output $8.8 million $12.7 million
Employment 159 199
Labor Income $3.0 million $4.3 million
Sensitivity Analysis 2
Output $26.2 million $38.2 million
Employment 479 560
Labor Income $9.2 million $13.7 million
Page 51
51
Appendix D. List of Figures
Figure 1. Generational differences1 among residents2 and travelers3 along the byway in 2010
(total n = 337).
1Generational groups by age category (years old): Gen-Y= 18-32; Gen-X=33-44; Baby
Boomers=45-63; Silent=64-72; G.I.=73 (+) 2Residents defined as year-round, seasonal, or short-term/weekend residents of the town or city
in the immediate surrounding area. 3Travelers defined as visiting the area for the day or have/will have spent at least one night in the
immediate surrounding area; or visitor has traveled at least 50 miles from primary residence to
be in the immediate surrounding area.
0
10
20
30
40
50
60
70
80
90
100
Residents (n=198) Travelers (n=139)
Per
cen
t (%
)
Generation-Y
Generation-X
Baby Boomers
Silent Generation
G.I. Generation
Page 52
52
Figure 2. Level of byway awareness among residents1 & travelers
2 in 2010 (total n = 337).
1Residents defined as year-round, seasonal, or short-term/weekend residents of the town or city
in the immediate surrounding area. 2Travelers defined as visiting the area for the day or have/will have spent at least one night in the
immediate surrounding area; or visitor has traveled at least 50 miles from primary residence to
be in the immediate surrounding area.
Page 53
53
Figure 3. Level of perceived importance1 of local area tourism among residents
2 (n=198) in 2010.
1Rated on a scale where 1 = not at all important and 5 = Extremely important 2Residents (n=198) defined as year-round, seasonal, or short-term/weekend residents of the town
or city in the immediate surrounding area.
Page 54
54
Figure 4. Level of perceived byway contribution1 to local area tourism among residents
2 (n=198)
in 2010.
1Rated on a scale where 1 = not at all important, 2 = Somewhat, 3 = Is important, 4 = A lot, and 5
= To a great extent; 0 = Do not know (not shown (4.2%)) 2Residents (n=198) defined as year-round, seasonal, or short-term/weekend residents of the town
or city in the immediate surrounding area.
0
10
20
30
40
50
60
70
80
90
100P
erce
nt (%
)
Not at all
Somewhat important
Is important
A lot
To a great extent
Do not know
Page 55
55
Figure 5. Resident‟s1 perceptions of importance2 of and byway contribution3 to community
attributes in 2010.
1Residents (n=198) defined as year-round, seasonal, or short-term/weekend residents of the town
or city in the immediate surrounding area. 2Rated on a scale where 1 = not at all important and 5 = extremely important 3Rated on a scale where 1 = Greatly decreases, 2 = decreases, 3 = unsure, 4 = increases, and 5 =
greatly increases
Page 56
56
Figure 6. Resident‟s1 perceptions of importance2 of and byway contribution3 to community
attributes in 2010.
1Residents (n=198) defined as year-round, seasonal, or short-term/weekend residents of the town
or city in the immediate surrounding area. 2Rated on a scale where 1 = not at all important and 5 = extremely important 3Rated on a scale where 1 = Greatly decreases, 2 = decreases, 3 = unsure, 4 = increases, and 5 =
greatly increases
Page 57
57
Figure 7. Resident‟s1 perceptions of importance
2 of and byway contribution
3 to community
attributes in 2010. 1Residents (n=198) defined as year-round, seasonal, or short-term/weekend residents of the town
or city in the immediate surrounding area. 2Rated on a scale where 1 = not at all important and 5 = extremely important
3Rated on a scale where 1 = Greatly decreases, 2 = decreases, 3 = unsure, 4 = increases, and 5 =
greatly increases
Page 58
58
0
10
20
30
40
50
60
70
80
90
100
Residents (n=198) Travelers (n=139)
Per
cen
t (%
)
Word of mouth
Sign
Newspaper
Map
Other sources
Figure 8. Byway information sources1 among residents2 & travelers3 in 2010 (total n = 337).
1Other sources are less than 10% for both residents & travelers:
State/local tourism website; Direct mail/email; Print/TV ad; National/state program website;
National/state program guide 2Residents (n=198) defined as year-round, seasonal, or short-term/weekend residents of the town
or city in the immediate surrounding area. 3Travelers (n=139) defined as visiting the area for the day or have/will have spent at least one
night in the immediate surrounding area; or visitor has traveled at least 50 miles from primary
residence to be in the immediate surrounding area.
Page 59
59
Appendix E. At a Glance Summary