24
Europe’s View Of China -- A Triangular One Comments By J. Paul Horne Independent International Market Economist To Global Interdependence Center Philadelphia, 9 November 2005
| Date post: | 08-Mar-2016 |
| Category: |
Documents |
| Upload: | global-interdependence-center |
| View: | 231 times |
| Download: | 1 times |
Europe’s View Of China -- A Triangular One
Comments By
J. Paul HorneIndependent International Market Economist
To
Global Interdependence CenterPhiladelphia, 9 November 2005
2
China is for Europe aTriangular not Bilateral Problem
• Most Chinese-EU issues involve key U.S. interests and reactions
• Arms, trade, out-sourcing, energy supplies, capital flows, interest rates, FX – have vital implications for all 3
• EU defense, fiscal, labor, social policies increasing influenced by China
• EU’s own problems make dealing with CH difficult, and often earns US enmity
3
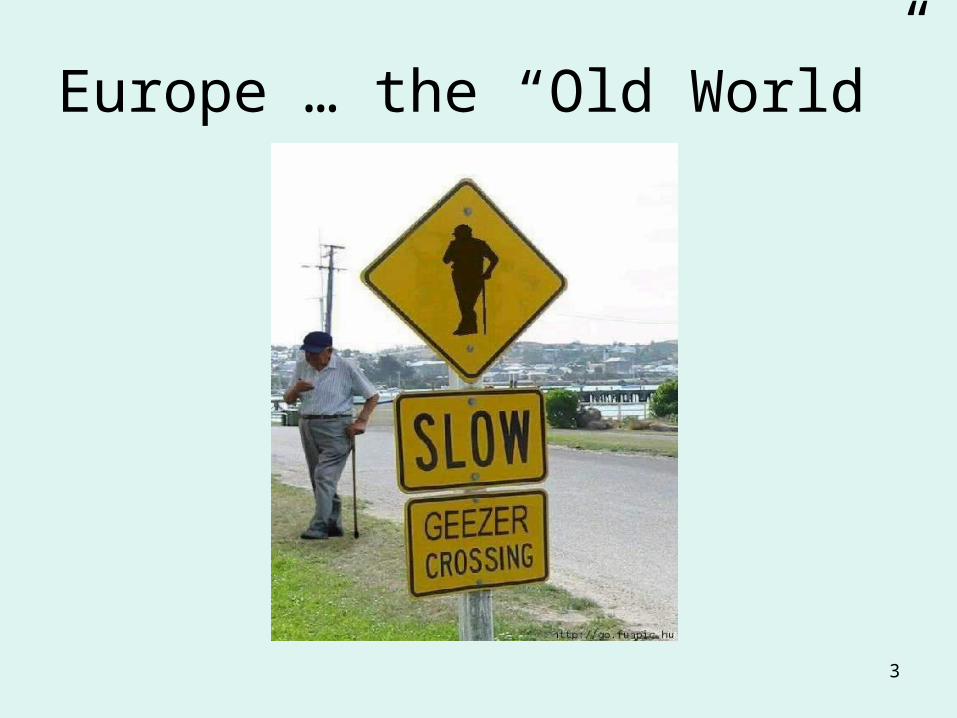
Europe … the “Old World”
4
EU’s Medium-Term Challenges• Economic growth of
1.5% to 2.% to 2007• UR stabilizes at 9%• EUR deficit = 3.2%• EUR slips vs USD• Biz confidence up if
Merkel produces• EU budget squabbles• Trade protectionism
sentiment rises
• No new constitution until French vote 07
• Accession talk delay• EU process slows• Politics move right• Anti-immigrant trend
worsens• Disputes with U.S.
grow in number, tone
5
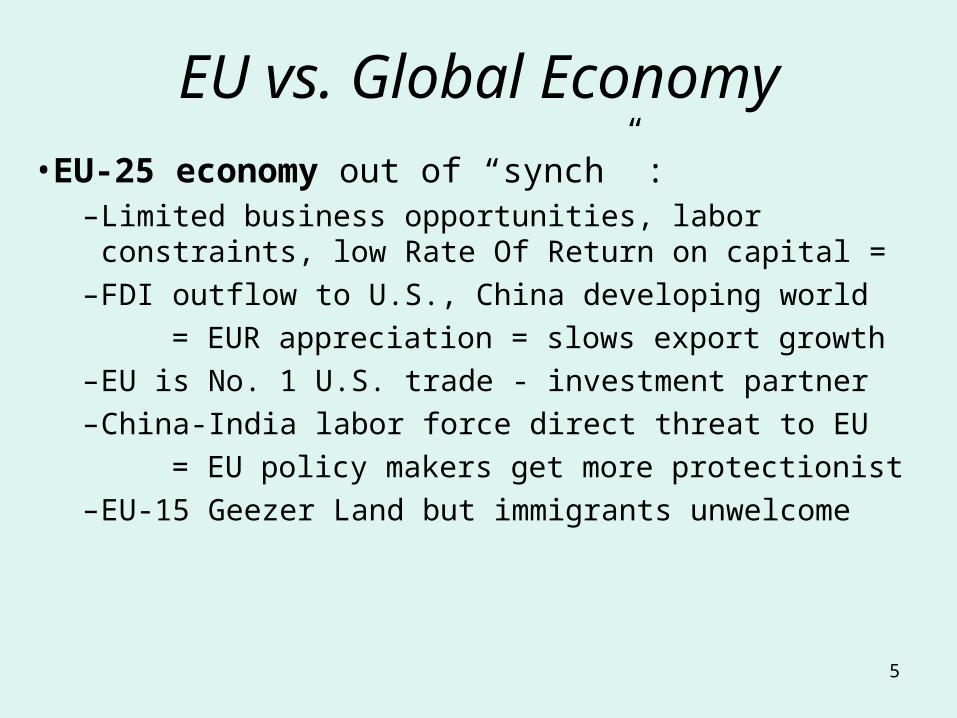
EU vs. Global Economy• EU-25 economy out of “synch” :
–Limited business opportunities, labor constraints, low Rate Of Return on capital =
–FDI outflow to U.S., China developing world = EUR appreciation = slows export growth–EU is No. 1 U.S. trade - investment partner–China-India labor force direct threat to EU = EU policy makers get more protectionist–EU-15 Geezer Land but immigrants unwelcome
6
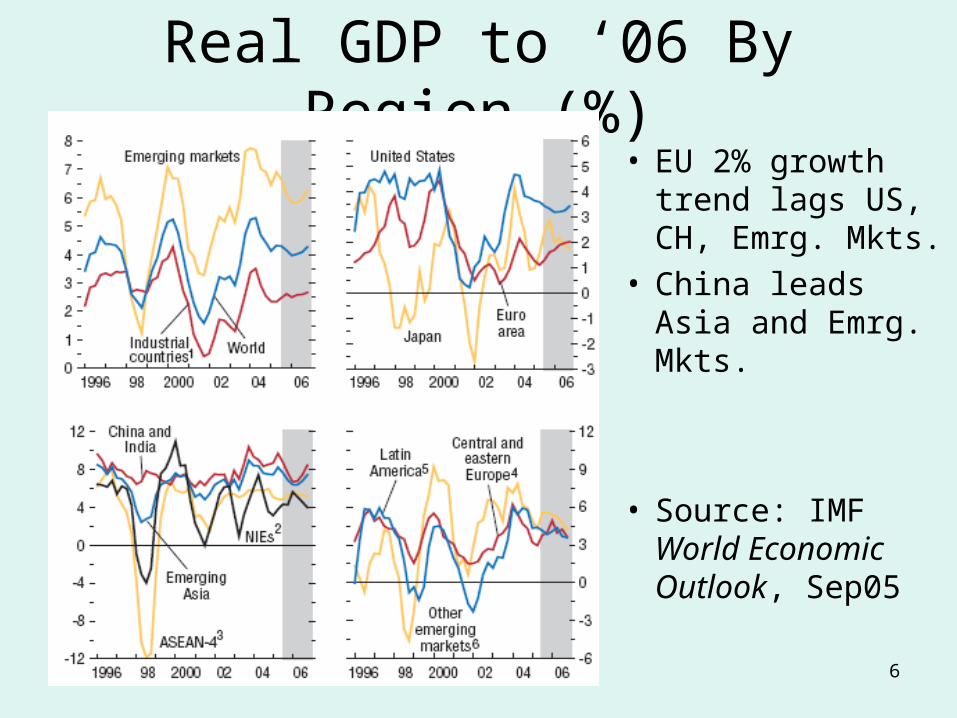
Real GDP to ‘06 By Region (%)• EU 2% growth
trend lags US, CH, Emrg. Mkts.
• China leads Asia and Emrg. Mkts.
• Source: IMF World Economic Outlook, Sep05
7
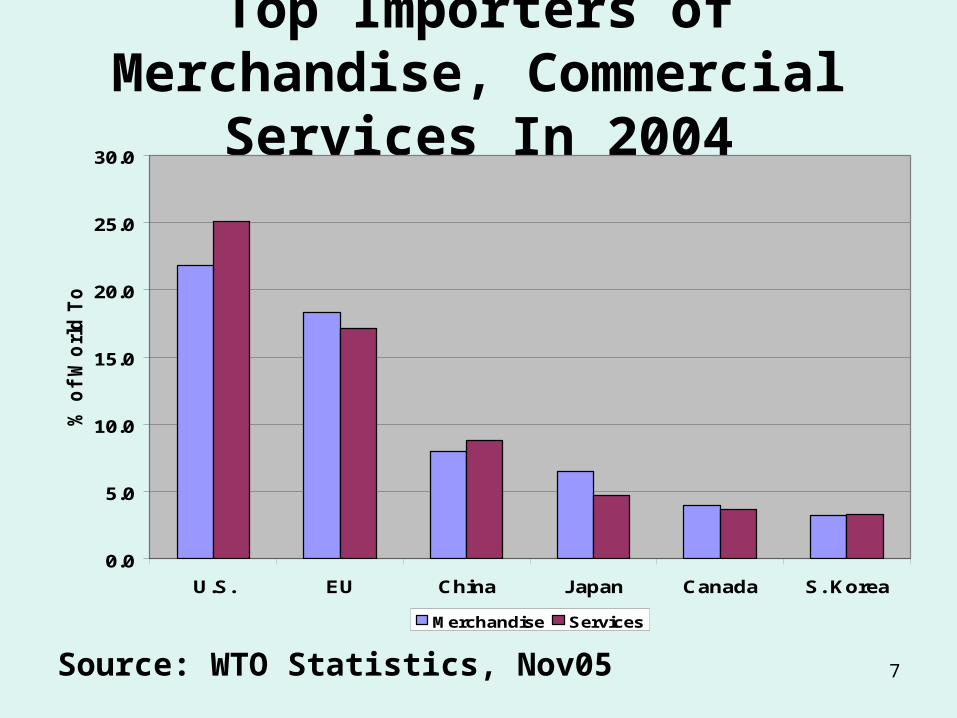
Top Importers of Merchandise, Commercial Services In 2004
Source: WTO Statistics, Nov05
0.0
5.0
10.0
15.0
20.0
25.0
30.0
U.S. EU China Japan Canada S. Korea
% o
f Wor
ld T
otal
Merchandise Services
8
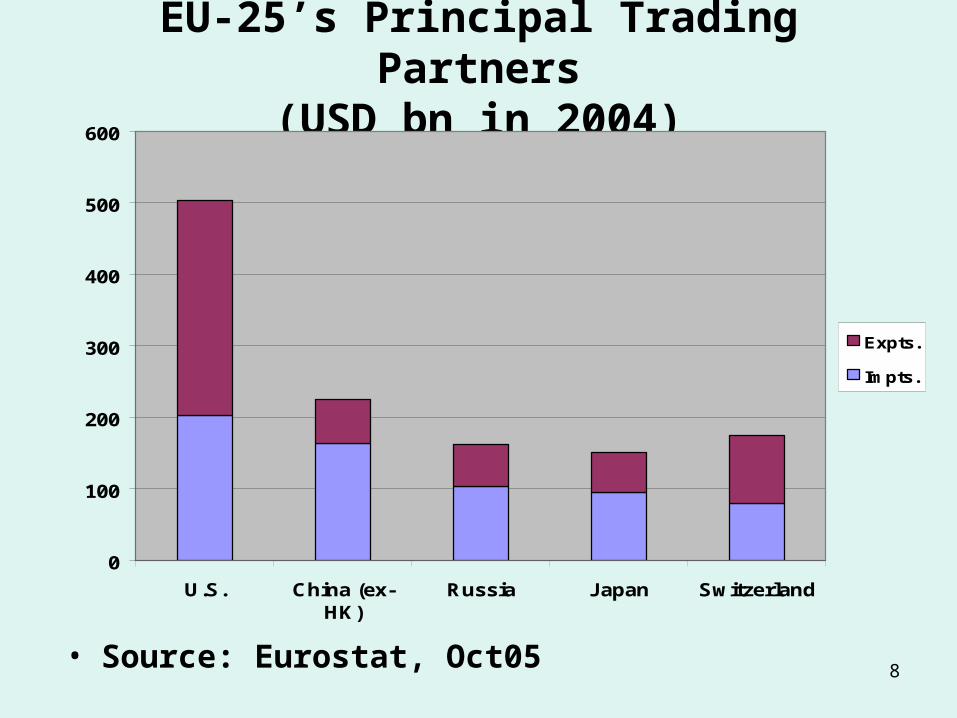
EU-25’s Principal Trading Partners(USD bn in 2004)
• Source: Eurostat, Oct05
0
100
200
300
400
500
600
U.S. China (ex-HK)
Russia Japan Switzerland
Expts.
Impts.
9
Europe’s Competitors For Oil
• Source: The Economist, 27aug05
10
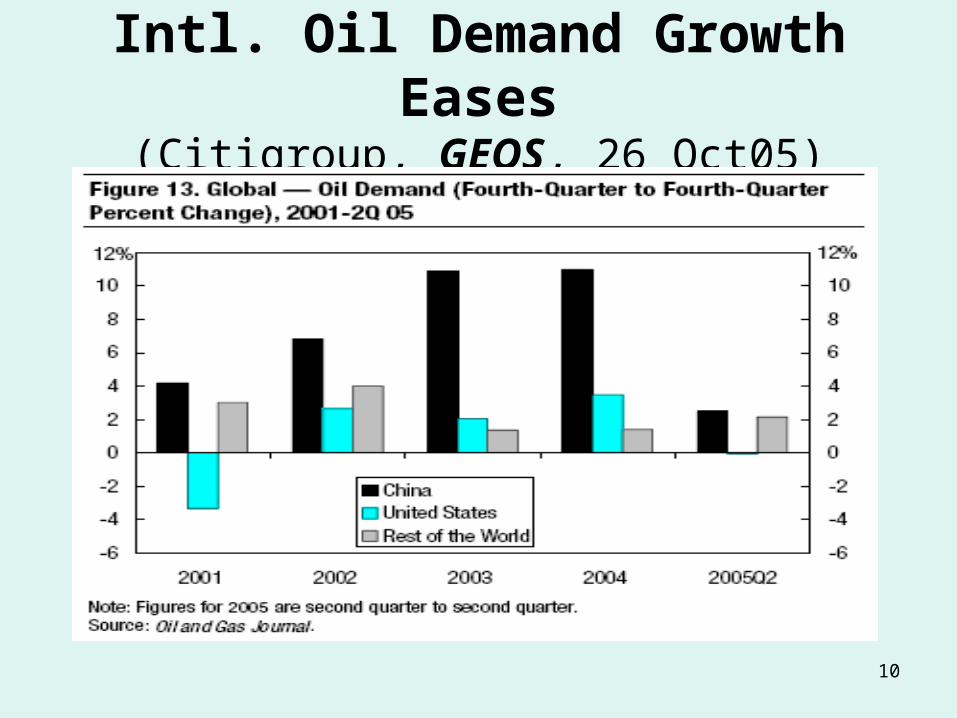
Intl. Oil Demand Growth Eases(Citigroup, GEOS, 26 Oct05)
11
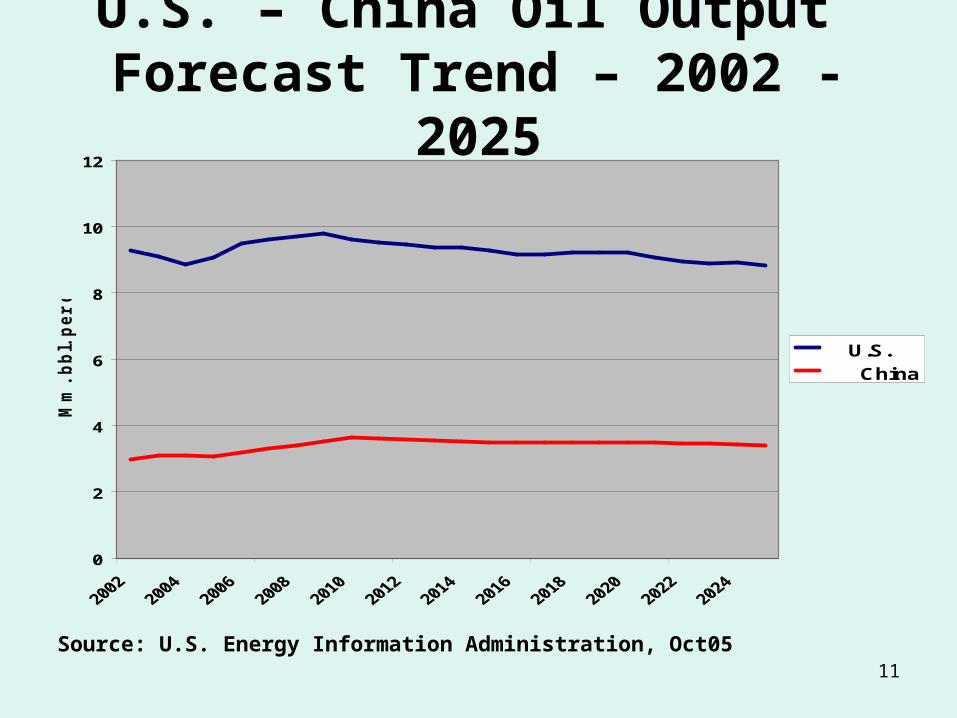
U.S. – China Oil Output Forecast Trend – 2002 - 2025
Source: U.S. Energy Information Administration, Oct05
0
2
4
6
8
10
12
Mm
. bbl
. per
day
U.S. China
12
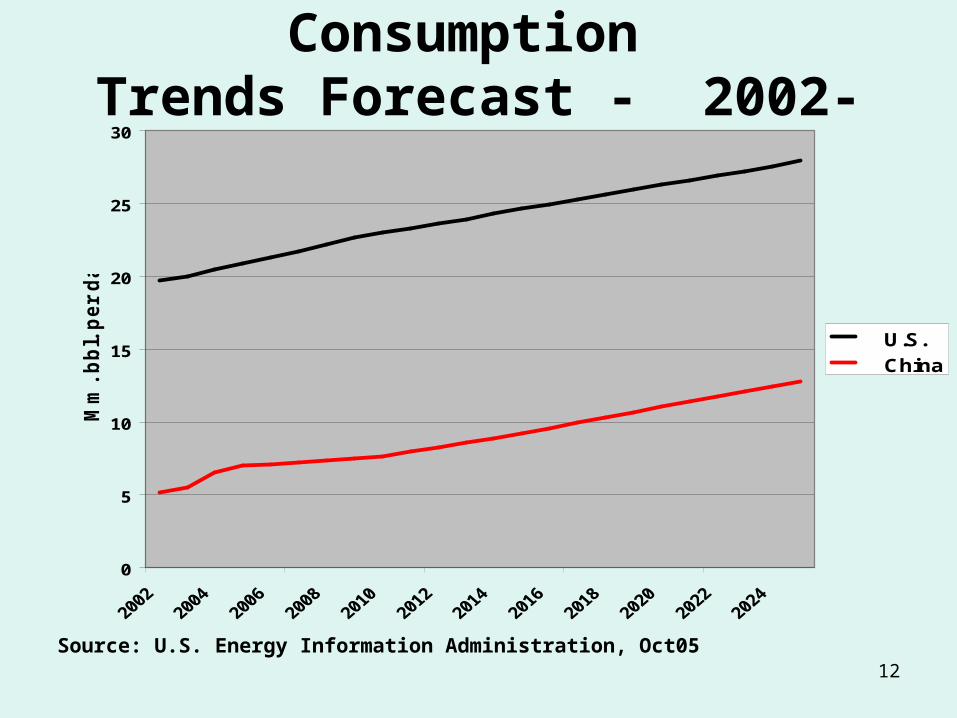
U.S. – China Oil Consumption Trends Forecast - 2002- 2025
Source: U.S. Energy Information Administration, Oct05
0
5
10
15
20
25
30
Mm
. bbl
. per
day
U.S. China
13
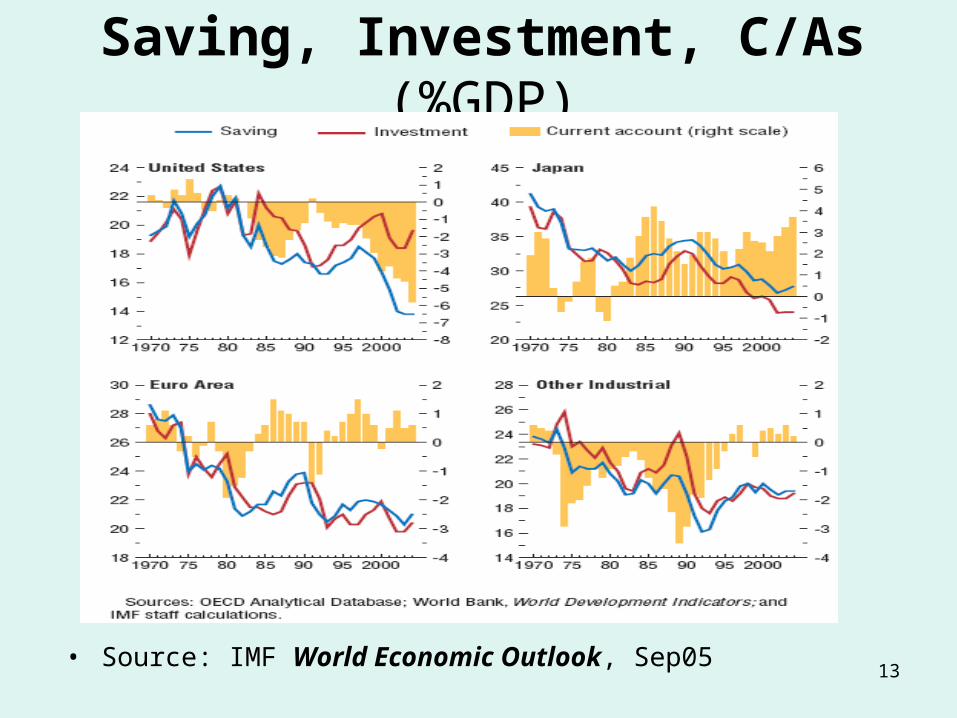
Saving, Investment, C/As (%GDP)
• Source: IMF World Economic Outlook, Sep05
14
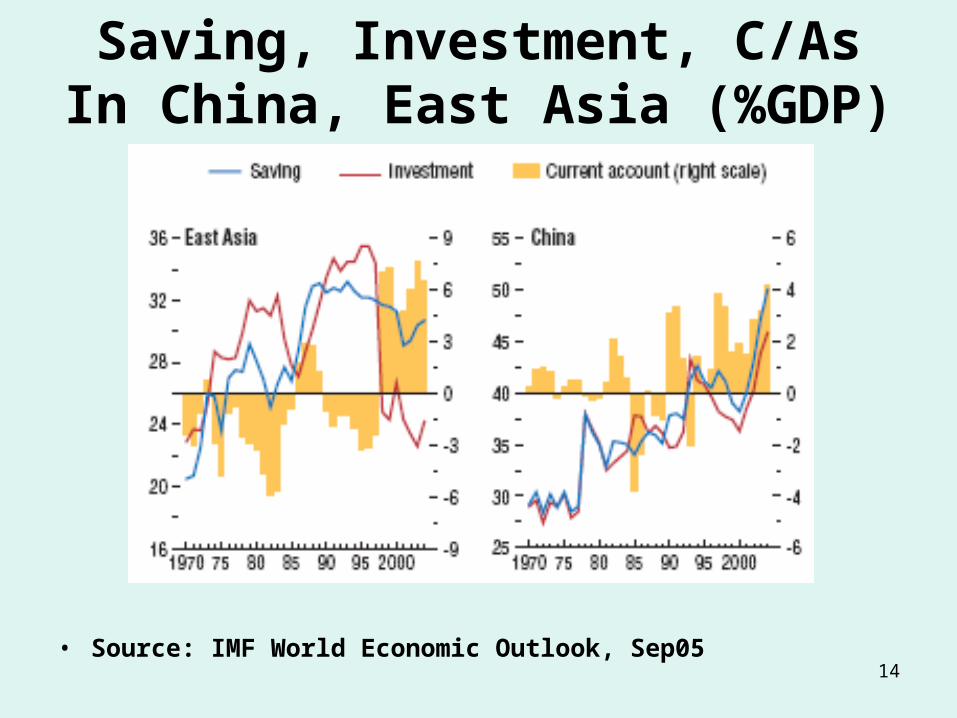
Saving, Investment, C/As In China, East Asia (%GDP)
• Source: IMF World Economic Outlook, Sep05
15
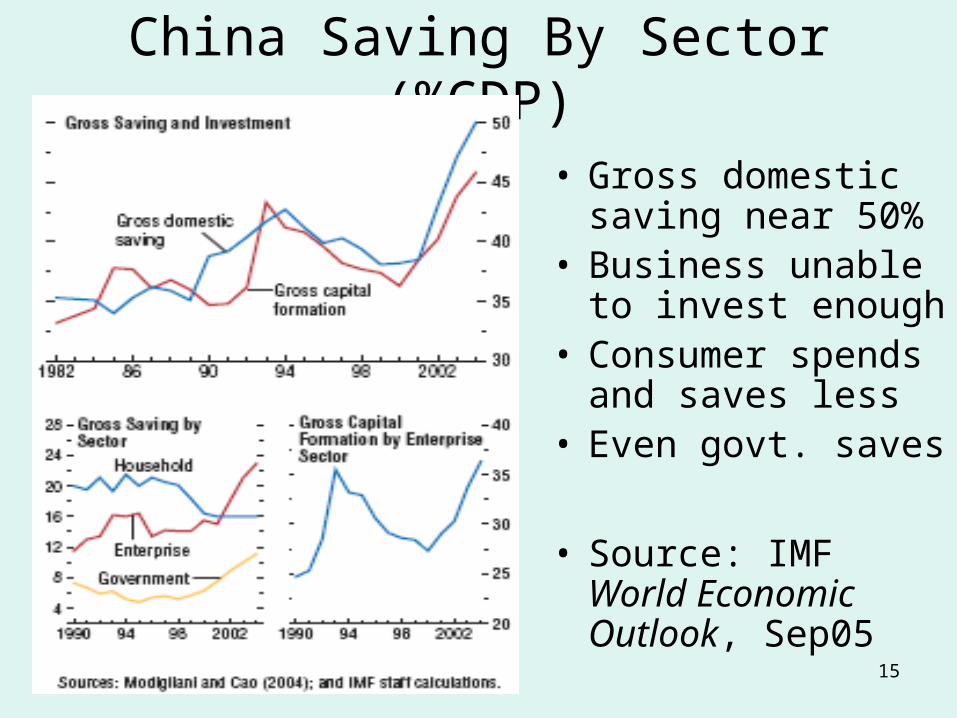
China Saving By Sector (%GDP)
• Gross domestic saving near 50%
• Business unable to invest enough
• Consumer spends and saves less
• Even govt. saves
• Source: IMF World Economic Outlook, Sep05
16
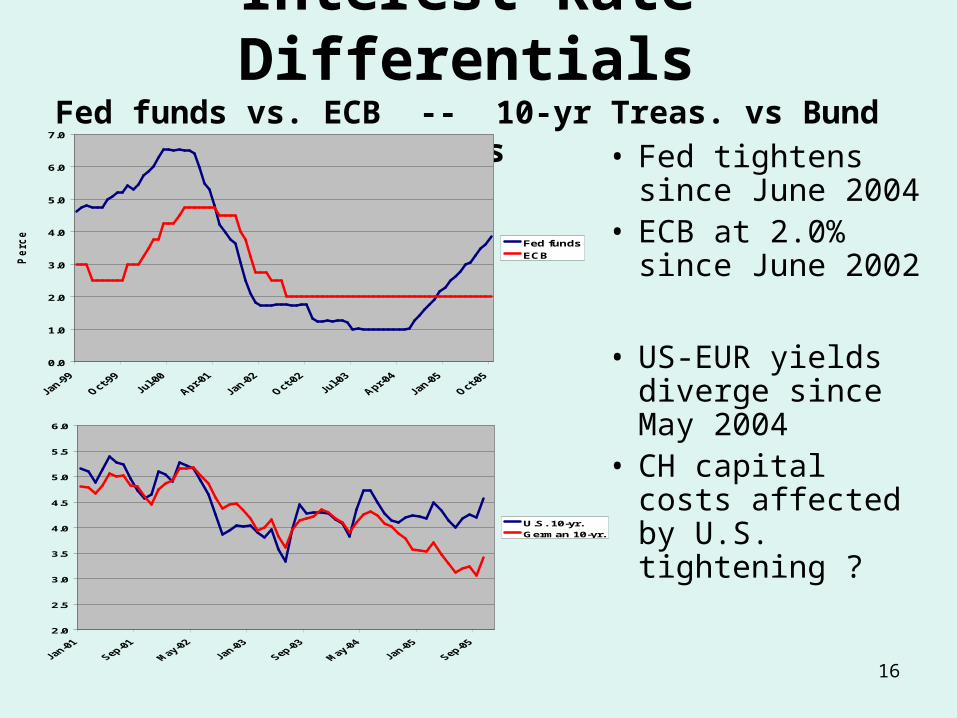
Interest Rate DifferentialsFed funds vs. ECB -- 10-yr Treas. vs Bund Ylds
• Fed tightens since June 2004
• ECB at 2.0% since June 2002
• US-EUR yields diverge since May 2004
• CH capital costs affected by U.S. tightening ?
0.0
1.0
2.0
3.0
4.0
5.0
6.0
7.0
Perc
ent
Fed fundsECB
2.0
2.5
3.0
3.5
4.0
4.5
5.0
5.5
6.0
U.S. 10-yr.German 10-yr.
17
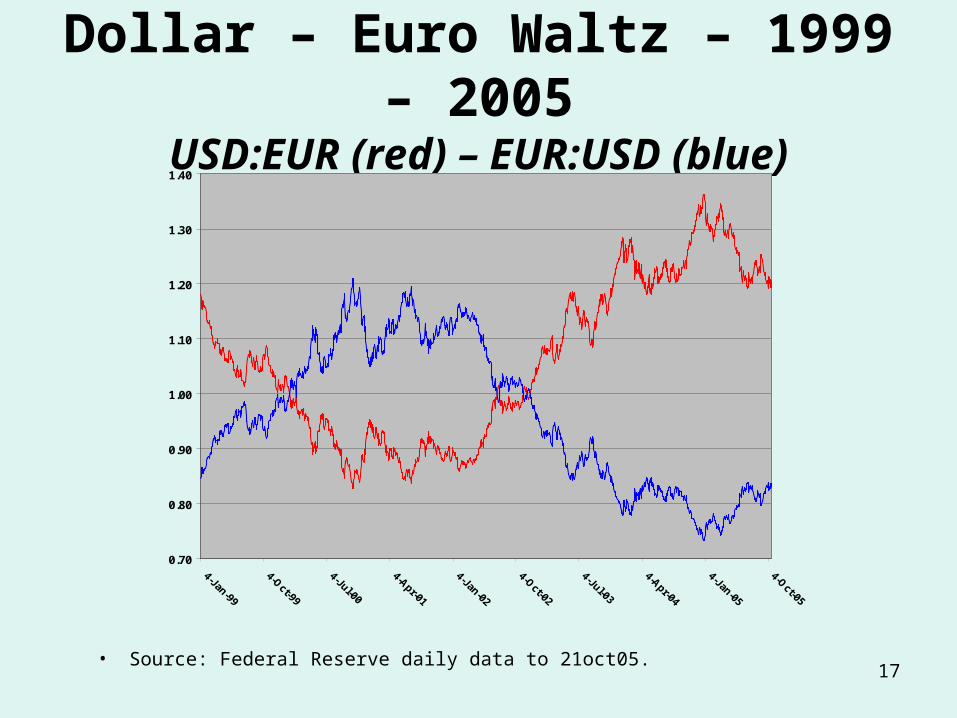
Dollar – Euro Waltz – 1999 – 2005USD:EUR (red) – EUR:USD (blue)
• Source: Federal Reserve daily data to 21oct05.
0.70
0.80
0.90
1.00
1.10
1.20
1.30
1.40
18
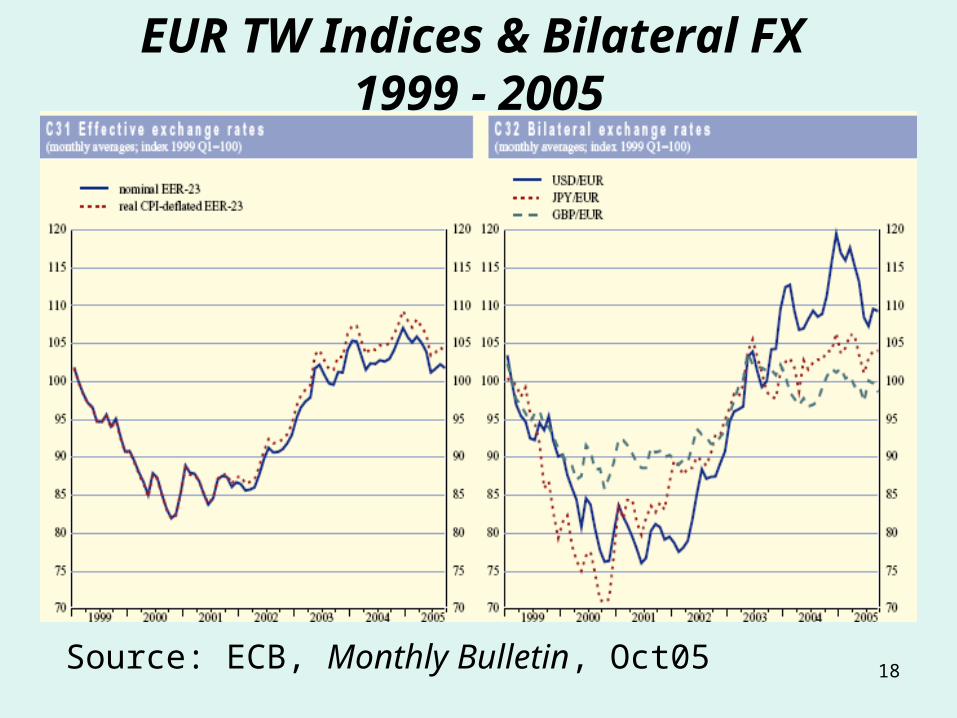
EUR TW Indices & Bilateral FX 1999 - 2005
Source: ECB, Monthly Bulletin, Oct05
19
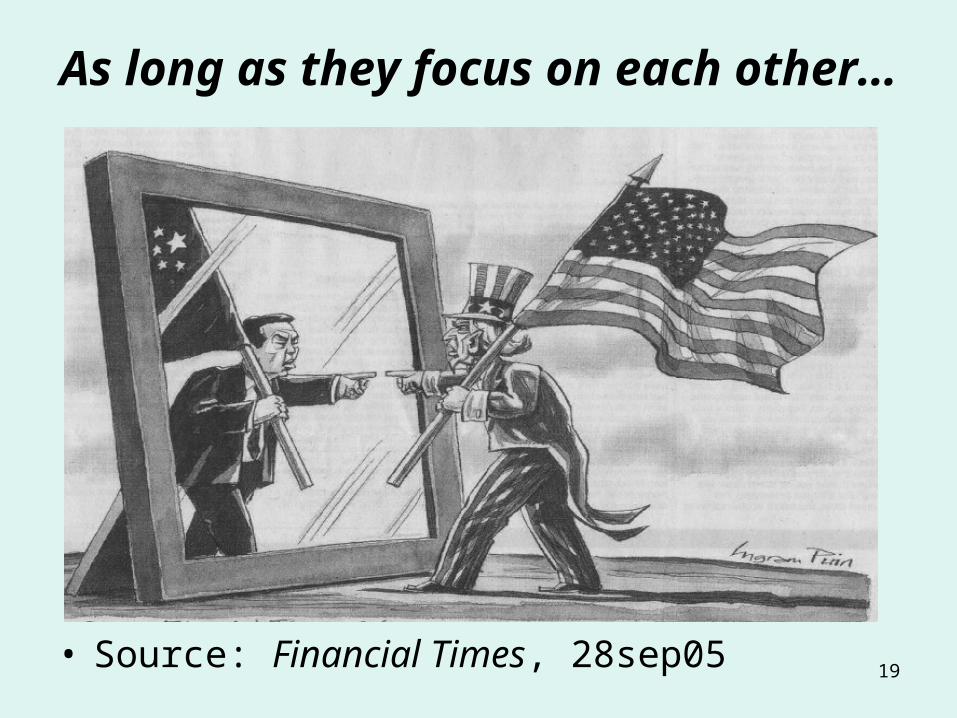
As long as they focus on each other…
• Source: Financial Times, 28sep05
20
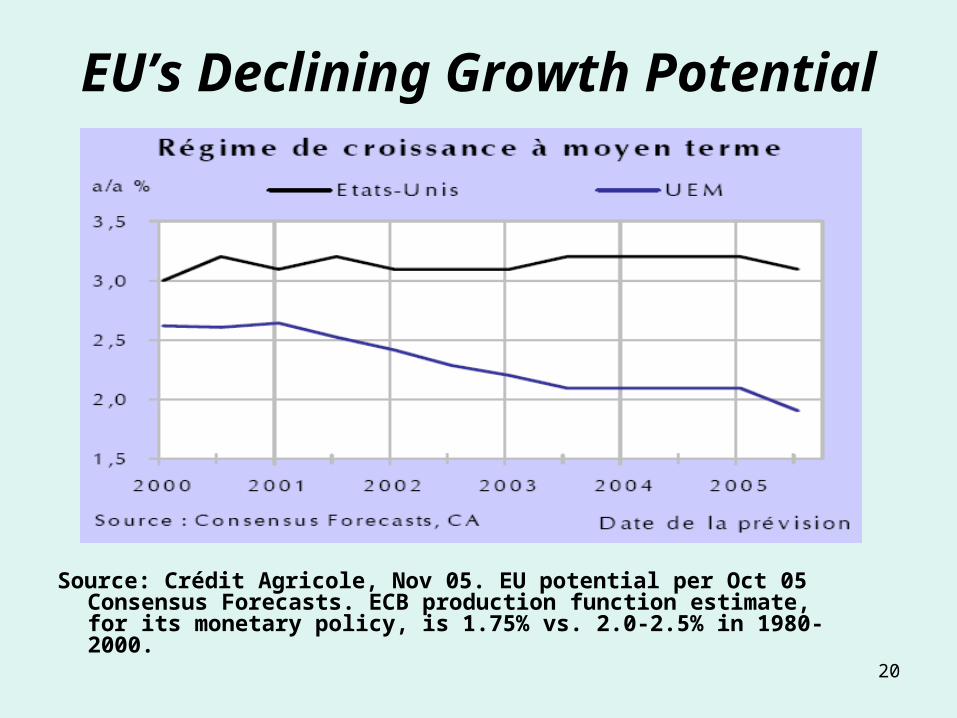
EU’s Declining Growth Potential
Source: Crédit Agricole, Nov 05. EU potential per Oct 05 Consensus Forecasts. ECB production function estimate, for its monetary policy, is 1.75% vs. 2.0-2.5% in 1980-2000.
21
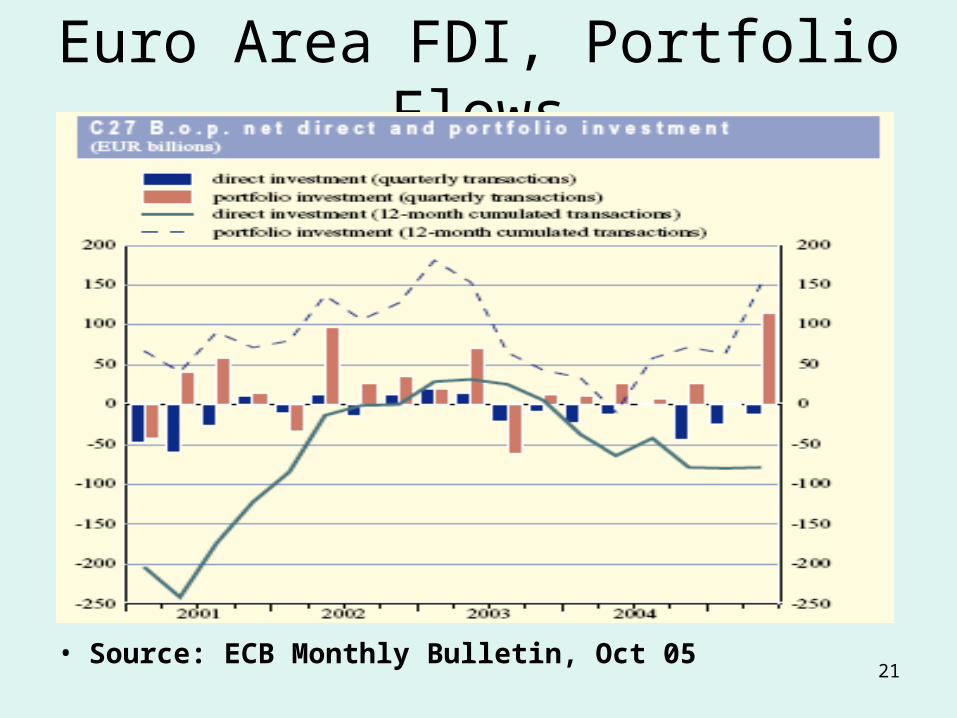
Euro Area FDI, Portfolio Flows
• Source: ECB Monthly Bulletin, Oct 05
22
Current EU – CH Issues:• Trade (textiles, arms), capital flows and FX• Energy & metal supplies – CH competes• World labor force with China + India =
structural changes forced on Europe• China lowers EU prices = disinflationary,
slowing economic and job growth• FDI: CH may rival US as future pot of gold• Security issues: arm sales vs. cordon
23
Special EU – US - CH Issues• H5N1 – do CH farmers get paid to cull ?• Counterfeiting = patents, copyrights ?• Corporate, tax and property law ?• Human rights … for 1.4 billion ?• Environmental issues … for everybody ?• Demography – EU grays, US ages, CH ? • China’s competitors tomorrow : India,
Burma and … TN ?
24
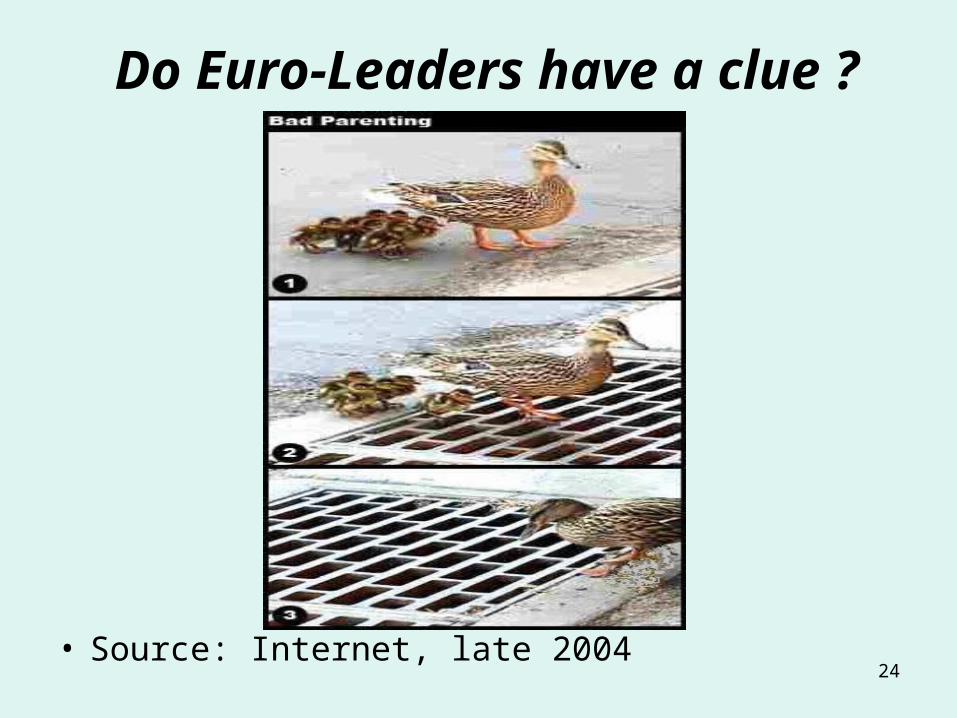
Do Euro-Leaders have a clue ?
• Source: Internet, late 2004


