Page 1
Paula Goodman Maccabee, Esq.
Just Change Law Offices 1961 Selby Ave., St. Paul, Minnesota 55104, [email protected]
Ph: 651-646-8890, Fax: 651-646-5754, Cell 651-775-7128 http://justchangelaw.com
May 14, 2013 Delivered by Electronic Mail Shannon Lotthammer, MPCA ([email protected] ) Katrina Kessler, MPCA ([email protected] ) Pat Engelking, MPCA ([email protected] ) RE: Wild Rice Impaired Waters Assessment Wild Rice Advisory Committee Follow-up from May 1, 2013 Meeting Dear Ms. Lotthammer, Ms. Kessler, Ms. Engelking: Thank you for providing members of the Wild Rice Advisory Committee with an opportunity to comment on the wild rice impaired waters assessment and 2013 wild rice testing work plan and ongoing studies. The following comments are submitted on behalf of WaterLegacy, a grassroots non-profit organization formed to protect Minnesota’s water resources and the communities that rely on them. Wild Rice Impaired Waters Should Not be Limited to those with 10 Data Points As we explained during the Committee meeting on May 1, 2013, the requirement that there be at least 10 sulfate measurements in order for a body of water to be considered for inclusion on the wild rice impaired waters list appears to be arbitrary and would result in an inappropriate exclusion of information from tribal expert sources. The Minnesota Pollution Control Agency (MPCA) has proposed a requirement that only median data showing a 90 percent probability that elevation would not have occurred by chance be used. We believe that this statistical requirement is sufficient to determine whether a data set of fewer than 10 points indicates that levels of sulfate have exceeded the state water quality standard. If data show sulfates from 11 to 20 mg/L, for example, the median of a limited data set is unlikely to meet statistical requirements. If data reflects sulfates at 80 or 100 mg/L, the median may well demonstrate exceedance even if fewer than 10 data points are provided. The MPCA was informed on May 1, 2013 that data collected by the 1854 Treaty Authority does not include 10 or more sulfate measurements for relevant bodies of water. Absent evidence that the 1854 Treaty Authority data is unreliable, WaterLegacy would object to any artificial data limit that excludes assessment by this expert source of information. Year-Round Sulfate Concentrations Should be Considered to Determine Impairment There is no basis in law, precedent or science to restrict assessments of wild rice impaired waters to those where high sulfate levels were detected from April through August. Although the Agency very recently, in response to industry pressure, stated in one individual permit case – the Mesabi Nugget NPDES/SDS permit - that the wild rice sulfate standard of 10 mg/L is only applicable from April to August, there is no statute or rule that restricts its application to only those months. Prior permitting cases do not support this restrictive interpretation. The 1975 Clay Boswell Cohasset NPDES permit imposed limits on sulfate year-round, although higher levels of discharge were allowed during certain months. The Keetac mine and tailings basin NPDES permits approved in October 2011 applied the 10 mg/L sulfate limit year-round. There has been no consideration of proposed rule language that would limit application of the wild rice sulfate standard to the months from April to August, let alone promulgation of a rule that would so
Page 2
Wild Rice Advisory Comments May 14, 2013 Page 2 constrain application of the standard. More important, scientific data does not support limiting the assessment of sulfate exceedance data to these few months. Scientific research, including research conducted under the auspices of this Committee, suggests that in addition to any impacts of sulfate on the growing plant, there are impacts to wild rice and its next generation of seeds from sulfide in sediments. Year-round data of sulfate concentrations should be included in the assessment of wild rice impaired waters. MPCA Case-by-Case Assessment of Waters Used for the Production of Wild Rice WaterLegacy disagrees with the argument made by the Chamber of Commerce and the mining industry in their May 9, 2013 memorandum that for the MPCA to determine “waters used for the production of wild rice” on a case-by-case basis is in some way inappropriate. The industry’s legal claims that case-by-case determination of wild rice waters by the MPCA was impermissibly vague or would exceed statutory authority were dismissed by the courts. Pending promulgation of a rule to more specifically define waters used for the production of wild rice, case-by-case determination is what is required under Minnesota law. Field Work Comments WaterLegacy would oppose the diversion of resources to evaluate wild rice of a different species than that in Minnesota in a high sulfate water body located in North Dakota. We do not have specific comments as to the potential sites for in-depth field work except to express our concern that some additional field work should be done in aquatic environments that have not been complicated by diverse industrial discharges. WaterLegacy opposes the request made by the Chamber of Commerce and the mining industry that field sites should be selected to “balance” the distribution. This is an inappropriate use of a statistical argument. If presence of wild rice in high sulfate sites is anomalous, field data should not be manipulated to undermine findings that presence of wild rice varies depending on the concentration of sulfates. WaterLegacy makes no specific comments on the mining industry’s additional requests for what should be measured and how data should be used in the field and mesocosm studies. However, we continue to be concerned at the resources expended by the industry to undermine certain portions of the wild rice research and control other aspects of the studies. We believe that the MPCA has no obligation to generate information requested by industry and, to the extent that the industry influences sampling and study design, we are concerned that the objectivity and reliability of research may be compromised. Hydroponic Research Comments WaterLegacy continues to be concerned about the way in which hydroponic studies may be used as well as the expenditure of resources on gathering data that does not pertain to ecological sustainability of a resource. Industry representatives have repeatedly stated in their advocacy that levels of sulfate that do not produce toxicity in a brief laboratory experiment with an individual seedling demonstrate a lack of effect of that concentration in a natural stand of wild rice over time. We would request that the MPCA clarify how it intends to use data pertaining to effects of sulfate or sulfide from a hydroponic experiment. WaterLegacy would also request confirmation as to the seed sources for hydroponic experiments. The “2013 MPCA Wild Rice study: Potential sites for monthly field sampling” states that Monongalia and Little Round are the seed source for hydroponic experiments. Please confirm, as stated in November 2011 Sulfate Standard to Protect Wild Rice Study Protocol at page 20, “Most experiments will be conducted with seeds obtained from environments likely having low-sulfide porewaters, in order to provide some margin of safety in
Page 3
Wild Rice Advisory Comments May 14, 2013 Page 3 assessing the need to revise the water quality standard to protect wild rice production. It is possible different strains of wild rice vary in their ability to tolerate elevated sulfide, given that such variance has been documented for white rice (Iimura et al. 2002).” Again, as with the field studies, we are troubled that the mining industry is attempting to control the outcomes of wild rice research. In particular, WaterLegacy would highlight the following instruction from the mining industry memo, “data generated to date has been far outside the expected ranges of other laboratory sulfate toxicity endpoints, with no explanation behind the expected causal mechanism of this increased toxicity. Beginning definitive testing under such conditions is unwise. .” It is clearly inappropriate to determine whether or not to proceed with studies based on the fact that the studies appear to be showing toxicity. Classification WaterLegacy has briefly reviewed recent documents circulated by the MPCA regarding a wild rice classification system. We don’t have an opinion as to whether such a classification system would be helpful in the management of natural stands of wild rice, but we don’t believe such classification should play any part in developing or enforcing water quality standards. Conclusion We look forward to hearing from you in response to the above comments. Please feel free to call me at 651-646-8890 if you have any questions regarding the above matters. Sincerely yours,
Paula Goodman Maccabee Counsel/Advocacy Director for WaterLegacy cc: Chris Wagener, EPA ([email protected] ) Paul Proto, EPA ([email protected] )
Page 4
From: Darren VogtTo: Kessler, Katrina (MPCA)Cc: Swain, Ed (MPCA); Engelking, Pat (MPCA); Tomasek, Mark (MPCA); Blaha, Gerald (MPCA); Lotthammer,
Shannon (MPCA)Subject: wild rice and sulfate impaired waters assessment approachDate: Monday, May 06, 2013 9:55:07 AM
Katrina,Thanks for the discussion on the impaired waters assessment approach for wild rice and sulfate at theAdvisory Committee meeting in Duluth. I just want to quickly reiterate some comments. I have concern over the proposed language that only waterbodies with at least ten sulfatemeasurements will be assessed. Ten measurements is fairly intensive monitoring, and I question howmany relevant locations would meet that criteria. For example, we know of locations downstream ofmining impacts with elevated sulfates and wild rice presence. However, such a location would notqualify for consideration if the only available data is from one sample per year over a three year period(3 samples total). This does not seem appropriate. The time of year that the sample is taken should also not be a factor. If the point is to show sulfatelevels, a sample taken outside of the proposed April through August timeframe should still qualify. I understand the need for good data, but the proposed approach seems exclusive instead of inclusive. Thank you. Darren VogtEnvironmental Director1854 Treaty Authority4428 Haines RoadDuluth, MN 55811218-722-8907 (phone)218-722-7003 (fax)[email protected]
Page 9
1
Memorandum To: Shannon Lotthammer & Pat Engelking
From: MPCA Advisory Committee Members:
Kurt Anderson, MN Power (ALLETE, Inc.)
Rachel Walker, Barr Engineering
Robin Richards, ENVIRON International Inc.
David Hatchett, Mesabi Mining
Frank Ongaro, MiningMinnesota
Timothy Peterkoski, Arcelor Mittal USA
Mike Robertson, MN Chamber
David Skolasinski, Cliffs Natural Resources
David Smiga, US Steel
Subject: Response to May 1, 2013 MPCA Wild Rice Standards Study Advisory Committee Meeting
Date: May 9, 2013
cc: MN Chamber Wild Rice/Sulfate Task Force
Shannon and Pat,
In response to the “next steps” discussion at the end of the May 1, 2013 Advisory Committee Meeting,
the above Advisory Committee Members have the following comments:
1. Input on your preferred format for the next Advisory Committee Meeting wich will be held
in early/mid-June – in person in St. Paul, or conference call? (No. 4 in Pat’s 5-2-13 email)
We would prefer a face-to-face meeting in St. Paul, with the opportunity to phone in for members
who are unable to travel.
2. Any concerns with the proposed approach to Technical Conference Calls? (No. 6 in Pat’s 5-
2-13 email)
We believe the technical conference calls are valuable and should definitely continue. As with the
face-to-face meetings, it would be beneficial to clearly define the purpose and scope of these
technical calls at the beginning of the meeting to make the best use of Advisory members’ and MPCA
staff’s time. We look forward to the next call at the end of May.
Page 10
2
3. Input on the best way to get information to you – package it up and send an e-mail every
two weeks or so? Send as soon as we get new information? Explore an FTP site? (No. 5 in
Pat’s 5-2-13 email)
We prefer to have data disseminated as soon as possible, and email seems to be working fine. The
Agency should not “store up” data and wait for some “critical mass”; rather, the Agency should pass
along data as soon as it becomes available. In the event that certain pieces of data are very large (e.g.
multiple MB), the Agency should consider posting such information on an FTP site with access to the
Advisory Committee members. Although the Agency expressed concern about its ability to do so, a
number of our members routinely use and set up such sites, and would be happy to assist the Agency
should that be necessary.
In addition, the above Advisory Committee Members have the following comments on the following
technical issues:
4. Input on an additional 15-20 sites for one-time field sampling, by site conditions (see table
below) (No. 1 on Pat’s 5-2-13 email)
We believe that the numbers in each quadrant of the table below need to be balanced, with 5 sites in
each quadrant, in order to maximize the statistical power of the analysis. To the extent that there are a
limited number of high sulfate, rice present sites, the number of low sulfate, rice present need to
match the number of high sulfate, rice present sites.
There was a fair amount of concern over analysis of sites where rice was not present, but other
macrophytes, particularly water lilies were. Concerns ranged from the fact that there may be other
aquatic macrophytes which are better indicators of the presence of conditions suitable to wild rice, to
concerns that water lilies actually are competitors of wild rice and may have simply crowded out any
rice that was once present, to the overall concern about whether the absence of rice is due to sulfate
concentrations, or some other factors.
While we have not seen the final analysis of sites with sulfate measurements from the 2012 field
season, it appears that there are few, if any sites listed which have low sulfate and rice absent. We
suggest that the tribes and the DNR may be aware of potential sites from their efforts to establish wild
rice in lakes where rice is not currently present. We feel these sites would provide very useful data to
help inform the standard.
Page 11
3
If sites with low sulfate and no rice present are not available or accessible for sampling, we would
suggest dropping the entire column of “rice absent” and simply concentrate on high and low sulfate
sites with rice present. Again, however, we would caution that an equal number of sites from each
category be used, to simplify statistical analyses and presentation to the public.
CONDITIONS Rice Present Rice Absent
High Sulfate (> 10 ppm for the
purposes of the study design)
Low Sulfate (~ 10 ppm for the
purposes of the study design)
5. Input on which seven sites of the MPCA’s list of candidate sites to sample monthly from
May through September, and why you recommend these sites. Of these, additional input on
which two sites at which to also conduct peeper monitoring and why. Please also indicate
any additional sites on the MPCA candidate list that you believe are important for monthly
monitoring and why. (No. 2 on Pat’s 5-2-13 email.)
The sites monitored in 2013 should include as large a range of sulfate concentrations as possible.
There should be a mix of rivers, lakes and cultivated paddies to cover at least a portion of the
potential habitats for wild rice. The research should concentrate solely on those sites where rice is
present, leaving the “rice absent” sites to the 15-20 sites above.
Our nominations for the 7 sites would include the following:
a. Rice Paddy 6 – high sulfate, paddy conditions
b. Second Creek – high sulfate, river/stream
c. Height of Land – low sulfate, lake
d. Mississippi River upstream of Cohasset power plant – low sulfate, river
e. Cromwell – high sulfate, lake
f. Little Round – low sulfate, lake + source of hydroponic rice
g. Eighteen – low sulfate, lake
Page 12
4
6. Input on whether the North Dakota site should be sampled? (No. 3 on Pat’s 5-2-13 email)
Yes, the North Dakota water body should be sampled, and included as one of the high sulfate sites on
which rice grows. Even though it is a different species of rice, insights gained will be useful. The
North Dakota water body should be sampled in a single event, similar to the 2012 campaign, and not
included in the water bodies which will undergo extensive testing. It will be important to gather the
entire suite of chemical analysis, both for the overlying water and for the porewater, so that
meaningful comparisons can be made to the data collected in 2012 and 2013.
7. Additional technical comments on 2013 field and mesocosm studies
2013 Field studies
We would renew our on-going comment that the U of M needs to measure oxidation reduction
potential (ORP) at these sites. We struggle to understand the MPCA’s resistance to such
measurements. We recognize that caution must be taken while measuring ORP in the field;
however, caution must also be taken when measuring sulfide and other sensitive parameters. In
the absence of direct ORP measurements, the MPCA needs to provide multiple pairs of oxidized
and reduced chemical species in both the overlying water and in the sediment porewater, in order
to obtain meaningful results from the Nernst equation. In the 2012 data, only nitrates and
ammonia were measured in both places. We would suggest at a minimum, oxidized and reduced
iron, sulfate and sulfide, as well as nitrate and ammonia, with measurements of all species in both
the overlying water and sediment pore water. Given the difficulties in obtaining and maintaining
anoxic samples, it would seem that direct measurement of the ORP would provide more
meaningful data at lower cost.
We would also like to review all data collected by Dr. Myrbo or otherwise in the possession of
the Agency regarding sulfate and other water chemistry from cultivated rice paddies. We
understand that Dr. Myrbo sampled at least four sites, three of which Dr. Swain recited at the
Advisory Committee meeting and committed to supply. We would also request any other data
which the Agency or the University has pertaining to the water or pore water or sediment
chemistry in paddies.
Page 13
5
2013 Mesocosm studies
A review of the history of the work plans for the mesocosm studies will be useful to
understand our comments and concerns. Originally, the mesocosms were to be conducted as
an essential part of the suite of studies for the review of the sulfate standard: the aptly named
“three legged stool” of hydroponics, mesocosm and field studies. When the Advisory
Committee met in June of 2012, Dr. Pastor demonstrated not only the hydroponic apparatus
he intended to use, but showed us the mescosms at the farm of UMD. During the
presentation at the farm and during the meeting preceding the farm trip, Dr. Pastor and the
MPCA noted that there were empty mesocosms which could be used, and the experiments
funded by the MPCA could begin in clean mesocosm containers, with new solutions of
varying sulfate concentrations added. Dr. Pastor noted that the work that was currently
underway would be finished in 2012 and that those mesocosm containers would also be
available.
During the mid-project review, the timeline presented by the MPCA indicated that, because
of the struggles in developing the hydroponic work plans, the mesocosm work would only be
completed “as budget and time allows”. Given the struggles with the hydroponic work, it
seemed that there would be insufficient time and budget to do any mesocosm work.
Now, at the May 2013 Advisory Committee meeting, the MPCA announced that not only
does it intend to conduct one seasons study in the mesocosms, but that the materials in the
mesocosms would continue to be used, after two years of testing at varying sulfate
concentrations. The Advisory Committee was told that there was no data available on the
2011 and 2012 mesocosm studies, and that the results of those studies would not be available
until late summer or fall of 2013.
This is a highly unorthodox way to begin an important experiment which will be used to help
inform the sulfate water quality standard. Experiments that are initiated with test chambers,
sediments, and organisms already subjected to another exposure is atypical and a classic
example of experimental bias, which is why this approach is almost always avoided
regardless of time or budgetary constraints.
Page 14
6
That said, it is extremely difficult to comment upon the proposed scope of work without a
thorough understanding of the scope and objectives of the previous work, or without a
thorough understanding of the current and historical conditions of the mesocosms which will
be used in 2013. To that end, we would request the following information be supplied as soon
as possible, and additional time be given to review the materials, ask questions of the
researchers where materials are not clear to the reviewer, and to prepare comments on the
2013 mesocosm study work.
a. The objectives of the 2011 and 2012 mesocosm studies
b. The work plans, QAPs and results of the 2011 and 2012 studies
c. The starting point of the 2013 mesocosm experiments (e.g. the chemical and biological
state of the mesocosms after two years of experiments at varying sulfate concentrations in
the overlying water). This should include measurements taken of the overlying water, the
sediment, and sediment porewater this spring, as soon as ice is out, to determine the
effects of the past winter.
d. The objectives of the 2013 studies. Based on the, admittedly limited, presentation by Mr.
Munson, it seems as though the objectives are many and varied, and not well defined.
Given the legislation, the objective should be to determine whether or not there are
effects on wild rice at varying sulfate concentrations in the overlying water.
e. A definitive work plan, similar to the work plans provided by Dr. Pastor for the
hydroponic work, and by Dr. Myrbo and Dr. Johnson for the field and sediment-
temperature work.
In addition, given the results of the 2012 field experiments, as well as the 2012 germination
and “juvenile seedling” experiments, a higher concentration of sulfate for the high end – on
the order of 1,000 mg/L to 1,600 mg/L would seem to be more in order. (The agency one-
page handout indicates that previous mesocosm work was limited to background (10 mg/L ±)
to 300 mg/L. That level may not be high enough to show significant impacts.
Page 15
7
8. Starting definitive hydroponic testing now seems premature
Although not specifically referenced in the follow-up email from Pat Engelking, during the
Advisory Committee meeting, Phil Monson indicated that definitive hydroponic testing at UMD
was set to begin in the near future. The Advisory Committee members listed above have serious
reservations that sufficient method development progress and rangefinding tests have been
completed to justify moving into the definitive testing stage at this point. The rangefinding/MDP
data that has been made available to advisory Committee members shows non-normal distribution
and intermittent significant effects as sulfate concentrations increases -- strong evidence that an
interpretable dose-response effect has not been generated and the researchers have not yet
determined sulfate concentrations ranges that are sufficient to measure toxic effect. Furthermore,
data generated to date has been far outside the expected ranges of other laboratory sulfate toxicity
endpoints, with no explanation behind the expected causal mechanism of this increased toxicity.
Beginning definitive testing under such conditions is unwise, as it introduces the distinct
possibility the test results will reflect toxic effects from test design and not the stressor in question
(sulfate).
9. Additional technical comments on potential 303(d) listing of water used for the production
of wild rice
The above Advisory Committee Members have technical comments in a number of areas with
regard to the potential 303(d) listing of impaired waters used for the production of wild rice. We
will submit these detailed comments to Ms. Kessler in a separate memorandum, but wanted to
highlight the concerns which we have for the staff and the Advisory Committee working on the
research, given the extensive discussions at the May 1 Advisory Committee Meeting.
First, during the Advisory Committee meeting, Ms. Lotthammer stated that the Agency has made
a legal determination that any listing of impaired “waters used for the production of wild rice” is
not a rulemaking to define the term “waters used for the production of wild rice”. We would
request all of the documentation that was used in reaching this legal conclusion.
Second, we believe that the effort to list impaired “waters used for the production of wild rice” is
premature, and should wait until after the MPCA has completed the research required by the
Page 16
8
Minnesota Legislature and after the rulemaking anticipated by the Legislature, including
rulemaking on the definition of “waters used for the production of wild rice.” As noted in the
MPCA’s guidance:
“The possible erroneous placement of a waterbody on the 303(d) impaired list is a
concern because of the regulatory and monetary implications of 303(d) listing.”1
As the Agency is aware, there are serious regulatory and monetary implications of a 303(d) listing
of “waters used for the production of wild rice”. These implications fall not only on industry, but
on municipal and other dischargers above “waters used for the production of wild rice”. In
addition to the high cost of treating to meet the current numeric limit, issues of anti-degradation
and anti-backsliding could impact dischargers who are required to meet the current limit, even if
the agency decides to modify the current numeric limit.
Third, we have serious concerns about the working definition of “waters used for the production
of wild rice” which the Agency has proposed for the case-by-case determinations it intends to
make in the 303(d) listing assessments. As you will recall from the January 2013 Advisory
Committee meeting, there was near unanimous dissatisfaction with the “straw proposal” which
the Agency put forth for the definition of “waters used for the production of wild rice”. Yet the
Agency appears to be using essentially the same “straw proposal” for its case-by-case
determinations in making the 303(d) listing assessments. There are a number of concerns with
this approach, which we will detail in our separate memorandum to Ms. Kessler:
a. This approach does not appear to meet the requirements of the wild rice legislation
As you are aware, the 2011 legislation has specific requirements to be considered in defining
“waters used for production of wild rice”:
“The criteria shall include, but not be limited to, history of wild rice harvests,
minimum acreage and wild rice density.” (MN Session Laws 2011, First Special
Session, Chapter 2, Article 4 Section 32) (Emphasis added)
1 1 Guidance Manual for Assessing the Quality of Minnesota Surface Waters for Determination of
Impairment: 305(b) Report and 303(d) List, 2012 Assessment Cycle, wq-iw1-04, December 2011
Page 17
9
It seems that any case-by-case determinations must include actual measurements of wild rice
acreage and wild rice density, in order to conform to the direction of the Legislature. The
listing of source documents which the Agency presented in its proposal and the discussion at
the Advisory Committee meeting seems to indicate that the Agency is not requiring any
quantitative analysis of the rice upon which the Agency is making a case-by-case
determination that there is impairment. On the two previous case-by-case determinations
made in permitting cases, there were multiple years of measurements of the extent and
density of wild rice, and of water chemistry2.
b. This approach does not take into consideration other factors which affect the health
and vitality of wild rice
As discussed at both the January and the May Advisory Committee meeting, there are
multiple factors which can impact the health and vitality of wild rice. These include, but are
not limited to:
• Life cycle of wild rice
• Water levels (both absolute levels and levels of fluctuation) and water velocity
• Competition and shading from other aquatic macrophytes
• Predation (e.g. carp, water fowl, aquatic mammals)
• Invasive species (e.g. milfoil, zebra mussels)
• Beavers (see water levels and fluctuations)
• Substrate
• Climate change
If the concern is the impairment of waters used for the production of wild rice, it would
seem the Agency should take these into account, particularly in waters where sulfate
concentrations exceed 10 mg/L. As we saw in 2012, high water levels (in the
northeastern part of Minnesota) and drought (elsewhere) caused large reductions in wild
rice production. All of these factors need to be considered when determining whether or
2 SEASONAL APPLICATION OF THE WILD RICE SULFATE STANDARD – PARTRIDGE RIVER
Draft MPCA Staff Recommendation ‐ August 27, 2012 Update/Clarification) and
REVISED DRAFT (Reflecting Tribal Staff Feedback) WATERS USED FOR PRODUCTION OF WILD RICE –
PARTRIDGE AND EMBARRASS RIVERS, MPCA Draft Staff Recommendation – August 13, 2012
Page 18
10
not specific water used for the production of wild rice is impaired, and whether or not
that impairment is due to sulfate concentrations.
c. Among these other factors are the morphology of the river, the parent geologic
material through which the river flows, and the substrate of the water body within
which rice is growing.
In a study conducted by Barr Engineering for PolyMet, it was determined that river
morphology and landforms “appear to play an important role in development of river
features that enhance water-level stability”. A copy of the executive summary and some
figures from this report is provided in Attachment A.
d. This approach does not appear to follow existing MPCA and US EPA guidance on
conducting assessments of biological impairments
For the 2012 Impairment Listing process, MPCA produced a set of guidelines for the
2012 impaired water assessment cycle.3 In that guidance, MPCA notes that it uses the US
EPA Consolidated Assessment and Listing Methodology (CALM). We would urge the
agency to follow that approach in this listing, and to follow the other portions of the
guidance.
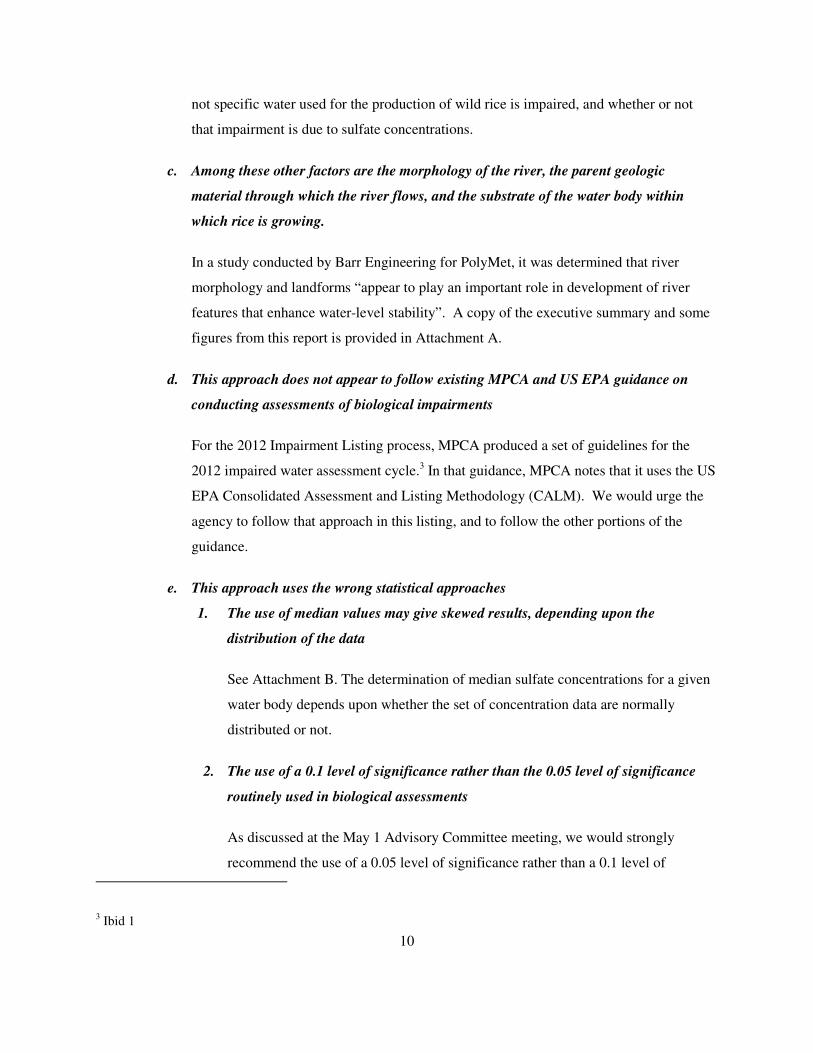
e. This approach uses the wrong statistical approaches
1. The use of median values may give skewed results, depending upon the
distribution of the data
See Attachment B. The determination of median sulfate concentrations for a given
water body depends upon whether the set of concentration data are normally
distributed or not.
2. The use of a 0.1 level of significance rather than the 0.05 level of significance
routinely used in biological assessments
As discussed at the May 1 Advisory Committee meeting, we would strongly
recommend the use of a 0.05 level of significance rather than a 0.1 level of
3 Ibid 1
Page 19
11
significance. A 0.05 significance level is the accepted statistical default for
assessing biological, ecological, and toxicological risk; deviation from this default
value must be fully rationalized and the impacts on the numbers of waters that will
be listed as impaired using a 0.10 significance level should be made transparent to
all affected parties. Use of a 0.1 level of significance could result in a greater
possibility of listing as impaired a lake that can support rice when using the 0.1
level of confidence for determining acceptability than if using the 0.05 level of
confidence. As noted above, given the “regulatory and monetary implications of
303(d) listing”, efforts should be made to minimize potentially “false positive
listings, particularly given the relatively small amount of data on which these
decisions will be made .
We understand that the Agency has engaged staff statisticians to begin addressing this
concern, which could have serious and long-lasting repercussions on any impairment
listing process. This is encouraging, and we would further encourage the agency to enlist
statisticians outside of the agency to think through this important issue.
f. This approach does not appear to take into consideration multiple areas where the
concentration of sulfate is greater than 10 mg/L, yet health, dense stands of rice
appear. What criteria will the MPCA use to determine that the rice is impaired when,
biologically, it appears quite unimpaired?
As noted in the list of potential waters for intensive 2013 field surveys and based on
surveys conducted over the past several years, a number of waters have healthy dense
stands of wild rice, yet exceed the 10 mg/L by a wide margin. For example, Hay Lake –
31.7 mg/L, Partridge River downstream from Second Creek (median value 190 mg/L),
Rice Paddy 6 – 279 mg/L and Second Creek – 1100 mg/L are all over 10 mg/L yet have
dense rice stands. The MPCA needs to explain how such bodies of wild rice are impaired
when wild rice has been consistently documented in numerous relatively dense stands
over several years.
Thank you for the opportunity to comment on the matters before the Advisory Committee. Please direct
any questions you may have to Mike Robertson.
Page 20
12
Attachments
A: “Influence of Geomorphology on Wild Rice Occurrence in the Upper St. Louis River”
(Executive summary and figures)
B: “Test Sample Lake Sulfate Data”
Page 21
A determination of “impairment” for waters used for the production of wild rice is based on whether “the median sulfate
concentration is greater than the state water quality standard, as determined by a statistical test that is appropriate to the
distribution of the data and at a 0.1 level of significance”.
How does this determination work? What does it look like? MPCA
We constructed from actual sulfate monitoring of a wild rice lake different types of possible datasets for testing the sulfate data
compliance with existing 10.0 mg/L standard for waters that support wild rice.
LK Data 1 LK Data 2 LK Data 3 LK Data 4
Mea
n,
Med
ian a
nd R
ange
Box P
lots
0
5
10
15
20
25
Sample Sulfate Lake Test Data
Lake Data 1: Slightly skewed distribution with mean = 9.8; median = 10.3; and range of 5.14 to 11.8 mg/L.
This is actual data for a lake noted to support wild rice production and covers about 10 years of monitoring data are:
5.14 6.62 7.45 7.93
9.11 9.33 10 10.1
10.2 10.3 10.6 10.6
10.8 10.9 11 11.3
11.7 11.8 11.8
We then adjusted the above dataset to change distribution of sulfate results, but keep the medians relatively the same, as
follows:
Lake Data 2: Normal distribution with mean = 10.2; median = 10; and range of 7.5 to 13.3 mg/L.
Lake Data 3: Highly skewed distribution with mean = 10.1; median = 12.0; and range of 6.0 to 14.0 mg/L.
Lake Data 4: Highly skewed distribution with mean = 12.8; median = 9.8; and range of 9.0 to 22.0 mg/L.
Page 22
Below are histograms for each of the above four datasets that, similar to the box plots, further illustrate the distribution of the
sample test data.
0
5
10
1 2 3 4 5 6 7 8 910
11
12
13
14
15
16
17
18
19
20
More
Fre
qu
en
cy
mg/L Sulfate
Histogram Data 1
Frequency
0
2
4
6
8
10
1 2 3 4 5 6 7 8 9 10 11 12 13 14 15 16 17 18 19 20
Fre
qu
en
cy
mg/L Slfate
Histogram Data 2
Frequency
0
2
4
6
1 2 3 4 5 6 7 8 9 10 11 12 13 14 15 16 17 18 19 20
Fre
qu
en
cy
mg/L Sulfate
Histogram Data 3
Frequency
0
5
10
Fre
qu
en
cy
mg/L Sulfate
Histogram Data 4
Frequency
Page 23
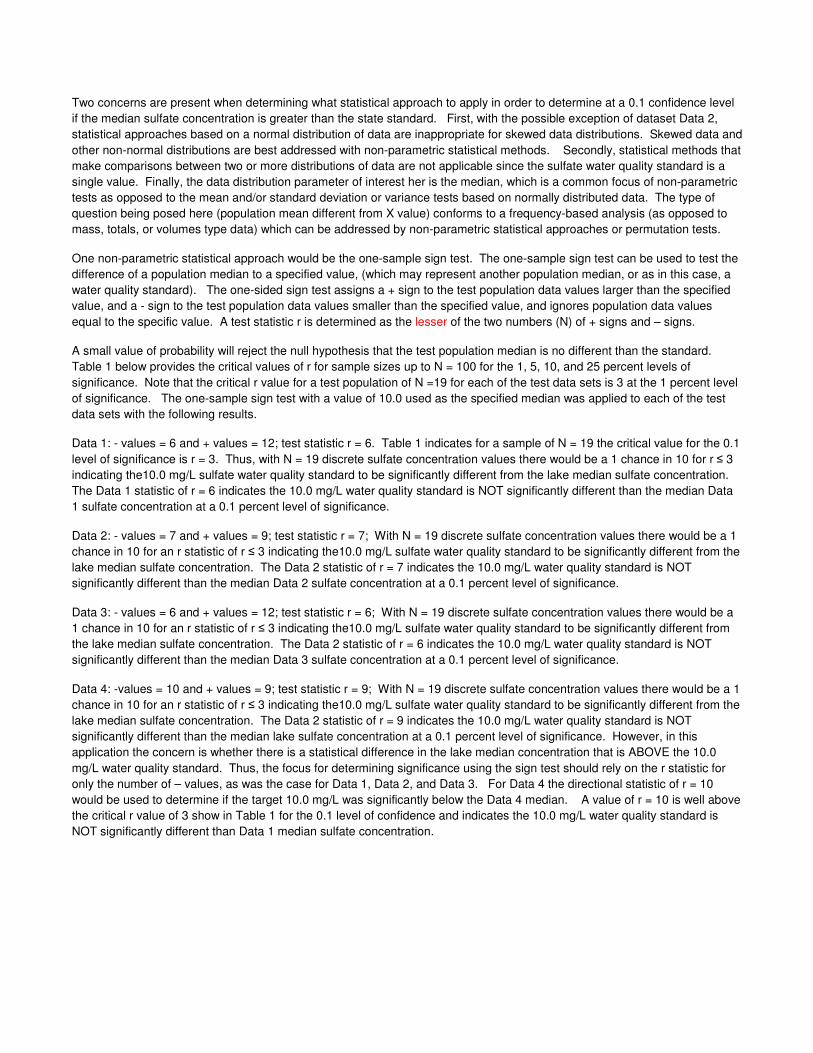
Two concerns are present when determining what statistical approach to apply in order to determine at a 0.1 confidence level
if the median sulfate concentration is greater than the state standard. First, with the possible exception of dataset Data 2,
statistical approaches based on a normal distribution of data are inappropriate for skewed data distributions. Skewed data and
other non-normal distributions are best addressed with non-parametric statistical methods. Secondly, statistical methods that
make comparisons between two or more distributions of data are not applicable since the sulfate water quality standard is a
single value. Finally, the data distribution parameter of interest her is the median, which is a common focus of non-parametric
tests as opposed to the mean and/or standard deviation or variance tests based on normally distributed data. The type of
question being posed here (population mean different from X value) conforms to a frequency-based analysis (as opposed to
mass, totals, or volumes type data) which can be addressed by non-parametric statistical approaches or permutation tests.
One non-parametric statistical approach would be the one-sample sign test. The one-sample sign test can be used to test the
difference of a population median to a specified value, (which may represent another population median, or as in this case, a
water quality standard). The one-sided sign test assigns a + sign to the test population data values larger than the specified
value, and a - sign to the test population data values smaller than the specified value, and ignores population data values
equal to the specific value. A test statistic r is determined as the lesser of the two numbers (N) of + signs and – signs.
A small value of probability will reject the null hypothesis that the test population median is no different than the standard.
Table 1 below provides the critical values of r for sample sizes up to N = 100 for the 1, 5, 10, and 25 percent levels of
significance. Note that the critical r value for a test population of N =19 for each of the test data sets is 3 at the 1 percent level
of significance. The one-sample sign test with a value of 10.0 used as the specified median was applied to each of the test
data sets with the following results.
Data 1: - values = 6 and + values = 12; test statistic r = 6. Table 1 indicates for a sample of N = 19 the critical value for the 0.1
level of significance is r = 3. Thus, with N = 19 discrete sulfate concentration values there would be a 1 chance in 10 for r ≤ 3
indicating the10.0 mg/L sulfate water quality standard to be significantly different from the lake median sulfate concentration.
The Data 1 statistic of r = 6 indicates the 10.0 mg/L water quality standard is NOT significantly different than the median Data
1 sulfate concentration at a 0.1 percent level of significance.
Data 2: - values = 7 and + values = 9; test statistic r = 7; With N = 19 discrete sulfate concentration values there would be a 1
chance in 10 for an r statistic of r ≤ 3 indicating the10.0 mg/L sulfate water quality standard to be significantly different from the
lake median sulfate concentration. The Data 2 statistic of r = 7 indicates the 10.0 mg/L water quality standard is NOT
significantly different than the median Data 2 sulfate concentration at a 0.1 percent level of significance.
Data 3: - values = 6 and + values = 12; test statistic r = 6; With N = 19 discrete sulfate concentration values there would be a
1 chance in 10 for an r statistic of r ≤ 3 indicating the10.0 mg/L sulfate water quality standard to be significantly different from
the lake median sulfate concentration. The Data 2 statistic of r = 6 indicates the 10.0 mg/L water quality standard is NOT
significantly different than the median Data 3 sulfate concentration at a 0.1 percent level of significance.
Data 4: -values = 10 and + values = 9; test statistic r = 9; With N = 19 discrete sulfate concentration values there would be a 1
chance in 10 for an r statistic of r ≤ 3 indicating the10.0 mg/L sulfate water quality standard to be significantly different from the
lake median sulfate concentration. The Data 2 statistic of r = 9 indicates the 10.0 mg/L water quality standard is NOT
significantly different than the median lake sulfate concentration at a 0.1 percent level of significance. However, in this
application the concern is whether there is a statistical difference in the lake median concentration that is ABOVE the 10.0
mg/L water quality standard. Thus, the focus for determining significance using the sign test should rely on the r statistic for
only the number of – values, as was the case for Data 1, Data 2, and Data 3. For Data 4 the directional statistic of r = 10
would be used to determine if the target 10.0 mg/L was significantly below the Data 4 median. A value of r = 10 is well above
the critical r value of 3 show in Table 1 for the 0.1 level of confidence and indicates the 10.0 mg/L water quality standard is
NOT significantly different than Data 1 median sulfate concentration.
Page 25
Confidence Interval for the Test Data Median
As shown above, the magnitude that the + or – members deviate from the target water quality standard of 10.0 mg/L is not
taken into account, only that they are greater or less than the standard value. Familiarity with the critical r value for N number
of observations will quickly indicate a high or low probability of significance. For Data 1 through Data 4 above, an r > 3
indicated a low probability of statistical significance to be present. When r ≤ 3 the magnitude of the + and – members may
need to be taken into account to determine if the standard is significantly different than the dataset median. The magnitudes
of the + and – members are incorporated in the estimation of confidence limits for the dataset median.
The confidence interval of the median is based on the cumulative binomial probabilities of the N observations. Table 2 below
shows the binomial probabilities for each of N = 19 observations and the cumulative binomial probability from the lowest to
highest values for Data 1.
Table 2. Binomial Probabilities for Data 1
Ranked Cumulative Individual
No. Data 1 Binomial P Binomial P
1 5.14 3.8147E-05 3.62396E-05
2 6.62 0.000364304 0.000326157
3 7.45 0.002212524 0.001848221
4 7.93 0.009605408 0.007392883
5 9.11 0.031784058 0.02217865
6 9.33 0.083534241 0.051750183
7 10.0 0.179641724 0.096107483
8 10.1 0.323802948 0.144161224
9 10.2 0.5 0.176197052
10 10.3 0.676197052 0.176197052
11 10.6 0.820358276 0.144161224
12 10.6 0.916465759 0.096107483
13 10.8 0.968215942 0.051750183
14 10.9 0.990394592 0.02217865
15 11.0 0.997787476 0.007392883
16 11.3 0.999635696 0.001848221
17 11.7 0.999961853 0.000326157
18 11.8 0.999998093 3.62396E-05
19 11.8 1 1
Review of the cumulative binomial P values in Table 2 indicates no value at 0.05 and equivalent with a standard 95%
confidence limit. It is unlikely that a cumulative binomial P value will ever be at 0.05 with less than 100 observations.
However, the 95% confidence interval for Data 1 can be approximated by the following where C is cumulative score, α is the
desired confidence level, n is the number of observations, and the result is the rank of the observation that provides the
concentration:
Lower = Cα(2),n or Lower = C.05,19 and Lower = 5
Page 26
Table 2 shows the 5th
ranked concentration to be 0.031784 and close to the 95th
percentile of 0.05 (but not over) with a
corresponding value of 9.11 mg/L sulfate. This is an approximation of the lower end of the 95% confidence interval. The
upper end of the 95% confidence interval is found by:
Upper = n - Cα(2),n + 1, or Upper = 19 – 5 +1 and Upper = 15
Table 2 indicates the 15th
rank concentration to be 11.0 mg/L for Data 1. Thus, an approximation of the 95% confidence
interval of the median (10.3 mg/L) for Data 1 is 9.11 to 11.0 mg/L. The target water quality standard of 10.0 mg/L is within this
95% confidence interval for Data 1 and corroborates the finding from the sign test that the standard is not significantly different
from the median for Data 1.
A more precise X% confidence interval can be determined for Data 1based on the binomial probabilities in the same fashion.
Using Table 2, the confidence interval of 9.33 to 10.9 (6th rank and 14
th rank values) is the 91.6% confidence interval for Data
1. Table 3 presents the 95% confidence interval approximations and the 91.6% confidence intervals for Data1 through Data
4 examples. In each case, the target standard of 10.0 mg/L sulfate is within the confidence interval range indicating no
significance from the dataset median.
Table 3. Sign Test Median 95% Confidence Limit Approximations and Next Lowest
Actual % Confidence Limits Based on Binomial Probability for N=19 Observations
Data 1 Data 2 Data 3 Data 4
Median Concentration 10.3 10.0 12.0 9.8
95% Upper CL approximation 11.0 12.0 13.0 16.5
95% Lower CL approximation 9.1 9.2 8.0 9.4
Actual Nearest CL for N = 19
91.6% Upper CL concentration 10.9 11.2 12.5 15.5
91.6% Lower CL concentration 9.3 9.4 9.0 9.4
Interpolated 0.1 level of significance
90.0% Upper CL concentration 10.87 11.17 12.5 15.33
90.0% Lower CL concentration 9.44 9.4 9.2 9.42
The target concentraton of 10.0 mg/L is within the 95% confidence limit range for all test Data
The target concentraton of 10.0 mg/L is within the 90% (0.1) confidence limit range for all test Data
References
Available upon request – mainly stats books
Page 27
1
Memorandum
To: Katrina Kessler, Minnesota Pollution Control Agency
From: Mike Robertson, Minnesota Chamber of Commerce
Subject: Comments on potential 303(d) listing of waters used for the production of wild rice
Date: May 31, 2013
Cc: Minnesota Chamber of Commerce Wild Rice/Sulfate Task Force
Shannon Lotthammer, MPCA
The MN Chamber has technical comments in a number of areas with regard to the potential 303(d) listing
of impaired waters used for the production of wild rice. While these were outlined in a separate
memorandum to Shannon Lotthammer and Pat Engelking from members of the Advisory Committee, we
wanted to expand upon those comments here.
First, during the Advisory Committee meeting, Ms. Lotthammer stated that the Agency has made a legal
determination that any listing of impaired “waters used for the production of wild rice” is not a
rulemaking to define the term “waters used for the production of wild rice”. We would request all of the
documentation that was used in reaching this legal conclusion.
Second, we believe that the effort to list impaired “waters used for the production of wild rice” is
premature, and should wait until after the MPCA has completed the research required by the Minnesota
Legislature and after the rulemaking anticipated by the Legislature, including rulemaking on the
definition of “waters used for the production of wild rice.” As noted in the MPCA’s guidance:
“The possible erroneous placement of a waterbody on the 303(d) impaired list is a concern because
of the regulatory and monetary implications of 303(d) listing.”1
As the Agency is aware, there are serious regulatory and monetary implications of a 303(d) listing of
“waters used for the production of wild rice”. These implications fall not only on industry, but on
1 Guidance Manual for Assessing the Quality of Minnesota Surface Waters for Determination of
Impairment: 305(b) Report and 303(d) List, 2012 Assessment Cycle, wq-iw1-04, December 2011
Page 28
2
municipal and other dischargers above “waters used for the production of wild rice”. In addition to the
high cost of treating to meet the current numeric limit, issues of anti-degradation and anti-backsliding
could impact dischargers who are required to meet the current limit, even if the agency decides to modify
the current numeric limit at a future date.
Third, we have serious concerns about the working definition of “waters used for the production of wild
rice” which the Agency has proposed for the case-by-case determinations it intends to make in the 303(d)
listing assessments. As you will recall from the January 2013 Advisory Committee meeting, there was
near unanimous dissatisfaction with the “straw proposal” that the Agency put forth for the definition of
“waters used for the production of wild rice”. Yet the Agency appears to be using essentially the same
“straw proposal” for its case-by-case determinations in making the 303(d) listing assessments. There are
a number of concerns with this approach:
a. This approach does not appear to take into consideration multiple areas where the
concentration of sulfate is greater than 10 mg/L, yet health, dense stands of rice
appear.
What criteria will the MPCA use to determine that the rice is impaired when, biologically, it
appears quite unimpaired? As noted in the list of potential waters for intensive 2013 field
surveys and based on surveys conducted over the past several years, a number of waters have
healthy dense stands of wild rice, yet exceed the 10 mg/L by a wide margin. For example,
Hay Lake – 31.7 mg/L, Partridge River downstream from Second Creek (median value 190
mg/L), Rice Paddy 6 – 279 mg/L and Second Creek – 1100 mg/L are all over 10 mg/L yet
have dense rice stands. The MPCA needs to explain how such bodies of wild rice are
impaired when wild rice has been consistently documented in numerous relatively dense
stands over several years. A quartile bioassessment approach may be an alternative – or at
least used as a second tier analytical tool to determine final impairment status.
b. This approach does not meet the requirements of the wild rice legislation
As you are aware, the 2011 legislation has specific requirements to be considered in defining
“waters used for production of wild rice”:
Page 29
3
“The criteria shall include, but not be limited to, history of wild rice harvests,
minimum acreage and wild rice density.” (MN Session Laws 2011, First Special
Session, Chapter 2, Article 4 Section 32) (Emphasis added)
It seems that any case-by-case determinations must include actual measurements of wild rice
acreage and wild rice density, in order to conform to the direction of the Legislature. The
listing of source documents, which the agency presented in its proposal and the discussion at
the Advisory Committee meeting, indicates that the agency is not requiring any quantitative
analysis of the rice upon which the agency is making a case-by-case determination that there
is impairment. We would also note that in the two previous case-by-case determinations
made in permitting cases2, there were multiple years of measurements of the extent and
density of wild rice, and of water chemistry.
Similarly, with regard to the “history of wild rice harvests”, there needs to be a sustained
record of harvesting water bodies. A single harvest in a single year should not constitute a
“history of wild rice harvests". A criterion for the frequency of harvest needs to be
articulated.
c. This approach does not take into consideration other factors that affect the health and
vitality of wild rice
As discussed at both the January and the May Advisory Committee meetings, there are
multiple factors that can impact the health and vitality of wild rice. These include, but are not
limited to:
• Life cycle of wild rice
• Water levels (both absolute levels and levels of fluctuation) and water velocity
• Competition and shading from other aquatic macrophytes
• Predation (e.g. carp, water fowl, aquatic mammals)
• Invasive species (e.g. milfoil, zebra mussels)
2 SEASONAL APPLICATION OF THE WILD RICE SULFATE STANDARD – PARTRIDGE RIVER
Draft MPCA Staff Recommendation ‐ August 27, 2012 Update/Clarification) and
REVISED DRAFT (Reflecting Tribal Staff Feedback) WATERS USED FOR PRODUCTION OF WILD RICE –
PARTRIDGE AND EMBARRASS RIVERS, MPCA Draft Staff Recommendation – August 13, 2012
Page 30
4
• Beavers (see water levels and fluctuations)
• Climate change
If the concern is the impairment of waters used for the production of wild rice, the agency
should take these into account, particularly in waters where sulfate concentrations exceed 10
mg/L. As we saw in 2012, high water levels (in the northeastern part of Minnesota) and
drought (elsewhere) caused large reductions in wild rice production. All of these factors need
to be considered when determining whether or not specific water used for the production of
wild rice is impaired, and whether or not that impairment is due to sulfate concentrations.
d. Among these other factors are the morphology of the river, the parent geologic
material through which the river flows, and the substrate of the water body within
which rice is growing.
In a study conducted by Barr Engineering for PolyMet3, it was determined that river
morphology and landforms “appear to play an important role in development of river features
that enhance water-level stability”. A copy of the executive summary and some figures from
this report is provided in Attachment A.
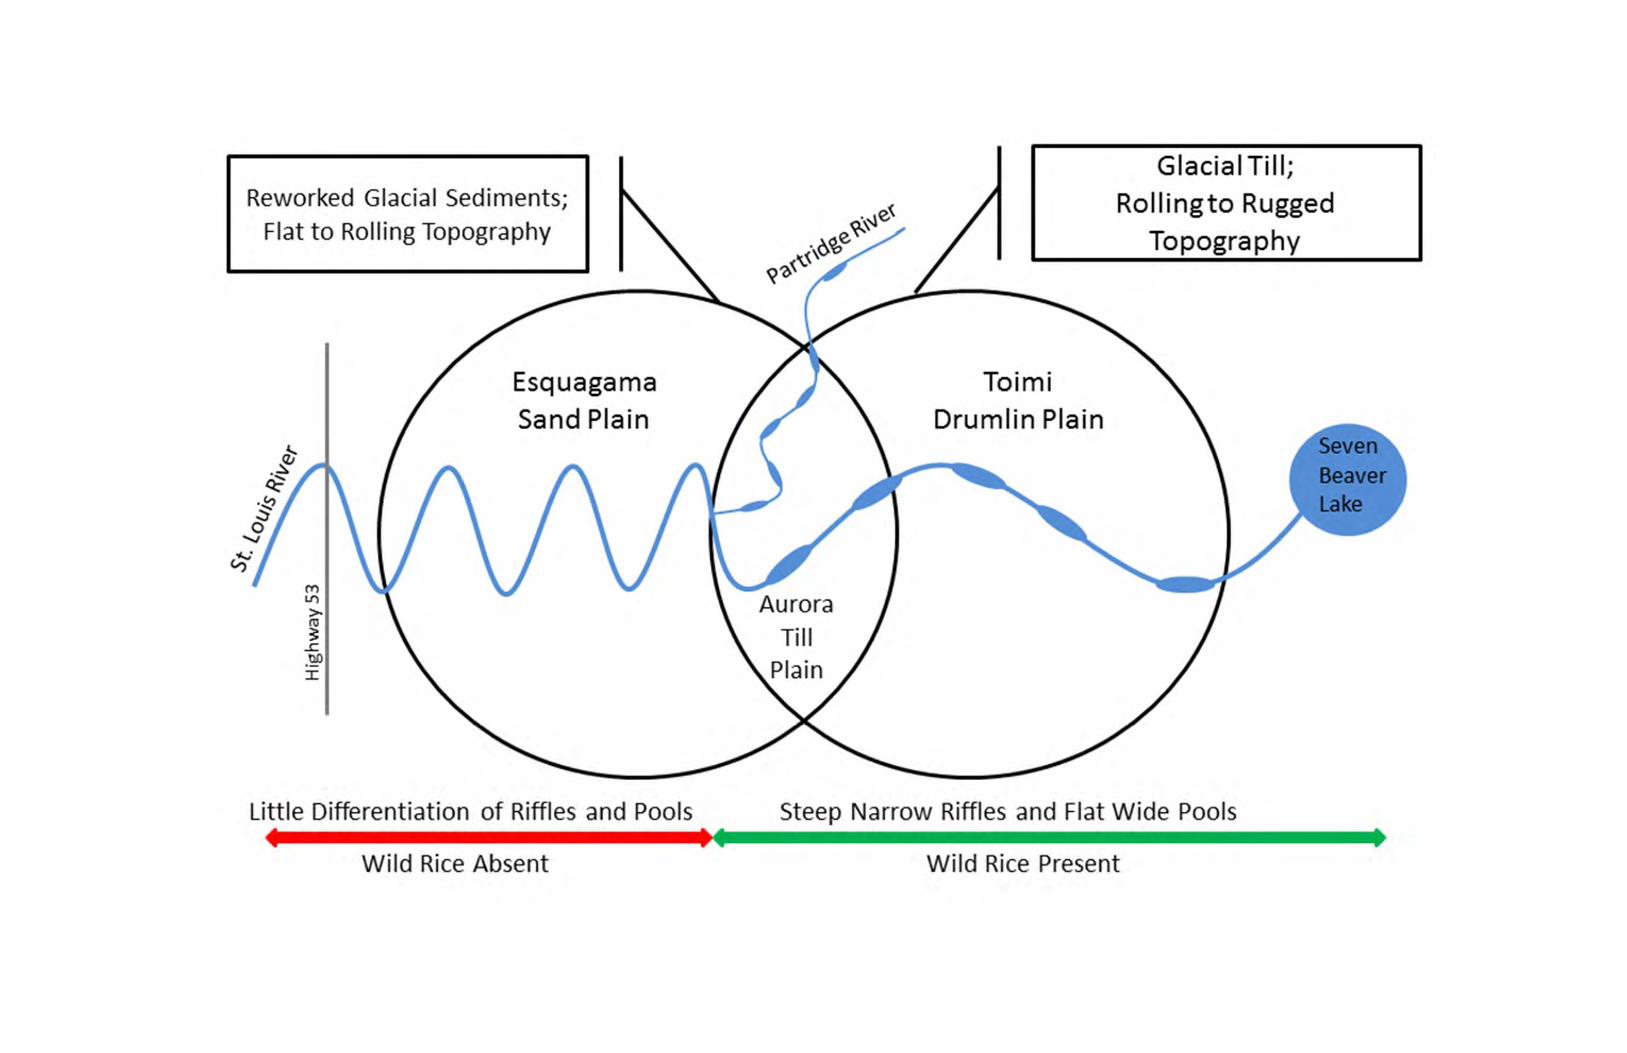
“Landforms appear to play an important role in development of river features that
enhance water-level stability. Within the study area, the Upper St. Louis and Partridge
Rivers flow through three distinct geomorphologic areas; the Toimi Drumlin Plain, the
Aurora Till Plain and the Esquagama Sand Plain. In this memorandum, the portion of the
St. Louis River above the confluence with the rivers assume distinct channel, floodplain
and bank characteristics within each geomorphologic area, and wild rice is observed to
occur in the areas where the resultant river morphology provides pools with shallow
water, a slow current, a mucky bottom and stable water levels (Figure 1-A). Partridge
River is referred to as the “upper study area” and the portion below the confluence is
referred to as the “lower study area.”
• In the upper study area, the Toimi Drumlin Plain is rocky glacial till with rugged
topography. Lowland wetlands and associated stream channels widen between
3 Influence of Geomorphology on Wild Rice Occurrence in the Upper St. Louis River, Barr Engineering, April, 2013
Page 31
5
hills of compacted, dense till. The resulting river morphology is characterized by
wide, deep, slow-moving pools connected by steep, rocky riffles. There is
slightly more Organic Matter content in the sediment in the upper study area
compared to the lower study area. The upper study area has slightly acidic soils
with pH of ~5.6. Wild rice is present in pools in the upper study area.
• The Aurora Till Plain is a transitional zone. The glacial till in this area has been
reworked and sorted. It is flatter and less rugged than in the Toimi Drumlin Plain,
but still offers the topographic and lithologic variety to create river morphology
of distinct rocky riffles and proportionately wider pools with mucky bottoms.
Wild rice is present in some pools in the Aurora Till Plain.
• In the lower study area, the Esquagama Sand Plain is relatively flat. The river
channel meanders with a relatively constant channel width. Pools in the lower
study area are not significantly wider than the riffles, current velocities are higher
and stream bed sediments are coarser. There is slightly less Organic Matter
content in the lower study area compared to the upper study area. The lower
study area has slightly less acidic soils than the upper study area with pH of
~6.1 to 7.3. Wild Rice is not present in the lower study area.”
e. This approach does not appear to follow existing MPCA and US EPA guidance on
conducting assessments of biological impairments
For the 2012 Impairment Listing process, MPCA produced a set of guidelines for the 2012
impaired water assessment cycle.4 In that guidance, MPCA notes that it uses the US EPA
Consolidated Assessment and Listing Methodology (CALM). We would urge the agency to
follow that approach in this listing, and to follow the other portions of the guidance.
f. This approach uses the wrong statistical approaches
1. The use of a 0.1 level of significance rather than the 0.05 level of
significance routinely used in biological assessments
4 Ibid.
Page 32
6
As we discussed at the May 1 Advisory Committee meeting, we strongly
recommend the use of a 0.05 level of significance rather than a 0.1 level of
significance. A 0.05 significance level is the accepted statistical default for
assessing biological, ecological, and toxicological risk; deviation from this default
value must be fully rationalized and the impacts on the numbers of waters that will
be listed as impaired using a 0.10 significance level should be made transparent to
all affected parties. Use of a 0.1 level of significance could result in a greater
possibility of listing as impaired a lake that can support rice when using the 0.1
level of confidence for determining acceptability than if using the 0.05 level of
confidence. As noted above, given the “regulatory and monetary implications of
303(d) listing”, efforts should be made to minimize potentially “false positive
listings, particularly given the relatively small amount of data on which these
decisions will be made
We understand that the Agency has engaged staff statisticians to begin addressing
this concern, which could have serious and long-lasting repercussions on any
impairment listing process. This is encouraging, and we would further encourage
the agency to enlist statisticians outside of the agency to think through this
important issue.
Thank you for the opportunity to comment on this matter. Please contact me if you have questions.
Attachments
A: Influence of Geomorphology on Wild Rice Occurrence in the Upper St. Louis River (executive
summary and figures)
Page 33
Technical Memorandum
From: Rachel Walker, Daniel DeJoode, Melisa Pollak and Jeff Weiss, Barr Engineering Co.
Subject: Influence of Geomorphology on Wild Rice Occurrence in the Upper St. Louis River
Date: April 2013
Executive Summary
Wild Rice occurs in the Upper St. Louis River and in the Partridge River above their confluence but not
below it. The confluence also marks a change in the physical characteristics (morphology) of these
rivers. River morphology is among the key factors that influence wild rice habitat, along with biotic
factors, chemical variables, energy sources, and climate. River morphology is in turn a direct result of
the landforms (geomorphology) through which the river flows. This study explores the relationship
between geomorphology, river morphology, and wild rice habitat. Specifically, it focuses on the
relationship between river morphology and wild rice presence in 2012.
It is well known that favorable physical habitat for wild rice includes shallow water with a slow current, a
mucky bottom and stable water levels. Of these characteristics, water-level stability is the most difficult
to directly document because flood events are transient. Maximum current velocity and water-level
bounce may be limiting factors in whether wild rice can grow in a particular river pool, but timing survey
observations to record maximum values is tricky, and after the fact, indirect indicators may be imprecise
or altogether absent.
This study offers screening-level observations on river morphologic features that influence water-level
stability in the study area, and notes that wild rice is present in river reaches where river features limit
water-level bounce, and absent where these features are absent. We find that river pool width relative
to riffle width, and pool width relative to the drainage area above the pool, appear to be promising
indicators of water-level stability and wild rice habitat potential. Specifically, wider pools allow flood
water to slow more and rise less than in narrower pools. And smaller drainage areas gather less flood
water, subduing water level bounce relative to larger drainage areas. These relationships are intuitive,
but to the best of our knowledge, have not been systematically studied in the context of their role in
establishing minimum physical habitat characteristics for wild rice growth and development.
Landforms appear to play an important role in development of river features that enhance water-level
stability. Within the study area, the Upper St. Louis and Partridge Rivers flow through three distinct
geomorphologic areas; the Toimi Drumlin Plain, the Aurora Till Plain and the Esquagama Sand Plain. In
this memorandum, the portion of the St. Louis River above the confluence with the rivers assume
distinct channel, floodplain and bank characteristics within each geomorphologic area, and wild rice is
observed to occur in the areas where the resultant river morphology provides pools with shallow water,
a slow current, a mucky bottom and stable water levels (Figure 1-A). Partridge River is referred to as the
“upper study area” and the portion below the confluence is referred to as the “lower study area.”
Page 34
• In the upper study area, the Toimi Drumlin Plain is rocky glacial till with rugged topography.
Lowland wetlands and associated stream channels widen between hills of compacted, dense
till. The resulting river morphology is characterized by wide, deep, slow-moving pools
connected by steep, rocky riffles. There is slightly more Organic Matter (OM) content in the
sediment in the upper study area compared to the lower study area. The upper study area has
slightly acidic soils with pH of ~5.6. Wild rice is present in pools in the upper study area.
• The Aurora Till Plain is a transitional zone. The glacial till in this area has been reworked and
sorted. It is flatter and less rugged than in the Toimi Drumlin Plain, but still offers the
topographic and lithologic variety to create river morphology of distinct rocky riffles and
proportionately wider pools with mucky bottoms. Wild rice is present in some pools in the
Aurora Till Plain.
• In the lower study area, the Esquagama Sand Plain is relatively flat. The river channel meanders
with a relatively constant channel width. Pools in the lower study area are not significantly
wider than the riffles, current velocities are higher and stream bed sediments are coarser.
There is slightly less Organic Matter content in the lower study area compared to the upper
study area. The lower study area has slightly less acidic soils than the upper study area with pH
of ~6.1 to 7.3. Wild Rice is not present in the lower study area.
Page 35
Figure 1-A Relationship between geomorphology, river morphology, and wild rice habitat on the
St. Louis River
Page 36
#*#*
#*
#* #*
#*
#*
#*
#*
#*
#*
#*
#*
#*
#*
#*
#*
#*
#*
#*
#*
#*
#*
#* #* #*
#*
#*#*
#*
#*
#* #*
#*
#* #*
#*
#*#*
#*
#*
#*
#*
#*
#*
#*#*
#*
#*
#*
Skibo Landing
US Hwy 53
©̈957
©̈346
190188186
184182180
178
176
174
172
170
168
166
164162
160158
156
154
152
150148
146
144142
140138
136134
Ely
Whitewater
Colby
Loon
Whiteface Reservoir
Pleasant
Esquagama
Embarrass
Otto
Bass
Markham
Minorca Pit
Anchor
Inland Laurentian
Long
Mud Hen
Cedar
Greenwood
Unnamed
Tamarack Lowlands
Toimi Uplands
Laurentian UplandsNashwauk Uplands
976
5
43
2
1
20
19
181716
15
1413
12
1110
£¤53
135
37
4567110
456716
4567108
456796
45674
456795
4567130
4567138
456793
4567100
456797
456799
4567111
456720
4567105
4567108
4567110
4567108
456797
456720
Saint Louis R iver
Reno
Creek
Mud
Hen Creek
Shive
r Creek
Water Hen
Creek
Ely Creek
Colvin Creek
North Branch Whiteface River
PikeRiver
South Bra
nchWater Hen Creek
Partri
dgeR
iver
Bum Cree
k
Firs t Cree k
Little
Shive
r Cree
k
Laird C
reek
Porcu
pine Creek
Apple
Cree
k
Wallow Creek
West B
ran
ch Cloque
t River
Hush
Cree
kPa
rtridge
River
Large Figure 2STUDY AREA
LAND TYPE ASSOCIATIONSNorthMet Project
Poly Met Mining, Inc.Hoyt Lakes, Minnesota
Barr
Foote
r: ArcG
IS 10
.1, 20
13-0
4-24 0
8:44 F
ile: I:
\Clie
nt\Po
lyMet_
Minin
g\Work
_Orde
rs\W
ild_R
ice\M
aps\R
epor
ts\Ge
omor
pholo
gicDe
sktop
Analy
sis_F
ieldS
tudy\R
epor
t_Figu
res_
2012
0124
\Large
Figu
re 2 L
and T
ype A
ssoc
iation
s.mxd
Use
r: KJ
M
#* River MilesStudy AreaOther Rivers and StreamsEcological Subsection
Land TypesAurora Till PlainBig-Bird Lake Moraine
Esquagama Sand PlainFloodwood PeatlandsGreenwood Lake Till PlainMesabi RangePike-Sandy River Sand PlainToimi Drumlin PlainWarba Lake Plain
I0 10,000 20,0005,000
Feet
Page 37
#*#*
#*
#* #*
#*
#*
#*
#*
#*
#*
#*
#*
#*
#*
#*
#*
#*
#*
#*
#*
#*
#*
#* #* #*
#*
#*#*
#*
#*
#* #*
#*
#* #*
#*
#*#*
#*
#*
#*
#*
#*
#*
#*#*
#*
#*
#*
Skibo Landing
US Hwy 53
160162
190188
186184
182180
178
176
174
172
170
168
166
164158
156
154
152
150148
146144
142140
138
136134
1196' 1003'
9935'
5372'
5243
'
4076'
4006'
3717'
3100' 2968'
2206'
2125'2067'
1769'
1736'
1631'
1628'
1477'
1468'
1461'
1381'
1365'
1279'
950'
1146'
905'
899'1084'
1054
'
1031'
1002'
715'
689'
719'
547'
541'
502'
470'
452'441'
425'
401'
380'
352'
328'
325'
280'
255'
244'239'
177'
143' 2390'
1290'1288'
1176'
1107'622'
432'
366'
315'
258'
220'
Ely
Whitewater
Colby
Loon
Whiteface Reservoir
Pleasant
Esquagama
Embarrass
Otto
Bass
Markham
Minorca Pit
Anchor
Inland Laurentian
Long
Mud Hen
Cedar
Greenwood
Bird
Stone
Hush
Little Butterball
Lillian
Mesabi Mt. Pit
9
8
76
5
43
2
1
20
19
181716
15
1413
12
1110
£¤53
135
37
4567110
456716
4567108
456796
45674
456795
4567130
4567138
456793
4567100
456797
456799
4567111
456720
4567105
4567108
4567110
4567108
456797
456720
Sa int Lou is River
Reno
Creek
Mud
Hen Creek
Sh
iver Cree
k
Water Hen
Creek
Ely Creek
Colvin Creek
North Branch Whiteface River
PikeRiver
South Bra
nchWater Hen Creek
Pa
rtridge
River
Bum Cree
k
First Creek
Little
Shive
r Cree
k
Laird C
reek
Porcu
pine Creek
Apple
Cree
k
Wallow Creek
Emba
rrass
River
West B
ran
ch Cloque
t River
Cranberry Creek
Hush
Cree
k
Large Figure 4STUDY AREA, BASIN WIDTH,
FLOODPLAIN, AND WATERSHEDSNorthMet Project
Poly Met Mining, Inc.Hoyt Lakes, Minnesota
Barr
Foote
r: ArcG
IS 10
.1, 20
13-0
4-24 0
8:49 F
ile: I:
\Clie
nt\Po
lyMet_
Minin
g\Work
_Orde
rs\W
ild_R
ice\M
aps\R
epor
ts\Ge
omor
pholo
gicDe
sktop
Analy
sis_F
ieldS
tudy\R
epor
t_Figu
res_
2012
0124
\Large
Figu
re 4 B
asin
Widt
h Floo
dplai
n Bou
ndary
and W
atersh
eds.m
xd U
ser: K
JM
#* River Miles
Study Area
Other Rivers and Streams
Basin Width Measurement
Floodplain BoundaryWatersheds
Embarrass River
Headwaters Saint Louis River
Partridge River
Sand Creek-Saint Louis River
Outside of Study Area
Small section at Skibo Landing Paddled in 2012Norway Point
CR 4
CR 108
CR 95
CR 957
CR 346
©̈957
©̈346
I0 10,000 20,0005,000
Feet
Page 38
!>
!>
!>
Skibo Landing
US Hwy 53
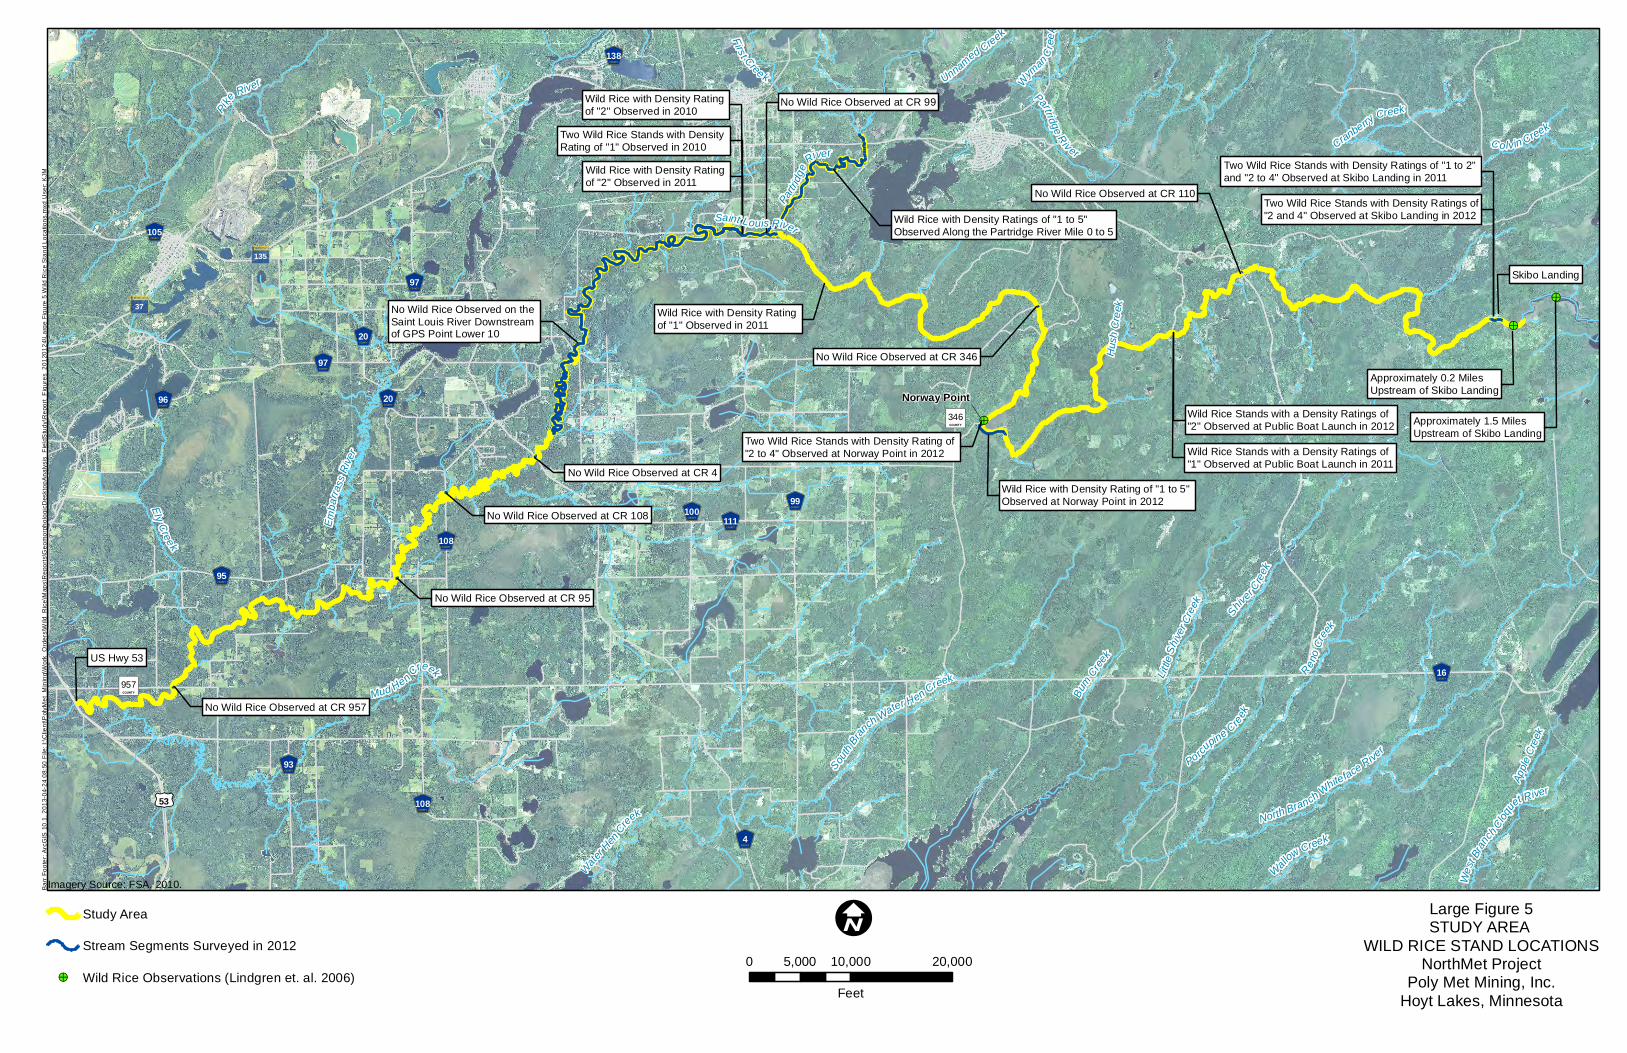
No Wild Rice Observed on the Saint Louis River Downstream of GPS Point Lower 10
Wild Rice with Density Rating of "1 to 5" Observed at Norway Point in 2012
Two Wild Rice Stands with Density Ratings of"2 and 4" Observed at Skibo Landing in 2012Wild Rice with Density Ratings of "1 to 5"
Observed Along the Partridge River Mile 0 to 5
No Wild Rice Observed at CR 4
No Wild Rice Observed at CR 108
No Wild Rice Observed at CR 95
No Wild Rice Observed at CR 957
No Wild Rice Observed at CR 346
No Wild Rice Observed at CR 110
Wild Rice Stands with a Density Ratings of"2" Observed at Public Boat Launch in 2012
©̈957
©̈346
Two Wild Rice Stands with Density Ratings of "1 to 2" and "2 to 4" Observed at Skibo Landing in 2011
Wild Rice Stands with a Density Ratings of"1" Observed at Public Boat Launch in 2011
Two Wild Rice Stands with Density Rating of "2 to 4" Observed at Norway Point in 2012
Wild Rice with Density Rating of "1" Observed in 2011
Wild Rice with Density Rating of "2" Observed in 2011
No Wild Rice Observed at CR 99
Two Wild Rice Stands with Density Rating of "1" Observed in 2010
Wild Rice with Density Rating of "2" Observed in 2010
Saint Louis River
Reno C
reek
Mud Hen Creek
Sh
iver Cree
k
Water Hen
Creek
Ely Creek
Colvin Creek
North Branch Whiteface River
Pike River
South Bra
nch Water Hen Creek
Partri
dgeR
iver
Bum Cree
k
First Cree k
Little
Shive
r Cree
k
Porcupine Cree
k
Apple
Cree
k
Wallow Creek
Unnamed CreekWyman
Cree
k
Emba
rrass
River
West B
ran
chClo
quet River
Cranberry Creek
Hush
Cree
k
Partridge River
£¤53
135
37
456716
4567108
456796
45674
456795
4567138
456793
4567100
456797
456799
4567111
456720
4567105
456797
4567108
456720
Large Figure 5STUDY AREA
WILD RICE STAND LOCATIONSNorthMet Project
Poly Met Mining, Inc.Hoyt Lakes, Minnesota
Barr
Foote
r: ArcG
IS 10
.1, 20
13-0
4-24 0
8:50 F
ile: I:
\Clie
nt\Po
lyMet_
Minin
g\Work
_Orde
rs\W
ild_R
ice\M
aps\R
epor
ts\Ge
omor
pholo
gicDe
sktop
Analy
sis_F
ieldS
tudy\R
epor
t_Figu
res_
2012
0124
\Large
Figu
re 5 W
ild R
ice S
tand L
ocati
ons.m
xd U
ser: K
JM
Study Area
Stream Segments Surveyed in 2012
!> Wild Rice Observations (Lindgren et. al. 2006)
Imagery Source: FSA, 2010.
Norway PointApproximately 0.2 Miles Upstream of Skibo Landing
Approximately 1.5 Miles Upstream of Skibo Landing
I0 10,000 20,0005,000
Feet
Page 39
#*
#*
E
Saint Louis R iver
Lower 12
148
146
4567108
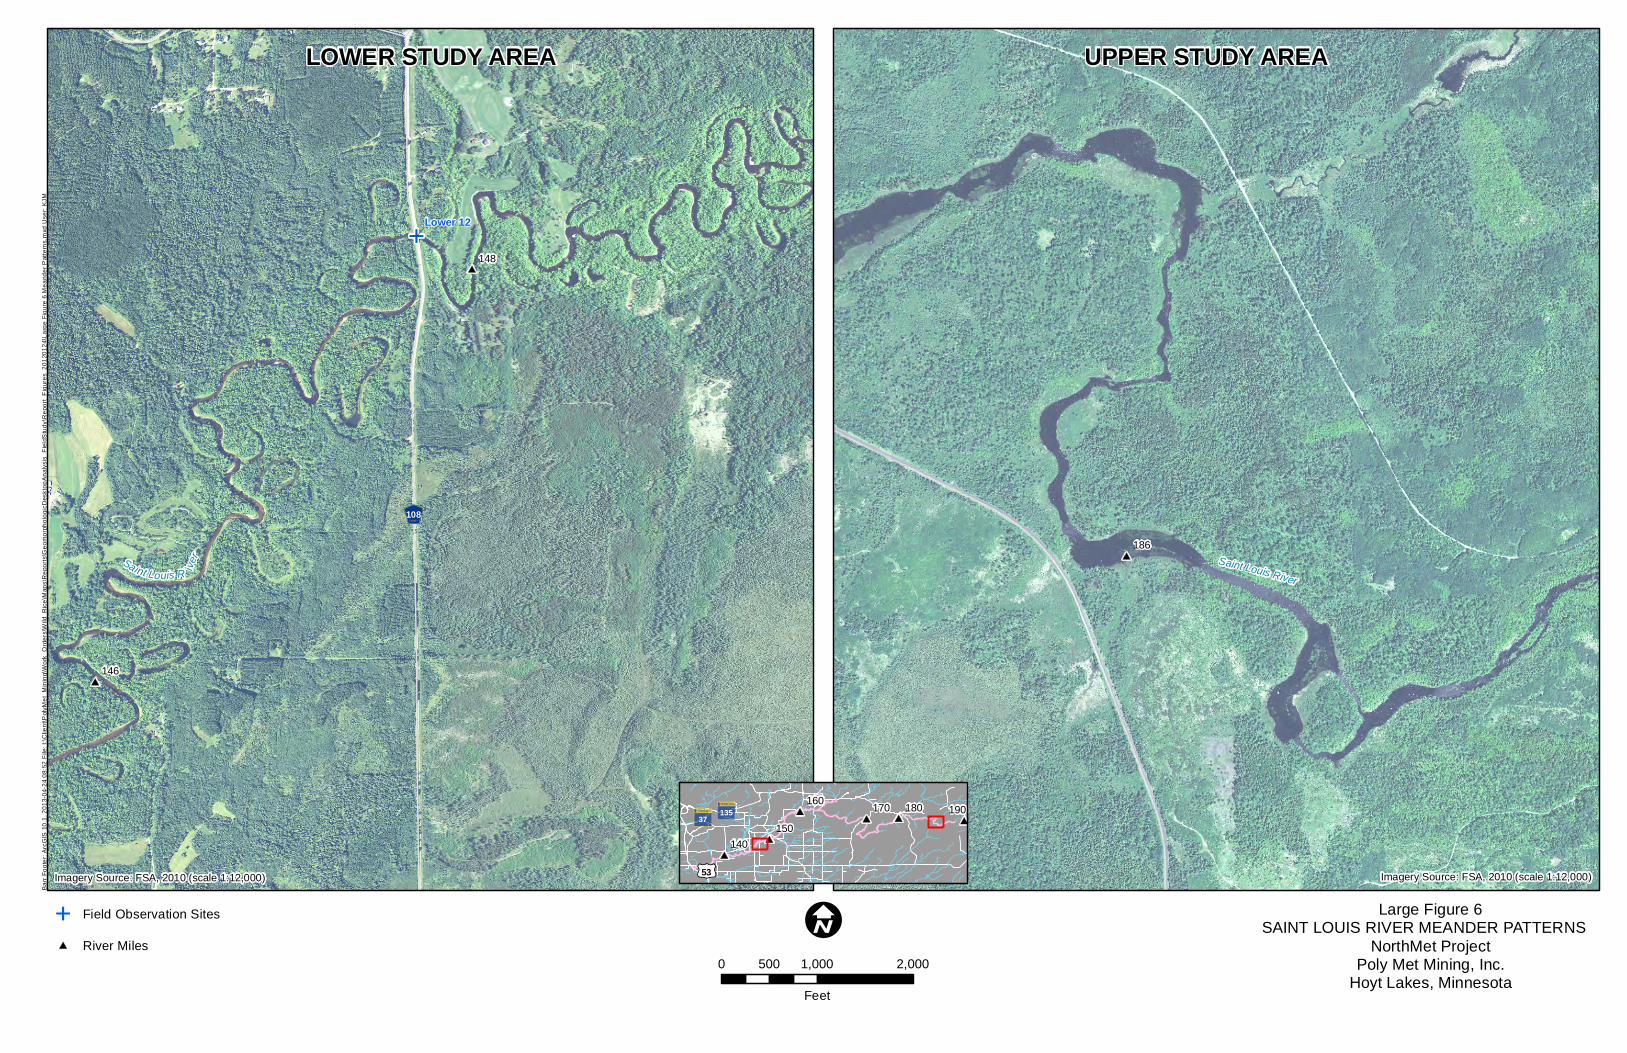
Large Figure 6SAINT LOUIS RIVER MEANDER PATTERNS
NorthMet ProjectPoly Met Mining, Inc.
Hoyt Lakes, Minnesota
Barr
Foote
r: ArcG
IS 10
.1, 20
13-0
4-24 0
8:52 F
ile: I:
\Clie
nt\Po
lyMet_
Minin
g\Work
_Orde
rs\W
ild_R
ice\M
aps\R
epor
ts\Ge
omor
pholo
gicDe
sktop
Analy
sis_F
ieldS
tudy\R
epor
t_Figu
res_
2012
0124
\Large
Figu
re 6 M
eand
er Pa
tterns
.mxd
Use
r: KJM
E Field Observation Sites#* River Miles
Imagery Source: FSA, 2010 (scale 1:12,000)
I0 1,000 2,000500
Feet
#*186
Saint Louis River
UPPER STUDY AREALOWER STUDY AREA
#*#*
#*
#*#* #* #*
£¤53
190180170160
150140
13537
Imagery Source: FSA, 2010 (scale 1:12,000)


![Wilson MPCA China Presentation FINAL …...Microsoft PowerPoint - Wilson MPCA China Presentation FINAL Compressed Pics [Compatibility Mode] Author Minnesota Pollution Control Agency](https://static.documents.pub/doc/80x56/5f2f734a0320f36ca4767107/wilson-mpca-china-presentation-final-microsoft-powerpoint-wilson-mpca-china.jpg)


