24
Transportation Asset Management Case Studies PAVEMENT MANAGEMENT SYSTEMS The Washington State Experience Presented by
c1Transportation Asset Management Case Studies
PAV E M E N T M A N AG E M E N T S Y S T E M SThe Washington State Experience
Presented by
A comprehensive, fully integrated Transportation AssetManagement System weaves together information on allasset inventories, condition and performance databases,
and alternative investment options.
Asset Management Primer, p. 22.Federal Highway Administration,
December 1999
Note From the Director
With such factors as an aging national infrastructure, increasing congestion,expanding traffic, and limited funds weighing heavily on transportationagencies, State departments of transportation are looking for innovativeways to manage and maintain their transportation assets.
One tool that continues to provide great benefits is Transportation AssetManagement (TAM), a strategic approach that strives to provide the bestreturn for each dollar invested by maximizing system performance, improv-ing customer satisfaction, and minimizing life-cycle costs. TAM practicesinfluence transportation decisionmaking by providing decisionmakers withpowerful tools to help identify priorities.
TAM endeavors vary from State to State and include efforts in the areasof pavement and bridge management, network preservation, economics inasset management, life-cycle cost analysis, highway safety and operations,and data integration, among others. Because each State’s experience isunique—and because FHWA believes that transportation agencies workmore efficiently when information on one another’s successes is shared—theOffice of Asset Management is continuing its series of TAM case studyreports begun in 2002.
On behalf of the Office of Asset Management, I am pleased to presentthis case study on the application of pavement management systems forengineering and economic analysis and decisionmaking. Pavement man-agement systems can be effectively used to perform engineering analysis toimprove design, construction, and preservation practices and to supportdecisionmaking processes by prioritizing pavement preservation and reha-bilitation needs. This case study provides good examples of the WashingtonState Department of Transportation’s application of their pavement man-agement system for economic and engineering analysis. I believe that thisand other case studies generated by the Office of Asset Management willhelp transportation agencies meet the increasingly complex challenges fac-ing them today.
Julius (Butch) WlaschinDirector, Office of Asset ManagementApril 2008
2
Note to the Reader
The Transportation Asset Management case study series is theresult of partnering between State departments of transporta-tion and the Federal Highway Administration’s (FHWA’s) Officeof Asset Management. FHWA provides the forum, and theStates furnish the details of their experiences with asset man-agement.For each case study, State transportation staff are inter-
viewed, the information is compiled, and the State approvesthe resulting material. Thus, the case study reports rely on theagencies’ own assessment of their experience. Readers shouldnote that the reported results may not be reproducible in otherorganizations. �
3
Executive Summary
The Washington State Department ofTransportation (WSDOT) has achieved adramatic improvement in the conditionof its highways since it began its pave-ment condition survey program in themid 1960s and pavement managementsystem in the 1970s. The departmenthas conducted a pavement condition survey on the entireState highway system every 2 years since 1969 and every yearsince 1988. In the late 1970s, WSDOT developed the first ver-sion of its Washington State Pavement Management System(WSPMS) and has been refining and using it since to managethe State’s pavements. The portion of pavement in good con-dition increased from 50 percent in 1970 to 93.5 percent in2005.The WSPMS contains annual pavement condition data and
detailed construction and traffic history data for the State’s28,800 lane-km (17,900 lane-mi) of highways. WSDOT usespavement structural condition as a trigger value to identifycandidate pavement projects. Analysts use these data togeth-er with information from other WSDOT databases to predictthe optimal time for pavement rehabilitation activities and toprioritize rehabilitations over a multiyear investment cycle.In 1993, legislation required that projects be selected on the
basis of lowest life-cycle cost. Through life-cycle cost analysis,WSDOT determined that there is a 2- to 3-year optimal windowduring which a hot-mix asphalt pavement can be rehabilitatedat the lowest life-cycle cost. Although initially only agency costswere used in the lowest-life-cycle-cost approach, more recent-ly threshold values for rutting, which affects safety and rough-ness, have been implemented to address user costs.WSDOT has also long utilized the WSPMS to conduct engi-
neering and economic analyses for the purposes of improvingpavement performance and maximizing the benefits of pave-ment investments. These analyses include various studiesamong which pavement smoothness, lowest-life-cycle-costconcept versus the worst-first methodology, impact of increas-ed use of chip seal on highways, performance of dowel barretrofits, and a few others are briefly mentioned in this casestudy.
The portion of pavement ingood condition increasedfrom 50 percent in 1970 to93.5 percent in 2005.
4
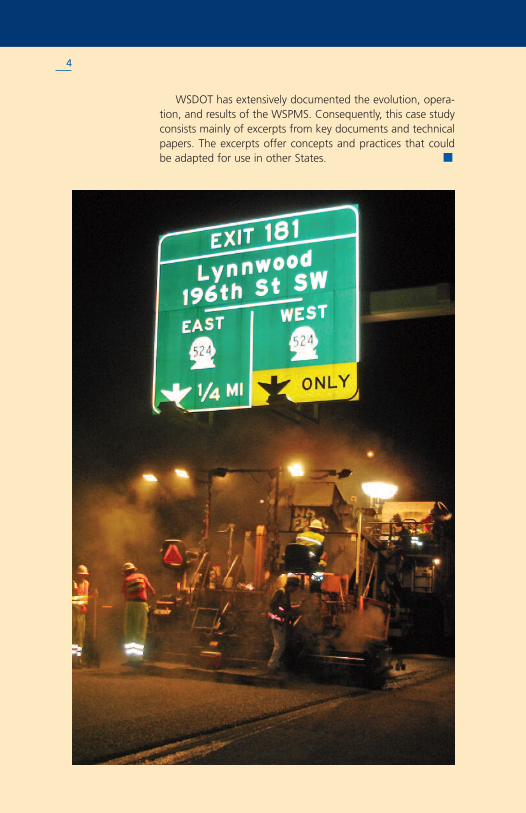
WSDOT has extensively documented the evolution, opera-tion, and results of the WSPMS. Consequently, this case studyconsists mainly of excerpts from key documents and technicalpapers. The excerpts offer concepts and practices that couldbe adapted for use in other States. �
5
INTRODUCTION
The Evergreen State, as Washington is called, is the 18th largest State inthe Nation and the only State named after a president. It is bordered byCanada to the north, Oregon to the south, Idaho to the east, and thePacific Ocean to the west. The highest point in the State is Mt. Rainier at4,392 m (14,410 ft) above sea level; the lowest, the coastline at sea level.
While 580 km (360 mi) long and 386 km (240 mi) wide, WashingtonState contains six distinct geographic areas: the Olympic Mountains, theCoast Range, the Puget Sound Lowlands, the Cascade Mountains, theColumbia Plateau, and the outlying subrange of the Rocky Mountains.The State’s climate ranges from a wet marine environment that receives asmuch as 4 m (160 in.) of precipitation annually to a rain shadow area eastof the Cascades that averages only 0.15 m (6 in.) of precipitation a year.These features—and a rapidly expanding population of more than 6 mil-lion—make managing transportation assets in this ruggedly beautiful Statea challenge.
In the mid 1960s, to satisfy legislative requirements for a priority pro-gramming process, the Washington State Department of Transportation(WSDOT) developed a pavement condition survey program as part of apavement management system. The department has conducted a pave-ment condition survey on 100 percent of the State highway system every2 years since 1969 and every year since 1988. A manual, or windshield,survey was used to collect distress data until 1998. In 1999, WSDOTbegan using an automated pavement condition survey vehicle.
In 1982, WSDOT fully implemented the Washington State PavementManagement System (WSPMS). The system’s development is explained in“An Assessment of the Benefits of the Washington State Pavement Man-agement System:”1
In an attempt to provide a tool that will not only help in identifying the pres-ent needs of the state highway system but also in evaluating the decisions madeand forecasting future needs, WSDOT conducted a feasibility study of a pave-ment management system in the early 1970s. Development of the pavementmanagement system, referred to as the WSPMS, started in the late 1970s andwas first implemented during the 1982 programming cycle.
The WSPMS was developed entirely in-house, and it has evolved overthe years to be one of the best systems in the Nation. It is used for both
6
project-level and network-level analyses. At the network level, pavementdata are analyzed, and performance curves for more than 9,000 structural-ly uniform pavement sections are generated and evaluated for program-ming and engineering purposes. The current WSPMS is a Microsoft Win-dows–based program that will be replaced by WebWSPMS in the nearfuture. WebWSPMS is a Web-based pavement management applicationthat will provide access to pavement management information and toolscustom-tailored to the individual user.
The WSPMS contains the following data: annual pavement conditiondata, including cracking data since 1969, International Roughness Index(IRI), and rutting data since 1999; and detailed construction and traffichistory data for the 28,800 lane-km (17,900 lane-mi) of the WashingtonState route system.2
PAVEMENT CONDITION IN WASHINGTON
Washington State Highway Pavements: Trends, Conditions, and StrategicPlan3 categorizes the WSDOT route system in three pavement types:
• Hot-mix asphalt pavement: 17,342 lane-km (10,776 lane-mi),60 percent of network.
• Bituminous surface treatment: 4,843 lane-km (4,843 lane-mi),27 percent of network.
• Concrete pavement: 3,640 lane-km (2,262 lane-mi), 13 percent ofnetwork.
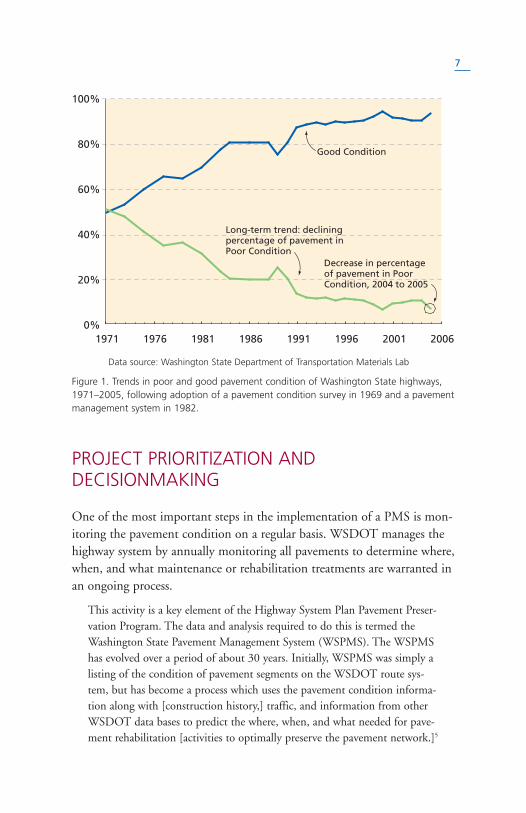
The Gray Notebook for the quarter ending December 31, 2006,4 states,“According to the 2005 pavement condition survey, the percentage of allpavements in the ‘good’ category increased from 89.9 percent in 2004 to93.5 percent in 2005, [which is] an overall increase of 3.6 percent” (p. 53).
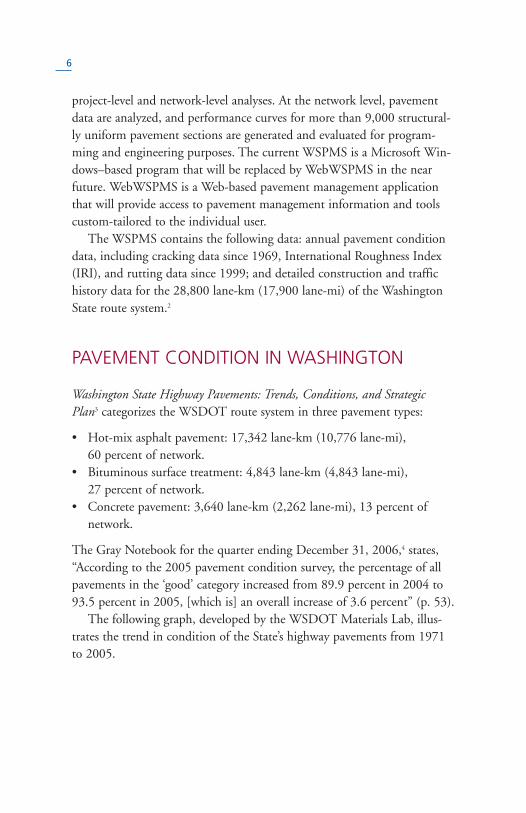
The following graph, developed by the WSDOT Materials Lab, illus-trates the trend in condition of the State’s highway pavements from 1971to 2005.
7
PROJECT PRIORITIZATION ANDDECISIONMAKING
One of the most important steps in the implementation of a PMS is mon-itoring the pavement condition on a regular basis. WSDOT manages thehighway system by annually monitoring all pavements to determine where,when, and what maintenance or rehabilitation treatments are warranted inan ongoing process.
This activity is a key element of the Highway System Plan Pavement Preser-vation Program. The data and analysis required to do this is termed theWashington State Pavement Management System (WSPMS). The WSPMShas evolved over a period of about 30 years. Initially, WSPMS was simply alisting of the condition of pavement segments on the WSDOT route sys-tem, but has become a process which uses the pavement condition informa-tion along with [construction history,] traffic, and information from otherWSDOT data bases to predict the where, when, and what needed for pave-ment rehabilitation [activities to optimally preserve the pavement network.]5
100%
80%
60%
40%
20%
0%
Good Condition
Decrease in percentageof pavement in PoorCondition, 2004 to 2005
Long-term trend: decliningpercentage of pavement inPoor Condition
1971 1976 1981 1986 1991 1996 2001 2006
Data source: Washington State Department of Transportation Materials Lab
Figure 1. Trends in poor and good pavement condition of Washington State highways,1971–2005, following adoption of a pavement condition survey in 1969 and a pavementmanagement system in 1982.
8
The WSPMS uses pavement struc-tural condition (PSC) as a triggervalue to identify candidate pavementprojects, as described in the follow-ing paragraphs:
Overall pavement distress is termedpavement structural condition (PSC)
and is calculated separately for flexible and rigid pavements. The PSC hasan upper limit of 100 (no distress) and a lower limit of zero (extensive dis-tress). WSDOT attempts to program rehabilitation for pavement segmentswhen they are projected to reach a PSC of 50.6
WSDOT has given careful consideration to the formulation and inter-pretation of the PSC itself, and the value of the PSC threshold, in termsof how pavement rehabilitation projects in Washington should be pro-grammed. Cost analyses [lowest life-cycle cost] performed by WSDOTshow that unit costs of rehabilitation increase by a factor of three to fourfor [hot-mix asphalt (HMA)] projects programmed at a PSC of zerocompared to projects programmed at a PSC of 40 to 60.7
Initial development of threshold values for lowest-life-cycle costapproach was based only on agency costs and did not include user costs….Threshold values for rutting to address safety and roughness to address usercost were subsequently implemented in identifying [candidate] projects.8
WSDOT employs the following process to develop a prioritized list ofprojects.
Using the pavement condition and performance curves, the WSPMS canforecast the expected [optimum] time to the next rehabilitation for eachpavement section. Each candidate project is assigned to a priority groupaccording to its predicted “due date.”9
For example, if a pavement section is expected to reach a PSC equal to50 in 2008, then the pavement section is considered “due” for rehabilita-tion in 2008.
Priority groups are defined by individual year only for those six years thatare encompassed by the investment program. These priority groups, takencollectively, form the priority listing of pavement preservation needs. Thepriority listing is a useful tool for the central [headquarter] office, programmanagers and the regions in developing the biennial preservation program.However, the list is supplemented by [review of the digital images collected
Implementation of thepavement managementsystem by WSDOT has helpedthe State to improve itspavement conditionsignificantly.
9
as part of annual pavement condition data collection and] additional sitevisits to verify accuracy, assess causes of defects and determine abilities of themaintenance program to apply preventative or short term remedial treat-ments before a biennial program is developed.10
It should be noted that WSDOT takes into consideration the importanceof the candidate projects on high-volume routes while preparing the prior-ity list.
WSDOT attempts to rehabilitate high volume routes (interstate and princi-pal arterial routes) when they are “due” and prevents them from reachingthe “past due” category. Also, as part of the biennium rehabilitation projectsselection process, “past due” projects may be included if increased user costson high-volume routes justify their selection.11
Clearly, the focus of the WSDOT pavement management program is onpavement preservation. As mentioned previously, 27 percent of the entiresystem receives a bituminous surface treatment on a 6- to 8-year cycle.WSDOT applies this type of treatment to low-volume roads with anannual average daily traffic less than 2,000. Typically, 100 percent of chipseal projects that are due are programmed first. The remaining fundsaddress rehabilitation projects (nearly 90 percent of rehabilitation projectsare 50-mm [2-in.] overlay projects) with PSC values between 40 and 60,and if any funds are left, remaining past due projects will be programmed.
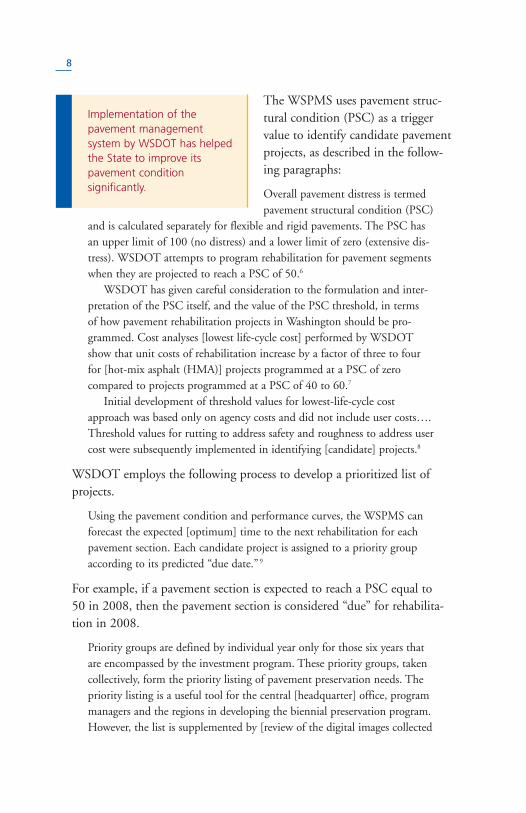
Implementation of the pavement management system by WSDOT hashelped the State to improve its pavement condition significantly. For allroute classifications (Interstate, Principal Arterial, Minor Arterial, andMajor Collector), the overall PSC scores from 1971 to 2006 are shown inFigure 2. As stated in Washington State Highway Pavements: Trends, Condi-tions, and Strategic Plan, May 199912 “it is notable how this conditionmeasure has improved since 1971—noteworthy is the reduction of thosepavements being in the very poor category from about 20 percent of thetotal lane-miles in the early 1970’s down to about one percent in 1994and later.”
In 1971, almost 50 percent of theState’s pavements were in poor andvery poor condition. Today, a littlemore than 10 percent of the roadsare in poor and very poor condition.
The pavement managementsystem can forecast theoptimal time for the nextrehabilitation for eachpavement section.
PMS APPLICATIONS IN ENGINEERING ANDECONOMIC ANALYSIS
Pavement management databases hold substantial amounts of data. Thisdata may be used for programming, economic analysis, and engineeringanalysis at both network and project levels. WSDOT has been using thePMS data effectively in performing various analyses to provide decision-makers with the information they need. The following examples of engi-neering and economic analyses performed by WSDOT are taken fromState documents.
10
100%
90%
80%
70%
60%
50%
40%
30%
20%
10%
0%1969 1973 1977 1981 1984 1988 1990 1992 1994 1996 1998 2000 2002 2004 200
Very good (100–80)
Good (79–60)
Fair (59–40)
Poor (39–20)
Very poor (19–0)
Figure 2. Trends in Washington State pavement structural condition, 1969–2006(statewide, all pavements).
Data source: Washington State Department of Transportation Materials Lab
11
I-5 Seattle Portland Cement Concrete PavementPerformance Study
WSDOT, the University of Washington, Parametrix, and Nichols Consult-ing joined together to investigate the performance of concrete pavementson I-5 in the Seattle area, [and the] report was scheduled to be completedby Fall 2007. This study will attempt to determine when [existing] con-crete pavements [constructed mostly during the 1960s and far beyondtheir initial design life of 20 years] on I-5 will fail and how much timeWSDOT has to plan and develop reconstruction projects before the pave-ments deteriorate to an unacceptable level.13
Investigation on the Potential Impact of Increased Use ofChip Seal Pavements on Highway System
WSDOT used the WSPMS to correlate traffic thresholds for the effectiveuse of chip seals on roadways with [annual] average daily traffic up to4,000 instead of the [WSDOT standard of ] 2,000 ADT. In 2005,WSDOT initiated a study with the University of Washington to investi-gate current chip seal application practices, determine whether chip sealscan be applied to higher trafficked routes (greater than current practice ofroutes with less than 2,000 vehicles per day), and determine the statewideeconomic impacts [that increased] chip seal [use may have.] Since theincreased use of chip seals [can] impact the performance of the stateowned route system, both a structural and an economic analysis isrequired.
The expected results of this study are:
• Criteria on the use of chip seals as a lower cost alternative to hot-mixasphalt overlays. Specifically, which WSDOT routes can be convertedto a chip seal with assurance that the structural adequacy will not becompromised.
• Criteria that examine whether WSDOT should consider alternatingchip seal and hot-mix asphalt paving cycles [to preserve structure whileminimizing cost].
• Insight into how to mitigate noise, roughness, performance, andconstruction issues.
• Improved manual on chip seal design and construction.
12
The economic analysis portion of this study is currently being finalized.The entire study was to be completed by Fall 2007 and shared in theDecember 2007 Gray Notebook.14
Worst-First to Lowest Life Cycle Cost
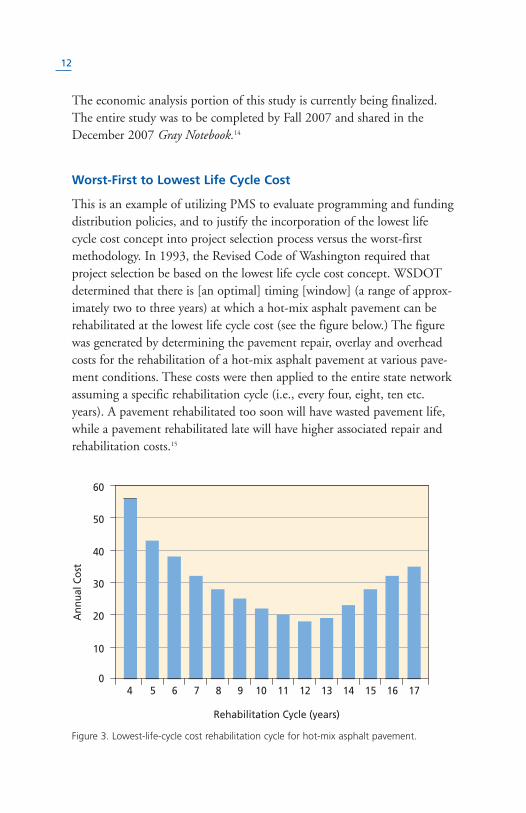
This is an example of utilizing PMS to evaluate programming and fundingdistribution policies, and to justify the incorporation of the lowest lifecycle cost concept into project selection process versus the worst-firstmethodology. In 1993, the Revised Code of Washington required thatproject selection be based on the lowest life cycle cost concept. WSDOTdetermined that there is [an optimal] timing [window] (a range of approx-imately two to three years) at which a hot-mix asphalt pavement can berehabilitated at the lowest life cycle cost (see the figure below.) The figurewas generated by determining the pavement repair, overlay and overheadcosts for the rehabilitation of a hot-mix asphalt pavement at various pave-ment conditions. These costs were then applied to the entire state networkassuming a specific rehabilitation cycle (i.e., every four, eight, ten etc.years). A pavement rehabilitated too soon will have wasted pavement life,while a pavement rehabilitated late will have higher associated repair andrehabilitation costs.15
10
0
20
30
40
50
60
4 5 6 7 8 9 10 11 12 13 14 15 16 17
Ann
ualC
ost
Rehabilitation Cycle (years)
Figure 3. Lowest-life-cycle cost rehabilitation cycle for hot-mix asphalt pavement.
13
The implementation of this concept has been an easy transition forrehabilitation project selection within the WSPMS; however, for regionalofficials, the change has been a bit more challenging. One major challengeinvolves regional officials’ hesitancy in selecting a pavement to be rehabili-tated that was not in the worst condition….With a bit of perseverancefrom the Pavement Management Staff, the majority of the Regional offices(five out of the six) bought into the change. The sixth region continued toschedule pavement rehabilitation projects based on the worst first concept.It wasn’t until recently (2002) that the sixth Regional office (noted asRegion) acknowledged the error in the decision and has now complied withthe lowest life cycle cost requirement for rehabilitation project selection.16
Implementation of Performance Graded (PG) Binders
In 1999 WSDOT implemented PG binders (Asphalt Institute 2003) in allstate highway hot-mix asphalt projects. The PG binder establishes specifi-cations for the selection of the asphalt binder to meet the low temperature(for minimizing thermal cracking), the high temperature (for minimizingrutting), and the truck traffic volume and speed (for minimizing rutting)for a specific pavement section. For Washington State, this established twoprimary asphalt binder types (PG 58-22 and PG 64-28); a third bindergrade is selected for mountain passes (PG 58-34). Using WSPMS, ananalysis was conducted to characterize the benefits of implementingPG binders [on minimizing] rutting at signalized intersections.
The WSPMS was queried to locate intersections with stopped condi-tions (i.e., stop sign or signalized intersection). This resulted in eight con-tracts that utilized PG binders, with one to seven intersections within eachproject. These eight contracts included three high-temperature bindergrades: PG 76, PG 70, and PG 64. With three years of data, the maxi-mum intersection rut depth using a PG [binder] was determined, and acomparison of the average rut depths by binder grade was made.
Though this analysis tended to support the use of PG binders forreducing intersection rutting, this analysis was only based on three yearsof performance data and the authors acknowledged that the conclusionsshould not be made until additional performance data was obtained.17
14
Evaluation of PavementSmoothness and ResultingPavement Performance
In June 2002, a research study wascompleted for the State of Washing-ton to investigate factors associated
with driver-perceived road roughness. This study had four primaryobjectives. The first objective was to design an experiment that wouldlink roughness data to public perceptions of road roughness. The secondobjective was to collect data on the public’s general perception of pave-ment roughness in Washington State. The third was to compare the pub-lic’s perceptions with actual measurements of road roughness and physicalroadway attributes. The last objective was to compare these findings withthose in other related research.
In this study, drivers were placed in [selected vehicles in] real worlddriving scenarios and asked to reveal their opinions about pavement rough-ness. A total of 56 participants each evaluated 40 highway test segmentsand produced 2,180 separate “observations.” Driver evaluations werecollected with other data, such as speed and in-vehicle noise, and matchedwith driver-specific socio-demographic data and pavement-specific datafrom the Washington State Department of Transportation and its pavementmanagement system.
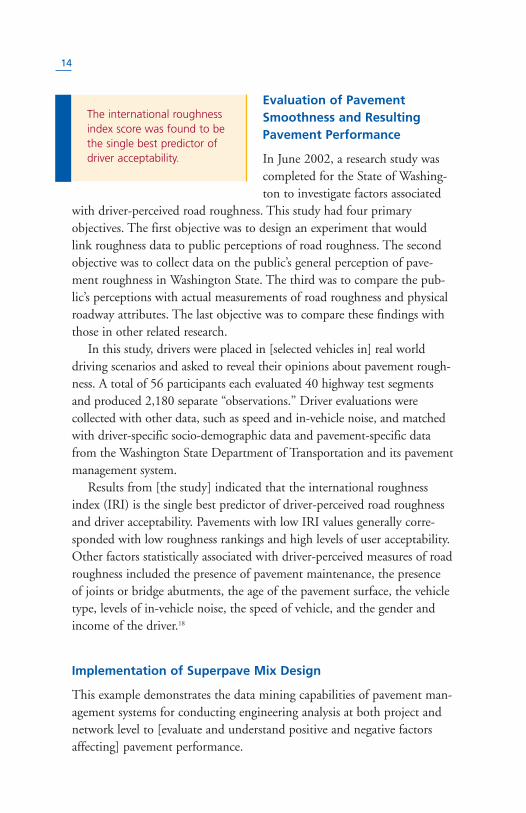
Results from [the study] indicated that the international roughnessindex (IRI) is the single best predictor of driver-perceived road roughnessand driver acceptability. Pavements with low IRI values generally corre-sponded with low roughness rankings and high levels of user acceptability.Other factors statistically associated with driver-perceived measures of roadroughness included the presence of pavement maintenance, the presenceof joints or bridge abutments, the age of the pavement surface, the vehicletype, levels of in-vehicle noise, the speed of vehicle, and the gender andincome of the driver.18
Implementation of Superpave Mix Design
This example demonstrates the data mining capabilities of pavement man-agement systems for conducting engineering analysis at both project andnetwork level to [evaluate and understand positive and negative factorsaffecting] pavement performance.
The international roughnessindex score was found to bethe single best predictor ofdriver acceptability.
15
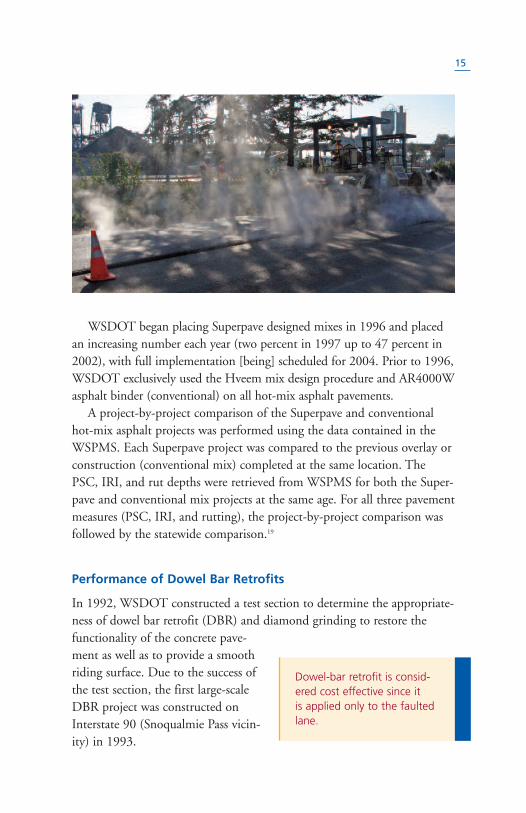
WSDOT began placing Superpave designed mixes in 1996 and placedan increasing number each year (two percent in 1997 up to 47 percent in2002), with full implementation [being] scheduled for 2004. Prior to 1996,WSDOT exclusively used the Hveem mix design procedure and AR4000Wasphalt binder (conventional) on all hot-mix asphalt pavements.
A project-by-project comparison of the Superpave and conventionalhot-mix asphalt projects was performed using the data contained in theWSPMS. Each Superpave project was compared to the previous overlay orconstruction (conventional mix) completed at the same location. ThePSC, IRI, and rut depths were retrieved from WSPMS for both the Super-pave and conventional mix projects at the same age. For all three pavementmeasures (PSC, IRI, and rutting), the project-by-project comparison wasfollowed by the statewide comparison.19
Performance of Dowel Bar Retrofits
In 1992, WSDOT constructed a test section to determine the appropriate-ness of dowel bar retrofit (DBR) and diamond grinding to restore thefunctionality of the concrete pave-ment as well as to provide a smoothriding surface. Due to the success ofthe test section, the first large-scaleDBR project was constructed onInterstate 90 (Snoqualmie Pass vicin-ity) in 1993.
Dowel-bar retrofit is consid-ered cost effective since itis applied only to the faultedlane.
16
WSDOT continued to monitor this and all other sections of concretepavement that have been retrofitted with dowel bars. Using data from theWSPMS, performance equations will be developed to relate truck volumesto faulting such that the performance life of dowel bar retrofit could bepredicted. Based on the performance of the test section it is anticipatedthat dowel bar retrofit will extend the life of the concrete pavement by10 to 15 years. It is estimated that over the next 20 years an additional300 lane-miles of concrete pavement may require DBR.
Since that time, WSDOT has rehabilitated over 300 miles of existingconcrete pavement by dowel bar retrofitting followed by diamond grind-ing. The average construction costs for DBR is approximately $450,000(2006 dollars) per lane-mile (includes all costs: PE, construction, trafficcontrol, etc). The typical cost of a four-inch asphalt overlay, which is theminimum recommended overlay depth for rehabilitating a faulted concretepavement, is approximately $525,000 per lane-mile (includes all costs).DBR is considered cost effective since it is only applied to the faulted lanewhile an asphalt overlay would be required on all lanes, shoulders, ramps,ramp tapers, etc., [significantly increasing the effective lane miles and costfor asphalt overlay.]20
Portland Cement Concrete Pavement Damage Causedby Studded Tires
In the past, it has been difficult to assign a dollar value of the damage topavement caused by studded tires. [With] improvements in technology, itis now possible to measure the actual amount of damage caused by stud-ded tires on PCC pavements [and hence quantify the dollar value of dam-age]. [Transverse profile] measurements [conducted as part of the annualpavement condition survey] on PCC pavements indicate that the currentdamage due to studded tires is approximately $18.2 million (cost forremoving studded tire wear by diamond grinding the concrete surface.)
Over the last five years, WSDOT has constructed a number of PCCpavement test sections to determine what combination of materials couldbe used to help offset the damage caused by studded tires. Test sectionapproaches have included increasing the concrete strength (making theconcrete surface harder would make it more resistant to studded tires),modifying the aggregate gradation (making the aggregate gradation more
17
uniform to minimize the smaller aggregate which is more susceptible tostudded tire wear), adding the Hard-Cem product (this is a product that istypically used to harden industrial floors) and modifying the surface tex-ture (carpet drag versus tining).21
SCOPER Design Method
This is an excellent example of engineering uses of pavement managementdata to improve network level project scoping. The availability of the pave-ment management database has made it possible to develop SCOPER andto produce practical, more accurate design estimates at an early date,[when project funding needs are determined, but before project specificstructural evaluations are made], to result in improved pavement designand performance within the state highway system. The initial scopingdesign is then available to WSDOT regional engineers as a preliminaryestimate for their full design process. SCOPER estimates required overlaythickness approximately 80% of the time to produce designs within10–15% of the final required design.
The SCOPER process uses the Asphalt Institute’s component analysismethod with modification to layer coefficient based on Washington char-acteristics [Asphalt 83; WSDOT 95a22]. The approach requires that thetotal pavement structure be developed as a new design for the specifiedservice conditions. The method takes into account pavement condition,type, and thickness of the pavement layers.
SCOPER uses a relationship between pavement structure and traffic toestimate the subgrade’s stiffness. The existing structural integrity of thepavement is converted to an equivalent thickness of hot-mix asphalt,which is then subtracted from the required thickness for a new full depthhot-mix asphalt design to determine the required overlay thickness.23
Performance Grade (PG) Binder Specifications
The WSPMS was used to assist pavement design engineers in selecting theproper asphalt binder grade for each individual project. The PG binderselection module [of WSPMS] accesses the project information concerningstate route, milepost limits, roadway speed limit, traffic condition (free,slow, or standing) and the 15-year equivalent single-axle load (ESAL) for
18
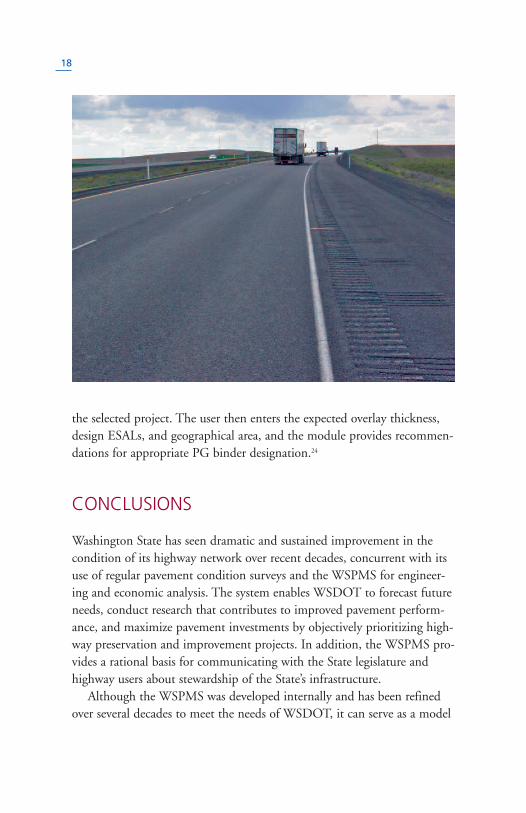
the selected project. The user then enters the expected overlay thickness,design ESALs, and geographical area, and the module provides recommen-dations for appropriate PG binder designation.24
CONCLUSIONS
Washington State has seen dramatic and sustained improvement in thecondition of its highway network over recent decades, concurrent with itsuse of regular pavement condition surveys and the WSPMS for engineer-ing and economic analysis. The system enables WSDOT to forecast futureneeds, conduct research that contributes to improved pavement perform-ance, and maximize pavement investments by objectively prioritizing high-way preservation and improvement projects. In addition, the WSPMS pro-vides a rational basis for communicating with the State legislature andhighway users about stewardship of the State’s infrastructure.
Although the WSPMS was developed internally and has been refinedover several decades to meet the needs of WSDOT, it can serve as a model
19
for other States. The WSPMS hasfeatures and benefits that other Statedepartments of transportation couldadapt to their specific needs at theproject and system levels.
Endnotes
1. “An Assessment of the Benefits of the Washington State Pavement ManagementSystem.” Linda M. Pierce, Joe P. Mahoney, and Nadarajah Sivaneswaran. Paperpresented at the Fifth International Conference on Managing Pavements,Seattle, Washington, August 11–14, 2001.
2. “Mining PMS Data to Evaluate the Performance of New Hot-Mix AsphaltPavement Design Practices.” L. M. Pierce, N. Sivaneswaran, K. W. Willoughby,and J. P. Mahoney. Paper presented at the 6th International Conference onManaging Pavements, Brisbane, Australia, October 19–24, 2004.
3. Washington State Highway Pavements: Trends, Conditions, and Strategic Plan,May 1999. http://www.wsdot.wa.gov/biz/mats/pavement/Pavement%20Plan.pdf. Washington State Department of Transportation, Field Operations SupportService Center, Materials laboratory, Olympia, WA, p. 4.
4. The Gray Notebook. Measures, Markers and Mileposts: The Gray Notebookfor the quarter ending September 30, 2006, WSDOT’s quarterly report to theGovernor, the Legislature, and the Washington State Transportation Commission ontransportation programs and department management. p. 53. www.wsdot.wa.gov/Accountability/GrayNotebook/Gnb_archives.htm
5. Washington State Highway Pavements: Trends, Conditions, and Strategic Plan, p. 4.6. Washington State Highway Pavements: Trends, Conditions, and Strategic Plan, p. 5.7. Washington State Highway Pavements: Trends, Conditions, and Strategic Plan,
p. 14.8. “An Assessment of the Benefits of the Washington State Pavement Management
System.”9. Washington State Highway Pavements: Trends, Conditions, and Strategic Plan,
p.14.10. “An Assessment of the Benefits of the Washington State Pavement Management
System.”11. “An Assessment of the Benefits of the Washington State Pavement Management
System.”12. Washington State Highway Pavements: Trends, Conditions, and Strategic Plan, p. 6.13. The Gray Notebook, 2006, p. 54.14. The Gray Notebook, 2006, p. 56.15. WSDOT PMS reference material included in the FHWA Demonstration
Project 108-A, “Pavement Management—Multi-year Prioritization” referencemanual, circa 1996. Washington State Department of Transportation, Olympia.
The pavement managementsystem enables WSDOT toforecast future needs, con-duct pavement performanceresearch, and maximizepavement investments.
20
16. “Mining PMS Data to Evaluate the Performance of New Hot-Mix AsphaltPavement Design Practices.”
17. “Mining PMS Data to Evaluate the Performance of New Hot-Mix AsphaltPavement Design Practices.”
18. “A Statistical Analysis of Factors Associated With Driver-Perceived RoadRoughness on Urban Highways.” Kevan Shafizadeh, Fred Mannering, LindaPierce; Washington State Transportation Center (TRAC). Research Report,June 2002.
19. “Mining PMS Data to Evaluate the Performance of New Hot-Mix AsphaltPavement Design Practices.”
20. Dowel Bar Retrofit, September 2001 Technical Notes and MaterialsLaboratory, January 2007, Technical Notes, Washington State Departmentof Transportation.
21. The Gray Notebook, 2006, p. 55.22. Asphalt Institute Manual Series 1, 1983, and WSDOT Pavement Guide,
Vol. 3, Pavement Analysis Computer Software and Case Studies for Design,Evaluation and Rehabilitation, Section 4.0—Case Study No. 1. WashingtonState Department of Transportation, 1995. http://www.wsdot.wa.gov/fasc/EngineeringPublications
23. Analysis of PMS Data for Engineering Applications, Reference Manual, NationalHighway Institute Course No. 131105. Federal Highway Administration,Washington, DC (http://www.nhi.fhwa.dot.gov); http://.knowledge.fhwa.dot.gov/tam/aashto.nsf/docs (DNA 5HJJLRFHWA), November 2002.
24. “An Assessment of the Benefits of the Washington State PavementManagement System.”
This document was prepared by the U.S. Federal Highway Administration withexpert guidance provided by Linda Pierce, Pavement Engineer, WashingtonState Department of Transportation. The content of this document wasgathered from the department’s documents and technical notes.
Further Information
Linda M. PierceState Pavement Engineer/Testing ManagerMaterials LaboratoryEnvironmental and Engineering Programs DivisionWashington State Department of Transportation1655 S. 2nd AvenueTumwater, WA 98512360-709-5470 • [email protected]
Stephen J. GajSystem Management and Monitoring, Team LeaderOffice of Asset Management, HIAM-10Federal Highway AdministrationU. S. Department of Transportation1200 New Jersey Avenue, S.E.Washington, DC 20590-9898202-366-1336 • [email protected]
Nastaran SaadatmandPavement Management EngineerOffice of Asset Management, HIAM-10Federal Highway AdministrationU.S. Department of Transportation1200 New Jersey Avenue, S.E.Washington, DC 20590-9898202-366-1337 • [email protected]
Additional information on pavement management systems—includingNational Highway Institute courses, pavement workshops, and publications—is available at the FHWA Web site: http://www.fhwa.dot.gov/pavement/mana.cfm
Quality assurance statement: The Federal Highway Administration (FHWA)provides high-quality information to serve Government, industry, and thepublic in a manner that promotes public understanding. Standards andpolicies are used to ensure and maximize the quality, objectivity, utility, andintegrity of its information. FHWA periodically reviews quality issues andadjusts its programs and processes to ensure continuous quality improvement.
Photographs courtesy of Washington State Department of Transportation

Office of Asset ManagementFederal Highway AdministrationU.S. Department of Transportation1200 New Jersey Avenue, S.E.Washington, DC 20590-9898
Telephone: 202-366-0392Fax: 202-366-9981www.fhwa.dot.gov/infrastructure/asstmgmt
FHWA IF-08-010


