User’s Guide Pavement Marking Management System Database by Yunlong Zhang Assistant Research Scientist Texas Transportation Institute Product 0-5548-P1 Project 0-5548 Project Title: Development of Field Performance Evaluation Tools and Program for Pavement Marking Materials Performed in cooperation with the Texas Department of Transportation and the Federal Highway Administration 2nd Resubmittal: May 2011 Published: December 2011 TEXAS TRANSPORTATION INSTITUTE The Texas A&M University System College Station, Texas 77843-3135
Transcript
User’s Guide
Pavement Marking Management System Database
by
Yunlong Zhang Assistant Research Scientist
Texas Transportation Institute
Product 0-5548-P1 Project 0-5548
Project Title: Development of Field Performance Evaluation Tools and Program for Pavement Marking Materials
Performed in cooperation with the Texas Department of Transportation
and the Federal Highway Administration
2nd Resubmittal: May 2011 Published: December 2011
TEXAS TRANSPORTATION INSTITUTE The Texas A&M University System College Station, Texas 77843-3135
iii
TABLE OF CONTENTS
LIST OF FIGURES ..................................................................................................... v LIST OF TABLES ...................................................................................................... vii 1 INTRODUCTION..................................................................................................... 1
1.1 Overview of PMMS Database ......................................................................... 1 1.2 System Requirements ....................................................................................... 2
1.2.1 Central Processing Unit (CPU) ............................................................. 2 1.2.2 Memory ................................................................................................. 2 1.2.3 Available Hard Disk Space ................................................................... 2 1.2.4 Client Operating Systems ..................................................................... 3 1.2.5 Supported Software ............................................................................... 3
2 STRUCTURE OF THE DATABASE ...................................................................... 5 3 DATA SOURCE AND FORMATS .......................................................................... 7
3.2 Real-World Data ............................................................................................ 12 3.3 Data Formats .................................................................................................. 13
4 IMPLEMENTATION AND USE OF DATABASE .............................................. 17 4.1 Database Files ................................................................................................ 17
4.2 Data Storage and Input ................................................................................... 18 4.2.1 Data Measurements and Processing.................................................... 18 4.2.2 Data Input............................................................................................ 19
Figure 1. Database Objects. .......................................................................................... 2 Figure 2. Structure of the Database. .............................................................................. 5 Figure 3. Relationships Illustrating the Basic Design of the Application. .................... 6 Figure 4. Test Deck on State Highway 21. ................................................................... 7 Figure 5. Unique Bryan Test Deck Configuration. ....................................................... 8 Figure 6. Test Deck Location - Beaumont, Texas. ........................................................ 9 Figure 7. Test Deck Stretch between US 90 and I-10. .................................................. 9 Figure 8. Test Deck Location - Lubbock, Texas. ........................................................ 11 Figure 9. Test Deck on US 62/82, Hockley County. ................................................... 11 Figure 10. Definition of the Measurement Points. ...................................................... 19 Figure 11. Table for the Input Data. ............................................................................ 20 Figure 12. Expanded Table for the Input Data. ........................................................... 20 Figure 13. Expanded Further Table for the Input Data. .............................................. 21 Figure 14. Subdatasheet for Switching Data Table. .................................................... 21 Figure 15. Splash Screen. ............................................................................................ 22 Figure 16. Switchboard. .............................................................................................. 22 Figure 17. Search Menu with Search by Product and Location Options. ................... 23 Figure 18. Search Form with Search by Product Drop-Down Combo Boxes. ........... 24 Figure 19. Final Pop-Up Form for a Selected Product. .............................................. 24 Figure 20. Search Form with Search by Location Drop-Down Combo Box. ............. 25 Figure 21. Final Pop-Up Form for a Selected Location. ............................................. 25 Figure 22. Prediction Form with Search by Product Drop-Down Combo Boxes. ..... 26 Figure 23. Initial Prediction Information Form. ......................................................... 27 Figure 24. Prediction Information Form. .................................................................... 27 Figure 25. Interactive Chart with Location Selection. ................................................ 28 Figure 26. Final Pop-Up Form to View Graphical Performance. ............................... 29 Figure 27. Adding Lines to the Chart. ......................................................................... 29 Figure 28. Interactive Form with Drop-Down Fields. ................................................ 30 Figure 29. Final Pop-Up Form to View Different Graphical Performance at a
Measurement Point for Different Products. ........................................................ 30 Figure 30. ‘Imageinput’ Form in the Catalog. ............................................................ 31 Figure 31. Search Form with Search by a Section of a Particular Location for
Inputting Images. ................................................................................................ 32 Figure 32. Pop-Up Form Displaying the Image of a Section of a Particular
Location. .............................................................................................................. 32 Figure 33. Security Warning Window for Macros in Microsoft Access 2003. ........... 33 Figure 34. Security Warning Window for Launching Microsoft Access 2003. .......... 33 Figure 35. Security Warning Window for Launching Microsoft Access 2007. .......... 34 Figure 36. Switchboard in Real-World Database. ....................................................... 35 Figure 37. Table for the Input Data in the Real-World Database. ............................... 36 Figure 38. Expanded Table for the Input Data in Real-World Database. ................... 37
vi
Figure 39. Further Expanded Table for the Input Data in the Real-World Database. . 37 Figure 40. Search Form with Search by Product in Real-World Database. ................ 38 Figure 41. Pop-Up Window for a Selected Product. ................................................... 39 Figure 42. Comparison Form of Real-World Database. ............................................. 40 Figure 43. Pop-Up Form of Products Comparison in Real-World Database. ............. 40 Figure 44. Main Window of View Charts. .................................................................. 41 Figure 45. Changing Display with the Drop-Down Arrows. ...................................... 42
vii
LIST OF TABLES
Table 1. Bryan Test Deck Information. ......................................................................... 8 Table 2. Beaumont Test Deck Information. ................................................................ 10 Table 3. Lubbock Test Deck Information. .................................................................. 12 Table 4. Data Types. .................................................................................................... 13 Table 5. Test Deck Data Information. ......................................................................... 14 Table 6. Site Data Information. ................................................................................... 14 Table 7. Retroreflectivity Data Information. ............................................................... 15 Table 8. Product Data Information. ............................................................................. 15 Table 9. Manufacturer Data Information. ................................................................... 16
1
1 INTRODUCTION
Pavement markings play a critical role in maintaining a safe and efficient driving environment for road users, especially during nighttime conditions. The Texas Department of Transportation (TxDOT) spends millions of dollars each year for installation and maintenance of pavement markings. In order to ensure that pavement markings remain effective, the highway agencies maintain them regularly by replacing the old markings. Therefore, selecting proper pavement marking materials (PMMs) that can maintain an acceptable level of functional performance over a longer period of time can lead to significant cost savings while maintaining safety. Thus, there is a need to evaluate the current performance specifications used by TxDOT and other users and to develop improved performance specifications reflecting the performance capabilities of existing materials. The overall objective of the TxDOT research project 0-5548 “Development of Field Performance Tools and Program for Pavement Marking Materials” was to develop a field performance evaluation program and to identify effective field evaluation methods and tools to improve the performance of PMMs. Advantages and disadvantages of different evaluation procedures were studied to design an effective program for evaluating and testing PMMs based on different external conditions, specifications, material selection criteria, and performance measures. As part of this project, field test decks were installed and data were collected. As a component of the project, a tracking database is developed. This document provides instructions and guidance to users of this tracking database.
1.1 OVERVIEW OF PMMS DATABASE
Pavement Marking Management System (PMMS) database was developed to incorporate the parameters that are critical to the test deck evaluation, with functions to enter the data and view the existing information pertaining to performance of the markings. PMMS is a program designed to store, manage, and manipulate data for monitoring the performance of pavement markings. This program is based on Microsoft Access® 2003, which is easy to use, and little training is required to operate the application. Access is comprised of different database components called objects, which are tables, queries, forms, reports, macros, and modules appearing on the left side of the database window as shown in Figure 1.
2
Figure 1. Database Objects.
1.2 SYSTEM REQUIREMENTS
1.2.1 Central Processing Unit (CPU)
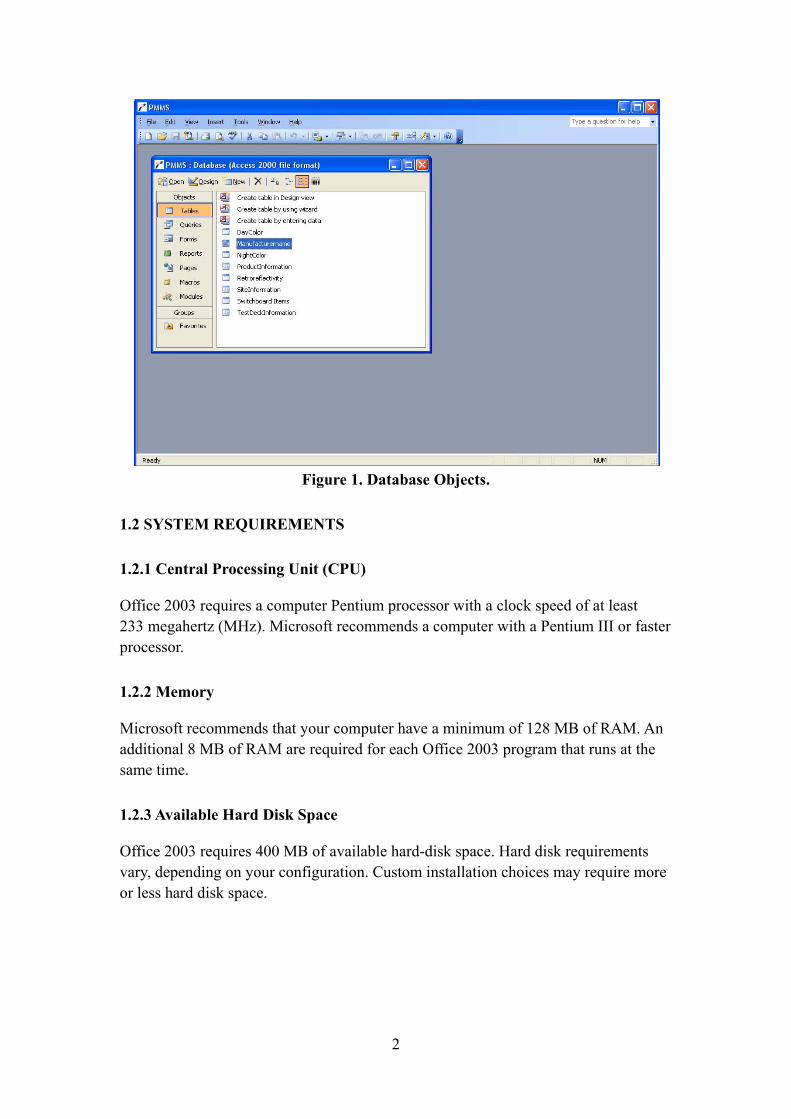
Office 2003 requires a computer Pentium processor with a clock speed of at least 233 megahertz (MHz). Microsoft recommends a computer with a Pentium III or faster processor.
1.2.2 Memory
Microsoft recommends that your computer have a minimum of 128 MB of RAM. An additional 8 MB of RAM are required for each Office 2003 program that runs at the same time.
1.2.3 Available Hard Disk Space
Office 2003 requires 400 MB of available hard-disk space. Hard disk requirements vary, depending on your configuration. Custom installation choices may require more or less hard disk space.
3
1.2.4 Client Operating Systems
Windows 2003 Windows XP Windows Vista Windows 7
1.2.5 Supported Software
Windows Office, Access 2003 Windows Office, Access 2007 Windows Office, Access 2010
5
2 STRUCTURE OF THE DATABASE
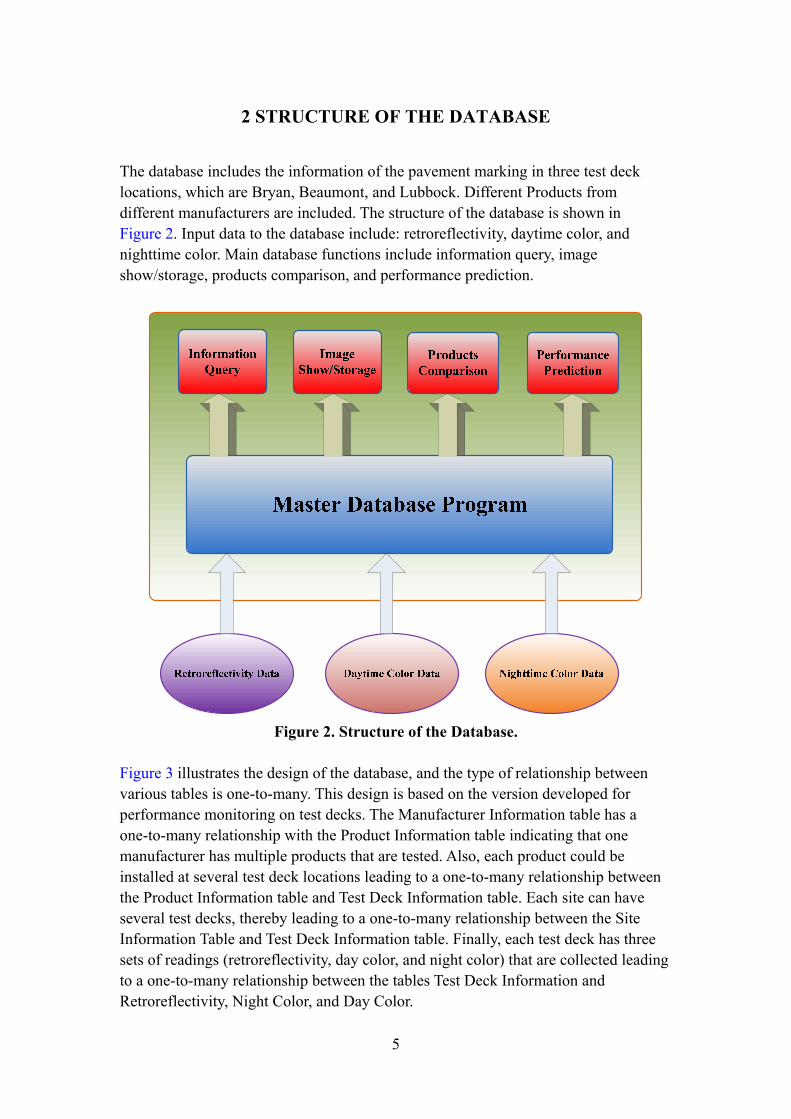
The database includes the information of the pavement marking in three test deck locations, which are Bryan, Beaumont, and Lubbock. Different Products from different manufacturers are included. The structure of the database is shown in Figure 2. Input data to the database include: retroreflectivity, daytime color, and nighttime color. Main database functions include information query, image show/storage, products comparison, and performance prediction.
Figure 2. Structure of the Database.
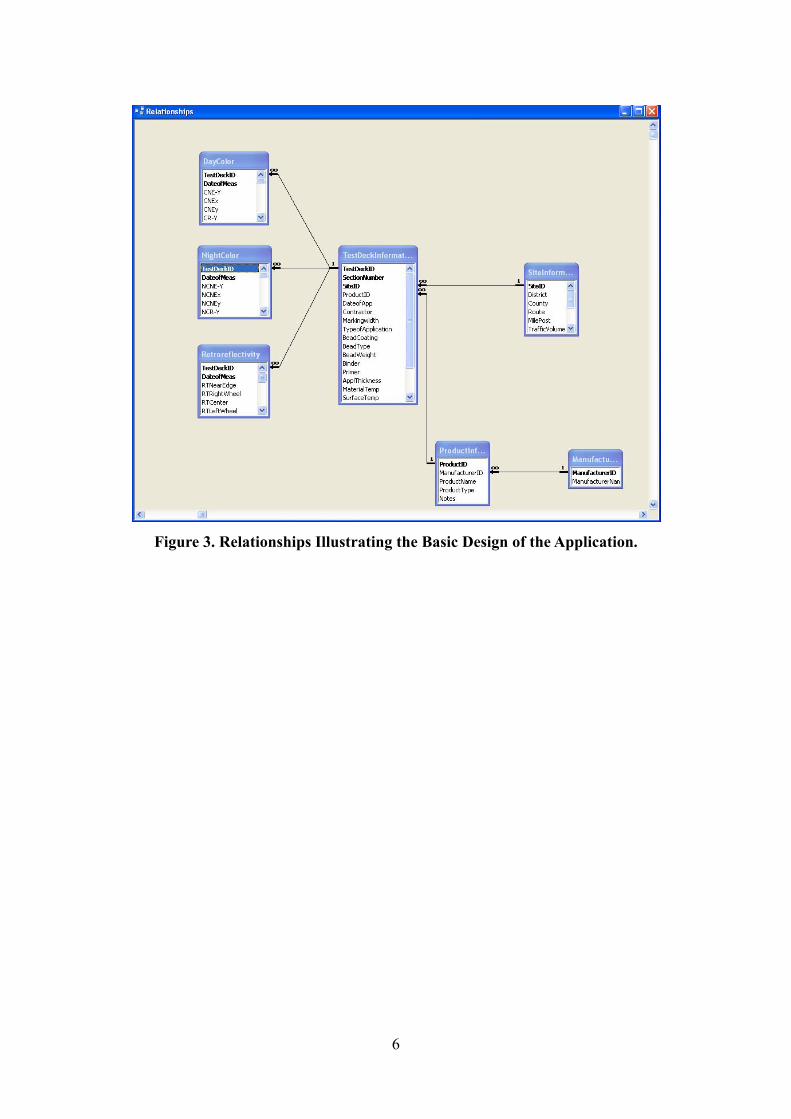
Figure 3 illustrates the design of the database, and the type of relationship between various tables is one-to-many. This design is based on the version developed for performance monitoring on test decks. The Manufacturer Information table has a one-to-many relationship with the Product Information table indicating that one manufacturer has multiple products that are tested. Also, each product could be installed at several test deck locations leading to a one-to-many relationship between the Product Information table and Test Deck Information table. Each site can have several test decks, thereby leading to a one-to-many relationship between the Site Information Table and Test Deck Information table. Finally, each test deck has three sets of readings (retroreflectivity, day color, and night color) that are collected leading to a one-to-many relationship between the tables Test Deck Information and Retroreflectivity, Night Color, and Day Color.
6
Figure 3. Relationships Illustrating the Basic Design of the Application.
7
3 DATA SOURCE AND FORMATS
3.1 PMMS TEST DECKS
Three test decks were installed in Bryan, Beaumont, and Lubbock. Pavement marking products from multiple vendors were installed on those decks. Since the objective of this project is not product evaluation for TxDOT, some of the vendor products might not be formulated according to TxDOT specifications.
3.1.1 Bryan
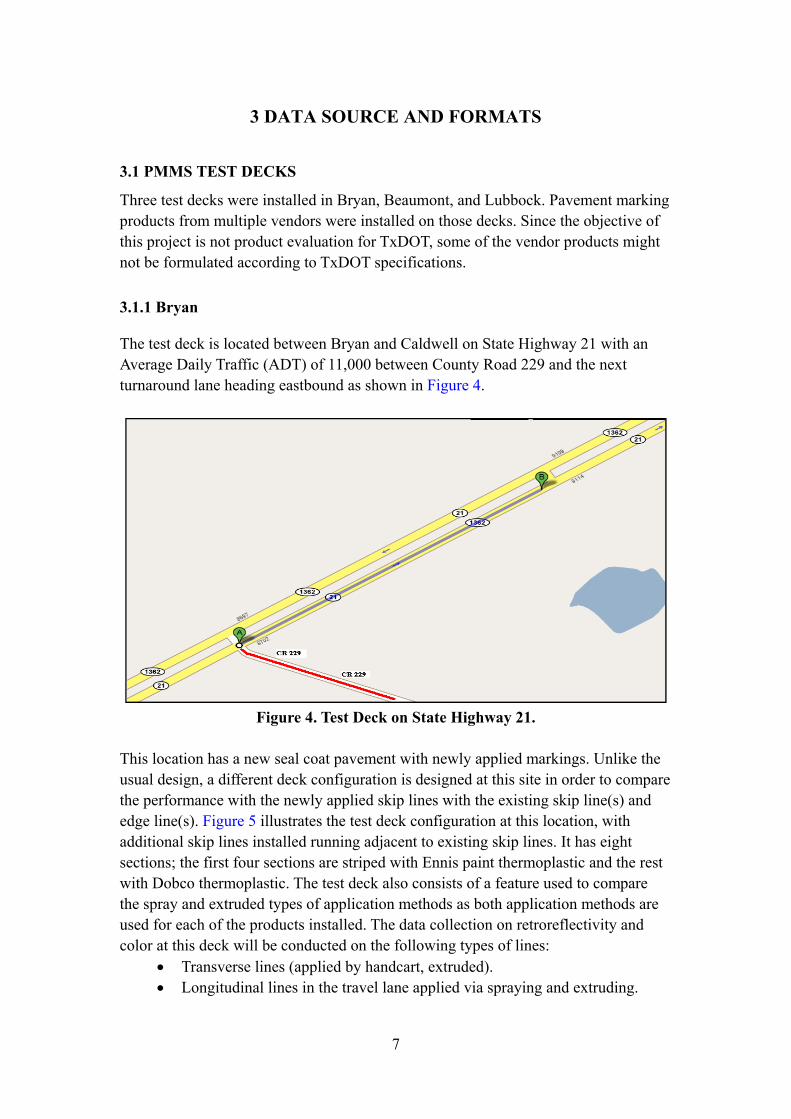
The test deck is located between Bryan and Caldwell on State Highway 21 with an Average Daily Traffic (ADT) of 11,000 between County Road 229 and the next turnaround lane heading eastbound as shown in Figure 4.
Figure 4. Test Deck on State Highway 21.
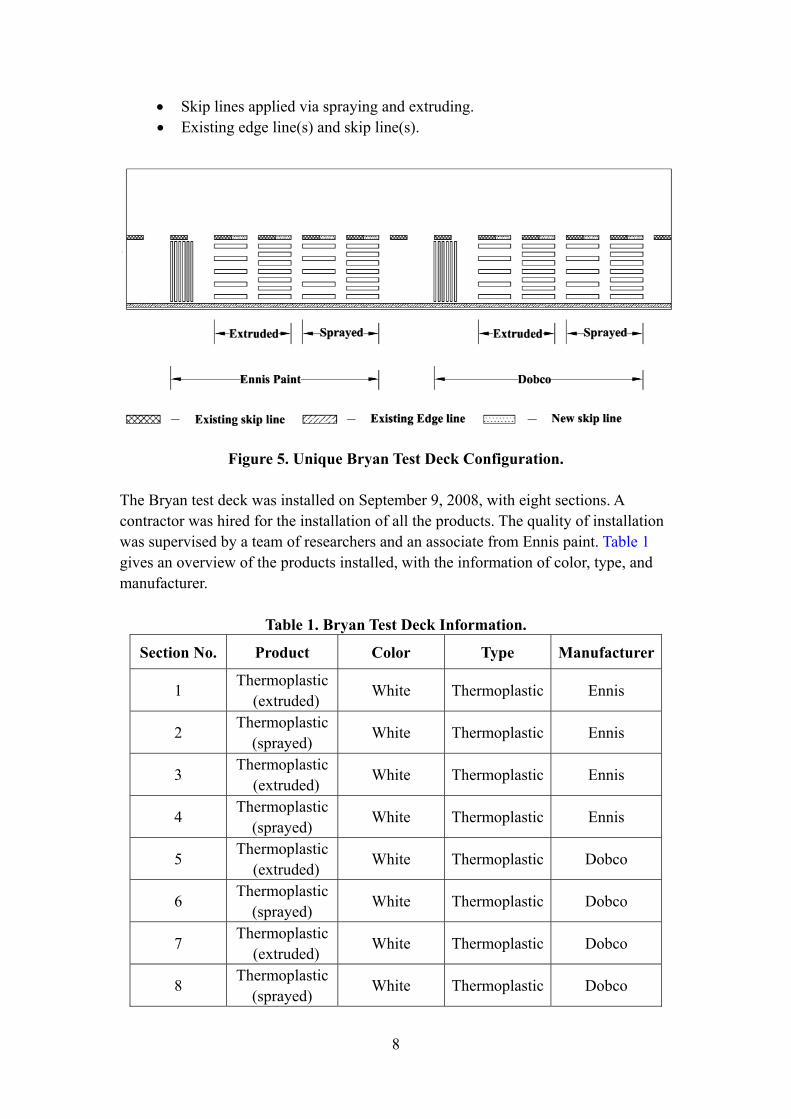
This location has a new seal coat pavement with newly applied markings. Unlike the usual design, a different deck configuration is designed at this site in order to compare the performance with the newly applied skip lines with the existing skip line(s) and edge line(s). Figure 5 illustrates the test deck configuration at this location, with additional skip lines installed running adjacent to existing skip lines. It has eight sections; the first four sections are striped with Ennis paint thermoplastic and the rest with Dobco thermoplastic. The test deck also consists of a feature used to compare the spray and extruded types of application methods as both application methods are used for each of the products installed. The data collection on retroreflectivity and color at this deck will be conducted on the following types of lines:
• Transverse lines (applied by handcart, extruded). • Longitudinal lines in the travel lane applied via spraying and extruding.
• Skip lines applied via spraying and extruding. • Existing edge line(s) and skip line(s).
Figure 5. Unique Bryan Test Deck Configuration.
The Bryan test deck was installed on September 9, 2008, with eight sections. A contractor was hired for the installation of all the products. The quality of installation was supervised by a team of researchers and an associate from Ennis paint. Table 1 gives an overview of the products installed, with the information of color, type, and manufacturer.
Table 1. Bryan Test Deck Information.
Section No. Product Color Type Manufacturer
Thermoplastic (extruded) White Thermoplastic Ennis 1
Thermoplastic (sprayed) White Thermoplastic Ennis 2
Thermoplastic (extruded) White Thermoplastic Ennis 3
Thermoplastic (sprayed) White Thermoplastic Ennis 4
Thermoplastic (extruded) White Thermoplastic Dobco 5
Thermoplastic (sprayed) White Thermoplastic Dobco 6
Thermoplastic (extruded) White Thermoplastic Dobco 7
Thermoplastic (sprayed) White Thermoplastic Dobco 8
8
9
3.1.2 Beaumont
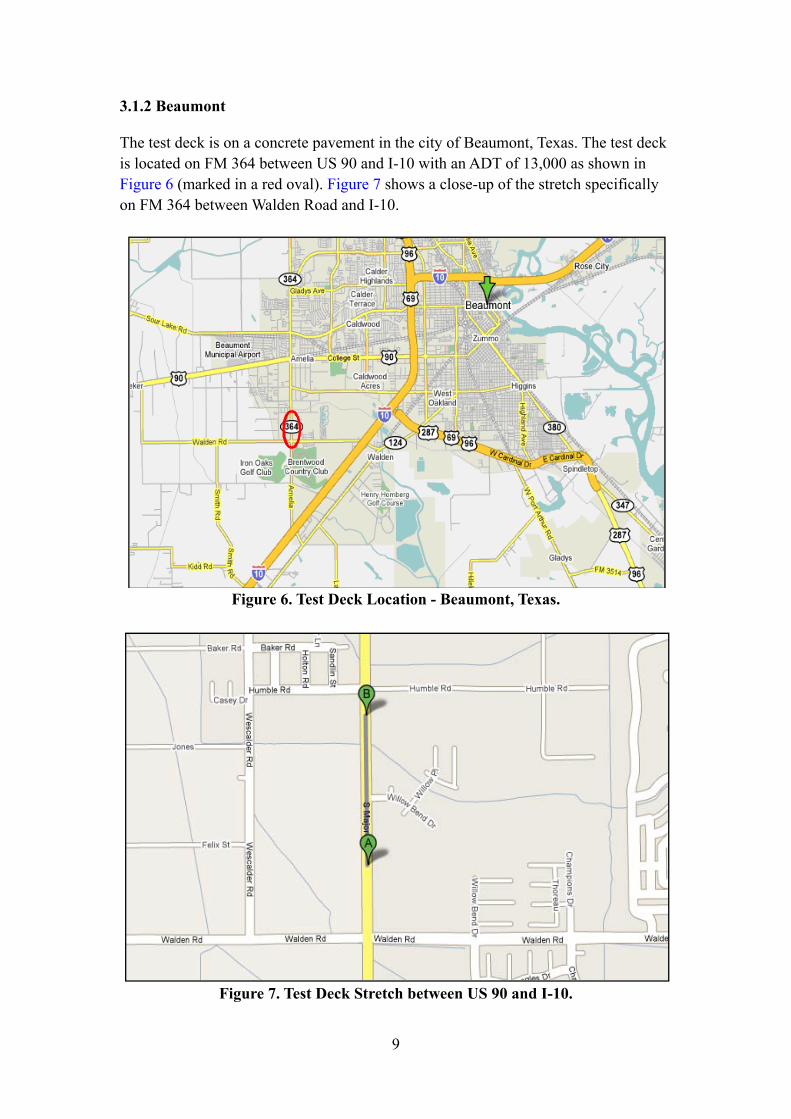
The test deck is on a concrete pavement in the city of Beaumont, Texas. The test deck is located on FM 364 between US 90 and I-10 with an ADT of 13,000 as shown in Figure 6 (marked in a red oval). Figure 7 shows a close-up of the stretch specifically on FM 364 between Walden Road and I-10.
Figure 6. Test Deck Location - Beaumont, Texas.
Figure 7. Test Deck Stretch between US 90 and I-10.
10
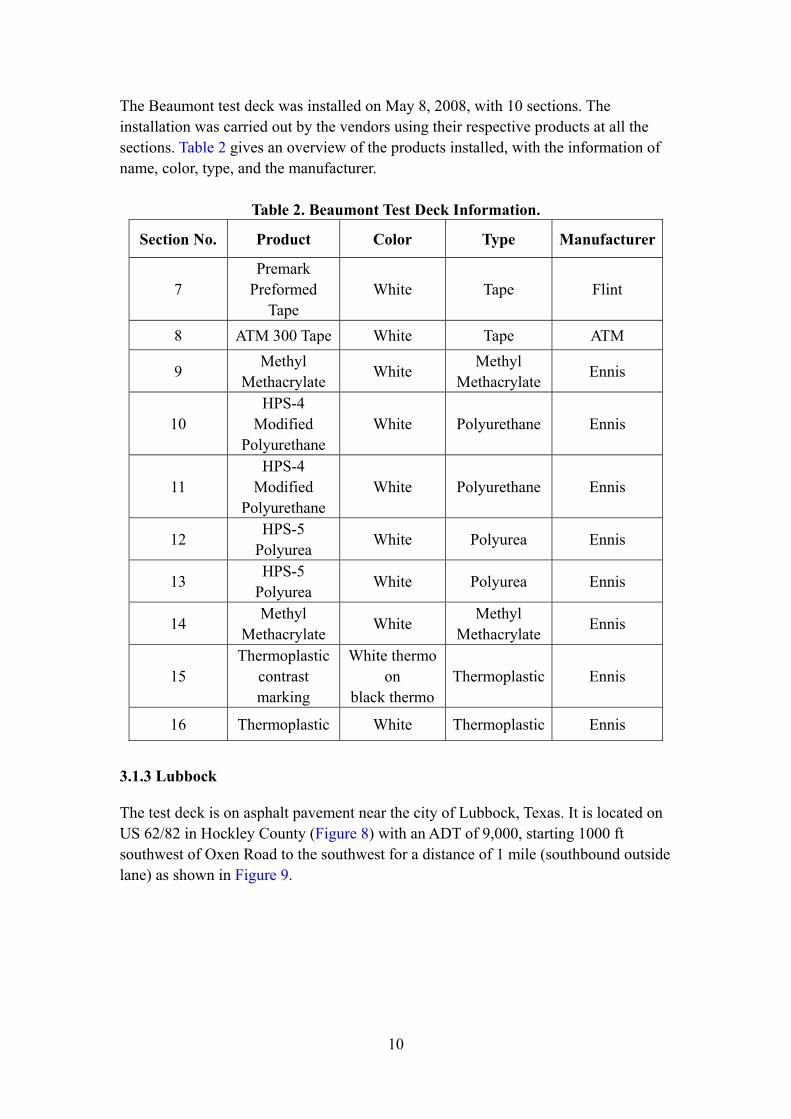
The Beaumont test deck was installed on May 8, 2008, with 10 sections. The installation was carried out by the vendors using their respective products at all the sections. Table 2 gives an overview of the products installed, with the information of name, color, type, and the manufacturer.
Table 2. Beaumont Test Deck Information.
Section No. Product Color Type Manufacturer
7 Premark
Preformed Tape
White Tape Flint
8 ATM 300 Tape White Tape ATM
9 Methyl Methacrylate White Methyl
Methacrylate Ennis
10 HPS-4
Modified Polyurethane
White Polyurethane Ennis
11 HPS-4
Modified Polyurethane
White Polyurethane Ennis
12 HPS-5 Polyurea White Polyurea Ennis
13 HPS-5 Polyurea White Polyurea Ennis
14 Methyl Methacrylate White Methyl
Methacrylate Ennis
15 Thermoplastic
contrast marking
White thermo on
black thermo Thermoplastic Ennis
16 Thermoplastic White Thermoplastic Ennis
3.1.3 Lubbock
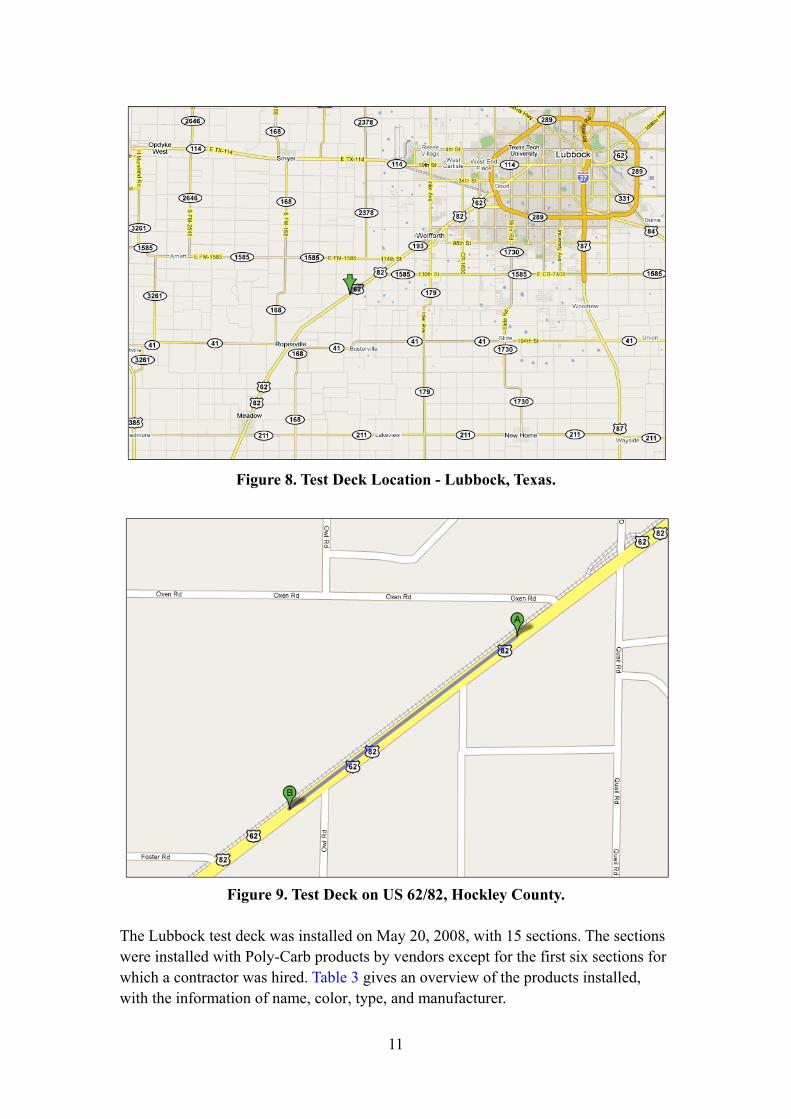
The test deck is on asphalt pavement near the city of Lubbock, Texas. It is located on US 62/82 in Hockley County (Figure 8) with an ADT of 9,000, starting 1000 ft southwest of Oxen Road to the southwest for a distance of 1 mile (southbound outside lane) as shown in Figure 9.
11
Figure 8. Test Deck Location - Lubbock, Texas.
Figure 9. Test Deck on US 62/82, Hockley County.
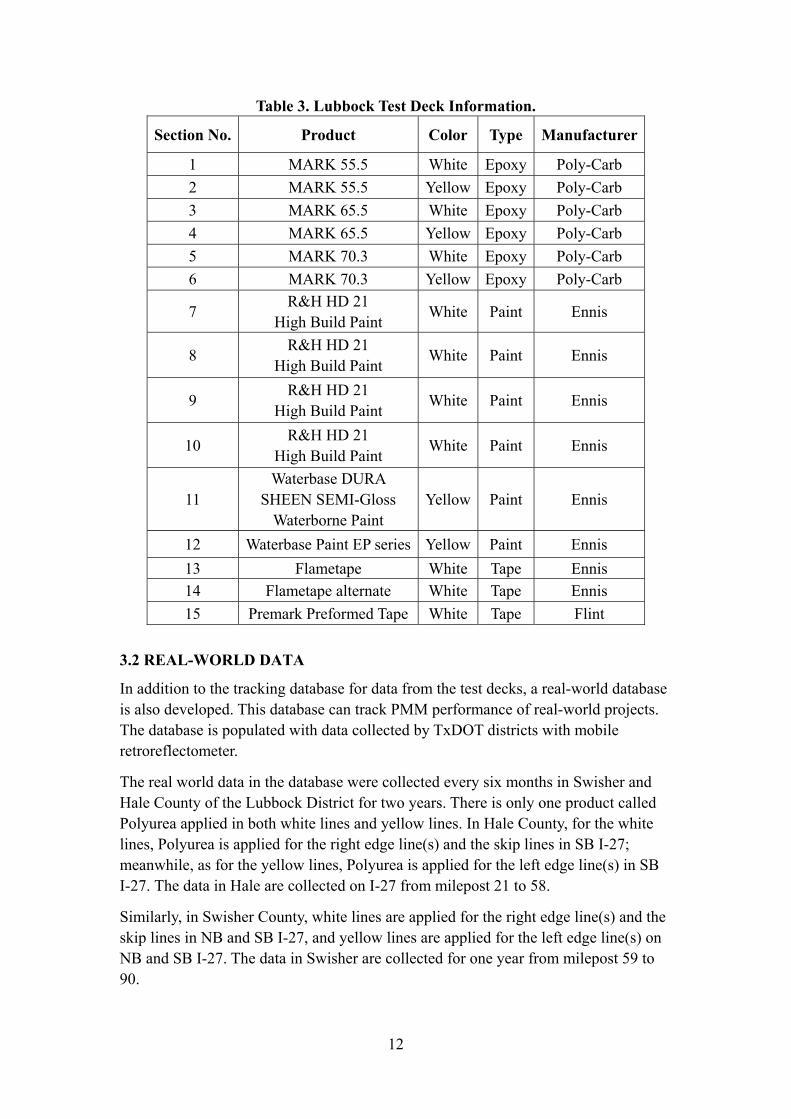
The Lubbock test deck was installed on May 20, 2008, with 15 sections. The sections were installed with Poly-Carb products by vendors except for the first six sections for which a contractor was hired. Table 3 gives an overview of the products installed, with the information of name, color, type, and manufacturer.
12
Table 3. Lubbock Test Deck Information.
Section No. Product Color Type Manufacturer
1 MARK 55.5 White Epoxy Poly-Carb 2 MARK 55.5 Yellow Epoxy Poly-Carb 3 MARK 65.5 White Epoxy Poly-Carb 4 MARK 65.5 Yellow Epoxy Poly-Carb 5 MARK 70.3 White Epoxy Poly-Carb 6 MARK 70.3 Yellow Epoxy Poly-Carb
7 R&H HD 21 High Build Paint White Paint Ennis
8 R&H HD 21 High Build Paint White Paint Ennis
9 R&H HD 21 High Build Paint White Paint Ennis
10 R&H HD 21 High Build Paint White Paint Ennis
11 Waterbase DURA
SHEEN SEMI-Gloss Waterborne Paint
Yellow Paint Ennis
12 Waterbase Paint EP series Yellow Paint Ennis 13 Flametape White Tape Ennis 14 Flametape alternate White Tape Ennis 15 Premark Preformed Tape White Tape Flint
3.2 REAL-WORLD DATA
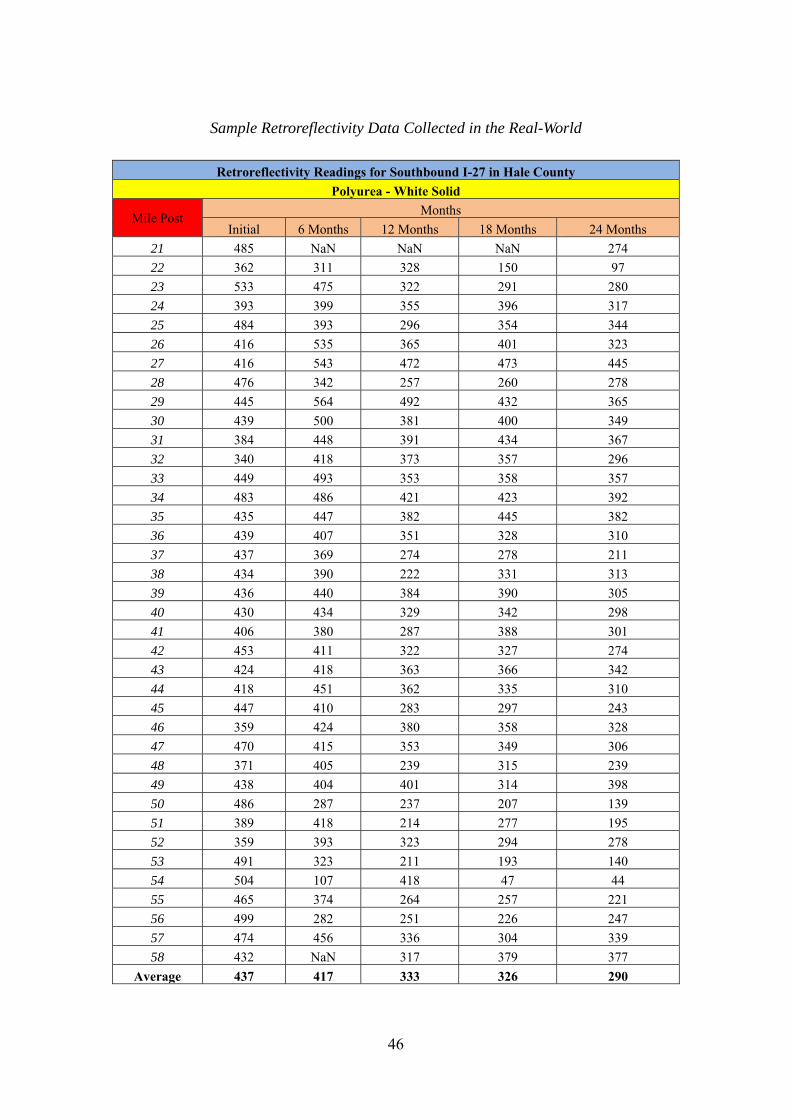
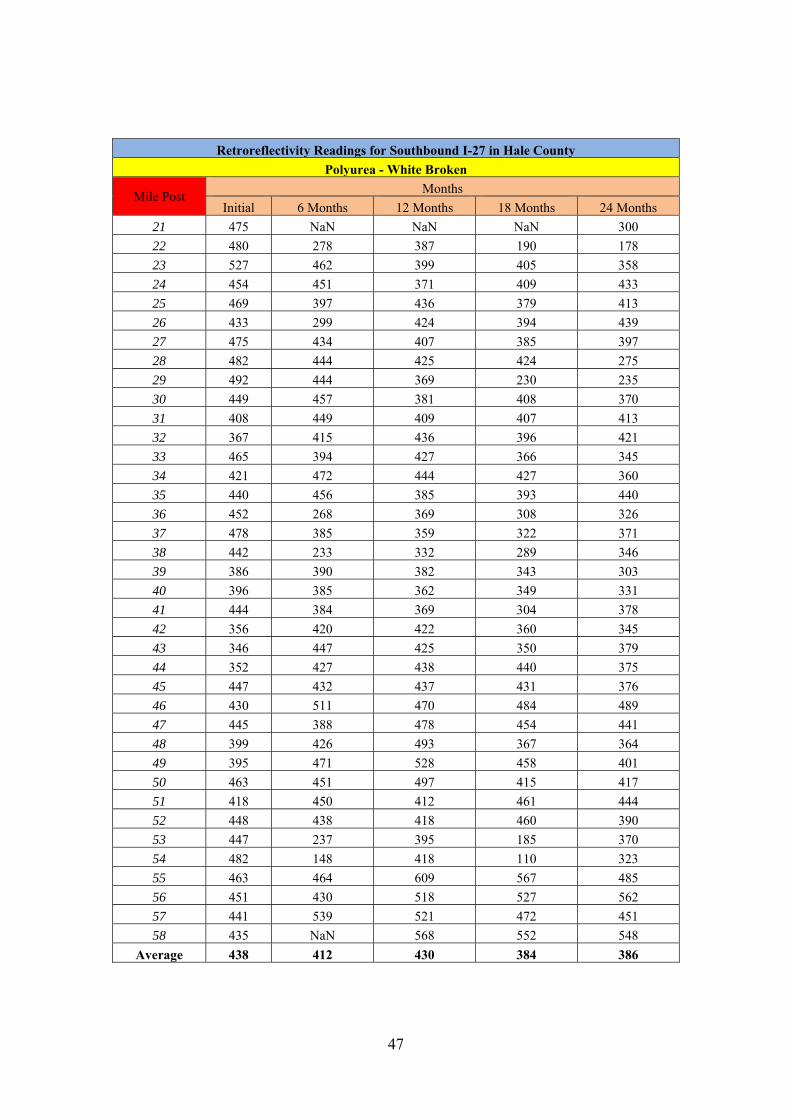
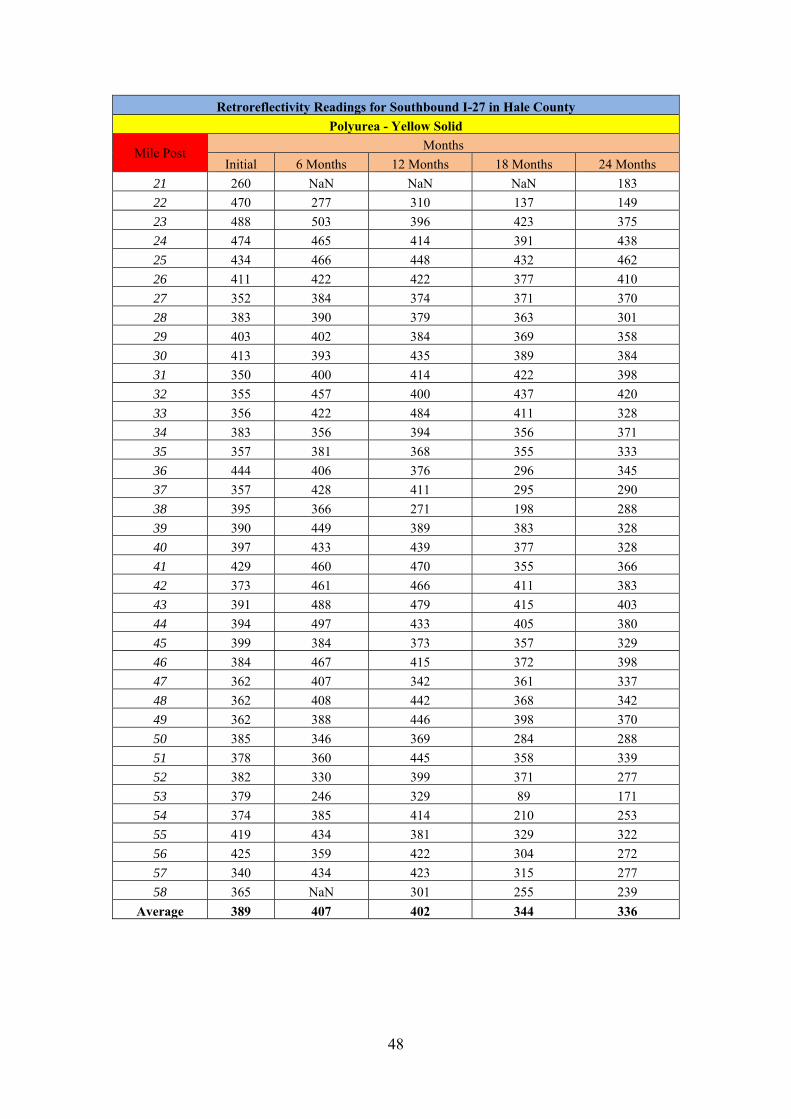
In addition to the tracking database for data from the test decks, a real-world database is also developed. This database can track PMM performance of real-world projects. The database is populated with data collected by TxDOT districts with mobile retroreflectometer.
The real world data in the database were collected every six months in Swisher and Hale County of the Lubbock District for two years. There is only one product called Polyurea applied in both white lines and yellow lines. In Hale County, for the white lines, Polyurea is applied for the right edge line(s) and the skip lines in SB I-27; meanwhile, as for the yellow lines, Polyurea is applied for the left edge line(s) in SB I-27. The data in Hale are collected on I-27 from milepost 21 to 58.
Similarly, in Swisher County, white lines are applied for the right edge line(s) and the skip lines in NB and SB I-27, and yellow lines are applied for the left edge line(s) on NB and SB I-27. The data in Swisher are collected for one year from milepost 59 to 90.
13
3.3 DATA FORMATS
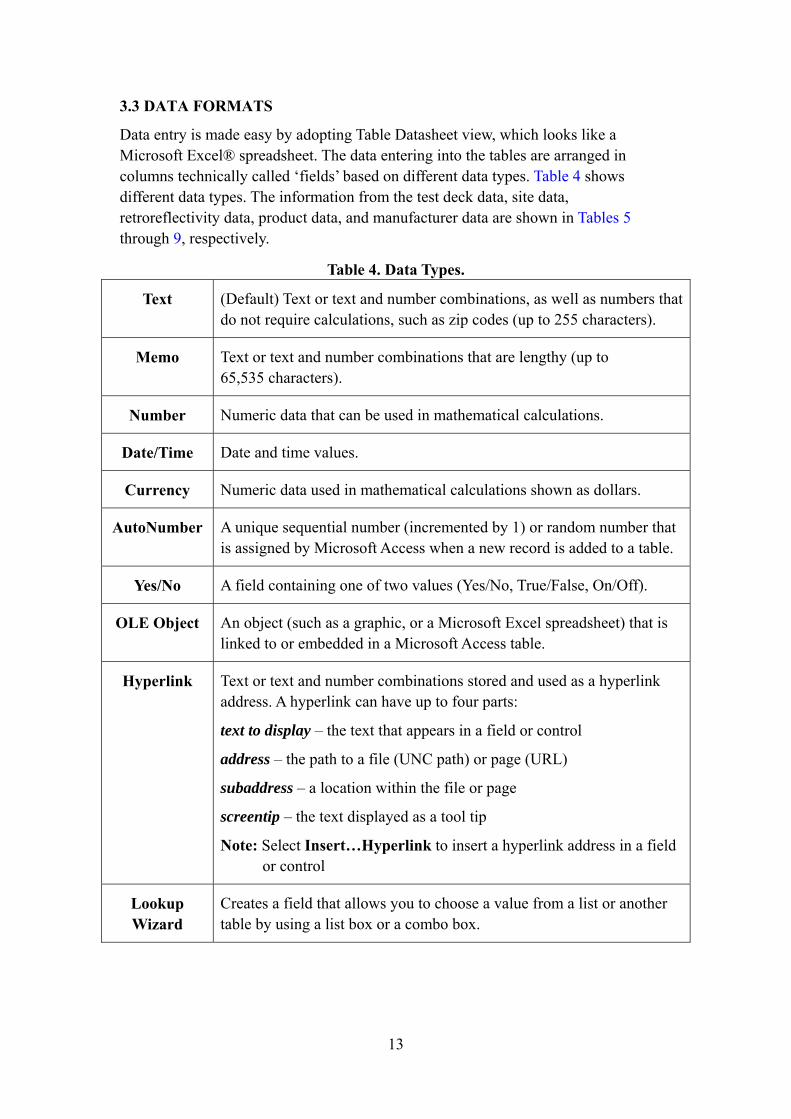
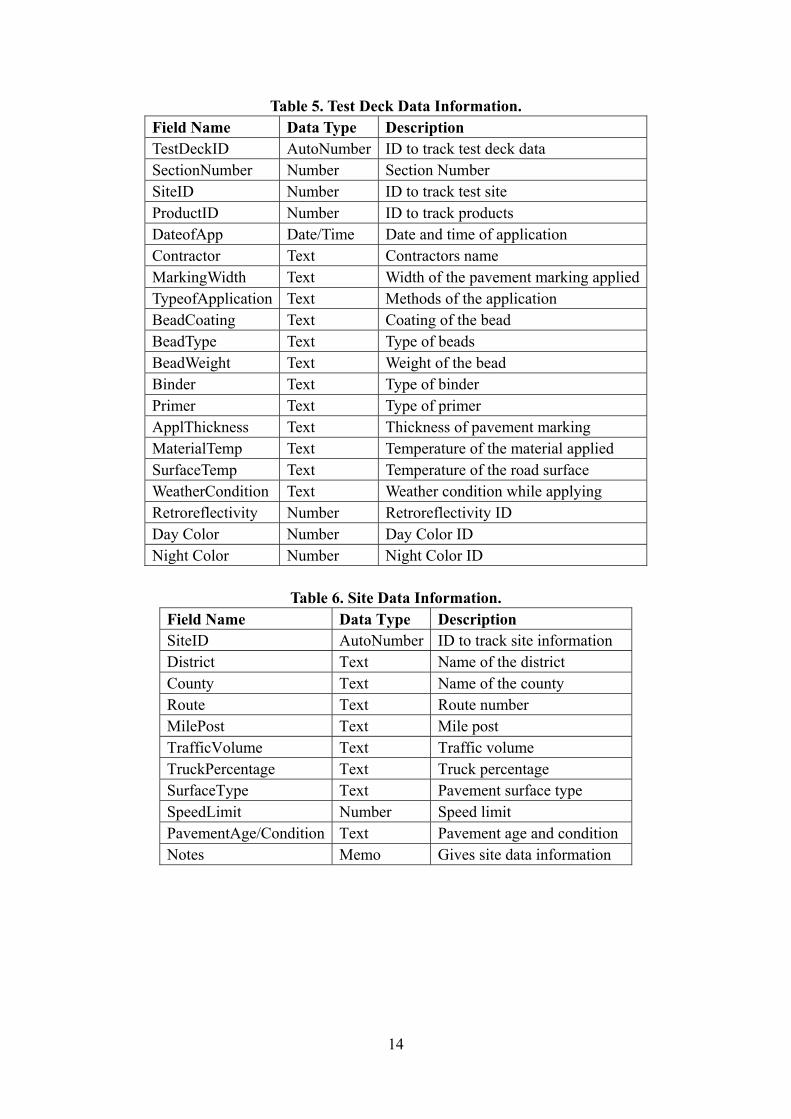
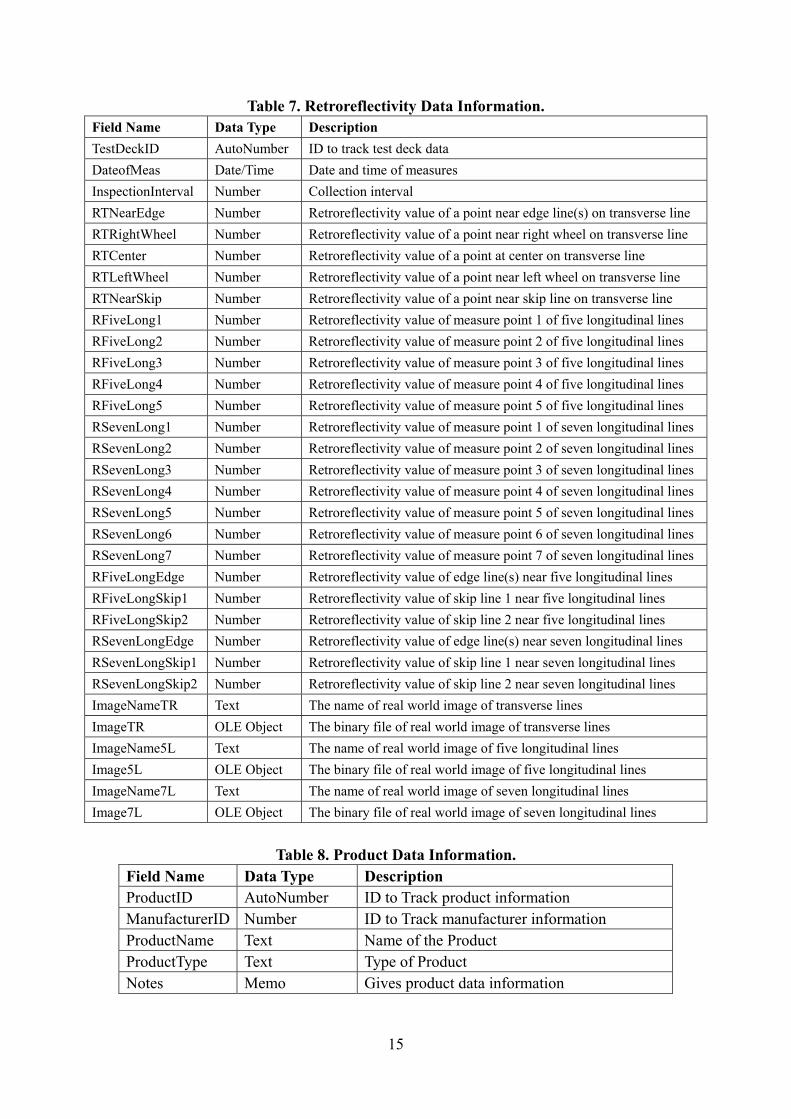
Data entry is made easy by adopting Table Datasheet view, which looks like a Microsoft Excel® spreadsheet. The data entering into the tables are arranged in columns technically called ‘fields’ based on different data types. Table 4 shows different data types. The information from the test deck data, site data, retroreflectivity data, product data, and manufacturer data are shown in Tables 5 through 9, respectively.
Table 4. Data Types.
Text (Default) Text or text and number combinations, as well as numbers that do not require calculations, such as zip codes (up to 255 characters).
Memo Text or text and number combinations that are lengthy (up to 65,535 characters).
Number Numeric data that can be used in mathematical calculations.
Date/Time Date and time values.
Currency Numeric data used in mathematical calculations shown as dollars.
AutoNumber A unique sequential number (incremented by 1) or random number that is assigned by Microsoft Access when a new record is added to a table.
Yes/No A field containing one of two values (Yes/No, True/False, On/Off).
OLE Object An object (such as a graphic, or a Microsoft Excel spreadsheet) that is linked to or embedded in a Microsoft Access table.
Hyperlink Text or text and number combinations stored and used as a hyperlink address. A hyperlink can have up to four parts:
text to display – the text that appears in a field or control
address – the path to a file (UNC path) or page (URL)
subaddress – a location within the file or page
screentip – the text displayed as a tool tip
Note: Select Insert…Hyperlink to insert a hyperlink address in a field or control
Lookup Wizard
Creates a field that allows you to choose a value from a list or another table by using a list box or a combo box.
14
Table 5. Test Deck Data Information. Field Name Data Type Description TestDeckID AutoNumber ID to track test deck data SectionNumber Number Section Number SiteID Number ID to track test site ProductID Number ID to track products DateofApp Date/Time Date and time of application Contractor Text Contractors name MarkingWidth Text Width of the pavement marking applied TypeofApplication Text Methods of the application BeadCoating Text Coating of the bead BeadType Text Type of beads BeadWeight Text Weight of the bead Binder Text Type of binder Primer Text Type of primer ApplThickness Text Thickness of pavement marking MaterialTemp Text Temperature of the material applied SurfaceTemp Text Temperature of the road surface WeatherCondition Text Weather condition while applying Retroreflectivity Number Retroreflectivity ID Day Color Number Day Color ID Night Color Number Night Color ID
Table 6. Site Data Information.
Field Name Data Type Description SiteID AutoNumber ID to track site information District Text Name of the district County Text Name of the county Route Text Route number MilePost Text Mile post TrafficVolume Text Traffic volume TruckPercentage Text Truck percentage SurfaceType Text Pavement surface type SpeedLimit Number Speed limit PavementAge/Condition Text Pavement age and condition Notes Memo Gives site data information
15
Table 7. Retroreflectivity Data Information. Field Name Data Type Description TestDeckID AutoNumber ID to track test deck data DateofMeas Date/Time Date and time of measures InspectionInterval Number Collection interval RTNearEdge Number Retroreflectivity value of a point near edge line(s) on transverse line RTRightWheel Number Retroreflectivity value of a point near right wheel on transverse line RTCenter Number Retroreflectivity value of a point at center on transverse line RTLeftWheel Number Retroreflectivity value of a point near left wheel on transverse line RTNearSkip Number Retroreflectivity value of a point near skip line on transverse line RFiveLong1 Number Retroreflectivity value of measure point 1 of five longitudinal lines RFiveLong2 Number Retroreflectivity value of measure point 2 of five longitudinal lines RFiveLong3 Number Retroreflectivity value of measure point 3 of five longitudinal lines RFiveLong4 Number Retroreflectivity value of measure point 4 of five longitudinal lines RFiveLong5 Number Retroreflectivity value of measure point 5 of five longitudinal lines RSevenLong1 Number Retroreflectivity value of measure point 1 of seven longitudinal lines RSevenLong2 Number Retroreflectivity value of measure point 2 of seven longitudinal lines RSevenLong3 Number Retroreflectivity value of measure point 3 of seven longitudinal lines RSevenLong4 Number Retroreflectivity value of measure point 4 of seven longitudinal lines RSevenLong5 Number Retroreflectivity value of measure point 5 of seven longitudinal lines RSevenLong6 Number Retroreflectivity value of measure point 6 of seven longitudinal lines RSevenLong7 Number Retroreflectivity value of measure point 7 of seven longitudinal lines RFiveLongEdge Number Retroreflectivity value of edge line(s) near five longitudinal lines RFiveLongSkip1 Number Retroreflectivity value of skip line 1 near five longitudinal lines RFiveLongSkip2 Number Retroreflectivity value of skip line 2 near five longitudinal lines RSevenLongEdge Number Retroreflectivity value of edge line(s) near seven longitudinal lines RSevenLongSkip1 Number Retroreflectivity value of skip line 1 near seven longitudinal lines RSevenLongSkip2 Number Retroreflectivity value of skip line 2 near seven longitudinal lines ImageNameTR Text The name of real world image of transverse lines ImageTR OLE Object The binary file of real world image of transverse lines ImageName5L Text The name of real world image of five longitudinal lines Image5L OLE Object The binary file of real world image of five longitudinal lines ImageName7L Text The name of real world image of seven longitudinal lines Image7L OLE Object The binary file of real world image of seven longitudinal lines
Table 8. Product Data Information.
Field Name Data Type Description ProductID AutoNumber ID to Track product information ManufacturerID Number ID to Track manufacturer information ProductName Text Name of the Product ProductType Text Type of Product Notes Memo Gives product data information
16
Table 9. Manufacturer Data Information. Field Name Data Type Description ManufacturerID AutoNumber ID to Track manufacturer information ManufacturerName Text Product Manufacturer’s Name
17
4 IMPLEMENTATION AND USE OF DATABASE
This section describes how to input data with required format into the database. Files required by the Access database are also discussed. The steps to use all features of the database are documented.
4.1 DATABASE FILES
4.1.1 Image File – To Store Pictures
Photos are taken on lines at test decks at the time of each data collection trip. These pictures are stored in the database and can be queried by location, product, time, etc. The image files are named according to the following principles:
The order of the file names follows the sequence of site, month, year, section no., and deck type.
The site names are abbreviated as follows: be – Beaumont. br – Bryan. lu – Lubbock.
The deck types are abbreviated as follows: l5 – 5 longitude lines. l7 – 7 longitude lines. tr – transverse lines.
Example: be011012l5 – the picture of the 5 longitude lines at section 12 in Beaumont taken in January 2010.
4.1.2 Mousehook.dll
Mousehook.dll is a library associated with Stephen Lebans hack for locking the mouse wheel in Access so that it does not scroll through records. This file is included in the delivered data.
4.1.3 Favicon.ico
The Favicon.ico file is used for the background of Splash Screen. This file is included in the delivered data.
18
4.1.4 PMMS_photo v1.4.mdb
PMMS_photo v1.4.mdb file, the master database program, used to store and manage the test deck data, is the Access database file. When double-clicked, the database will be launched.
4.1.5 RealworldV1.1.mdb
RealworldV1.1.mdb file, the other master database program, used to store and manage the real-world data collected from I-27, is the Access database file. When double- clicked, the database will be launched.
4.2 DATA STORAGE AND INPUT
4.2.1 Data Measurements and Processing
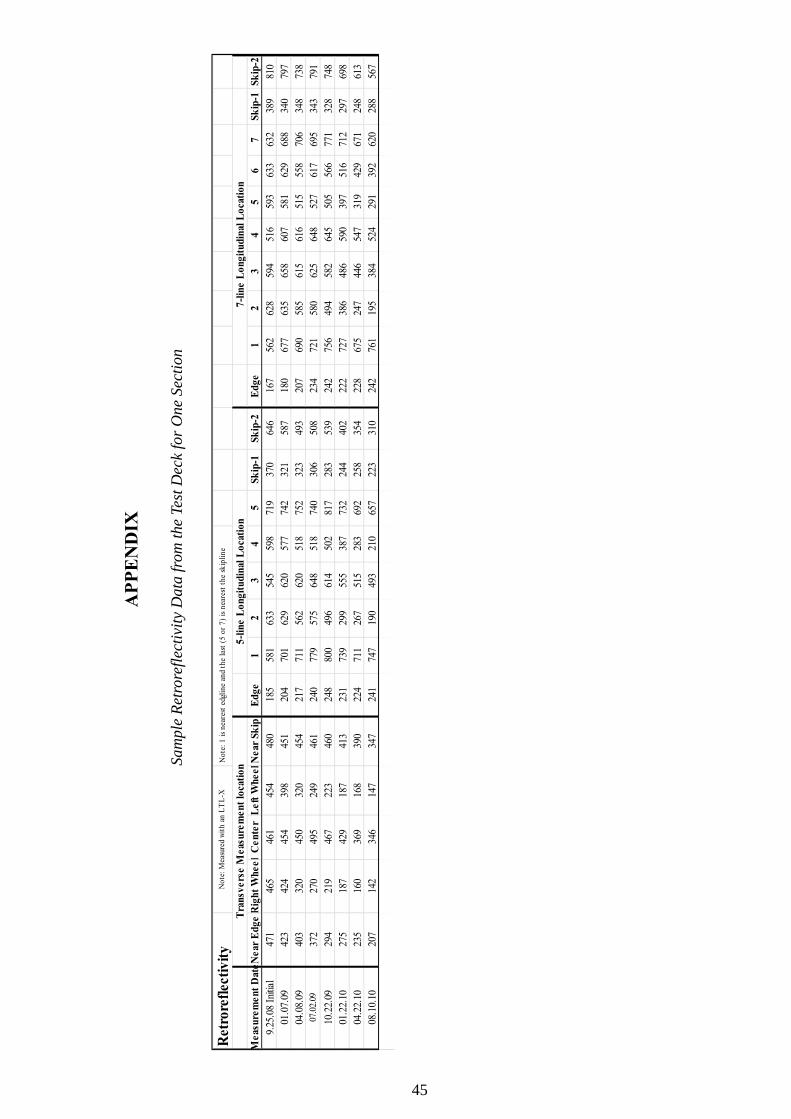
Retroreflectivity data, night color data, and day color data are measured in the field. These data items, along with product information, vendor, site information, installation date, etc. are stored in tables for further processing, as explained below. The example collected retroreflectivity data for a section can be examined in the appendix.
Retroreflectivity Data
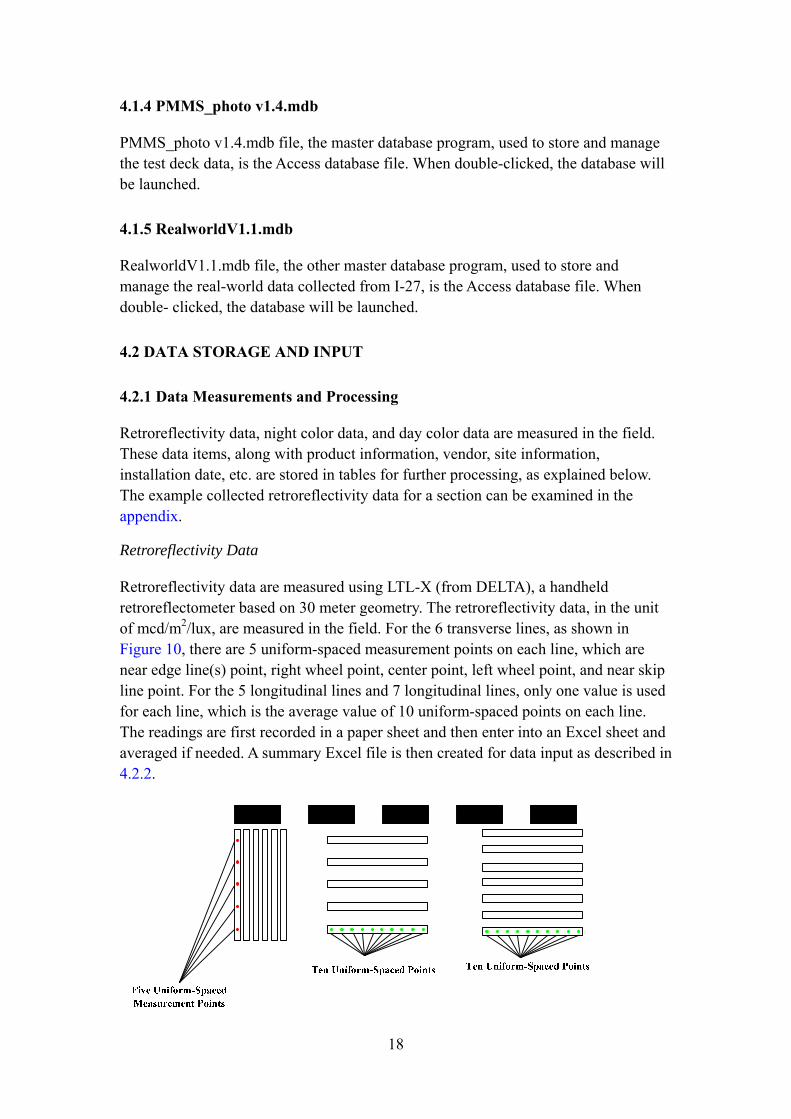
Retroreflectivity data are measured using LTL-X (from DELTA), a handheld retroreflectometer based on 30 meter geometry. The retroreflectivity data, in the unit of mcd/m2/lux, are measured in the field. For the 6 transverse lines, as shown in Figure 10, there are 5 uniform-spaced measurement points on each line, which are near edge line(s) point, right wheel point, center point, left wheel point, and near skip line point. For the 5 longitudinal lines and 7 longitudinal lines, only one value is used for each line, which is the average value of 10 uniform-spaced points on each line. The readings are first recorded in a paper sheet and then enter into an Excel sheet and averaged if needed. A summary Excel file is then created for data input as described in 4.2.2.
19
Figure 10. Definition of the Measurement Points.
Nighttime Color Data
Nighttime color measurements are taken using LTL-Y. After entering the original data into Excel files, the average data can be easily obtained. Using Excel, the RGB data can be converted into RLXY data, which are then typed into a summary file.
Daytime Color Data
Daytime color measurements are taken using the BYK color-guide. The process of obtaining the data is almost the same as the nighttime color data except for the converting process as the data coming from the BYK color-guide is already RLXY type data. In this case, the converting step can be bypassed, and the data can be directly typed into a summary file.
4.2.2 Data Input
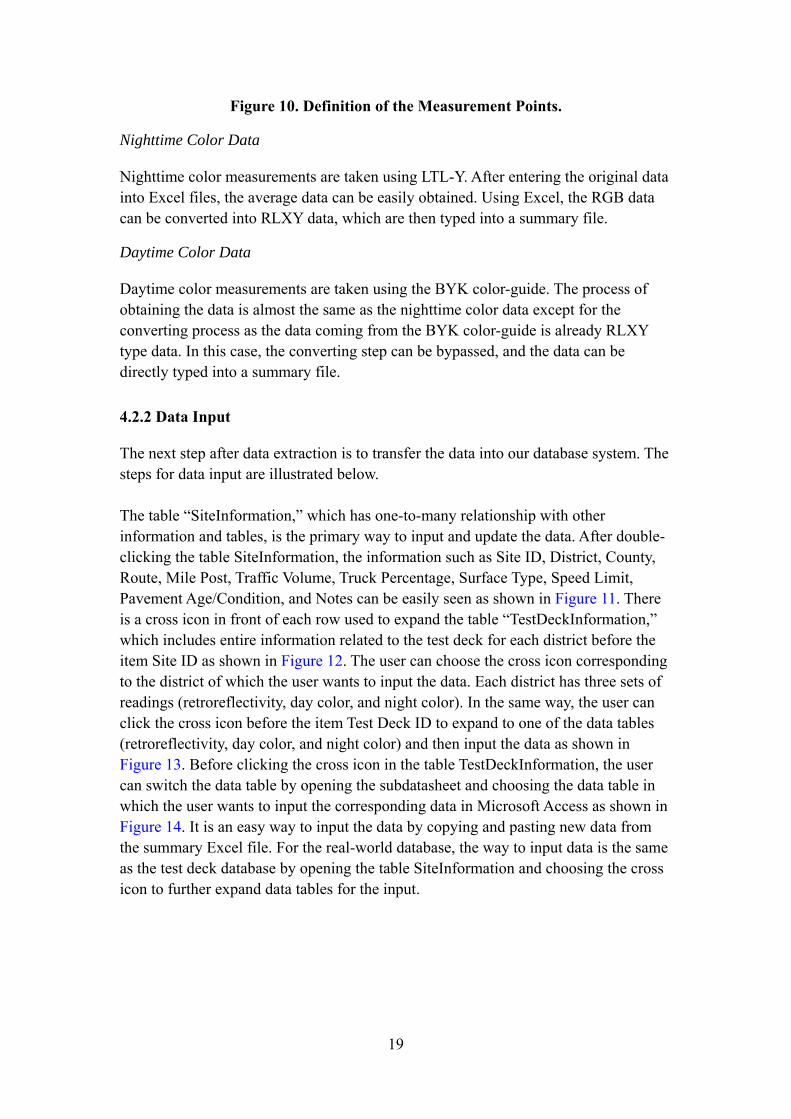
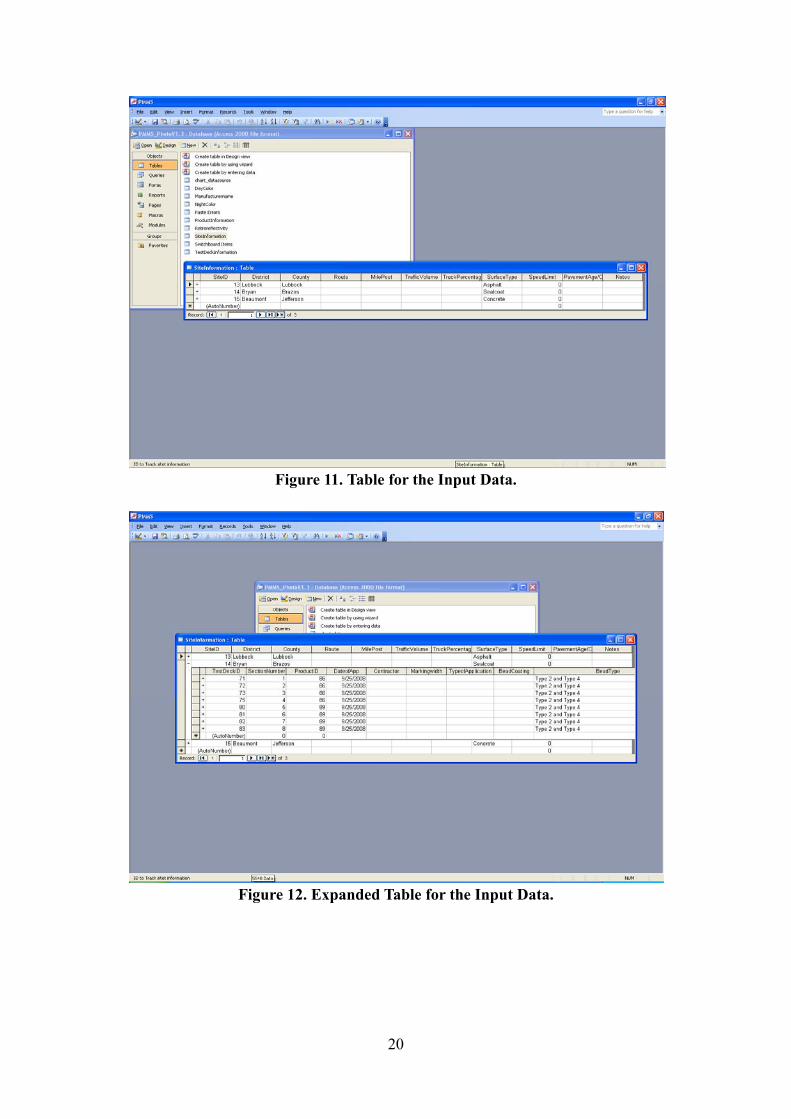
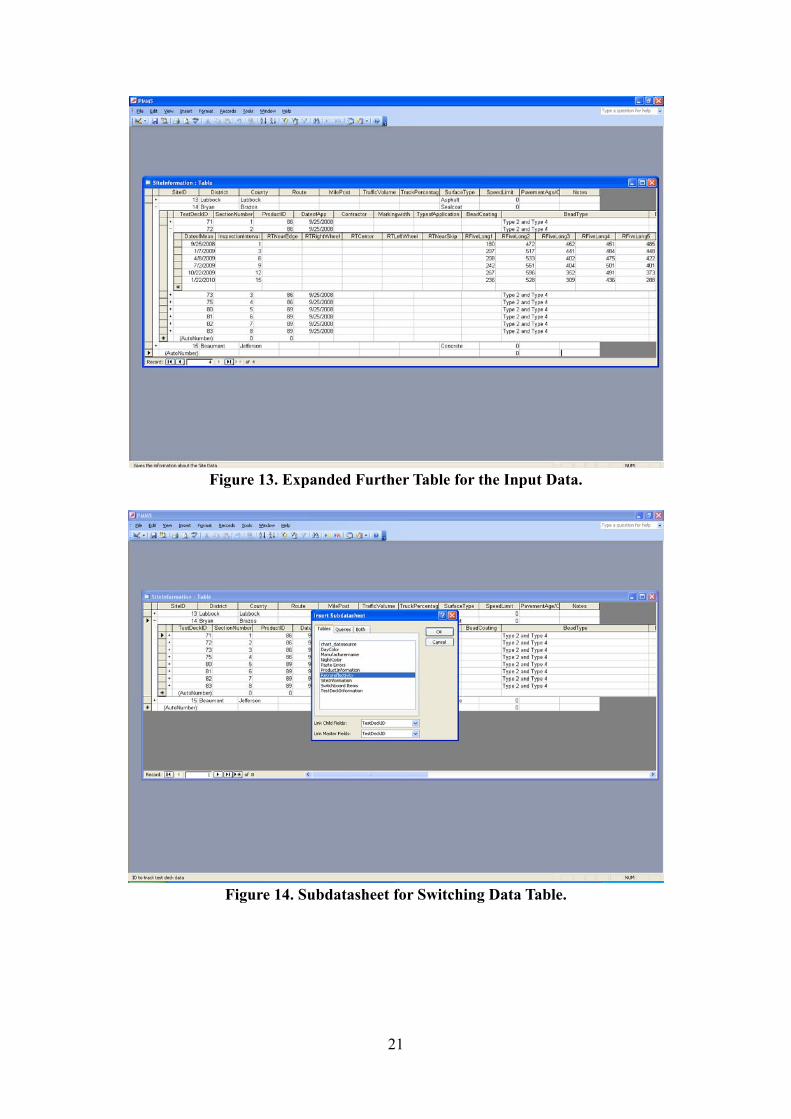
The next step after data extraction is to transfer the data into our database system. The steps for data input are illustrated below. The table “SiteInformation,” which has one-to-many relationship with other information and tables, is the primary way to input and update the data. After double- clicking the table SiteInformation, the information such as Site ID, District, County, Route, Mile Post, Traffic Volume, Truck Percentage, Surface Type, Speed Limit, Pavement Age/Condition, and Notes can be easily seen as shown in Figure 11. There is a cross icon in front of each row used to expand the table “TestDeckInformation,” which includes entire information related to the test deck for each district before the item Site ID as shown in Figure 12. The user can choose the cross icon corresponding to the district of which the user wants to input the data. Each district has three sets of readings (retroreflectivity, day color, and night color). In the same way, the user can click the cross icon before the item Test Deck ID to expand to one of the data tables (retroreflectivity, day color, and night color) and then input the data as shown in Figure 13. Before clicking the cross icon in the table TestDeckInformation, the user can switch the data table by opening the subdatasheet and choosing the data table in which the user wants to input the corresponding data in Microsoft Access as shown in Figure 14. It is an easy way to input the data by copying and pasting new data from the summary Excel file. For the real-world database, the way to input data is the same as the test deck database by opening the table SiteInformation and choosing the cross icon to further expand data tables for the input.
20
Figure 11. Table for the Input Data.
Figure 12. Expanded Table for the Input Data.
21
Figure 13. Expanded Further Table for the Input Data.
Figure 14. Subdatasheet for Switching Data Table.
22
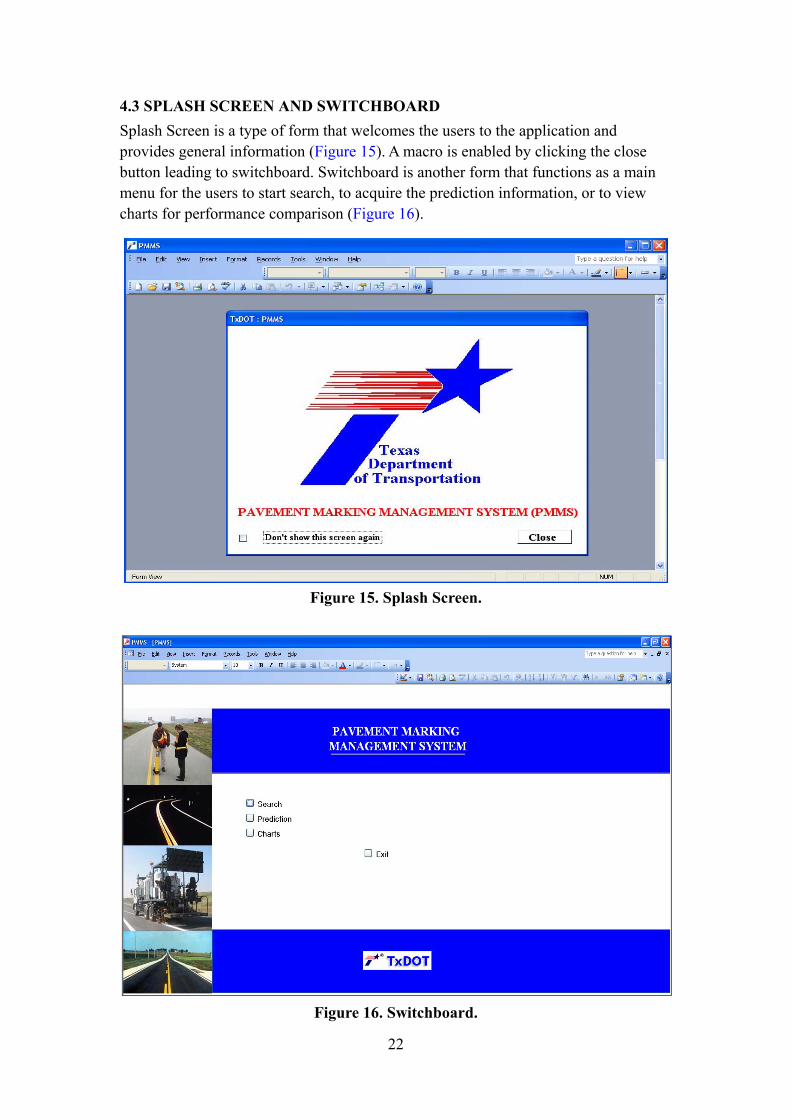
4.3 SPLASH SCREEN AND SWITCHBOARD Splash Screen is a type of form that welcomes the users to the application and provides general information (Figure 15). A macro is enabled by clicking the close button leading to switchboard. Switchboard is another form that functions as a main menu for the users to start search, to acquire the prediction information, or to view charts for performance comparison (Figure 16).
Figure 15. Splash Screen.
Figure 16. Switchboard.
23
4.4 SEARCH
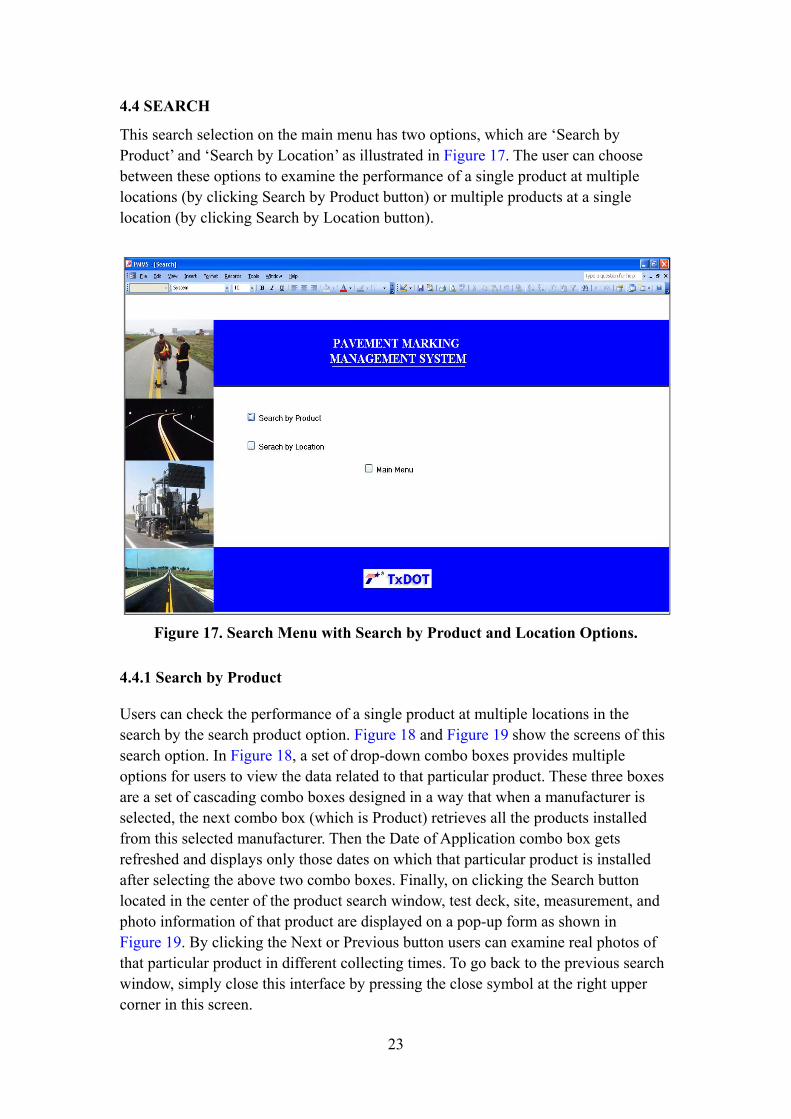
This search selection on the main menu has two options, which are ‘Search by Product’ and ‘Search by Location’ as illustrated in Figure 17. The user can choose between these options to examine the performance of a single product at multiple locations (by clicking Search by Product button) or multiple products at a single location (by clicking Search by Location button).
Figure 17. Search Menu with Search by Product and Location Options.
4.4.1 Search by Product
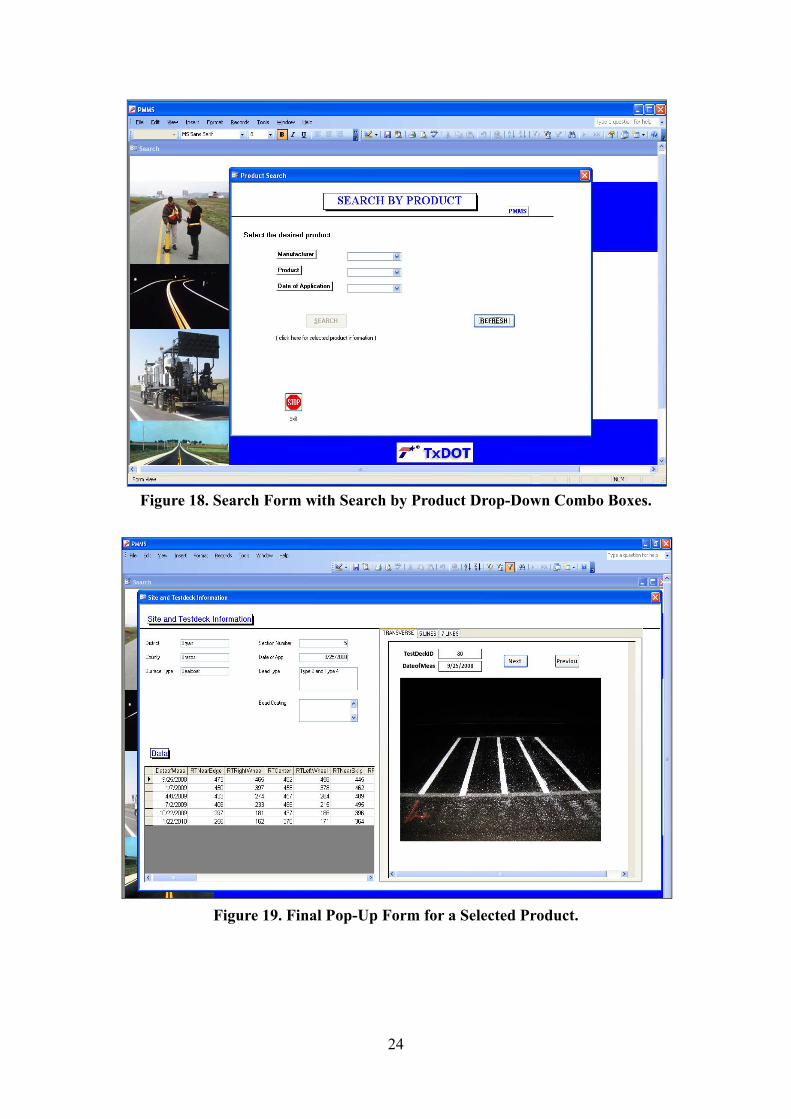
Users can check the performance of a single product at multiple locations in the search by the search product option. Figure 18 and Figure 19 show the screens of this search option. In Figure 18, a set of drop-down combo boxes provides multiple options for users to view the data related to that particular product. These three boxes are a set of cascading combo boxes designed in a way that when a manufacturer is selected, the next combo box (which is Product) retrieves all the products installed from this selected manufacturer. Then the Date of Application combo box gets refreshed and displays only those dates on which that particular product is installed after selecting the above two combo boxes. Finally, on clicking the Search button located in the center of the product search window, test deck, site, measurement, and photo information of that product are displayed on a pop-up form as shown in Figure 19. By clicking the Next or Previous button users can examine real photos of that particular product in different collecting times. To go back to the previous search window, simply close this interface by pressing the close symbol at the right upper corner in this screen.
24
Figure 18. Search Form with Search by Product Drop-Down Combo Boxes.
Figure 19. Final Pop-Up Form for a Selected Product.
25
4.4.2 Search by Location
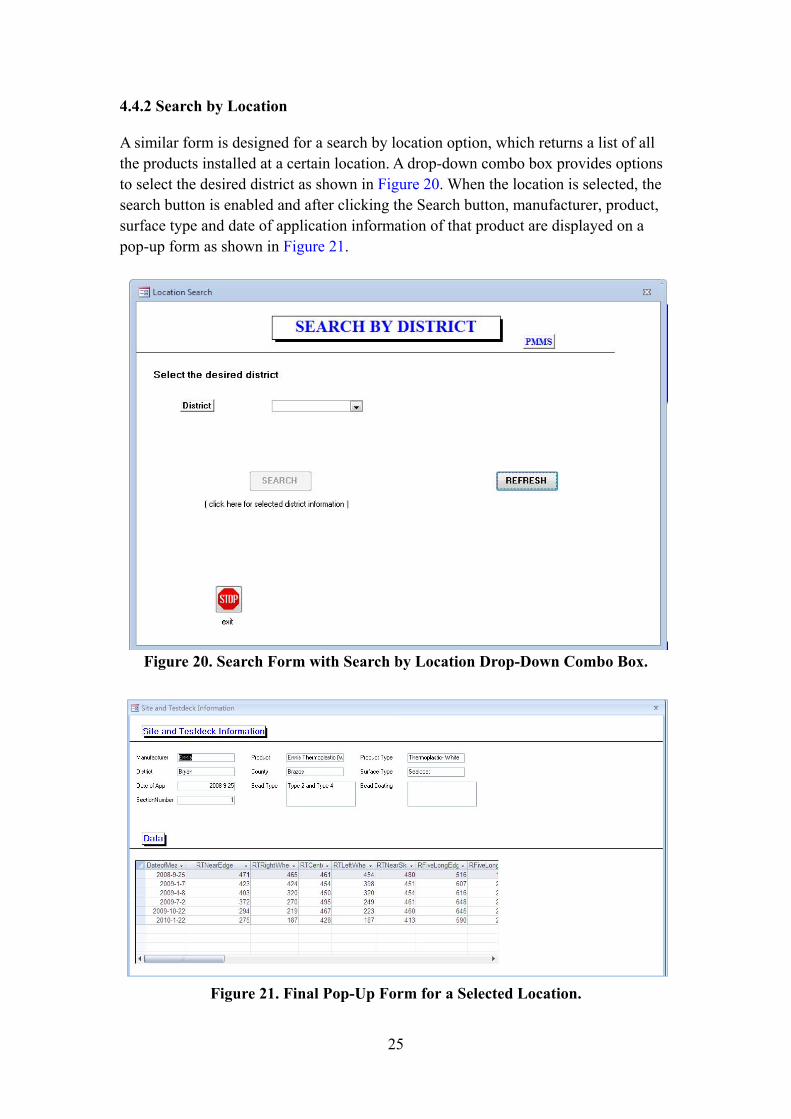
A similar form is designed for a search by location option, which returns a list of all the products installed at a certain location. A drop-down combo box provides options to select the desired district as shown in Figure 20. When the location is selected, the search button is enabled and after clicking the Search button, manufacturer, product, surface type and date of application information of that product are displayed on a pop-up form as shown in Figure 21.
Figure 20. Search Form with Search by Location Drop-Down Combo Box.
Figure 21. Final Pop-Up Form for a Selected Location.
26
4.5 PREDICTION
The prediction option provides the predicted information for each measurement point at a certain location. The prediction is made with a time series approach and is based on historical reading without considering the specifics of the product itself or the surface type the product is installed on. Information related to prediction method is documented in the project final report.
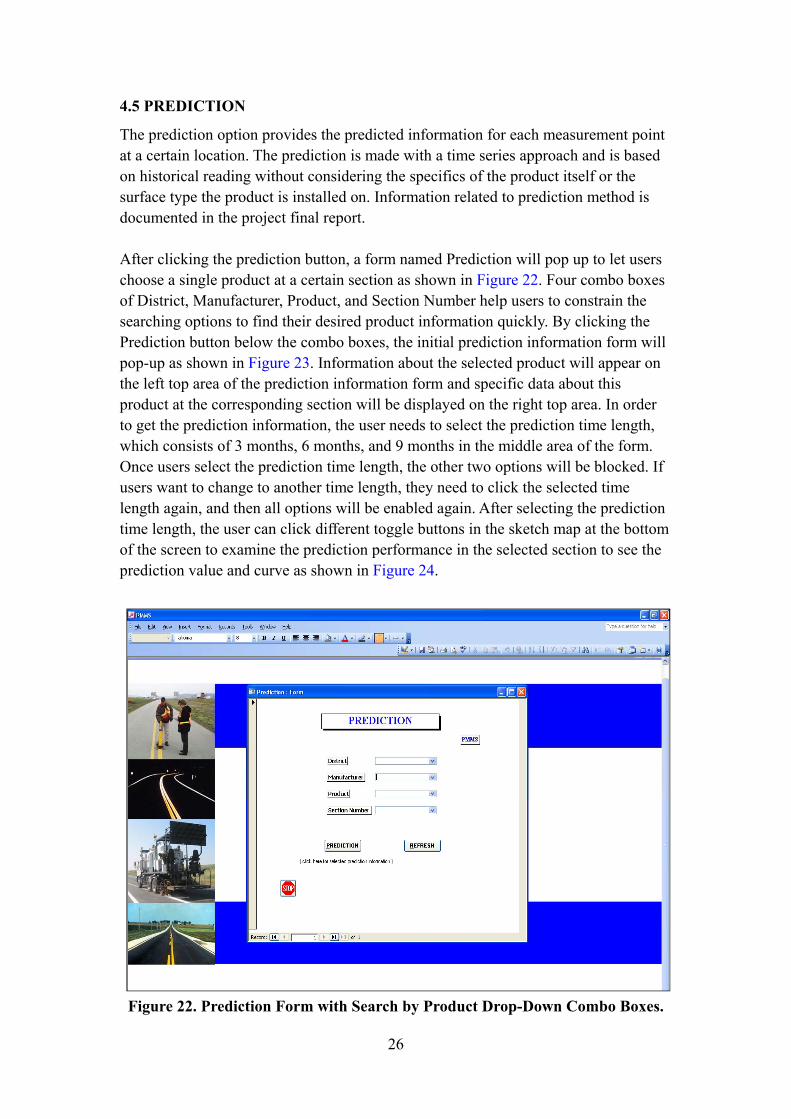
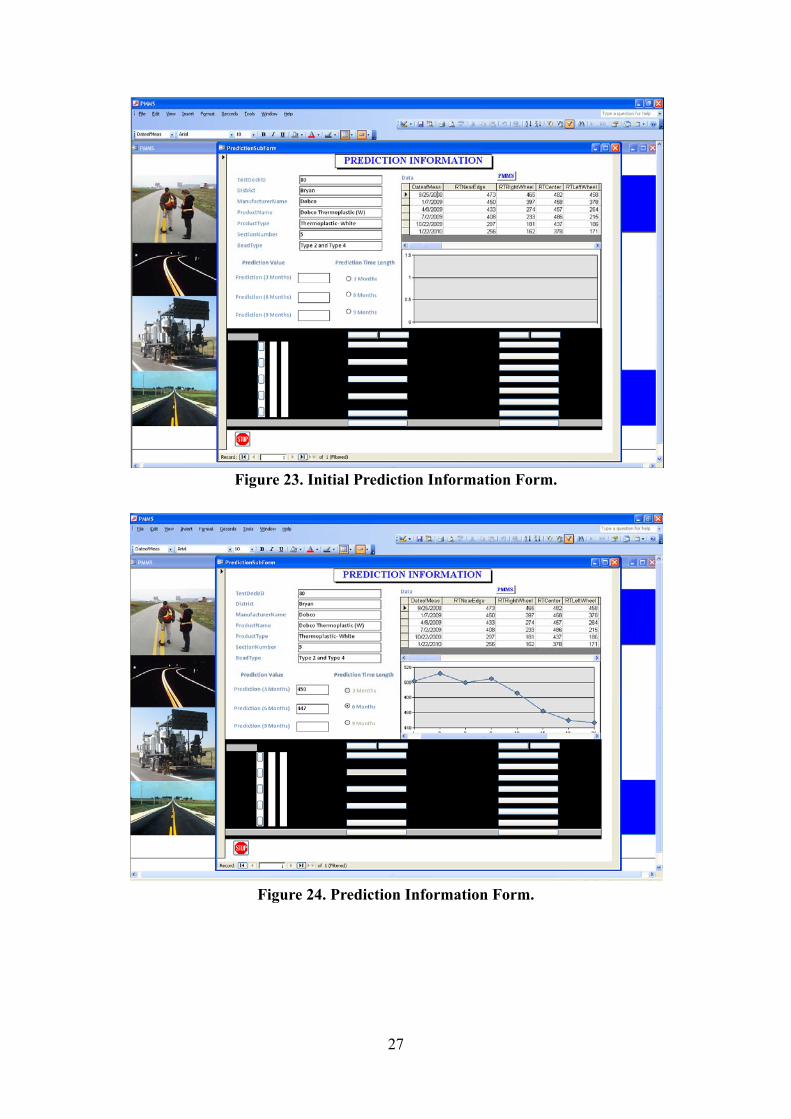
After clicking the prediction button, a form named Prediction will pop up to let users choose a single product at a certain section as shown in Figure 22. Four combo boxes of District, Manufacturer, Product, and Section Number help users to constrain the searching options to find their desired product information quickly. By clicking the Prediction button below the combo boxes, the initial prediction information form will pop-up as shown in Figure 23. Information about the selected product will appear on the left top area of the prediction information form and specific data about this product at the corresponding section will be displayed on the right top area. In order to get the prediction information, the user needs to select the prediction time length, which consists of 3 months, 6 months, and 9 months in the middle area of the form. Once users select the prediction time length, the other two options will be blocked. If users want to change to another time length, they need to click the selected time length again, and then all options will be enabled again. After selecting the prediction time length, the user can click different toggle buttons in the sketch map at the bottom of the screen to examine the prediction performance in the selected section to see the prediction value and curve as shown in Figure 24.
Figure 22. Prediction Form with Search by Product Drop-Down Combo Boxes.
27
Figure 23. Initial Prediction Information Form.
Figure 24. Prediction Information Form.
28
4.6 CHARTS
The charts option in the main menu allows users to view the performance of the products graphically, and users can choose either Interactive Chart or Interactive Form to monitor the performance of the products.
4.6.1 Interactive Chart
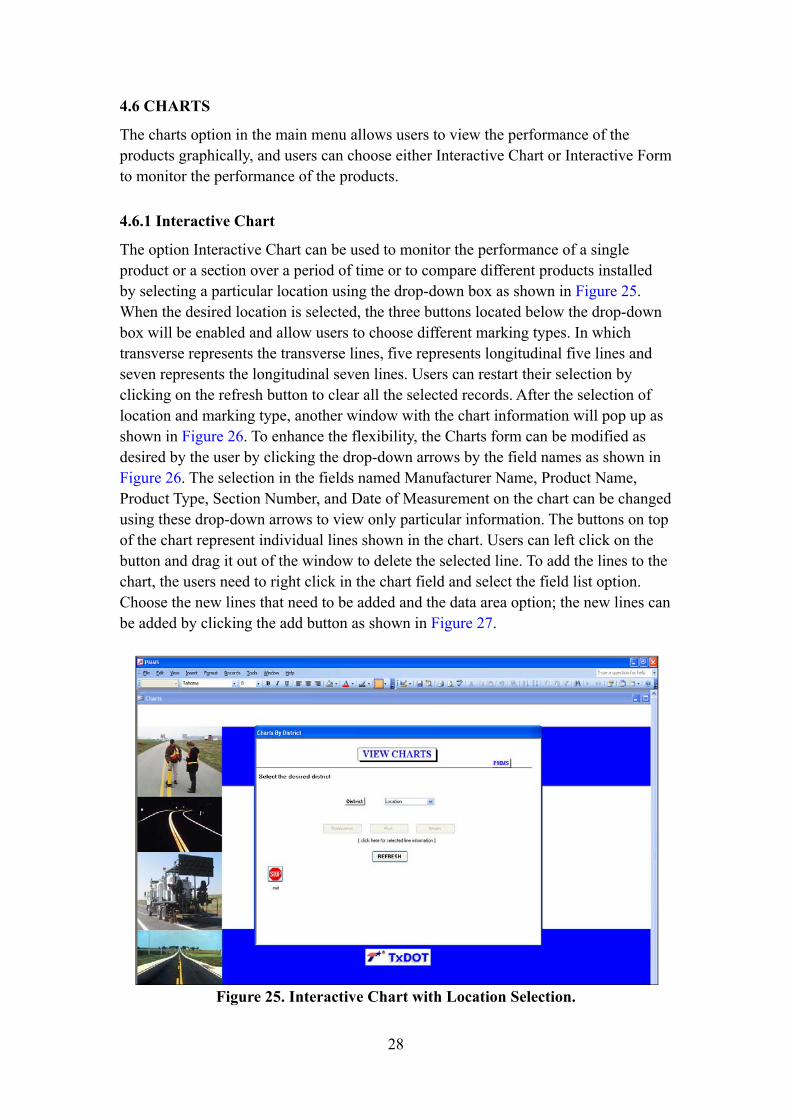
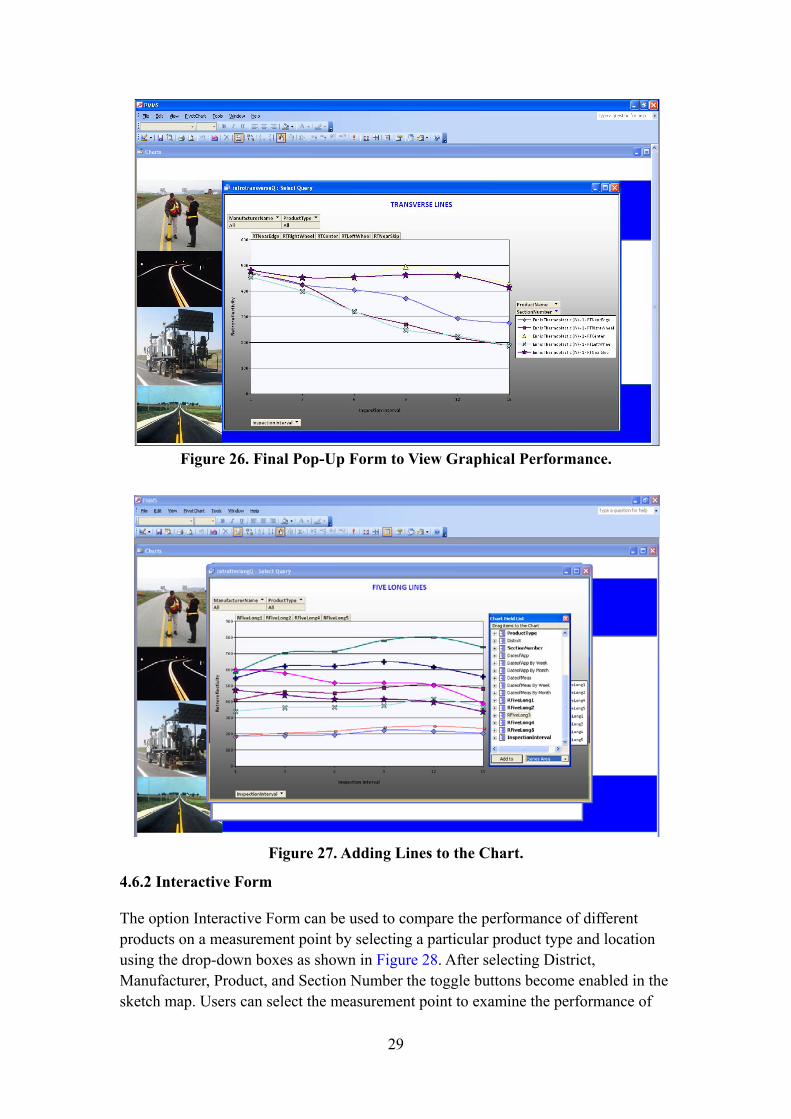
The option Interactive Chart can be used to monitor the performance of a single product or a section over a period of time or to compare different products installed by selecting a particular location using the drop-down box as shown in Figure 25. When the desired location is selected, the three buttons located below the drop-down box will be enabled and allow users to choose different marking types. In which transverse represents the transverse lines, five represents longitudinal five lines and seven represents the longitudinal seven lines. Users can restart their selection by clicking on the refresh button to clear all the selected records. After the selection of location and marking type, another window with the chart information will pop up as shown in Figure 26. To enhance the flexibility, the Charts form can be modified as desired by the user by clicking the drop-down arrows by the field names as shown in Figure 26. The selection in the fields named Manufacturer Name, Product Name, Product Type, Section Number, and Date of Measurement on the chart can be changed using these drop-down arrows to view only particular information. The buttons on top of the chart represent individual lines shown in the chart. Users can left click on the button and drag it out of the window to delete the selected line. To add the lines to the chart, the users need to right click in the chart field and select the field list option. Choose the new lines that need to be added and the data area option; the new lines can be added by clicking the add button as shown in Figure 27.
Figure 25. Interactive Chart with Location Selection.
29
Figure 26. Final Pop-Up Form to View Graphical Performance.
Figure 27. Adding Lines to the Chart.
4.6.2 Interactive Form
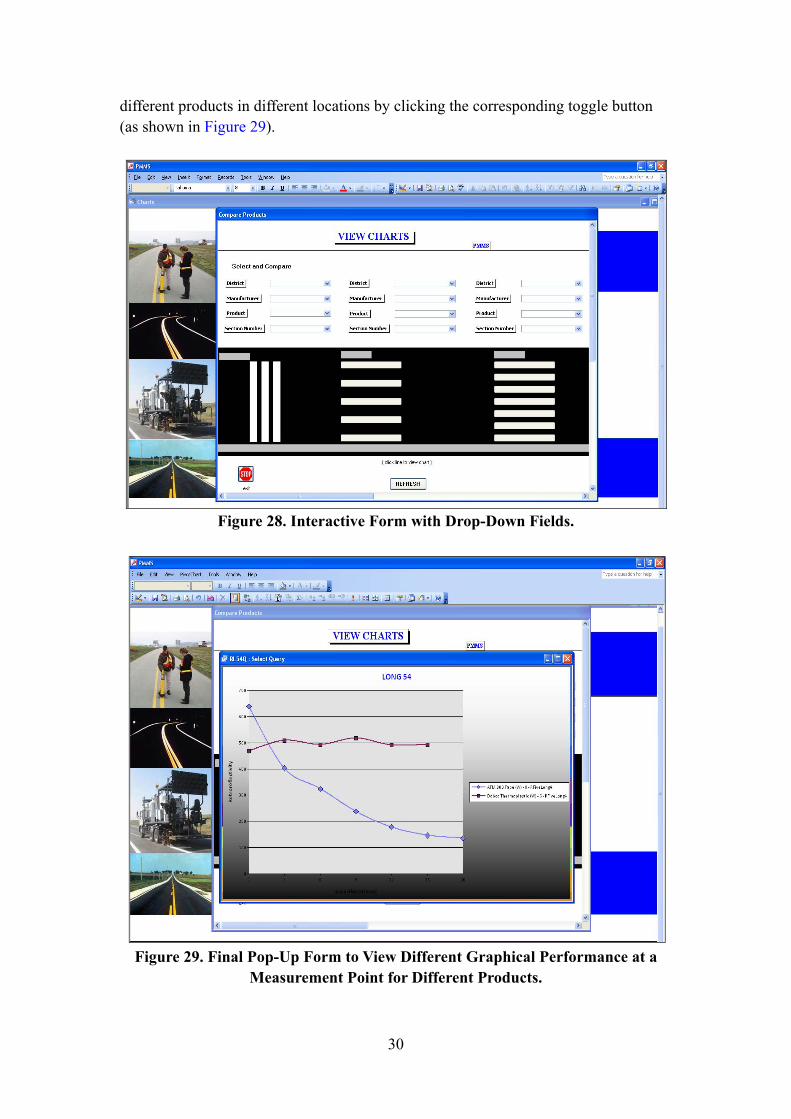
The option Interactive Form can be used to compare the performance of different products on a measurement point by selecting a particular product type and location using the drop-down boxes as shown in Figure 28. After selecting District, Manufacturer, Product, and Section Number the toggle buttons become enabled in the sketch map. Users can select the measurement point to examine the performance of
30
different products in different locations by clicking the corresponding toggle button (as shown in Figure 29).
Figure 28. Interactive Form with Drop-Down Fields.
Figure 29. Final Pop-Up Form to View Different Graphical Performance at a
Measurement Point for Different Products.
31
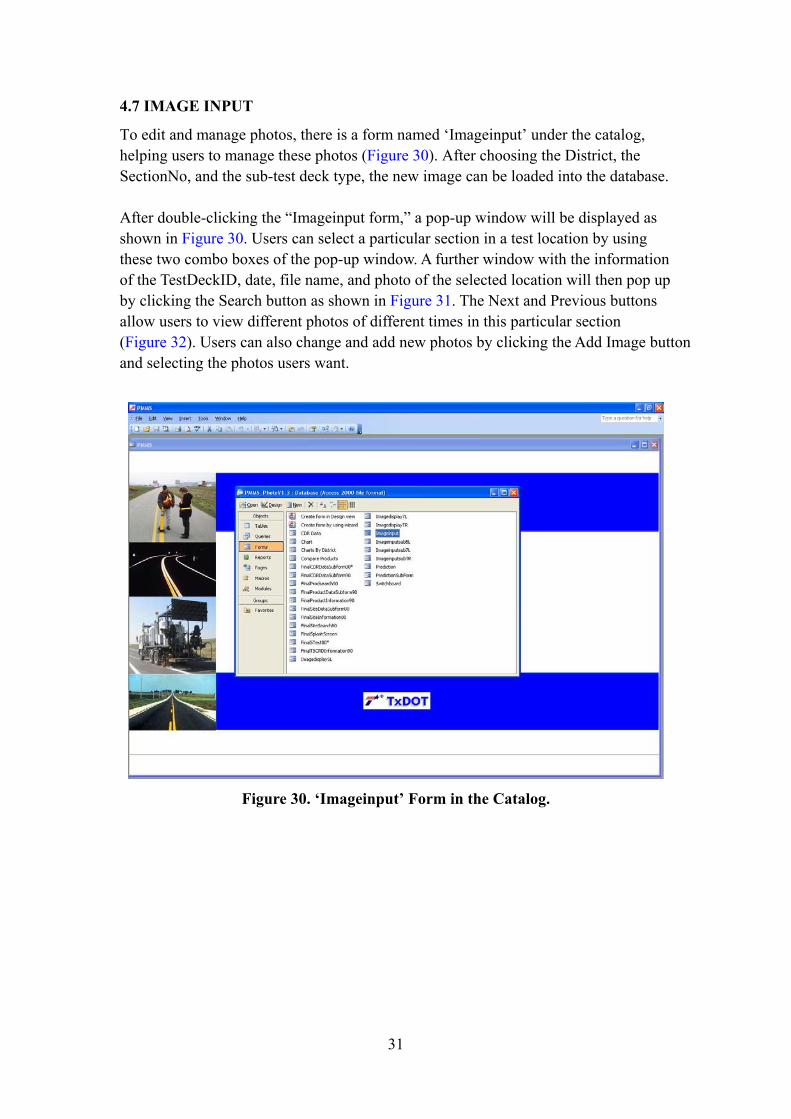
4.7 IMAGE INPUT
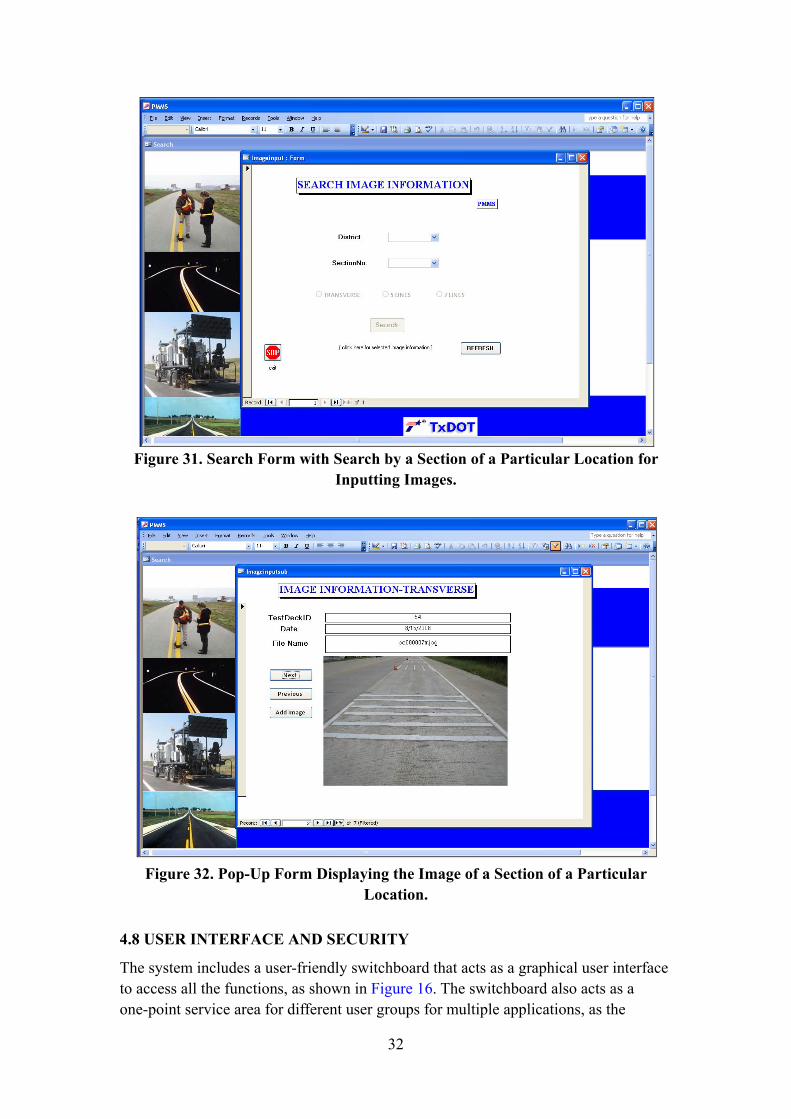
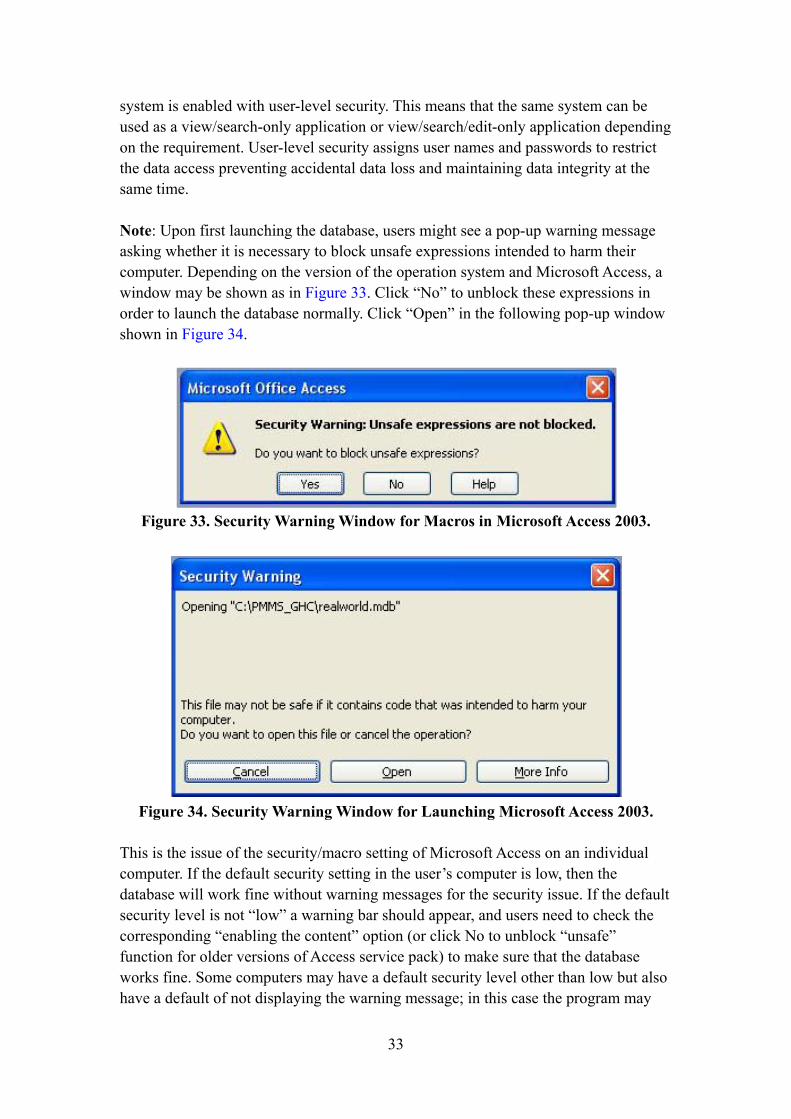
To edit and manage photos, there is a form named ‘Imageinput’ under the catalog, helping users to manage these photos (Figure 30). After choosing the District, the SectionNo, and the sub-test deck type, the new image can be loaded into the database. After double-clicking the “Imageinput form,” a pop-up window will be displayed as shown in Figure 30. Users can select a particular section in a test location by using these two combo boxes of the pop-up window. A further window with the information of the TestDeckID, date, file name, and photo of the selected location will then pop up by clicking the Search button as shown in Figure 31. The Next and Previous buttons allow users to view different photos of different times in this particular section (Figure 32). Users can also change and add new photos by clicking the Add Image button and selecting the photos users want.
Figure 30. ‘Imageinput’ Form in the Catalog.
32
Figure 31. Search Form with Search by a Section of a Particular Location for
Inputting Images.
Figure 32. Pop-Up Form Displaying the Image of a Section of a Particular
Location.
4.8 USER INTERFACE AND SECURITY
The system includes a user-friendly switchboard that acts as a graphical user interface to access all the functions, as shown in Figure 16. The switchboard also acts as a one-point service area for different user groups for multiple applications, as the
33
system is enabled with user-level security. This means that the same system can be used as a view/search-only application or view/search/edit-only application depending on the requirement. User-level security assigns user names and passwords to restrict the data access preventing accidental data loss and maintaining data integrity at the same time. Note: Upon first launching the database, users might see a pop-up warning message asking whether it is necessary to block unsafe expressions intended to harm their computer. Depending on the version of the operation system and Microsoft Access, a window may be shown as in Figure 33. Click “No” to unblock these expressions in order to launch the database normally. Click “Open” in the following pop-up window shown in Figure 34.
Figure 33. Security Warning Window for Macros in Microsoft Access 2003.
Figure 34. Security Warning Window for Launching Microsoft Access 2003.
This is the issue of the security/macro setting of Microsoft Access on an individual computer. If the default security setting in the user’s computer is low, then the database will work fine without warning messages for the security issue. If the default security level is not “low” a warning bar should appear, and users need to check the corresponding “enabling the content” option (or click No to unblock “unsafe” function for older versions of Access service pack) to make sure that the database works fine. Some computers may have a default security level other than low but also have a default of not displaying the warning message; in this case the program may
34
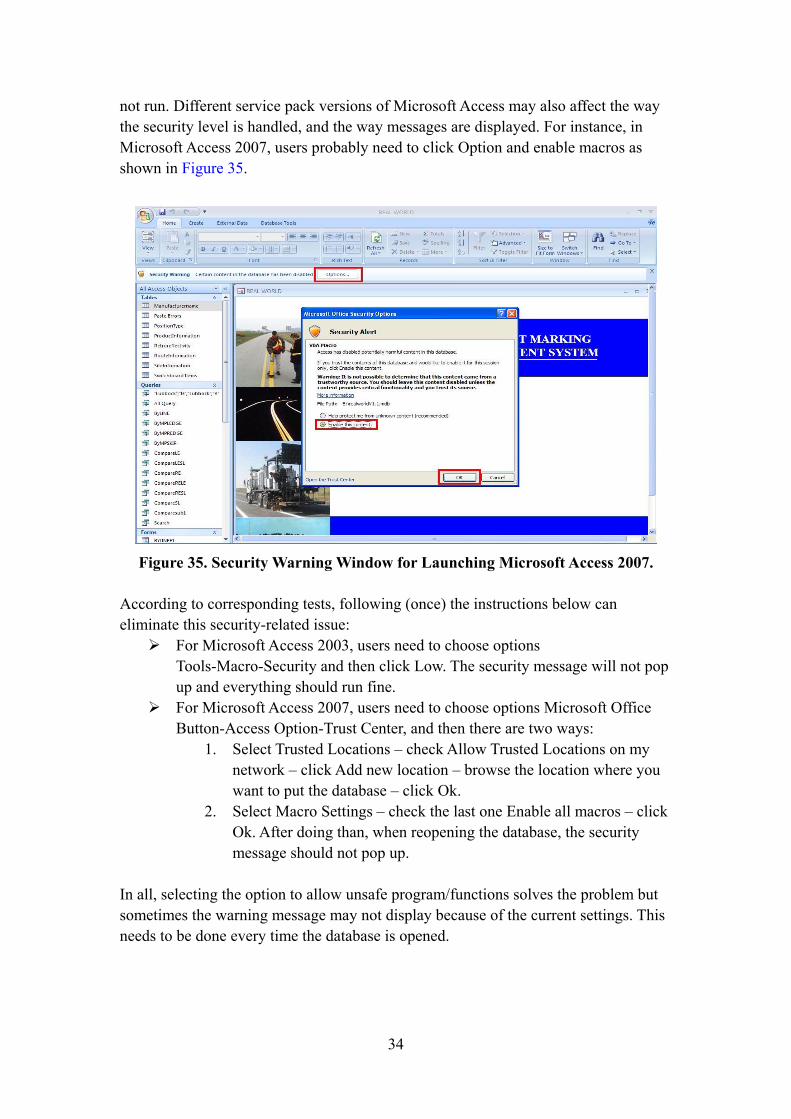
not run. Different service pack versions of Microsoft Access may also affect the way the security level is handled, and the way messages are displayed. For instance, in Microsoft Access 2007, users probably need to click Option and enable macros as shown in Figure 35.
Figure 35. Security Warning Window for Launching Microsoft Access 2007.
According to corresponding tests, following (once) the instructions below can eliminate this security-related issue:
For Microsoft Access 2003, users need to choose options Tools-Macro-Security and then click Low. The security message will not pop up and everything should run fine.
For Microsoft Access 2007, users need to choose options Microsoft Office Button-Access Option-Trust Center, and then there are two ways:
1. Select Trusted Locations – check Allow Trusted Locations on my network – click Add new location – browse the location where you want to put the database – click Ok.
2. Select Macro Settings – check the last one Enable all macros – click Ok. After doing than, when reopening the database, the security message should not pop up.
In all, selecting the option to allow unsafe program/functions solves the problem but sometimes the warning message may not display because of the current settings. This needs to be done every time the database is opened.
35
4.9 REAL-WORLD DATABASE
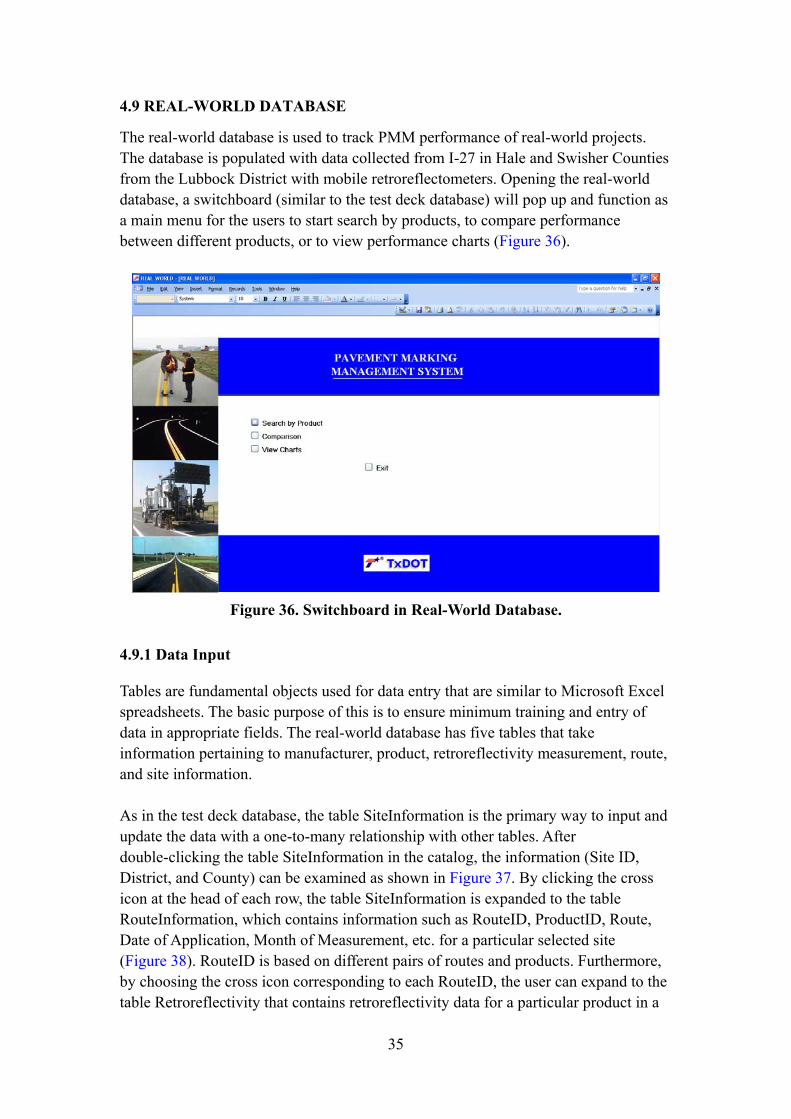
The real-world database is used to track PMM performance of real-world projects. The database is populated with data collected from I-27 in Hale and Swisher Counties from the Lubbock District with mobile retroreflectometers. Opening the real-world database, a switchboard (similar to the test deck database) will pop up and function as a main menu for the users to start search by products, to compare performance between different products, or to view performance charts (Figure 36).
Figure 36. Switchboard in Real-World Database.
4.9.1 Data Input
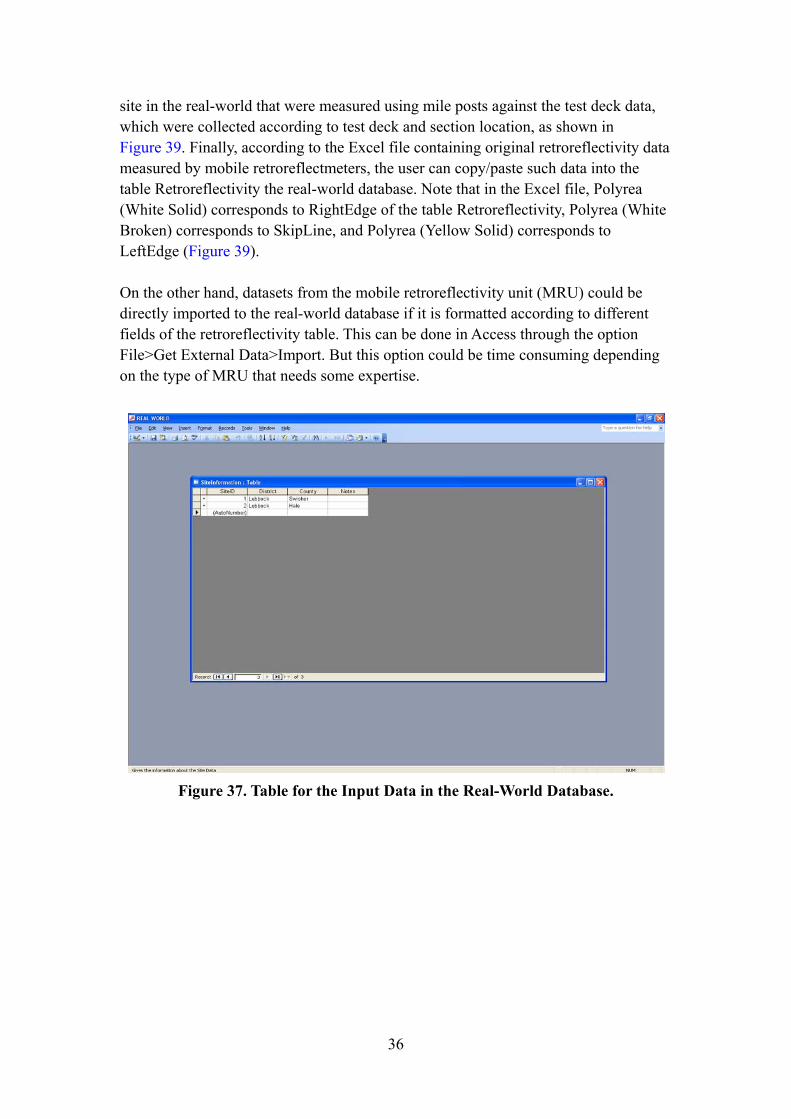
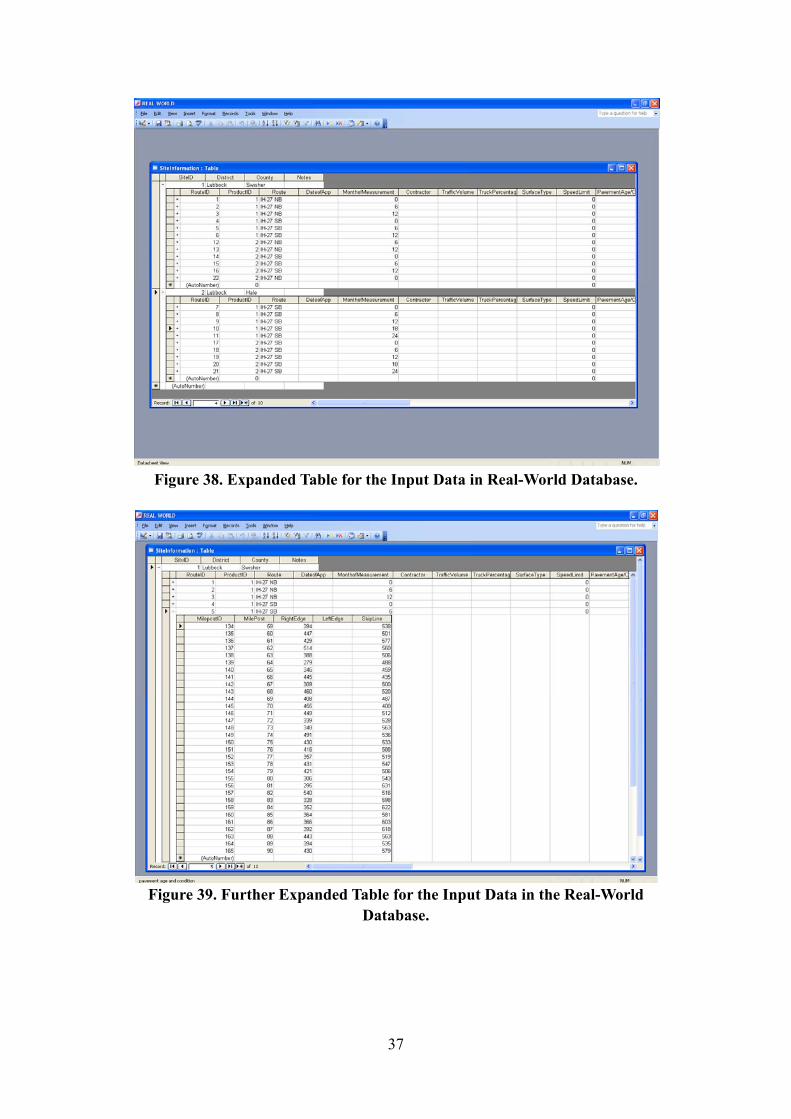
Tables are fundamental objects used for data entry that are similar to Microsoft Excel spreadsheets. The basic purpose of this is to ensure minimum training and entry of data in appropriate fields. The real-world database has five tables that take information pertaining to manufacturer, product, retroreflectivity measurement, route, and site information. As in the test deck database, the table SiteInformation is the primary way to input and update the data with a one-to-many relationship with other tables. After double-clicking the table SiteInformation in the catalog, the information (Site ID, District, and County) can be examined as shown in Figure 37. By clicking the cross icon at the head of each row, the table SiteInformation is expanded to the table RouteInformation, which contains information such as RouteID, ProductID, Route, Date of Application, Month of Measurement, etc. for a particular selected site (Figure 38). RouteID is based on different pairs of routes and products. Furthermore, by choosing the cross icon corresponding to each RouteID, the user can expand to the table Retroreflectivity that contains retroreflectivity data for a particular product in a
36
site in the real-world that were measured using mile posts against the test deck data, which were collected according to test deck and section location, as shown in Figure 39. Finally, according to the Excel file containing original retroreflectivity data measured by mobile retroreflectmeters, the user can copy/paste such data into the table Retroreflectivity the real-world database. Note that in the Excel file, Polyrea (White Solid) corresponds to RightEdge of the table Retroreflectivity, Polyrea (White Broken) corresponds to SkipLine, and Polyrea (Yellow Solid) corresponds to LeftEdge (Figure 39). On the other hand, datasets from the mobile retroreflectivity unit (MRU) could be directly imported to the real-world database if it is formatted according to different fields of the retroreflectivity table. This can be done in Access through the option File>Get External Data>Import. But this option could be time consuming depending on the type of MRU that needs some expertise.
Figure 37. Table for the Input Data in the Real-World Database.
37
Figure 38. Expanded Table for the Input Data in Real-World Database.
Figure 39. Further Expanded Table for the Input Data in the Real-World
Database.
38
4.9.2 Search by Product
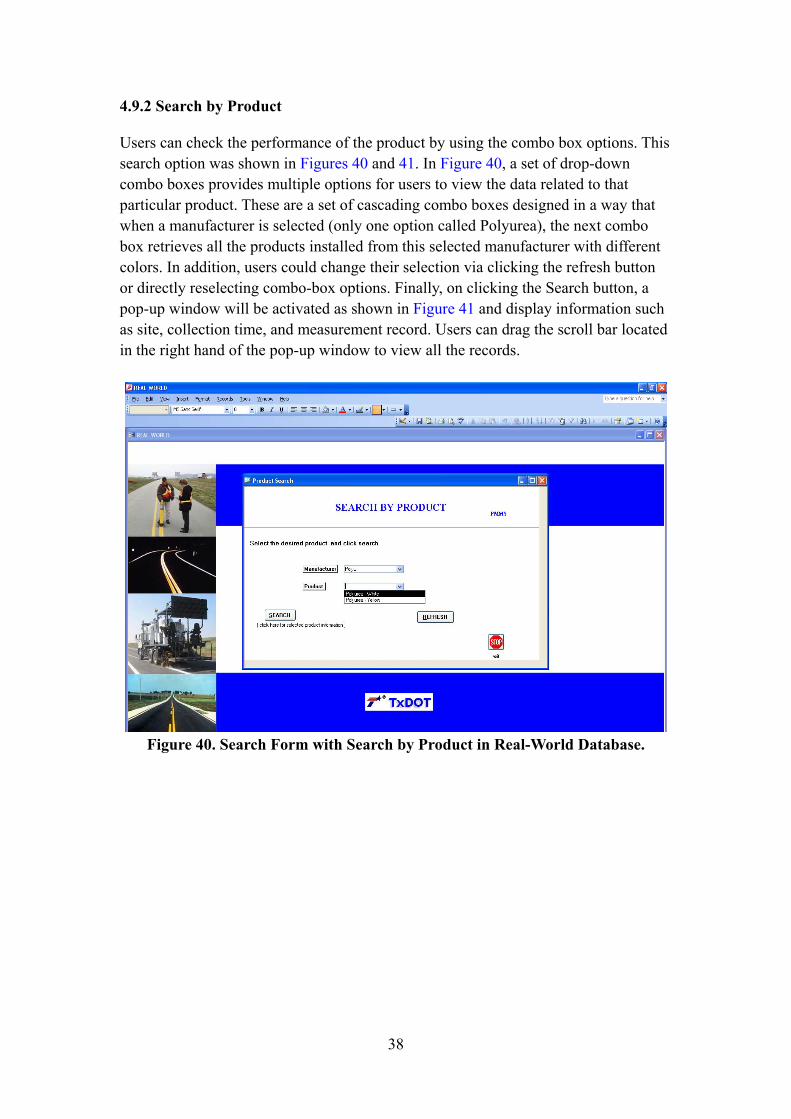
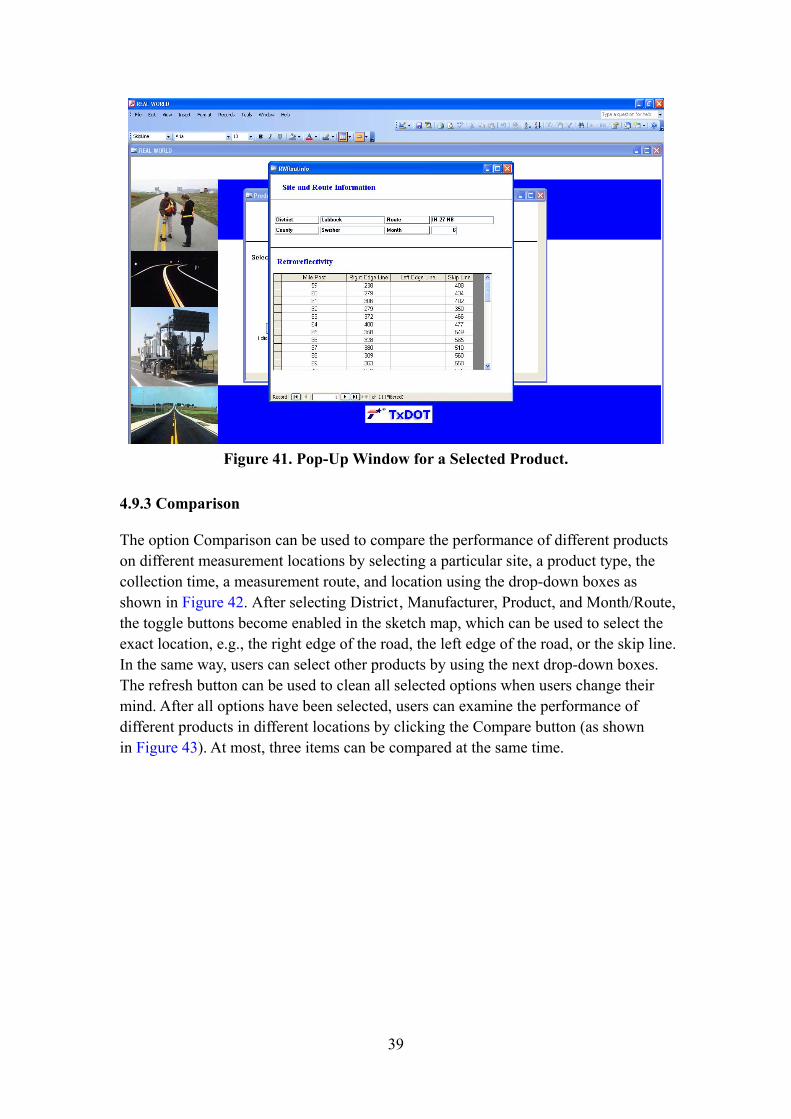
Users can check the performance of the product by using the combo box options. This search option was shown in Figures 40 and 41. In Figure 40, a set of drop-down combo boxes provides multiple options for users to view the data related to that particular product. These are a set of cascading combo boxes designed in a way that when a manufacturer is selected (only one option called Polyurea), the next combo box retrieves all the products installed from this selected manufacturer with different colors. In addition, users could change their selection via clicking the refresh button or directly reselecting combo-box options. Finally, on clicking the Search button, a pop-up window will be activated as shown in Figure 41 and display information such as site, collection time, and measurement record. Users can drag the scroll bar located in the right hand of the pop-up window to view all the records.
Figure 40. Search Form with Search by Product in Real-World Database.
39
Figure 41. Pop-Up Window for a Selected Product.
4.9.3 Comparison
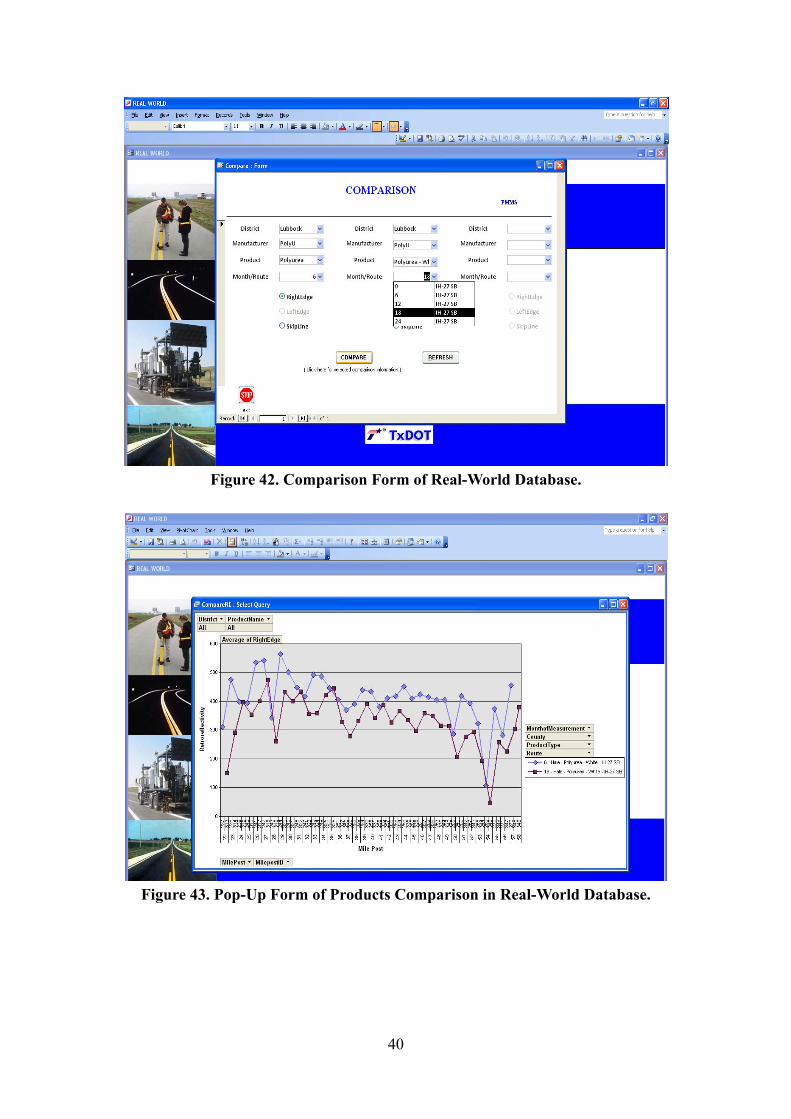
The option Comparison can be used to compare the performance of different products on different measurement locations by selecting a particular site, a product type, the collection time, a measurement route, and location using the drop-down boxes as shown in Figure 42. After selecting District, Manufacturer, Product, and Month/Route, the toggle buttons become enabled in the sketch map, which can be used to select the exact location, e.g., the right edge of the road, the left edge of the road, or the skip line. In the same way, users can select other products by using the next drop-down boxes. The refresh button can be used to clean all selected options when users change their mind. After all options have been selected, users can examine the performance of different products in different locations by clicking the Compare button (as shown in Figure 43). At most, three items can be compared at the same time.
40
Figure 42. Comparison Form of Real-World Database.
Figure 43. Pop-Up Form of Products Comparison in Real-World Database.
41
4.9.4 View Charts
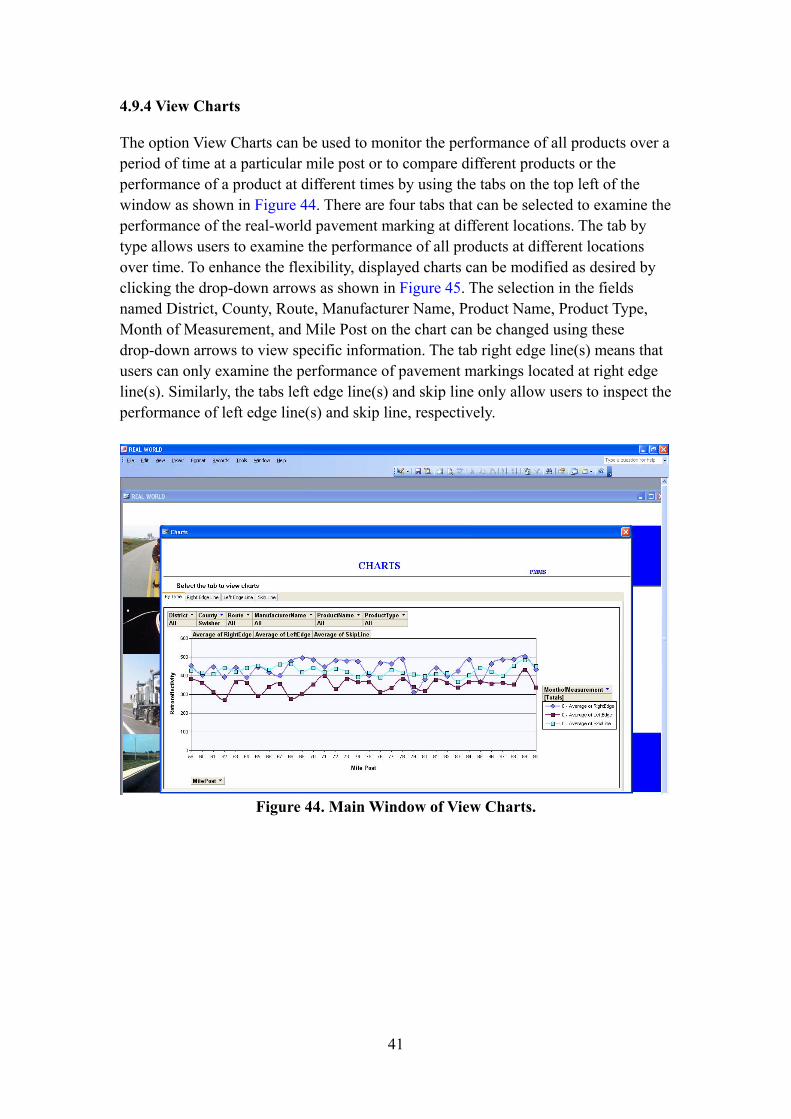
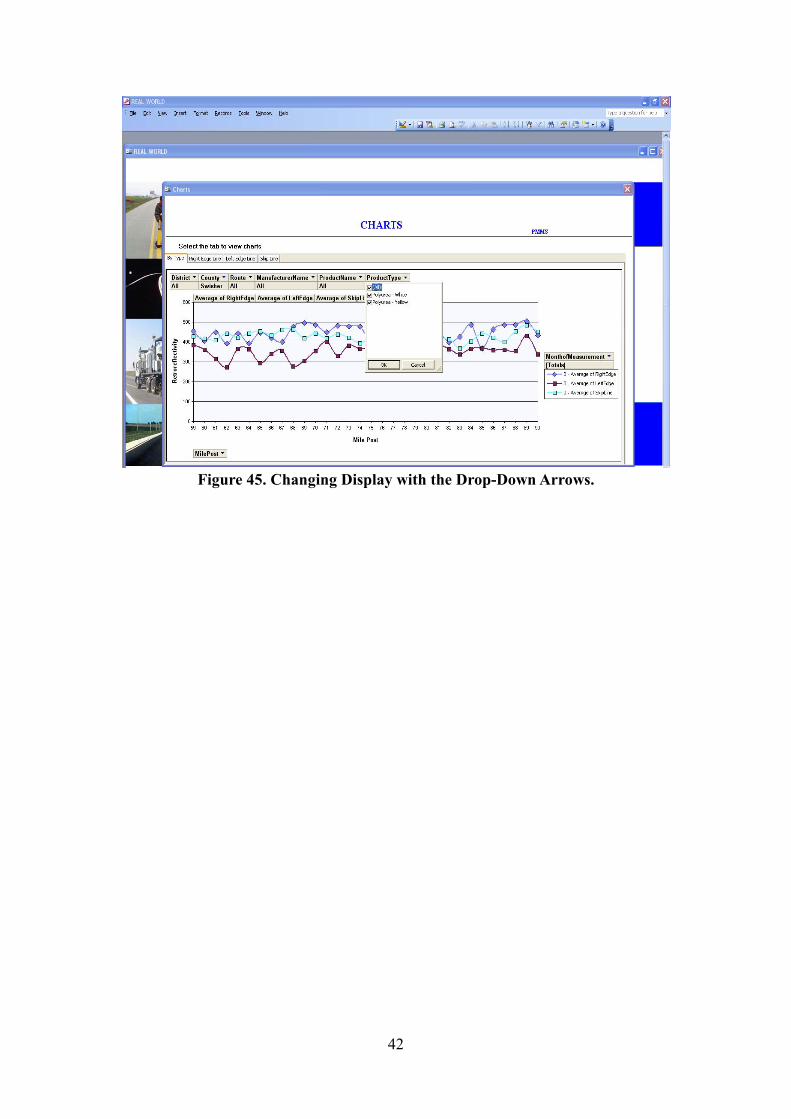
The option View Charts can be used to monitor the performance of all products over a period of time at a particular mile post or to compare different products or the performance of a product at different times by using the tabs on the top left of the window as shown in Figure 44. There are four tabs that can be selected to examine the performance of the real-world pavement marking at different locations. The tab by type allows users to examine the performance of all products at different locations over time. To enhance the flexibility, displayed charts can be modified as desired by clicking the drop-down arrows as shown in Figure 45. The selection in the fields named District, County, Route, Manufacturer Name, Product Name, Product Type, Month of Measurement, and Mile Post on the chart can be changed using these drop-down arrows to view specific information. The tab right edge line(s) means that users can only examine the performance of pavement markings located at right edge line(s). Similarly, the tabs left edge line(s) and skip line only allow users to inspect the performance of left edge line(s) and skip line, respectively.
Figure 44. Main Window of View Charts.
42
Figure 45. Changing Display with the Drop-Down Arrows.
43
5 DATABASE UPDATE AND FUTURE RELEASE
Future release of the system would include capabilities of facilitating comparisons such as the performance of a product between high traffic and low traffic, or between roadways with different truck percentages. PMMS also facilitates intelligent data sharing between different platforms for future developments. In an event the project is extended and further evaluation is done beyond the initial project termination date, new data of long-term performance of PMMs will be added to the database.
45
APP
EN
DIX
Sam
ple
Retro
refle
ctiv
ity D
ata
from
the
Test
Dec
k fo
r One
Sec
tion
Not
e: 1
is n
eare
st e
dglin
e an
d th
e la
st (5
or 7
) is n
eare
st th
e sk
iplin
e
Mea
sure
men
t Dat
eNea
r Edg
eR
ight
Whe
elC
ente
rLe
ft W
heel
Nea
r Ski
pEd
ge1
23
45
Skip
-1Sk
ip-2
Edge
12
34
56
7Sk
ip-1
Skip
-29.
25.0
8 In
itial
471
465
461
454
480
185
581
633
545
598
719
370
646
167
562
628
594
516
593
633
632
389
810
01.0
7.09
423
424
454
398
451
204
701
629
620
577
742
321
587
180
677
635
658
607
581
629
688
340
797
04.0
8.09
403
320
450
320
454
217
711
562
620
518
752
323
493
207
690
585
615
616
515
558
706
348
738
07.02
.0937
227
049
524
946
124
077
957
564
851
874
030
650
823
472
158
062
564
852
761
769
534
379
110
.22.
0929
421
946
722
346
024
880
049
661
450
281
728
353
924
275
649
458
264
550
556
677
132
874
801
.22.
1027
518
742
918
741
323
173
929
955
538
773
224
440
222
272
738
648
659
039
751
671
229
769
804
.22.
1023
516
036
916
839
022
471
126
751
528
369
225
835
422
867
524
744
654
731
942
967
124
861
308
.10.
1020
714
234
614
734
724
174
719
049
321
065
722
331
024
276
119
538
452
429
139
262
028
856
7
Not
e: M
easu
red
with
an
LTL-
XR
etro
refle
ctiv
ityTr
ansv
erse
Mea
sure
men
t loc
atio
n5-
line
Long
itudi
nal L
ocat
ion
7-lin
e Lo
ngitu
dina
l Loc
atio
n
45
46
Sample Retroreflectivity Data Collected in the Real-World
Retroreflectivity Readings for Southbound I-27 in Hale County Polyurea - White Solid