Paving Cost Comparisons: Warm-Mix Asphalt vs. Concrete July 2014 PCA Market Intelligence Edward J. Sullivan Andrew Moss Chief Economist and Group Vice President Senior Market Intelligence Analyst 847.972.9006 [email protected]847.972.9068 [email protected]
Transcript
Paving Cost Comparisons: Warm-Mix Asphalt vs. Concrete
July 2014
PCA Market Intelligence
Edward J. Sullivan Andrew Moss Chief Economist and Group Vice President Senior Market Intelligence Analyst 847.972.9006 [email protected] 847.972.9068 [email protected]
Paving Cost Comparisons: Warm-Mix Asphalt vs. Concrete
Key Findings
• Concrete pavement enjoys both an initial and life cycle cost advantage over hot-mix asphalt
(HMA) as well as the most cost effective warm-mix asphalt (WMA) case for many roadways.
• WMA production uses less fuel than HMA. With temperature reductions of up to 100°F, burner fuel consumption can be reduced by up to 50 percent of HMA production levels; however, typical savings run between 11 and 35 percent.
• Estimates that reliance on warm mix asphalt could save the Department of Transportation
$3.6 billion are incomplete. When looking at just fuel cost savings, PCA was able to closely match that figure with $3.4 billion. What that number does not account for are admixture costs, which can negate a large portion of the fuel cost savings.
• Most WMA is produced using water-based foaming methods. According to the National Asphalt Pavement Association (NAPA), in 2012, 88 percent of all WMA produced was through water-based foaming at the plant. The remaining 12 percent used additives.
• Water-based foaming methods may require other additives. Water-based foaming
production carries the largest concern for moisture related problems. To counter increased moisture susceptibility, anti-stripping agents (ASA) may be required.
• There are durability concerns with WMA. Moisture susceptibility from incomplete aggregate
drying and insufficient binder stiffness can lead to pavement deformation such as rutting and fracturing. Multiple studies have addressed concerns that WMA is less resistant to such moisture problems than HMA. More research is required for moisture susceptibility as well as long-term analysis as it is still a relatively new technology.
1
Overview The U.S. Department of Transportation’s (DOT) current initiatives involve adopting best practices for the sake of efficiency and ultimately cost savings. The program Everyday Counts is one initiative. In this forum, WMA has been featured as an innovative technology that will play a big role in cost saving endeavors. Concerning this relatively new technology, the DOT suggests WMA could save “$3.6 billion by 2020.” 1 Research suggests that DOT estimates do not represent the net effect of fuel savings versus additional costs of additives and stripping agents. The savings estimates attached to WMA, therefore, may be exaggerated. In terms of cost saving initiatives, amidst even the strongest fuel saving case for WMA, concrete remains the most cost effective pavement material for many roadways. Concrete pavement not only costs less over the life cycle of a roadway, but since 2008, also outperforms asphalt on initial cost for many roadways. The purpose of this report was to investigate the proposed energy cost savings associated with producing WMA instead of traditional HMA, discuss the different production methods used and how they affect asphalt costs, shed light on potential problems with WMA, and demonstrate that concrete pavement is still the most cost effective choice and should be included in the infrastructure recovery dialogue. The real cost saver is not warm-mix asphalt….it’s concrete.
Source: WisPAVE, PCA WMA may be a cheaper alternative to HMA. Concrete, however, remains the most cost effective option for many roadway systems. Using DOT initial bid and life cycle cost software, analyses were performed to compare HMA to WMA. An equivalent concrete pavement road was also analyzed. For the WMA representative, the strongest fuel savings case of 50 percent was used. The only difference from the hot-
1 At the Transportation Research Board’s Annual Meeting in Washington, D.C. on January 15, 2014, Transportation Secretary Anthony Foxx outlined his vision for tackling the infrastructure deficit.
$0.0
$0.5
$1.0
$1.5
$2.0
$2.5
2013 2018 2023 2028 2033
Initial Bid Paving Costs Million Dollars Per Two Lane
Road Mile - Urban
WMA
Concrete
HMA
$0.0
$0.5
$1.0
$1.5
$2.0
$2.5
2013 2018 2023 2028 2033
Life Cycle Paving Costs Million Dollars Per Two Lane
Road Mile - Urban HMA
WMA
Concrete
2
mix equivalent was the savings due to burner fuel reductions – admixture and stripping agent costs were not included for this scenario. The warm-mix alternative clearly saves on cost compared to hot-mix, both on initial and life cycle costs. Compared to both the hot-mix case and the most favorable fuel savings case for warm-mix, concrete remains the least expensive option both for initial road construction and life cycle costs for many roadways. For an urban two-lane road in 2013, WMA paving costs were estimated at $852,238 per two-lane mile compared to $878,513 per two-lane mile for a HMA roadway – or a savings of roughly $26,000. Even with the WMA improvement in asphalt paving process, a concrete road was cheaper – requiring only $769,269 per two-lane mile, or roughly $83,000 dollars cheaper than the lowest cost asphalt paving process. By 2020, these savings are expected to grow2. The warm-mix roadway is estimated to save roughly $32,000 per two-lane mile over hot-mix. The concrete roadway is estimated to save almost $186,000 over the best warm-mix case3. What is Warm-Mix Asphalt? WMA is defined by the Federal Highway Administration (FHWA) as “a general term for technologies that reduce the temperature needed to produce and compact asphalt mixtures for the construction of pavements. WMA temperatures generally start 30° - 70°F lower during mixing and remain lower during trucking, placement, and compaction.” This equates to lower energy costs, specifically the amount of burner fuel used in asphalt production. Because lower temperatures are required to dry the aggregate and heat the final asphalt mix for pavement use, less fuel is burned in the process – resulting in the implied savings. While WMA can lead to lower production costs initially, the net effect of the additional measures that are required can offset a large portion of these savings. Unfortunately, slightly colder asphalt mix temperatures require additives to provide adequate coating of the liquid binder. In addition, moisture problems require further measures to maintain the structural integrity of the asphalt pavement – anti-stripping agents (ASA). Admixtures and ASAs drive up asphalt paving costs and can negate a large portion of the fuel cost savings. Concrete pavement remains the least expensive choice for roadway pavement. Since 2008, concrete outperforms asphalt on initial bid costs for an equivalent, urban roadway – even with the proposed energy cost savings associated with WMA. Because less frequent maintenance is required and the life span is much longer than with an asphalt roadway, concrete also exhibits a life cycle cost advantage for the same urban road. Admixture and anti-stripping agent costs further augment concrete’s cost advantages.
2 Based on EIA oil price projections. 3 Using WisPAVE Life Cycle Cost Analysis software from WisDOT, these are the total initial costs for HMA, WMA and concrete equivalents.
3
Source: PCA Analysis
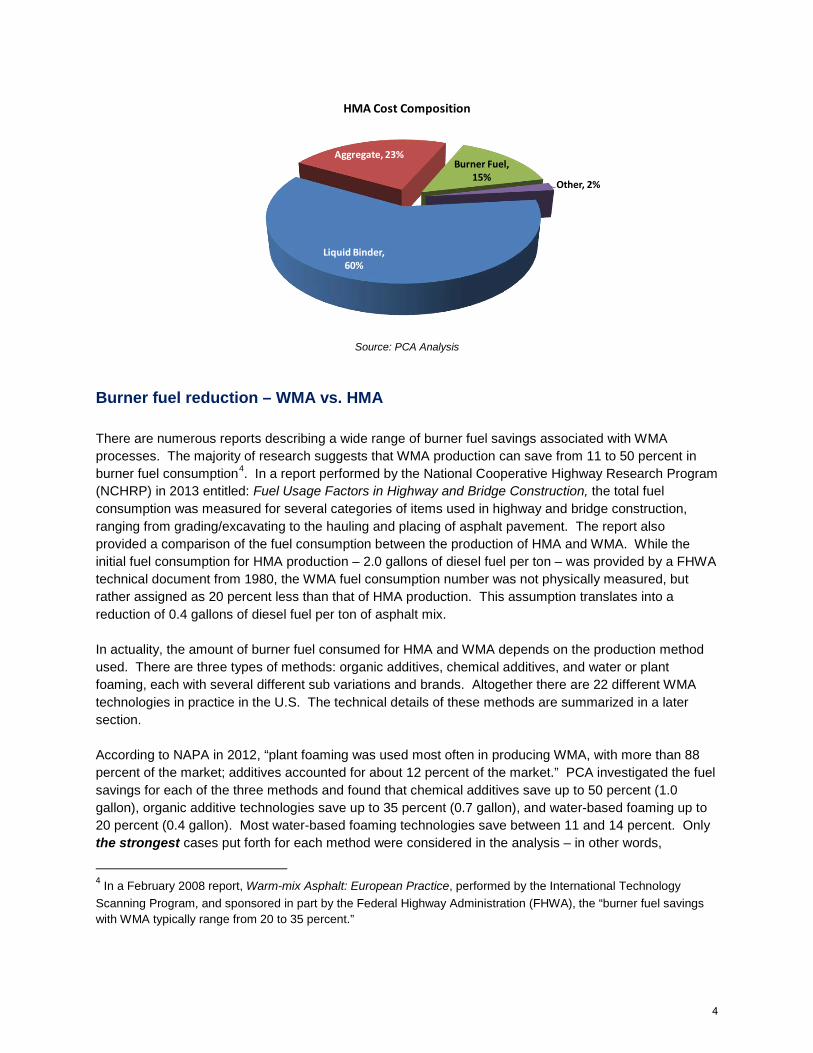
Burner fuel reduction – WMA vs. HMA There are numerous reports describing a wide range of burner fuel savings associated with WMA processes. The majority of research suggests that WMA production can save from 11 to 50 percent in burner fuel consumption4. In a report performed by the National Cooperative Highway Research Program (NCHRP) in 2013 entitled: Fuel Usage Factors in Highway and Bridge Construction, the total fuel consumption was measured for several categories of items used in highway and bridge construction, ranging from grading/excavating to the hauling and placing of asphalt pavement. The report also provided a comparison of the fuel consumption between the production of HMA and WMA. While the initial fuel consumption for HMA production – 2.0 gallons of diesel fuel per ton – was provided by a FHWA technical document from 1980, the WMA fuel consumption number was not physically measured, but rather assigned as 20 percent less than that of HMA production. This assumption translates into a reduction of 0.4 gallons of diesel fuel per ton of asphalt mix. In actuality, the amount of burner fuel consumed for HMA and WMA depends on the production method used. There are three types of methods: organic additives, chemical additives, and water or plant foaming, each with several different sub variations and brands. Altogether there are 22 different WMA technologies in practice in the U.S. The technical details of these methods are summarized in a later section. According to NAPA in 2012, “plant foaming was used most often in producing WMA, with more than 88 percent of the market; additives accounted for about 12 percent of the market.” PCA investigated the fuel savings for each of the three methods and found that chemical additives save up to 50 percent (1.0 gallon), organic additive technologies save up to 35 percent (0.7 gallon), and water-based foaming up to 20 percent (0.4 gallon). Most water-based foaming technologies save between 11 and 14 percent. Only the strongest cases put forth for each method were considered in the analysis – in other words,
4 In a February 2008 report, Warm-mix Asphalt: European Practice, performed by the International Technology Scanning Program, and sponsored in part by the Federal Highway Administration (FHWA), the “burner fuel savings with WMA typically range from 20 to 35 percent.”
Liquid Binder, 60%
Aggregate, 23%Burner Fuel,
15%Other, 2%
HMA Cost Composition
4
asphalt’s best foot forward in cost reduction. Three popular WMA processes were assessed, each representing one of the three method categories: Double-Barrel Green® for water-based, Sasobit® for organic additives, and Advera® for the chemical additive technologies.
Source: FHWA, PCA Net WMA paving cost savings from burner fuel reduction WITHOUT additives. It has been stated that WMA could save $3.6 billion by 2020. To assess this possibility requires future projections regarding both hot-mix and WMA costs as well as paving activity. Because asphalt prices are sensitive to movements in oil prices, expected changes for both burner fuel and asphalt bid prices must be considered. For this, PCA relies on oil and energy costs projections provided by the Energy Information Administration (EIA). According to the EIA, oil prices are expected to increase by 8.6 percent from 2013 levels by 2020. Three fuel savings scenarios were considered: chemical additives with 50 percent savings, organic additives with 35 percent, and water-based foaming with 20 percent. The benchmark for HMA burner fuel consumption was set at 2.0 gallons of diesel fuel per ton – well above the results of many research studies. This translates to the following fuel gallon savings: 1.0 gal/ton for chemical additives, 0.7 gal/ton for organic additives, and 0.4 gal/ton for water-based foaming. Ratios of fuel cost reductions to HMA bid price projections were used to find the asphalt cost savings percentages for each of the three scenarios. Diesel price projections from the EIA were used for the burner fuel prices. As an example, in 2014, the price of a gallon of diesel is expected to be $3.48 and the price of a ton of HMA is expected to bid at $46.02. Therefore, with a 50 percent reduction in fuel usage, or 1.0 gallon, the savings are $3.48 per ton (7.6 percent) in 2014. For a 35 percent fuel reduction, or 0.7 gallon, the savings are $2.44 per ton (5.3 percent). For 20 percent fuel reduction, or 0.4 gallon, the savings are $1.39 per ton (3.0 percent). The table below is a summary of the fuel cost savings projected out to 2020.
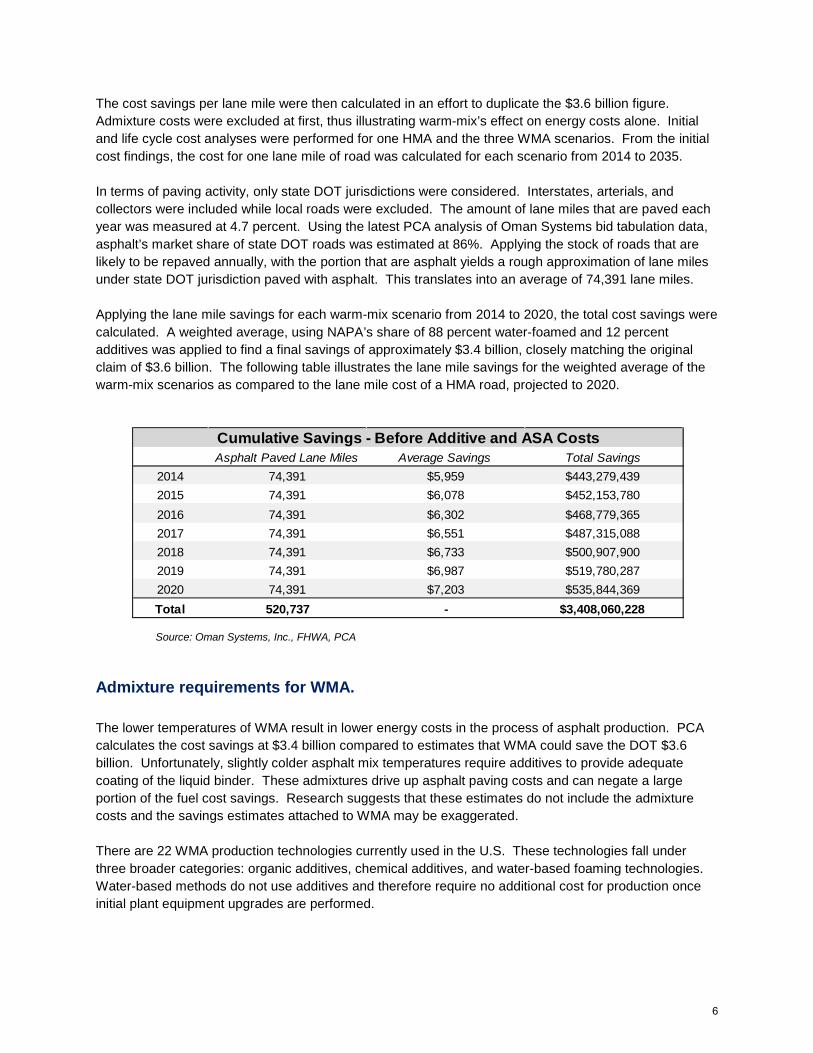
The cost savings per lane mile were then calculated in an effort to duplicate the $3.6 billion figure. Admixture costs were excluded at first, thus illustrating warm-mix’s effect on energy costs alone. Initial and life cycle cost analyses were performed for one HMA and the three WMA scenarios. From the initial cost findings, the cost for one lane mile of road was calculated for each scenario from 2014 to 2035. In terms of paving activity, only state DOT jurisdictions were considered. Interstates, arterials, and collectors were included while local roads were excluded. The amount of lane miles that are paved each year was measured at 4.7 percent. Using the latest PCA analysis of Oman Systems bid tabulation data, asphalt’s market share of state DOT roads was estimated at 86%. Applying the stock of roads that are likely to be repaved annually, with the portion that are asphalt yields a rough approximation of lane miles under state DOT jurisdiction paved with asphalt. This translates into an average of 74,391 lane miles.
Applying the lane mile savings for each warm-mix scenario from 2014 to 2020, the total cost savings were calculated. A weighted average, using NAPA’s share of 88 percent water-foamed and 12 percent additives was applied to find a final savings of approximately $3.4 billion, closely matching the original claim of $3.6 billion. The following table illustrates the lane mile savings for the weighted average of the warm-mix scenarios as compared to the lane mile cost of a HMA road, projected to 2020.
Source: Oman Systems, Inc., FHWA, PCA
Admixture requirements for WMA. The lower temperatures of WMA result in lower energy costs in the process of asphalt production. PCA calculates the cost savings at $3.4 billion compared to estimates that WMA could save the DOT $3.6 billion. Unfortunately, slightly colder asphalt mix temperatures require additives to provide adequate coating of the liquid binder. These admixtures drive up asphalt paving costs and can negate a large portion of the fuel cost savings. Research suggests that these estimates do not include the admixture costs and the savings estimates attached to WMA may be exaggerated. There are 22 WMA production technologies currently used in the U.S. These technologies fall under three broader categories: organic additives, chemical additives, and water-based foaming technologies. Water-based methods do not use additives and therefore require no additional cost for production once initial plant equipment upgrades are performed.
Asphalt Paved Lane Miles Average Savings Total Savings2014 74,391 $5,959 $443,279,4392015 74,391 $6,078 $452,153,7802016 74,391 $6,302 $468,779,3652017 74,391 $6,551 $487,315,0882018 74,391 $6,733 $500,907,9002019 74,391 $6,987 $519,780,2872020 74,391 $7,203 $535,844,369Total 520,737 - $3,408,060,228
Cumulative Savings - Before Additive and ASA Costs
6
Chemical additives to WMA and costs: The role of the chemical additive is to provide adequate aggregate coating by the liquid binder at lower production temperatures. There are two major types of chemical additive processes. One is called “dispersed asphalt technology,” which replaces a portion of the liquid binder with an asphalt emulsion product combined with a chemical additive. The other method uses synthetic zeolites, which are typically used in water softeners5. Burner fuel savings for chemical additives can reach 50 percent of HMA levels. This translates to a reduction of 1.0 gallon of diesel fuel per ton. Although they have the greatest reduction in fuel usage, chemical additives can add between $3.50 and $4.50 to the cost of a ton of asphalt mix6. Organic additives to WMA and costs: Similar to the chemical additives, organic additives lower the viscosity of the liquid binder, allowing for aggregate coating at lower-than-normal temperatures. The difference is the material used. Instead of a chemical interacting with the binder, an organic wax is added. The wax melts and helps bond the binder to the aggregate, reducing the amount of heat that is normally needed for this bonding to occur. Burner fuel savings with organic additives typically range between 20 and 35 percent. For the purposes of this analysis, the higher end of 35 percent was chosen. This equates to a 0.7 gallon per ton fuel savings. Organic additives can add between $2.00 and $3.50 for each ton of asphalt mix produced5. Water-based foaming additives to WMA and costs: Water or plant foaming is the most commonly used group of WMA technologies (88 percent of 2012 WMA production). Water is pumped into the asphalt mix via a spraying mechanism and interacts with the heated liquid binder creating a foaming effect, which then coats the aggregate. Burner fuel savings for water-based foaming methods range between 11 and 14 percent, with a few claims of up to 20 percent. The higher end of 20 percent was chosen for this analysis. Because these techniques do not use additives, there is no added cost per ton, excluding the initial equipment installation costs. There are, however, concerns with moisture susceptibility which can undermine the performance of the WMA. To combat these moisture concerns, additional measures may be required to maintain the structural integrity of the asphalt pavement. This goes for any WMA technology, but especially for water-based as it directly injects water into the mix. Other types of additives known as anti-stripping agents (ASA) are used to help resolve such moisture susceptibilities. Examples include hydrated lime, TDA, and BHMT. Anti-stripping agents can add between $1.32 and $7.50 per ton of asphalt mix7. As a result, separate from chemical and organic additives, the anti-stripping agents add to the cost of WMA.
5 At the molecular level, a zeolite is a chemical whose mass is about 20 percent water that is trapped within its crystalline structure. This water gets released at temperatures close to the boiling point of water. When it comes in contact with the heated asphalt binder in the production process, it creates a foaming effect, which helps coat the aggregate at lower temperatures. Ultimately, the temperature needed to complete the asphalt mix is lowered significantly. 6 Warm Mix Asphalt Performance. Potential Benefits And Other Parameters. Ryerson University, Ontario, Canada. Winter 2010. http://www.academia.edu/3042215/Warm_Mix_Asphalt_Performance_Potential_Benefits_and_other_Parameters_-_Course_Report 7 Prices for hydrated lime from USGS: http://minerals.usgs.gov/minerals/pubs/commodity/lime/mcs-2013-lime.pdf. TDA, BHMT prices and mix percentages taken from http://www.alibaba.com/ and http://www.asphaltmagazine.com/archives/2005/Spring/Effect_Antistripping_Additives_On_PG_Grades_Asphalt_781778887_7202005152935.pdf
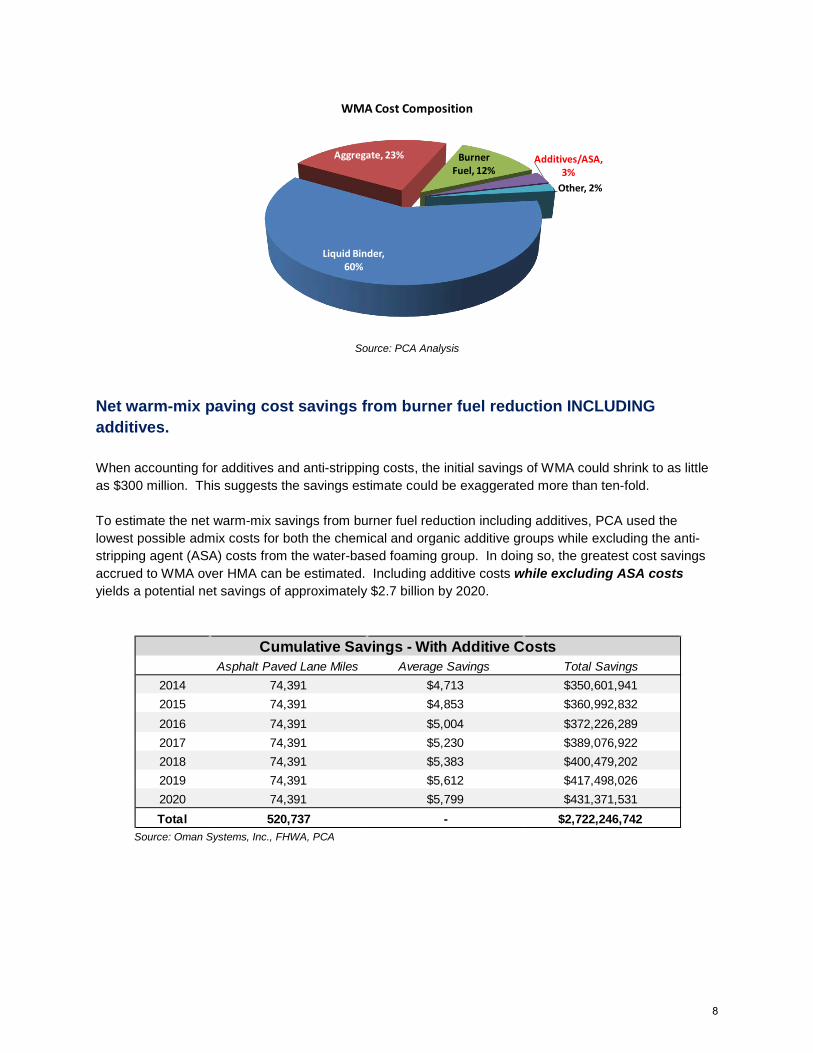
Net warm-mix paving cost savings from burner fuel reduction INCLUDING additives. When accounting for additives and anti-stripping costs, the initial savings of WMA could shrink to as little as $300 million. This suggests the savings estimate could be exaggerated more than ten-fold. To estimate the net warm-mix savings from burner fuel reduction including additives, PCA used the lowest possible admix costs for both the chemical and organic additive groups while excluding the anti-stripping agent (ASA) costs from the water-based foaming group. In doing so, the greatest cost savings accrued to WMA over HMA can be estimated. Including additive costs while excluding ASA costs yields a potential net savings of approximately $2.7 billion by 2020.
Source: Oman Systems, Inc., FHWA, PCA
Liquid Binder, 60%
Aggregate, 23% Burner Fuel, 12%
Additives/ASA, 3%
Other, 2%
WMA Cost Composition
Asphalt Paved Lane Miles Average Savings Total Savings2014 74,391 $4,713 $350,601,9412015 74,391 $4,853 $360,992,8322016 74,391 $5,004 $372,226,2892017 74,391 $5,230 $389,076,9222018 74,391 $5,383 $400,479,2022019 74,391 $5,612 $417,498,0262020 74,391 $5,799 $431,371,531Total 520,737 - $2,722,246,742
Cumulative Savings - With Additive Costs
8
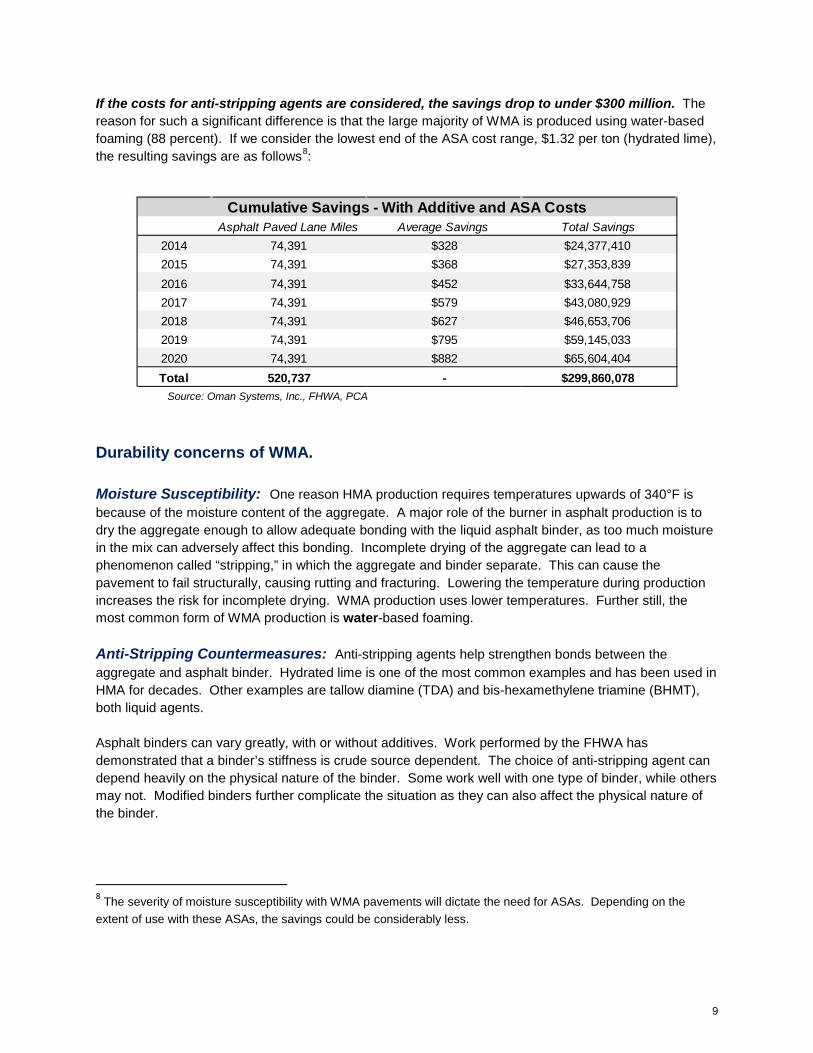
If the costs for anti-stripping agents are considered, the savings drop to under $300 million. The reason for such a significant difference is that the large majority of WMA is produced using water-based foaming (88 percent). If we consider the lowest end of the ASA cost range, $1.32 per ton (hydrated lime), the resulting savings are as follows8:
Source: Oman Systems, Inc., FHWA, PCA
Durability concerns of WMA. Moisture Susceptibility: One reason HMA production requires temperatures upwards of 340°F is because of the moisture content of the aggregate. A major role of the burner in asphalt production is to dry the aggregate enough to allow adequate bonding with the liquid asphalt binder, as too much moisture in the mix can adversely affect this bonding. Incomplete drying of the aggregate can lead to a phenomenon called “stripping,” in which the aggregate and binder separate. This can cause the pavement to fail structurally, causing rutting and fracturing. Lowering the temperature during production increases the risk for incomplete drying. WMA production uses lower temperatures. Further still, the most common form of WMA production is water-based foaming. Anti-Stripping Countermeasures: Anti-stripping agents help strengthen bonds between the aggregate and asphalt binder. Hydrated lime is one of the most common examples and has been used in HMA for decades. Other examples are tallow diamine (TDA) and bis-hexamethylene triamine (BHMT), both liquid agents. Asphalt binders can vary greatly, with or without additives. Work performed by the FHWA has demonstrated that a binder’s stiffness is crude source dependent. The choice of anti-stripping agent can depend heavily on the physical nature of the binder. Some work well with one type of binder, while others may not. Modified binders further complicate the situation as they can also affect the physical nature of the binder.
8 The severity of moisture susceptibility with WMA pavements will dictate the need for ASAs. Depending on the extent of use with these ASAs, the savings could be considerably less.
Asphalt Paved Lane Miles Average Savings Total Savings2014 74,391 $328 $24,377,4102015 74,391 $368 $27,353,8392016 74,391 $452 $33,644,7582017 74,391 $579 $43,080,9292018 74,391 $627 $46,653,7062019 74,391 $795 $59,145,0332020 74,391 $882 $65,604,404Total 520,737 - $299,860,078
Cumulative Savings - With Additive and ASA Costs
9
WMA can contain more Reclaimed Asphalt Pavement (RAP) than HMA. This could save on costs in that less virgin materials would be needed; however, the reason for higher levels of RAP is to add to the pavement’s structural durability. Another consequence of moisture susceptibility is decreased binder stiffness, which can lead to structural problems. RAP can increase this stiffness. Typically, RAP content in an asphalt mix falls between 10 and 25 percent. WMA may require higher RAP content to ensure the adequate binder stiffness is maintained. While increased RAP can reduce the need for virgin materials, it comes at a price too – structural integrity of the pavement. Increased binder stiffness can lead to reduced resistance to thermal cracking. The right combination of production methods, binders, and virgin/reclaimed aggregates must be reached to avoid these issues. The bottom line is that more research is required to fully understand the issues with moisture susceptibility as the conclusions thus far are mixed. Conclusions WMA is a growing technology in Europe and the United States. Since its adoption on U.S. soil in the 2000s, production of WMA has grown to 87 million tons in 2012, roughly 24 percent of total U.S. asphalt production. WMA production requires less fuel than HMA. Fuel is consumed by burners which dry the aggregate and heat the mix once the liquid binder is added. Diesel fuel is the most common burner fuel. Typical asphalt plant production consumes approximately 2 gallons of diesel fuel for every ton of mix. Estimates that reliance on WMA could save the Department of Transportation $3.6 billion by 2020 appear to be incomplete: These savings refer to the reduction of burner fuel that warm-mix provides. PCA investigated these claims and matched fairly close to this number at $3.4 billion when looking at fuel reductions only. These estimates were found to be incomplete as they do not appear to take into account any admixture costs that are associated with these new technologies. There are currently 22 WMA production technologies in practice in the U.S. These technologies fall under three broader categories: chemical additives, organic additives, and water-based foaming. Depending on the method used, the amount of fuel consumed during warm-mix production can be reduced by 11 to 50 percent of HMA levels. Chemical additives result in the greatest burner fuel reductions at up to 50 percent of HMA levels. Organic additives can reduce burner fuel consumption by up to 35 percent and water-based foaming can save between 11 and 20 percent. In 2012, 88 percent of all WMA produced in the U.S. was performed via water-based foaming. Using the strongest fuel savings case provided, PCA was able to reach a projected fuel cost savings of $3.4 billion by 2020. The next step was to incorporate the additive costs in order to reach a net savings figure. With the most conservative anti-stripping agent costs included, along with the fuel savings and additive costs, the net savings by 2020 falls below $300 million. Furthermore, there are durability concerns with WMA. Because temperatures are lower than normal hot-mix production levels, the risk for incomplete aggregate drying is increased. Incomplete aggregate drying can lead to increased moisture susceptibility. Excessive moisture in asphalt pavements can cause a
10
phenomenon called “stripping,” in which the aggregate separates from the binder. This can cause the asphalt pavement to fail structurally. More research, however, is required to fully understand the connection between WMA and the need for moisture susceptibility countermeasures. When discussing transportation and infrastructure recovery, concrete pavement should also be included in the dialogue. Even with the advent of WMA and the savings it provides, concrete pavements remain the most cost effective alternative. For an urban road, concrete costs less than both the hot-mix and most fuel reducing warm-mix equivalents, initially and throughout the life of the road. Yes, warm-mix asphalt is more cost effective than hot-mix but still does not compare to concrete pavement.