Now plan better with # *SIP Top-up. Any Day SIP Simultaneously invest in 3 products by filling in just one form & single cheque Give a name to your SIP You have the freedom to Choose Schemes & Decide Amount 3-in-1 # My Date Choose SIP dates as per your choice, you could also opt to have multiple dates under same scheme Perpetual Once begun, this will continue unless you choose to stop i-Choose i-Name Booster* Automatically increases your SIP amount as you want it Pause You can pause your SIP investments when you want Super SIP Features Mutual Fund investments are subject to market risks, read all scheme related documents carefully. February, 2018
Transcript
Now plan better with
#*SIP Top-up. Any Day SIP
Simultaneously invest in 3 products by filling injust one form & single cheque
Give a name to your SIP You have the freedom to Choose Schemes & Decide Amount
3-in-1
#My DateChoose SIP dates as per your choice, you could
also opt to have multiple dates under same scheme
PerpetualOnce begun, this will continue
unless you choose to stop
i-Choosei-Name
Booster*Automatically increases your
SIP amount as you want it
PauseYou can pause your
SIP investments when you want
Super SIP Features
Mutual Fund investments are subject to market risks, read all scheme related documents carefully.
February, 2018
Index
DetailsCIO’s Communique 1
Equity Markets Round Up 2
Fixed Income Market Update 3
How to Read Factsheet 4
Product Suitability 5
NAV (Net Asset Value) 6
Equity Funds
Principal Emerging Bluechip Fund 7
Principal Growth Fund 8
Principal Tax Savings Fund 9
Principal Personal Tax Saver Fund 10
Principal Large Cap Fund 11
Principal Dividend Yield Fund 12
Principal Index Fund - Nifty 13
Principal Arbitrage Fund 14
Hybrid Funds
Principal Balanced Fund 15
Principal SMART Equity Fund 16
Principal Equity Savings Fund 17
Fixed Income FundsPrincipal Cash Management Fund 18
Principal Low Duration Fund 19
Principal Short Term Income Fund 20
Principal Dynamic Bond Fund 21
Principal Credit Opportunities Fund 22
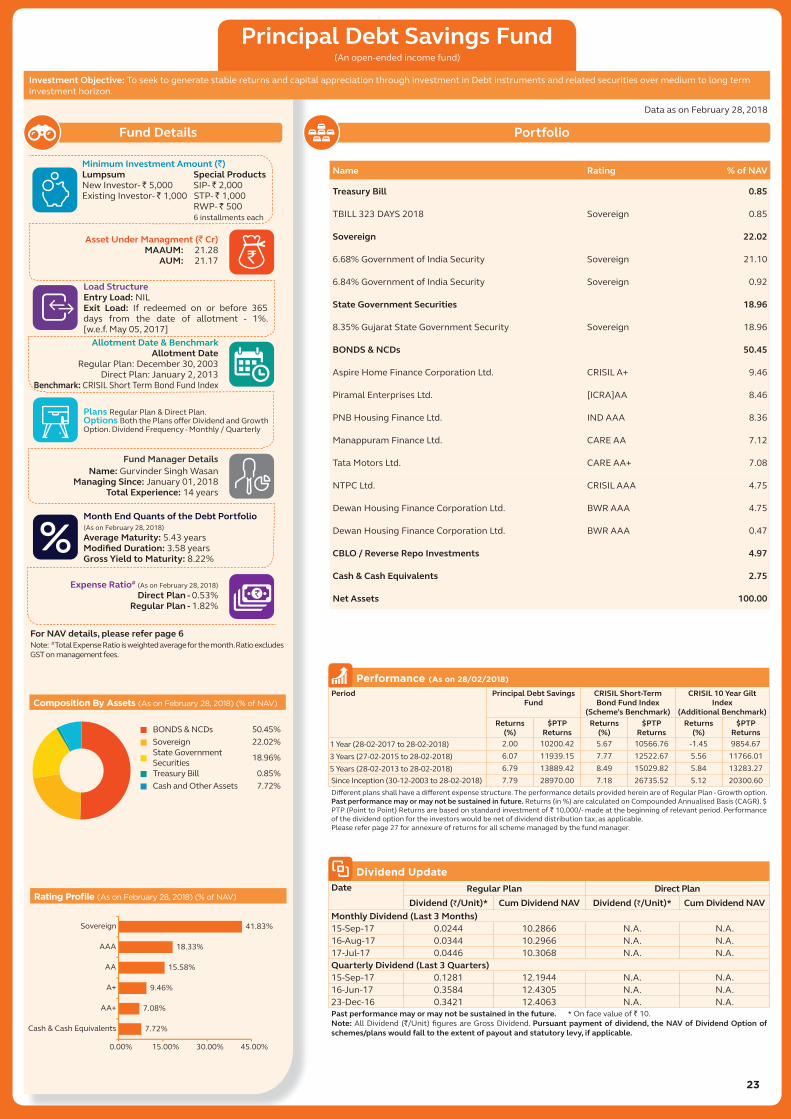
Principal Debt Savings Fund 23
Principal Money Manager Fund 24
Fund of Funds
Principal Global Opportunities Fund 25
Principal Asset Allocation Fund-of-Funds (Conservative Plan) 25
Principal Asset Allocation Fund-of-Funds (Aggressive Plan) 26
Principal Asset Allocation Fund-of-Funds (Moderate Plan) 26
Other Details
Annexure for returns of all the Schemes 27
CIO's Communique
Dear investors and partners,
Currently, the Indian equity markets seems to be in consolidation phase after the recent bout of correction with valuations correcting to more reasonable levels. While some India specific factors have also contributed to the correction, the Emerging Markets globally have corrected as well. As we witness a stronger global growth scenario and oil prices remain above USD 65 per barrel there could be potential risks to inflation especially if the Rupee weakens. However, with US shale gas production ramping up substantially, hopefully oil prices may not rise much from here. The recent Union Budget announcements could also pose some upside risks to a higher fiscal deficit particularly if the government were to implement its intent of higher MSP for farmers. Going forward, the markets will closely watch for the monthly revenue collection from GST as they will be a key variable in the budget math. However, bottom up, we are beginning to see a recovery in the earnings cycle. Demand for CVs, cement, passenger cars, 2Ws, retail lending etc. is robust. So, markets are essentially caught in a tug-of-war between weaker macros and improving micros which will result in heightened volatility particularly given a challenging global environment. We are cautiously optimistic on Indian Equity market returns for the rest of CY 2018 as the markets take a breather after the sharp up move in the past three odd years.
In such a scenario, many equity investors face the dilemma as to whether to stay invested in equity or to move investments into safer options. During such regimes, retail investors may fall prey to market timing. But it is well known that many investors have
failed to generate any meaningful returns trying to time the market by rotating in and out of equities in an endeavor to manage their holdings in the face of market volatility and valuation cycles. It is very important to understand that few people, including the masters of investing world globally have ever been able to time the markets. Investing
is never about timing the market but it is about the time that you spend in the market. There are empirical evidences both in global and Indian equities, where high-quality stocks have rewarded the investors with compounded value of investments year on year.
The ideal course of action for equity investors is to stay the course and invest for the long haul and follow sound Asset Allocation principles. The main goal of asset allocation is to optimally diversify across core asset classes such as Equities, Fixed Income, Bank Deposits, Gold and Real Estate etc. in the context of the investor's financial goals to minimize overall risk and maximize returns. While Equity is a more volatile asset class, equities have historically delivered superior returns over longer periods and would be suitable for wealth creation and beating inflation over the long haul. In contrast, debt instruments such as bonds have lower volatility and are suitable for steady income generation. But as these asset classes have low correlations, they can be suitably combined with an aim to develop well-diversified portfolios that deliver financial outcomes across time.
A renowned Basketball coach Dr. Jack Ramsay once noted, Winning is more related to good defense than good offense”. Applied to investing, winning in investing is made possible through sound asset allocation. Asset allocation offers diversification and in turn diversification enables better risk management: with a mix of different investment options from various asset classes, the impact may not be as much by changes to a single category. Diverse asset allocation also helps investors ride out market highs and lows and resist the urge to speculate during market swings.
Mutual funds are the ideal vehicles for implementing strategic and tactical asset allocation for realizing financial goals. They offer various solutions to retail investors while leveraging the investment expertise of professionals. Furthermore, Systematic Investment plans (SIPs) in Mutual funds also give investors the opportunity to benefit from rupee-cost averaging and help
ride out the ebb and flow of markets and follow a disciplined long-term approach to wealth creation. “Mutual funds Sahi Hai” is the mantra!
Having said so, there will always be an appetite amongst investors who would like to take exposure to equity funds like Principal Emerging Bluechip Fund, Principal Growth Fund, Principal Large Cap Fund and Principal Dividend Yield Fund. However, to the other set of investors, who are risk averse, we suggest hybrid equity oriented fund such as Principal Balanced Fund or a dynamic asset allocation fund such as Principal Smart Equity Fund or funds from equity savings category such as Principal Equity Savings Fund which offer blended allocation between equities, fixed income and cash-future arbitrage while mitigating the associated risks.
1Mutual Fund investments are subject to market risks, read all scheme related documents carefully.
The views expressed and information herein are independent views and for informative purpose only and under no circumstances should be construed as an opinion or Investment advice. The information contained herein is not intended to be an offer to seek solicitation for purchase or sale of any financial product or instrument. Investment involves risk. It should be understood that any reference to the securities/ sectors in the document is only for illustration purpose. Past performance is not indicative of future performance and investors may not get back the full amount invested. As an investor you are advised to conduct your own verification and consult your own financial and tax advisor before investing. The Sponsor, Trustee, AMC, Mutual Fund, their directors, officers or their employees shall not be liable in any way for any direct, indirect, special, incidental, consequential, punitive or exemplary damages arising out of the information contained herein.
Rajat JainChief Investment Officer
Investing is never about timingthe market but it is about the time that
you spend in the market
Asset allocation offers diversification and in turn diversification enables better
• The Indianmarketsweredownabout5%duringthemonth.Whilemanyfactorsspecificto India like introductionofLongtermcapitalgainstaxonlistedequity,thecasesoffraudinafewbanksandthespatwithSGXwerelistedasreasons,thefactwasthatIndiawasdownbroadlyinlinewithEMasanassetclass.TheMSCIEMindexwasdown4.7%duringthemonth,similartotheperformanceoftheIndianmarkets.WhileFIIstookoutaboutRs.11,000croresfromtheIndianequitymarkets,EMs,asacategoryhadequityredemptionsofaboutUSD5.8BillioninFebruaryfromForeignportfolioinvestors.Thiswasaftera14monthrunofinflows.Domesticinstitutionshoweverremainedbuyersduringthemonth.
• TheQ3resultscontinuedtoshowatrendofstrengtheningbottomupeconomicrecovery.Thepostresultcommentarywas strong from the IT sector, and from consumer staples and discretionary consumption including from automanufacturers.Anecdotally,logisticsprovidersincludingtransportoperatorsarereportingagoodbottomupdemandgrowthintheeconomy.
The Indian economy has been seeing a weakening macroeconomic environment as a result of higher current account deficit,likelystressonthefiscaldeficitnumberforFY19,andrising,thoughstillmoderateinflation.Globallyalso,theenvironmentislikelytobechallengingwithheadlinesregardingtradetensions,risingbondyieldsandavolatilepoliticalenvironment.However,assaidabove,thingsareimprovingonthegroundbothontheconsumerandtheinvestmentside.Themarketvaluationsarenowabout18XFY19earnings,whichisataslightpremiumtohistoricalvaluationsbutnotverystretched.HencewhilewedonotexpectPEmultipleexpansionthisyear,andtheyeartobequitevolatile,equityasanassetclassisexpectedtodeliverreasonablereturnsoverthemediumterm.
Data Item Growth
1 Month 1 yearMSCI EM Index (USD) -4.73 27.64MSCI EM Index (Local) -3.99 23.96Indian Rupee -2.50 -2.27DollarIndex(DXY) 1.66 -10.39Crude Oil- Brent -4.74 18.33CRB Index 0.10 2.61Gold -1.99 5.60Copper -2.63 16.04Iron Ore 8.16 -12.15Cotton (Cotlook A Index) 4.55 8.24Dataason28thFeb2018.Source:Bloomberg
Fund Manager -Anemployeeoftheassetmanagementcompanysuchasamutualfundor life insurer,whomanages investmentsofthescheme.Heisusuallypartofalargerteamoffundmanagersandresearchanalysts.
Application Amount For Fresh Subscription -Thisistheminimuminvestmentamountforanewinvestorinamutualfundscheme.
Yield To Maturity -TheYieldtoMaturityortheYTMistherateofreturnanticipatedonabondifhelduntilmaturity.YTMisexpressedasanannualrate.TheYTMfactorsinthebond’scurrentmarketprice,parvalue,couponinterestrateandtimetomaturity.
SIP -SIPorsystematicinvestmentplanworksontheprincipleofmakingperiodicinvestmentsofafixedsum.Itworkssimilartoarecurringbankdeposit.Forinstance,aninvestormayoptforanSlPthatinvests` 500 every 15th of the month in an equity fund for a period of three years.
NAV -TheNAVorthenetassetvalueisthetotalassetvalueperunitofthemutualfundafterdeductingallrelatedandpermissibleexpenses.TheNAViscalculatedattheendofeverybusinessday.Itisthevalueatwhichtheinvestorentersorexitsthemutualfund.
Benchmark -Agroupofsecurities,usuallyamarketindex,whoseperformanceisusedasastandardorbenchmarktomeasureinvestmentperformance ofmutual funds, among other investments. Some typical benchmarks include the Nifty, Sensex, BSE200, BSE500, 10-YearG-sec.
Standard Deviation -Standarddeviationisastatisticalmeasureoftherangeofaninvestment’sperformance.Whenamutualfundhasahighstandarddeviation,itsmeansitsrangeofperformanceiswide,implyinggreatervolatility.
Sharpe Ratio -TheSharpeRatio, namedafter its founder, theNobel LaureateWilliamSharpe, is ameasureof risk-adjusted returns. It iscalculatedusingstandarddeviationandexcessreturntodeterminerewardperunitofrisk.
AUM - AUM or assets under management refers to the recent / updated cumulative market value of investments managed by a mutual fund oranyinvestmentfirm.
Nature Of Scheme -Theinvestmentobjectiveandunderlyinginvestmentsdeterminethenatureofthemutualfundscheme.Forinstance,amutualfundthataimsatgeneratingcapitalappreciationbyinvestinginstockmarketsisanequityfundorgrowthfund.Likewise,amutualfundthataimsatcapitalpreservationbyinvestingindebtmarketsisadebtfundorincomefund.Eachofthesecategoriesmayhavesub-categories.
DISCLAIMER:Mutual Fund investments are subject to market risks, read all scheme related documents carefully.Thisfactsheetisforinformativepurposeonlyandundernocircumstancesistobeusedorconsideredasaninvestmentadvice.Termsofissue/loadstructure/Schemespecific risk factorsare set forth in theScheme InformationDocument(SID).Copyof the same is availableatall our InvestorServiceCentres.Alternatively,InvestorcandownloadtheSIDfromourwebsite-www.principalindia.comorcancallusat18004255600togetacopyofthesame.
5
Scheme Names This product is suitable for investors who are seeking~ Riskometer
Principal Large Cap Fund (An Open-ended Equity Scheme)
Long term Capital Growth.•Investment in equity & equity related securities including equity derivatives of •large capitalization Companies
Principal Emerging Bluechip Fund (An Open-ended Equity Scheme)
Long term Capital Growth. •Investment in equity & equity related securities including equity derivatives of •mid & small capitalization Companies.
Principal Growth Fund (An Open-ended Equity Scheme)
Long term Capital Growth. •Investment in equity & equity related securities including equity derivatives of •companies across market capitalization.
Principal Dividend Yield Fund (An Open-ended Equity Scheme)
Long term Capital Growth. •Investment in equity & equity related securities including equity derivatives of •high dividend yield Companies.
Principal Index Fund - Nifty (An Open-ended Index Scheme)
Long term Capital Growth. •Investment in equity securities including equity derivatives of Nifty 50 •Companies.
Principal SMART Equity Fund (An Open-ended Equity Scheme)
Long term Capital Growth.•Investment in equity & equity related securities including equity derivatives of •large capitalization Companies as well as Debt/ Money Market securities through a systematic allocation of Funds between Equity & Debt on the basis of the Price Earnings Ratio of Nifty 50.
Principal Personal Tax Saver Fund (An Open-ended Equity Linked Savings Scheme)
Long term Capital Growth with a three year lock-in.•Investment in equity & equity related securities including equity derivatives of •large capitalization Companies.
Principal Tax Savings Fund (An Open-ended Equity Linked Savings Scheme)
Long term Capital Growth with a three year lock-in.•Investment in equity & equity related securities including equity derivatives of •companies across market capitalization.
Principal Balanced Fund (An Open-ended Balanced Scheme)
Income and Long term Capital Growth. •Investment in equity & equity related securities, debt/money market securities •as well as derivatives.
Principal Equity Savings Fund (An Open-ended Equity Scheme)
Income generation and capital appreciation over the medium to long term.•Investment in equity and equity related instruments, debt and money market •instruments and arbitrage opportunities.
Principal Asset Allocation Fund-of-Funds - Conservative Plan (An Open-ended Fund-of-Funds Scheme)
Income and Capital growth over a long term investment horizon.•Investment primarily in debt/money market mutual funds with some exposure •to equity mutual funds.
Principal Asset Allocation Fund-of-Funds - Moderate Plan (An Open-ended Fund-of-Funds Scheme)
Capital growth and Income over a long term investment horizon.•Investment in a basket of equity mutual funds, debt/money market mutual funds •and Gold ETFs.
Principal Asset Allocation Fund-of-Funds - Aggressive Plan (An Open-ended Fund-of-Funds Scheme)
Capital growth over a long term investment horizon.•Investment primarily in equity mutual funds with some allocation to debt/money •market mutual funds and Gold ETFs.
Principal Debt Savings Fund (An Open-ended Income Scheme)
Income over a long term investment horizon.•Investment in Debt & Money Market Instruments.•
Principal Dynamic Bond Fund (An Open-ended Income Scheme)
Income over a long term investment horizon.•Investment in Debt & Money Market Instruments.•
Principal Credit Opportunities Fund (An Open-ended Debt Scheme)
Income over a long term investment horizon.•Investment in Debt & Money Market Instruments of Private & Public Sector •Companies.
Principal Short Term Income Fund (An Open-ended Income Scheme)
Income over a medium term investment horizon.•Investment in Debt & Money Market Instruments.•
Principal Arbitrage Fund (An Open-ended Equity Scheme)
Income over short-term. •Income through arbitrage opportunities between cash and derivative market •and arbitrage opportunities within the derivative segment.
Principal Low Duration Fund (An Open-ended Debt Scheme)
Income over a short term investment horizon.•Investment in Debt & Money Market Instruments.•
Principal Money Manager Fund (An Open-ended Money Market Scheme)
Income over a short term investment horizon.•Investment in Money Market Instruments.•
Principal Global Opportunities Fund (An Open-ended Fund of Funds Scheme)
Long term Capital Growth.•Investment in overseas mutual fund schemes.•
Principal Cash Management Fund (An Open-ended Liquid Scheme)
Income over a short term investment horizon.•Investment in Debt & Money Market Instruments, with maturity not exceeding •91 days.
Principal Emerging Bluechip Fund (`) Principal Growth Fund (`) Principal Tax Savings Fund (`)Regular Plan - Growth 108.19 Regular Plan - Growth 146.16 Regular Plan - Growth 214.91Regular Plan - Half Yearly Dividend Option 41.78 Regular Plan - Half Yearly Dividend Option 36.14 Regular Plan - Half Yearly Dividend Option 214.91Direct Plan - Growth 113.25 Direct Plan - Growth 151.23 Direct Plan - Growth 219.98Direct Plan - Half Yearly Dividend Option 86.22 Direct Plan - Half Yearly Dividend Option 45.29 Direct Plan - Half Yearly Dividend Option 219.98
Principal Personal Tax Saver Fund (`) Principal Large Cap Fund (`) Principal Dividend Yield Fund (`)Regular Plan - Growth 199.80 Regular Plan - Growth 60.71 Regular Plan - Growth 52.38Direct Plan - Growth 206.08 Regular Plan - Half Yearly Dividend Option 25.84 Regular Plan - Half Yearly Dividend Option 22.52
Direct Plan - Growth 62.76 Direct Plan - Growth 53.61Direct Plan - Half Yearly Dividend Option 26.64 Direct Plan - Half Yearly Dividend Option 30.38
Principal Index Fund - Nifty (`) Principal Arbitrage Fund (`)Regular Plan - Growth 72.6100 Regular Plan - Growth 11.0496Regular Plan - Dividend 42.6744 Regular Plan - Monthly Dividend Option 10.7316Direct Plan - Growth 74.4261 Direct Plan - Growth 11.1920Direct Plan - Dividend 43.7395 Direct Plan - Monthly Dividend Option 10.8042
Hybrid Funds
Principal Balanced Fund (`) Principal SMART Equity Fund (`) Principal Equity Savings Fund (`)Regular Plan - Growth 75.20 Regular Plan - Growth 19.70 Regular Plan - Growth 34.4628Regular Plan - Monthly Dividend Option 28.41 Regular Plan - Monthly Dividend Option 15.16 RegularPlan-QuaterlyDividendOption 12.5410Direct Plan - Growth 79.03 Direct Plan - Growth 20.76 Regular Plan - Half Yearly Dividend Option 11.8974Direct Plan - Monthly Dividend Option 32.24 Direct Plan - Monthly Dividend Option 16.64 Direct Plan - Growth 35.8116
DirectPlan-QuaterlyDividendOption 14.5621Direct Plan - Half Yearly Dividend Option 11.7234
Fixed Income Funds
Principal Cash Management Fund (`) Principal Low Duration Fund (`) Principal Short Term Income Fund (`)
Regular Plan - Growth 1675.3696 Regular Plan - Growth 2741.6022 Regular Plan - Growth 30.1417Regular Plan - Daily Dividend Option 1000.8893 Regular Plan - Daily Dividend Option 1005.7164 Regular Plan - Monthly Dividend Option 12.8200RegularPlan-WeeklyDividendOption 1007.5492 RegularPlan-WeeklyDividendOption 1006.4656 Direct Plan - Growth 31.3233Regular Plan - Monthly Dividend Option 1024.9994 Regular Plan - Monthly Dividend Option 1140.7957 Direct Plan - Monthly Dividend Option 12.8561Direct Plan - Growth 1682.2016 Direct Plan - Growth 2831.9412Direct Plan - Daily Dividend Option 1000.6367 Direct Plan - Daily Dividend Option 1007.4134DirectPlan-WeeklyDividendOption 1008.0718 DirectPlan-WeeklyDividendOption 1006.5430Direct Plan - Monthly Dividend Option 1025.0393 Direct Plan - Monthly Dividend Option 1142.9028
Principal Dynamic Bond Fund (`) Principal Credit Opportunities Fund (`) Principal Debt Savings Fund (`)Regular Plan - Growth 28.9505 Regular Plan - Growth 2699.0257 Regular Plan - Growth 28.9700RegularPlan-QuaterlyDividendOption 13.0928 Regular Plan - Monthly Dividend Option 1237.1842 Regular Plan - Monthly Dividend Option 10.0599Regular Plan - Annually Dividend Option 11.1468 Direct Plan - Growth 2743.3017 RegularPlan-QuaterlyDividendOption 11.8284Direct Plan - Growth 30.0953 Direct Plan - Monthly Dividend Option 1240.1934 Direct Plan - Growth 30.2887DirectPlan-QuaterlyDividendOption 13.1990Direct Plan - Annually Dividend Option 11.5068
Principal Money Manager Fund (`)Regular Plan - Growth 1947.7075Regular Plan - Daily Dividend Option 1005.4300RegularPlan-WeeklyDividendOption 1020.1578Regular Plan - Monthly Dividend Option 1061.0162Direct Plan - Growth 1971.1698Direct Plan - Monthly Dividend Option 1061.2900
Fund of Funds
Principal Global Opportunities Fund (`) Principal Asset Allocation Fund-of-Funds (CP) Principal Asset Allocation Fund-of-Funds (AP) Regular Plan - Growth 30.6155 Regular Sub Plan - Growth 12.0142 Regular Sub Plan - Growth 13.4757Regular Plan - Dividend 30.6155 Direct Sub Plan - Growth 12.1332 Direct Sub Plan - Growth 13.6771Direct Plan - Growth 31.2746Direct Plan - Dividend 31.2746
Principal Asset Allocation Fund-of-Funds (MP) Regular Sub Plan - Growth 12.4047Direct Sub Plan - Growth 12.6070
NAV (Net Asset Value) (As on February 28, 2018)
7
Principal Emerging Bluechip Fund(An open-ended equity scheme)
Dividend (`/Unit)* Cum Dividend NAV Dividend (`/Unit)* Cum Dividend NAV15-Dec-17 5.92 48.24 N.A. N.A.16-Jun-17 12.10 54.31 N.A. N.A.23-Dec-16 4.50 46.71 N.A. N.A.Past performance may or may not be sustained in the future. * On face value of `10.Note: All Dividend (`/Unit)figuresareGrossDividend.Pursuant payment of dividend, the NAV of Dividend Option of schemes/plans would fall to the extent of payout and statutory levy, if applicable.
Market Cap Allocation (As on February 28, 2018) (% of NAV)
Equity & Equity Related Instruments of Mid Cap & Other CompaniesEquity & Equity Related Instruments of Small Cap CompaniesEquity and equity related instruments of Companies otherthan Mid & Small CapCash and Money Market / Fixed Income Securities (includingMIBOR Linked Short Term Papers & Securitised Debt)Mutual Funds Derivatives Unlisted
71.66%
14.07% 9.01% 2.80% 0.42% 1.39% 0.65%0%
20%
40%
60%
80%
Note:^Theabovemeasureshavebeencalculatedbytakingrollingreturnsfora3yearperiodwith6.05%riskfreerateofreturn(1days-MIBORRateasonFebruary28,2018).** The Portfolio Turnover Rate (PTR) means the lower of aggregate sales or purchases made during the 12 month rolling year/period divided by the 12 month rollingyear/periodAverageassetunderManagementfortherelevantyear/period.# TotalExpenseRatio isweightedaverageforthemonth.RatioexcludesGSTonmanagementfees.
Performance (As on 28/02/2018)
Period Principal Emerging Bluechip Fund
Nifty Free Float Midcap 100 - TRI
(Scheme’s Benchmark)
Nifty 50 - TRI(Additional Benchmark)
Returns (%)
$PTP Returns
Returns (%)
$PTP Returns
Returns (%)
$PTP Returns
1 Year (28-02-2017 to 28-02-2018) 26.75 12674.55 20.80 12080.29 19.75 11975.133 Years (27-02-2015 to 28-02-2018) 16.85 15969.00 15.80 15542.07 7.21 12327.305 Years (28-02-2013 to 28-02-2018) 27.95 34313.35 22.65 27767.53 14.41 19608.54Since Inception (12-11-2008 to 28-02-2018) 29.18 108190.00 21.37 60602.19 16.41 41094.75Differentplansshallhaveadifferentexpensestructure.TheperformancedetailsprovidedhereinareofRegularPlan-Growthoption.Past performance may or may not be sustained in future.Returns(in%)arecalculatedonCompoundedAnnualisedBasis(CAGR).$PTP (Point to Point) Returns are based on standard investment of ` 10,000/-madeatthebeginningofrelevantperiod.Performanceofthedividendoptionfortheinvestorswouldbenetofdividenddistributiontax,asapplicable.Pleasereferpage27forannexureofreturnsforallschememanagedbythefundmanager.
DataasonFebruary28,2018
For NAV details, please refer page 6
Minimum Investment Amount (`)Lumpsum Special ProductsNew Investor- `5,000 SIP-`2,000Existing Investor- `1,000STP-`1,000 RWP-` 500 6 installments each
Load StructureEntry Load: NILExit Load: If redeemed on or before 1 Year fromthedateofallotment-1%
Plans RegularPlan&DirectPlan.Options Both the Plans offer Growth & Half YearlyDividendOption.Half Yearly Dividend Option under both the Plans offersfacilityofPayout,ReinvestmentandSweep.
Name % of NAVBanks 18.78HDFCBankLtd. 4.32ICICIBankLtd. 3.93State Bank of India 2.35KotakMahindraBankLtd. 1.45KarurVysyaBankLtd. 1.08Bank of Baroda 0.99CityUnionBankLtd. 0.91AxisBankLtd. 0.83VijayaBank 0.82Canara Bank 0.75TheFederalBankLtd. 0.69Syndicate Bank 0.66Consumer Non Durables 11.43ITCLtd. 2.48UnitedSpiritsLtd. 2.21BritanniaIndustriesLtd. 1.74DaburIndiaLtd. 1.73Bombay Burmah Trading CorporationLtd. 1.66
Non - Ferrous Metals 1.78HindustanZincLtd. 1.06NationalAluminiumCompanyLtd. 0.72Minerals/Mining 1.38CoalIndiaLtd. 1.38Hotels, Resorts and Other Recreational Activities 1.28
TheIndianHotelsCompanyLtd. 1.28Transportation 1.26InterglobeAviationLtd. 1.26Textile Products 0.98RaymondLtd. 0.98Telecom - Services 0.85BhartiAirtelLtd. 0.85Diversified Consumer Services 0.29CLEducateLtd. 0.29Construction 0.01MilestoneGlobalLtd.** 0.01Total Equity 92.77Investment Funds/Mutual Funds 1.02Principal Short Term Income Fund - Direct Plan - Growth Option 1.02
Date Regular Plan Direct PlanDividend (`/Unit)* Cum Dividend NAV Dividend (`/Unit)* Cum Dividend NAV
15-Dec-17 4.96 41.29 1.71 47.1816-Jun-17 10.83 47.29 8.93 50.4523-Dec-16 2.71 39.06 3.08 41.73Past performance may or may not be sustained in the future. * On face value of `10.Note: All Dividend (`/Unit)figuresareGrossDividend.Pursuant payment of dividend, the NAV of Dividend Option of schemes/plans would fall to the extent of payout and statutory levy, if applicable.
Note:^Theabovemeasureshavebeencalculatedbytakingrollingreturnsfora3yearperiodwith6.05%riskfreerateofreturn(1days-MIBORRateasonFebruary28,2018).** The Portfolio Turnover Rate (PTR) means the lower of aggregate sales or purchases made during the 12 month rolling year/period divided by the 12 month rolling year/period Average asset under Management for the relevant year/period.# TotalExpenseRatioisweightedaverageforthemonth.RatioexcludesGSTonmanagementfees.
DataasonFebruary28,2018
For NAV details, please refer page 6
Minimum Investment Amount (`)Lumpsum Special ProductsNew Investor- `5,000 SIP-`2,000Existing Investor- `1,000STP-`1,000 RWP-` 500 6 installments each
Plans RegularPlan&DirectPlan.Options Both the Plans offer Growth & Half YearlyDividendOption.Half Yearly Dividend Option under both the Plans offersfacilityofPayout,ReinvestmentandSweep.
Managing Since: September 2010Total Experience: 24 years
Expense Ratio# (AsonFebruary28,2018)Direct Plan - 1.70%
Regular Plan - 2.65%`
Sector Allocation (Top 10) (As on February 28, 2018) (% of NAV)
Banks 18.78% Consumer Non Durables 11.43% Software 7.38% ConstructionProject 5.74% Auto 5.30% Power 5.01% Finance 4.81% Cement 4.43% Chemicals 4.33% Pharmaceuticals 4.11%
Performance (As on 28/02/2018)
Period Principal Growth Fund S&P BSE 200 - TRI*(Scheme’s Benchmark)
Nifty 50 - TRI(Additional Benchmark)
Returns (%)
$PTP Returns
Returns (%)
$PTP Returns
Returns (%)
$PTP Returns
1 Year (28-02-2017 to 28-02-2018) 28.72 12871.86 20.55 12055.12 19.75 11975.133 Years (27-02-2015 to 28-02-2018) 14.31 14947.84 9.34 13078.52 7.21 12327.305 Years (28-02-2013 to 28-02-2018) 22.33 27406.71 16.37 21352.14 14.41 19608.54Since Inception (25-10-2000 to 28-02-2018) 16.71 146160.00 15.93 130126.88 15.00 113188.57Differentplansshallhaveadifferentexpensestructure.TheperformancedetailsprovidedhereinareofRegularPlan-Growthoption.Past performance may or may not be sustained in future.Returns(in%)arecalculatedonCompoundedAnnualisedBasis(CAGR).$PTP (Point to Point) Returns are based on standard investment of `10,000/-madeatthebeginningofrelevantperiod.Performanceofthedividendoptionfortheinvestorswouldbenetofdividenddistributiontax,asapplicable.Pleasereferpage27forannexureofreturnsforallschememanagedbythefundmanager.*AsTRIdataisnotavailablesinceinceptionofthescheme,benchmarkperformanceiscalculatedusingcompositeCAGRofS&PBSE200 Index PRI values from date 25-10-2000 to 29-06-2007 and TRI values since 29-06-2007
9
Principal Tax Savings Fund(An open-ended equity linked savings scheme)
Name % of NAVBanks 19.35HDFCBankLtd. 4.39ICICIBankLtd. 3.89State Bank of India 2.32KotakMahindraBankLtd. 1.56KarurVysyaBankLtd. 1.11CityUnionBankLtd. 1.03Bank of Baroda 1.01AxisBankLtd. 0.92VijayaBank 0.92Canara Bank 0.77TheFederalBankLtd. 0.73Syndicate Bank 0.70Consumer Non Durables 11.73ITCLtd. 2.49UnitedSpiritsLtd. 2.23BritanniaIndustriesLtd. 1.84DaburIndiaLtd. 1.76GlaxoSmithKline Consumer HealthcareLtd. 1.74
Date Regular Plan Direct PlanDividend (`/Unit)* Cum Dividend NAV Dividend (`/Unit)* Cum Dividend NAV
31-Mar-08 8.00 90.12 NA NA15-Jan-07 5.00 83.66 NA NAPast performance may or may not be sustained in the future. * On face value of `10.Note: All Dividend (`/Unit)figuresareGrossDividend.Pursuant payment of dividend, the NAV of Dividend Option of schemes/plans would fall to the extent of payout and statutory levy, if applicable.
Note:^Theabovemeasureshavebeencalculatedbytakingrollingreturnsfora3yearperiodwith6.05%riskfreerateofreturn(1days-MIBORRateasonFebruary28,2018).** The Portfolio Turnover Rate (PTR) means the lower of aggregate sales or purchases made during the 12 month rolling year/period divided by the 12 month rolling year/period Average asset under Management for the relevant year/period.# TotalExpenseRatioisweightedaverageforthemonth.RatioexcludesGSTonmanagementfees.
DataasonFebruary28,2018
For NAV details, please refer page 6
Minimum Investment Amount (`)Lumpsum Special ProductsNew Investor- ` 500 SIP- ` 500Existing Investor- ` 500 STP- ` 500 (Available after lock-in period) RWP-` 500 (Available after lock-in period) 6 installments each
Asset Under Managment (` Cr) MAAUM:383.07
AUM:384.60
Allotment Date & Benchmark Allotment Date
RegularPlan:March31,1996DirectPlan:January2,2013
Benchmark: S&P BSE 200
`
Load StructureEntry Load: NILExit Load: NIL
Plans RegularPlan&DirectPlan.Options Both the Plans offer Growth & Half YearlyDividendOption.(W.e.f.September11,2017)
Managing Since: September 2010Total Experience: 24 years
Expense Ratio# (AsonFebruary28,2018)Direct Plan - 1.90%
Regular Plan - 2.45%`
Sector Allocation (Top 10) (As on February 28, 2018) (% of NAV)
Banks 19.35% Consumer Non Durables 11.73% Software 7.43% ConstructionProject 5.81% Power 5.36% Auto 5.27% Finance 4.87% Cement 4.77% Chemicals 4.37% Pharmaceuticals 4.30%
Performance (As on 28/02/2018)
Period Principal Tax Savings Fund
S&P BSE 200 - TRI*(Scheme’s Benchmark)
Nifty 50 - TRI**(Additional Benchmark)
Returns (%)
$PTP Returns
Returns (%)
$PTP Returns
Returns (%)
$PTP Returns
1 Year (28-02-2017 to 28-02-2018) 28.38 12838.11 20.55 12055.12 19.75 11975.133 Years (27-02-2015 to 28-02-2018) 14.18 14896.37 9.34 13078.52 7.21 12327.305 Years (28-02-2013 to 28-02-2018) 22.28 27349.19 16.37 21352.14 14.41 19608.54Since Inception (31-03-1996 to 28-02-2018) 17.19 324191.10 13.27 153680.82 12.71 137763.03Differentplansshallhaveadifferentexpensestructure.TheperformancedetailsprovidedhereinareofRegularPlan-Growthoption.Past performance may or may not be sustained in future.Returns(in%)arecalculatedonCompoundedAnnualisedBasis(CAGR).$PTP (Point to Point) Returns are based on standard investment of `10,000/-madeatthebeginningofrelevantperiod.Performanceofthedividendoptionfortheinvestorswouldbenetofdividenddistributiontax,asapplicable.Pleasereferpage27forannexureofreturnsforallschememanagedbythefundmanager.*AsTRIdataisnotavailablesinceinceptionofthescheme,benchmarkperformanceiscalculatedusingcompositeCAGRofS&PBSE200IndexPRIvaluesfromdate31-03-1996to29-06-2007andTRIvaluessince29-06-2007.**AsTRIdataisnotavailablesinceinceptionofthescheme,additionalbenchmarkperformanceiscalculatedusingcompositeCAGRofNifty50IndexPRIvaluesfromdate31-03-1996to30-06-1999andTRIvaluessince30-06-1999.
Finance 5.40Housing Development Finance CorporationLtd. 3.13
Shriram Transport Finance CompanyLtd. 1.16
Dewan Housing Finance CorporationLtd. 1.11
Pharmaceuticals 5.03
AbbottIndiaLtd. 1.34
SunPharmaceuticalIndustriesLtd. 1.33
DishmanCarbogenAmcisLtd. 1.30
AurobindoPharmaLtd. 1.06
Name % of NAVConstruction Project 4.07
Larsen&ToubroLtd. 3.05
HindustanConstructionCompanyLtd. 1.02
Power 3.99
TataPowerCompanyLtd. 2.02
NTPCLtd. 1.97
Chemicals 3.62
PhillipsCarbonBlackLtd. 2.01
RainIndustriesLtd. 1.61
Industrial Products 3.53
JainIrrigationSystemsLtd. 1.79
RamkrishnaForgingsLtd. 1.74
Petroleum Products 3.51
RelianceIndustriesLtd. 3.51
Auto Ancillaries 3.50
AsahiIndiaGlassLtd. 1.99
RicoAutoIndustriesLtd. 1.51
Cement 3.04
TheIndiaCementsLtd. 1.85
UltratechCementLtd. 1.19
Consumer Durables 2.23
BajajElectricalsLtd. 2.23
Minerals/Mining 1.47
CoalIndiaLtd. 1.47Hotels, Resorts and Other Recreational Activities 1.38
TheIndianHotelsCompanyLtd. 1.38
Transportation 1.26
InterglobeAviationLtd. 1.26
Textile Products 1.22
RaymondLtd. 1.22
Non - Ferrous Metals 0.94
NationalAluminiumCompanyLtd. 0.94
Telecom - Services 0.90
BhartiAirtelLtd. 0.90
Total Equity 93.49
CBLO / Reverse Repo Investments 7.36
Cash & Cash Equivalents -0.85
Net Assets 100.00
Dividend Update
Date Regular Plan Direct PlanDividend (`/Unit)* Cum Dividend NAV Dividend (`/Unit)* Cum Dividend NAV
25-Mar-08 40.00 124.66 NA NA26-Feb-08 20.00 172.57 NA NA31-Dec-07 11.00 221.26 NA NAPast performance may or may not be sustained in the future. * On face value of `10.Note: All Dividend (`/Unit)figuresareGrossDividend.Pursuant payment of dividend, the NAV of Dividend Option of schemes/plans would fall to the extent of payout and statutory levy, if applicable.^Freshsaleofunitsi.e.bywayofpurchase/Switch-insandregistrationoffreshSIParrangementundertheSchemeissuspendedtillfurthernotice.
Note:^Theabovemeasureshavebeencalculatedbytakingrollingreturnsfora3yearperiodwith6.05%riskfreerateofreturn(1days-MIBORRateasonFebruary28,2018).** The Portfolio Turnover Rate (PTR) means the lower of aggregate sales or purchases made during the 12 month rolling year/period divided by the 12 month rolling year/period Average asset under Management for the relevant year/period.# TotalExpenseRatioisweightedaverageforthemonth.RatioexcludesGSTonmanagementfees.
Managing Since: July2017Total Experience: 24 years
Expense Ratio# (AsonFebruary28,2018)Direct Plan - 1.85%
Regular Plan - 2.34%
Sector Allocation (Top 10) (As on February 28, 2018) (% of NAV)
Banks 21.66% Consumer Non Durables 12.97% Software 7.57% Auto 6.20% Finance 5.40% Pharmaceuticals 5.03% ConstructionProject 4.07% Power 3.99% Chemicals 3.62% Industrial Products 3.53%
Performance (As on 28/02/2018)
Period Principal Personal Tax Saver Fund
S&P BSE 100 - TRI*(Scheme’s Benchmark)
Nifty 50 - TRI**(Additional Benchmark)
Returns (%)
$PTP Returns
Returns (%)
$PTP Returns
Returns (%)
$PTP Returns
1 Year (28-02-2017 to 28-02-2018) 17.86 11785.53 19.83 11983.48 19.75 11975.133 Years (27-02-2015 to 28-02-2018) 7.93 12577.11 8.18 12664.49 7.21 12327.305 Years (28-02-2013 to 28-02-2018) 16.13 21133.91 15.32 20407.23 14.41 19608.54Since Inception (31-03-1996 to 28-02-2018) 20.45 591872.60 12.78 139827.76 12.71 137763.03Differentplansshallhaveadifferentexpensestructure.TheperformancedetailsprovidedhereinareofRegularPlan-Growthoption.Past performance may or may not be sustained in future.Returns(in%)arecalculatedonCompoundedAnnualisedBasis(CAGR).$PTP (Point to Point) Returns are based on standard investment of `10,000/-madeatthebeginningofrelevantperiod.Performanceofthedividendoptionfortheinvestorswouldbenetofdividenddistributiontax,asapplicable.Pleasereferpage27forannexureofreturnsforallschememanagedbythefundmanager.*AsTRIdataisnotavailablesinceinceptionofthescheme,benchmarkperformanceiscalculatedusingcompositeCAGRofS&PBSE 100IndexPRIvaluesfromdate31-03-1996to29-06-2007andTRIvaluessince29-06-2007.**AsTRIdataisnotavailablesinceinceptionofthescheme,additionalbenchmarkperformanceiscalculatedusingcompositeCAGRofNifty50IndexPRIvaluesfromdate31-03-1996to30-06-1999andTRIvaluessince30-06-1999.
Minimum Investment Amount (`)Lumpsum Special ProductsNew Investor- ` 500 SIP- ` 500Existing Investor- ` 500 STP- ` 500 (Available after lock-in period) RWP-` 500 (Available after lock-in period) 6 installments each
`
11
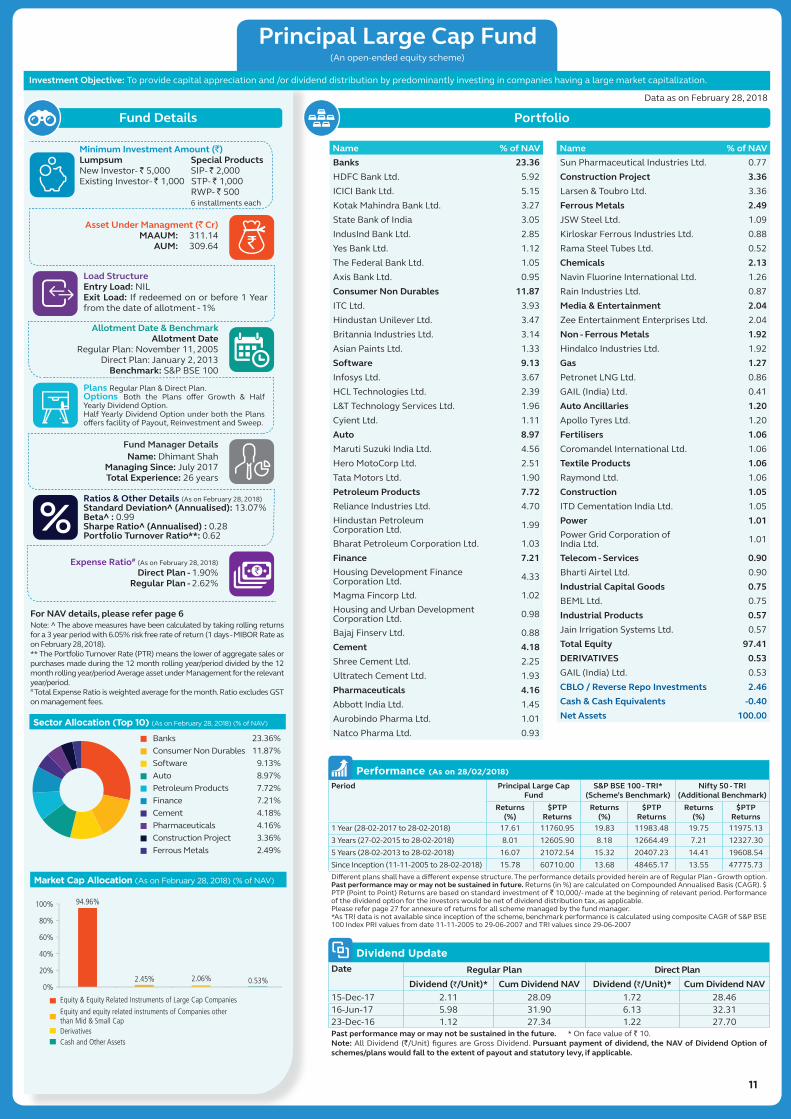
Principal Large Cap Fund(An open-ended equity scheme)
Market Cap Allocation (As on February 28, 2018) (% of NAV)
94.96%
2.45% 2.06% 0.53%0%
20%
40%
60%
80%
100%
Equity & Equity Related Instruments of Large Cap CompaniesEquity and equity related instruments of Companies otherthan Mid & Small Cap
Cash and Other AssetsDerivatives
Note:^Theabovemeasureshavebeencalculatedbytakingrollingreturnsfora3yearperiodwith6.05%riskfreerateofreturn(1days-MIBORRateasonFebruary28,2018).** The Portfolio Turnover Rate (PTR) means the lower of aggregate sales or purchases made during the 12 month rolling year/period divided by the 12 month rolling year/period Average asset under Management for the relevant year/period.# TotalExpenseRatioisweightedaverageforthemonth.RatioexcludesGSTonmanagementfees.
Dividend Update
Date Regular Plan Direct PlanDividend (`/Unit)* Cum Dividend NAV Dividend (`/Unit)* Cum Dividend NAV
15-Dec-17 2.11 28.09 1.72 28.4616-Jun-17 5.98 31.90 6.13 32.3123-Dec-16 1.12 27.34 1.22 27.70Past performance may or may not be sustained in the future. * On face value of `10.Note: All Dividend (`/Unit)figuresareGrossDividend.Pursuant payment of dividend, the NAV of Dividend Option of schemes/plans would fall to the extent of payout and statutory levy, if applicable.
DataasonFebruary28,2018
For NAV details, please refer page 6
Minimum Investment Amount (`)Lumpsum Special ProductsNew Investor- `5,000 SIP-`2,000Existing Investor- `1,000STP-`1,000 RWP-` 500 6 installments each
Load StructureEntry Load: NILExit Load: If redeemed on or before 1 Year fromthedateofallotment-1%
Plans RegularPlan&DirectPlan.Options Both the Plans offer Growth & Half YearlyDividendOption.Half Yearly Dividend Option under both the Plans offersfacilityofPayout,ReinvestmentandSweep.
1 Year (28-02-2017 to 28-02-2018) 17.61 11760.95 19.83 11983.48 19.75 11975.133 Years (27-02-2015 to 28-02-2018) 8.01 12605.90 8.18 12664.49 7.21 12327.305 Years (28-02-2013 to 28-02-2018) 16.07 21072.54 15.32 20407.23 14.41 19608.54Since Inception (11-11-2005 to 28-02-2018) 15.78 60710.00 13.68 48465.17 13.55 47775.73Differentplansshallhaveadifferentexpensestructure.TheperformancedetailsprovidedhereinareofRegularPlan-Growthoption.Past performance may or may not be sustained in future.Returns(in%)arecalculatedonCompoundedAnnualisedBasis(CAGR).$PTP (Point to Point) Returns are based on standard investment of `10,000/-madeatthebeginningofrelevantperiod.Performanceofthedividendoptionfortheinvestorswouldbenetofdividenddistributiontax,asapplicable.Pleasereferpage27forannexureofreturnsforallschememanagedbythefundmanager.*AsTRIdataisnotavailablesinceinceptionofthescheme,benchmarkperformanceiscalculatedusingcompositeCAGRofS&PBSE100 Index PRI values from date 11-11-2005 to 29-06-2007 and TRI values since 29-06-2007
12
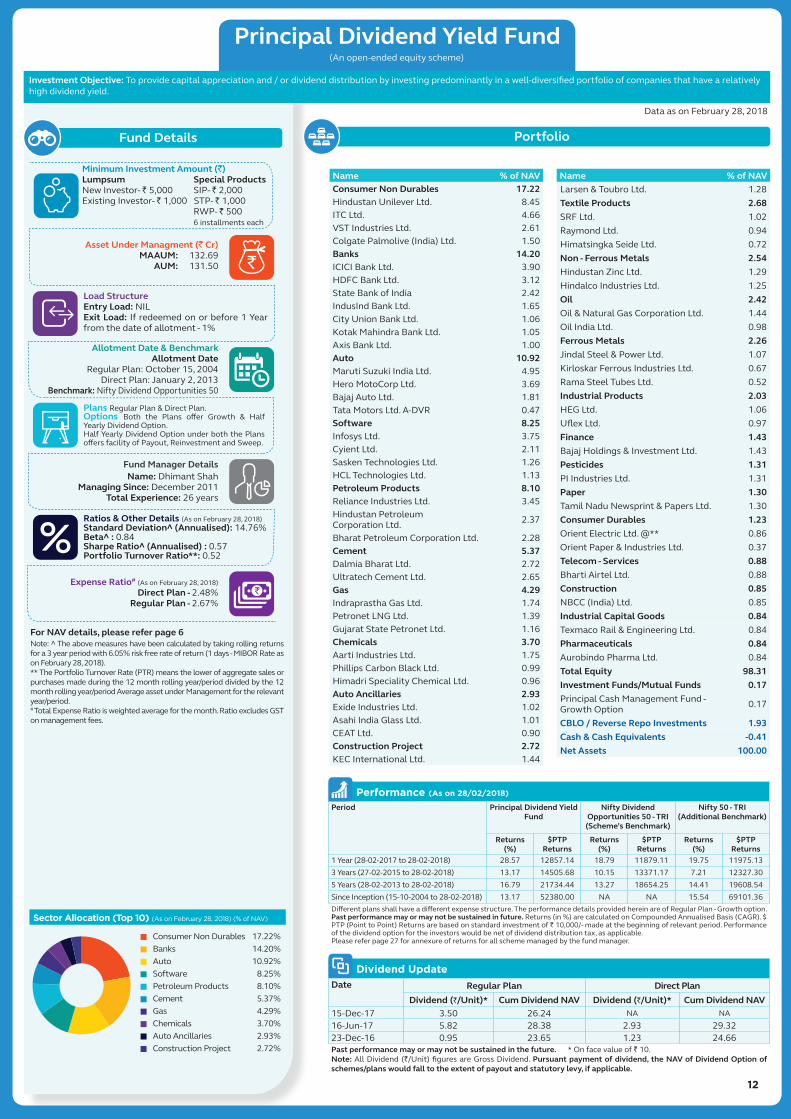
Principal Dividend Yield Fund(An open-ended equity scheme)
Date Regular Plan Direct PlanDividend (`/Unit)* Cum Dividend NAV Dividend (`/Unit)* Cum Dividend NAV
15-Dec-17 3.50 26.24 NA NA16-Jun-17 5.82 28.38 2.93 29.3223-Dec-16 0.95 23.65 1.23 24.66Past performance may or may not be sustained in the future. * On face value of `10.Note: All Dividend (`/Unit)figuresareGrossDividend.Pursuant payment of dividend, the NAV of Dividend Option of schemes/plans would fall to the extent of payout and statutory levy, if applicable.
Note:^Theabovemeasureshavebeencalculatedbytakingrollingreturnsfora3yearperiodwith6.05%riskfreerateofreturn(1days-MIBORRateasonFebruary28,2018).** The Portfolio Turnover Rate (PTR) means the lower of aggregate sales or purchases made during the 12 month rolling year/period divided by the 12 month rolling year/period Average asset under Management for the relevant year/period.# TotalExpenseRatioisweightedaverageforthemonth.RatioexcludesGSTonmanagementfees.
DataasonFebruary28,2018
For NAV details, please refer page 6
Minimum Investment Amount (`)Lumpsum Special ProductsNew Investor- `5,000 SIP-`2,000Existing Investor- `1,000STP-`1,000 RWP-` 500 6 installments each
Load StructureEntry Load: NILExit Load: If redeemed on or before 1 Year fromthedateofallotment-1%
Plans RegularPlan&DirectPlan.Options Both the Plans offer Growth & Half YearlyDividendOption.Half Yearly Dividend Option under both the Plans offersfacilityofPayout,ReinvestmentandSweep.
1 Year (28-02-2017 to 28-02-2018) 28.57 12857.14 18.79 11879.11 19.75 11975.133 Years (27-02-2015 to 28-02-2018) 13.17 14505.68 10.15 13371.17 7.21 12327.305 Years (28-02-2013 to 28-02-2018) 16.79 21734.44 13.27 18654.25 14.41 19608.54Since Inception (15-10-2004 to 28-02-2018) 13.17 52380.00 NA NA 15.54 69101.36Differentplansshallhaveadifferentexpensestructure.TheperformancedetailsprovidedhereinareofRegularPlan-Growthoption.Past performance may or may not be sustained in future.Returns(in%)arecalculatedonCompoundedAnnualisedBasis(CAGR).$PTP (Point to Point) Returns are based on standard investment of `10,000/-madeatthebeginningofrelevantperiod.Performanceofthedividendoptionfortheinvestorswouldbenetofdividenddistributiontax,asapplicable.Pleasereferpage27forannexureofreturnsforallschememanagedbythefundmanager.
13
Principal Index Fund - Nifty(An open-ended index scheme)
Finance 9.09Housing Development Finance CorporationLtd. 7.13
IndiabullsHousingFinanceLtd. 1.00
BajajFinanceLtd. 0.96
Construction Project 4.01
Larsen&ToubroLtd. 4.01
Pharmaceuticals 3.78
SunPharmaceuticalIndustriesLtd. 1.46
Name % of NAV
CiplaLtd. 0.74
Dr.Reddy'sLaboratoriesLtd. 0.67
LupinLtd. 0.48
AurobindoPharmaLtd. 0.43
Non - Ferrous Metals 2.39
VedantaLtd. 1.51
HindalcoIndustriesLtd. 0.88
Power 2.30
NTPCLtd. 1.23
PowerGridCorporationofIndiaLtd. 1.07
Cement 1.53
UltratechCementLtd. 1.07
AmbujaCementsLtd. 0.46
Telecom - Services 1.40
BhartiAirtelLtd. 1.40
Oil 1.31
Oil&NaturalGasCorporationLtd. 1.31
Ferrous Metals 1.29
TataSteelLtd. 1.29
Minerals/Mining 1.00
CoalIndiaLtd. 1.00
Transportation 0.77Adani Ports and Special Economic ZoneLtd. 0.77
Media & Entertainment 0.76
ZeeEntertainmentEnterprisesLtd. 0.76
Gas 0.73
GAIL(India)Ltd. 0.73
Telecom - Equipment & Accessories 0.66
BhartiInfratelLtd. 0.66
Pesticides 0.66
UPLLtd. 0.66
Auto Ancillaries 0.42
BoschLtd. 0.42
Total Equity 99.93
CBLO / Reverse Repo Investments 0.19
Cash & Cash Equivalents -0.12
Net Assets 100.00
Dividend Update
Date Regular Plan Direct PlanDividend (`/Unit)* Cum Dividend NAV Dividend (`/Unit)* Cum Dividend NAV
24-Dec-08 3.7500 15.7934 NA NAPast performance may or may not be sustained in the future. * On face value of `10.Note: All Dividend (`/Unit)figuresareGrossDividend.Pursuant payment of dividend, the NAV of Dividend Option of schemes/plans would fall to the extent of payout and statutory levy, if applicable.
Note:^Theabovemeasureshavebeencalculatedbytakingrollingreturnsfora3yearperiodwith6.05%riskfreerateofreturn(1days-MIBORRateasonFebruary28,2018).** The Portfolio Turnover Rate (PTR) means the lower of aggregate sales or purchases made during the 12 month rolling year/period divided by the 12 month rolling year/period Average asset under Management for the relevant year/period.# TotalExpenseRatioisweightedaverageforthemonth.RatioexcludesGSTonmanagementfees.*Trailing12months(Annualized).
DataasonFebruary28,2018
For NAV details, please refer page 6
Minimum Investment Amount (`)Lumpsum Special ProductsNew Investor- `5,000 SIP-`2,000Existing Investor- `1,000STP-`1,000 RWP-` 500 6 installments each
Asset Under Managment (` Cr) MAAUM:18.31
AUM:18.21
Allotment Date & Benchmark Allotment Date
RegularPlan:July27,1999DirectPlan:January2,2013
Benchmark: Nifty 50
`Load StructureEntry Load: NILExit Load: 1% - if redeemed on or before90 days from the date of allotment; Nil - if redeemed after 90 days from the date of allotment.
Plans RegularPlan&DirectPlan.Options Both the Plans offer Growth & Dividend Option. Dividend Option under both the PlansoffersfacilityofPayout,ReinvestmentandSweep.
Managing Since: August 2015Total Experience: 28 years
Expense Ratio# (AsonFebruary28,2018)Direct Plan - 0.45%
Regular Plan - 0.95%`
Sector Allocation (Top 10) (As on February 28, 2018) (% of NAV)
Banks 26.18% Software 12.58% Petroleum Products 10.60% Auto 9.33% Consumer Non Durables 9.14% Finance 9.09% ConstructionProject 4.01% Pharmaceuticals 3.78% Non - Ferrous Metals 2.39% Power 2.30%
Performance (As on 28/02/2018)
Period Principal Index Fund - Nifty
Nifty 50 - TRI(Scheme’s Benchmark)
S&P BSE Sensex - TRI*(Additional Benchmark)
Returns (%)
$PTP Returns
Returns (%)
$PTP Returns
Returns (%)
$PTP Returns
1 Year (28-02-2017 to 28-02-2018) 18.42 11842.32 19.75 11975.13 20.46 12046.253 Years (27-02-2015 to 28-02-2018) 6.14 11961.87 7.21 12327.30 6.85 12203.555 Years (28-02-2013 to 28-02-2018) 13.34 18709.14 14.41 19608.54 14.28 19495.70Since Inception (27-07-1999 to 28-02-2018) 11.24 72610.00 13.39 103547.95 12.31 86743.50Differentplansshallhaveadifferentexpensestructure.TheperformancedetailsprovidedhereinareofRegularPlan-Growthoption.Past performance may or may not be sustained in future.Returns(in%)arecalculatedonCompoundedAnnualisedBasis(CAGR).$PTP (Point to Point) Returns are based on standard investment of `10,000/-madeatthebeginningofrelevantperiod.Performanceofthedividendoptionfortheinvestorswouldbenetofdividenddistributiontax,asapplicable.Pleasereferpage27forannexureofreturnsforallschememanagedbythefundmanager.*AsTRIdataisnotavailablesinceinceptionofthescheme,additionalbenchmarkperformanceiscalculatedusingcompositeCAGRofS&P BSE Sensex Index PRI values from date 27-07-1999 to 31-05-2007 and TRI values since 31-05-2007
14
Principal Arbitrage Fund(An open-ended equity scheme)
Investment Objective:Theinvestmentobjectiveoftheschemeistogeneratecapitalappreciationandincomebypredominantlyinvestinginarbitrageopportunitiesinthecashand derivative segments of the equity markets and the arbitrage opportunities available within the derivative segment and by investing the balance in debt and money market instruments.Thereisnoassuranceorguaranteethattheinvestmentobjectiveoftheschemewillberealized.
Fund Details Portfolio
Dividend Update
Date Regular Plan Direct PlanDividend (`/Unit)* Cum Dividend NAV Dividend (`/Unit)* Cum Dividend NAV
15-Sep-17 NA NA 0.0623 10.575817-Mar-17 0.0470 10.2725 0.0473 10.337617-Feb-17 0.0470 10.2923 0.0473 10.3520Past performance may or may not be sustained in the future. * On face value of `10.Note: All Dividend (`/Unit)figuresareGrossDividend.Pursuant payment of dividend, the NAV of Dividend Option of schemes/plans would fall to the extent of payout and statutory levy, if applicable.
Note:**ThePortfolioTurnoverRate(PTR)meansthelowerofaggregatesales or purchases made during the 12 month rolling year/period divided by the 12 month rolling year/period Average asset under Management for the relevantyear/period.# TotalExpenseRatioisweightedaverageforthemonth.RatioexcludesGSTonmanagementfees.*EffectiveFebruary01,2017.
DataasonFebruary28,2018
For NAV details, please refer page 6
Minimum Investment Amount (`)Lumpsum Special ProductsNew Investor- `5,000 SIP-`2,000Existing Investor- `1,000STP-`1,000 RWP-` 500 6 installments each
Asset Under Managment (` Cr) MAAUM:8.89
AUM:8.32
Allotment Date & Benchmark Allotment Date
RegularPlan:April21,2016DirectPlan:April21,2016
Benchmark: CRISIL Liquid Fund Index
`
Load StructureEntry Load: NILExit Load:0.50%-Ifredeemedonorbefore30daysfromthedateofallotment.NIL- Ifredeemed after 30 days from the date of al-lotment.(w.e.f.Aug.17,2016)
Plans RegularPlan&DirectPlan.Options Both the Plans offer Growth & Monthly* Dividend Option. Monthly* Dividend Optionunder both the Plans offers facility of Payout,ReinvestmentandSweep.
Other Details (AsonFebruary28,2018)Portfolio Turnover Ratio**: 12.11
Fund Manager DetailsName: RajatJain
Managing Since: April 2016Total Experience: 28 years
Expense Ratio# (AsonFebruary28,2018)Direct Plan - 0.47%
Regular Plan - 1.02%`
Sector Allocation (As on February 28, 2018) (% of NAV)
Principal Cash Management Fund - Growth Option Mutual Fund 13.06
CBLO / Reverse Repo Investments 5.67
Cash & Cash Equivalents 1.06
Net Assets 100.00
Performance (As on 28/02/2018)
Period Principal Arbitrage Fund
CRISIL Liquid Fund Index(Scheme’s Benchmark)
Nifty 50 - TRI(Additional Benchmark)
Returns (%)
$PTP Returns
Returns (%) $PTP Returns
Returns (%)
$PTP Returns
1 Year (28-02-2017 to 28-02-2018) 5.22 10522.43 6.68 10667.99 19.75 11975.13Since Inception (21-04-2016 to 28-02-2018) 5.52 11049.60 6.88 11316.51 18.01 13600.84Differentplansshallhaveadifferentexpensestructure.TheperformancedetailsprovidedhereinareofRegularPlan-Growthoption.Past performance may or may not be sustained in future.Returns(in%)arecalculatedonCompoundedAnnualisedBasis(CAGR).$PTP (Point to Point) Returns are based on standard investment of `10,000/-madeatthebeginningofrelevantperiod.Performanceofthedividendoptionfortheinvestorswouldbenetofdividenddistributiontax,asapplicable.Pleasereferpage27forannexureofreturnsforallschememanagedbythefundmanager.AboveoneyearperformanceofPrincipalArbitrageFundisnotgivenastheschemehavenotbeeninexistencefor3years.
15
Principal Balanced Fund(An open-ended balanced scheme)
Fund Details Portfolio
Name Rating % of NAVConsumer Non Durables 10.49ITCLtd. 2.48GlaxoSmithKline Consumer HealthcareLtd. 2.19
Ess Kay Fincorp Ltd IND A (SO) 0.60SpritTextilesPrivateLtd. BWRAA- 0.49National Bank for Agriculture and Rural Development CRISIL AAA 0.48
Dewan Housing Finance CorporationLtd. BWRAAA 0.47
Housing Development Finance CorporationLtd. CRISIL AAA 0.47
Housing Development Finance CorporationLtd. CRISIL AAA 0.47
PiramalEnterprisesLtd. [ICRA]AA 0.47LICHousingFinanceLtd. CRISIL AAA 0.47PNB Housing Finance Ltd IND AAA 0.46PowerGridCorporationofIndiaLtd. CRISIL AAA 0.44AvanseFinancialServicesLtd. CARE AA+ (SO) 0.28TataMotorsLtd. CARE AA+ 0.19IndiabullsHousingFinanceLtd. BWRAAA 0.12AspireHomeFinanceCorporationLtd. [ICRA]AA- 0.10Sovereign 8.697.59%GovernmentofIndiaSecurity Sovereign 1.567.68%GovernmentofIndiaSecurity Sovereign 1.427.59%GovernmentofIndiaSecurity Sovereign 1.396.84%GovernmentofIndiaSecurity Sovereign 1.206.79%GovernmentofIndiaSecurity Sovereign 1.018.33%GovernmentofIndiaSecurity Sovereign 0.777.72%GovernmentofIndiaSecurity Sovereign 0.477.17%GovernmentofIndiaSecurity Sovereign 0.456.68%GovernmentofIndiaSecurity Sovereign 0.42State Government Securities 0.958.35%GujaratStateGovernmentSecurity Sovereign 0.95
Investment Funds/Mutual Funds 1.43Principal Credit Opportunities Fund - Direct Plan - Growth Option Mutual Fund 1.43
Dividend (`/Unit)* Cum Dividend NAV Dividend (`/Unit)* Cum Dividend NAV16-Feb-18 0.2867 28.6200 0.3251 32.460017-Jan-18 0.3018 30.1600 0.3416 34.150015-Dec-17 0.2918 29.2200 0.3297 33.030017-Nov-17 0.2960 29.5300 0.3340 33.3300Past performance may or may not be sustained in the future. * On face value of `10.Note: All Dividend (`/Unit)figuresareGrossDividend.Pursuant payment of dividend, the NAV of Dividend Option of schemes/plans would fall to the extent of payout and statutory levy, if applicable.
Performance (As on 28/02/2018)
PeriodPrincipal Balanced Fund
CRISIL Hybrid 35+65 - Aggressive Index*
(Scheme’s Benchmark)
Nifty 50 - TRI(Additional Benchmark)
Returns (%) $PTP Returns Returns (%) $PTP
Returns Returns (%) $PTP Returns
1 Year (28-02-2017 to 28-02-2018) 24.85 12485.47 14.71 11470.87 19.75 11975.133 Years (27-02-2015 to 28-02-2018) 13.56 14653.16 8.96 12941.30 7.21 12327.305 Years (28-02-2013 to 28-02-2018) 18.21 23095.82 13.72 19024.16 14.41 19608.54Since Inception (14-01-2000 to 28-02-2018) 11.77 75200.00 NA NA 12.41 83440.54Differentplansshallhaveadifferentexpensestructure.TheperformancedetailsprovidedhereinareofRegularPlan-Growthoption.Past performance may or may not be sustained in future.Returns(in%)arecalculatedonCompoundedAnnualisedBasis(CAGR).$PTP (Point to Point) Returns are based on standard investment of `10,000/-madeatthebeginningofrelevantperiod.Performanceofthedividendoptionfortheinvestorswouldbenetofdividenddistributiontax,asapplicable. Pleasereferpage27forannexureofreturnsforallschememanagedbythefundmanager.* The equity component of CRISIL Hybrid 35+65 - Aggressive Index is represented by total returns variant of S&P BSE 200
DataasonFebruary28,2018
Minimum Investment Amount (`)Lumpsum Special ProductsNew Investor- `5,000 SIP-`2,000Existing Investor- `1,000STP-`1,000 RWP-` 500 6 installments each
`Load StructureEntry Load: NILExit Load: If redeemed/ switched on or before1yearfromthedateofallotment:-Nil for redemption/ switch out of units upto 24%oftheunitsallotted(thelimit)-1%onredemption in excess of 24% of the limitstated above- Redemption of units would be done on First in First out Basis (FIFO) Nil thereafter
Plans RegularPlan&DirectPlan.Options Both the Plans offer Growth & Monthly Dividend Option. Monthly Dividend Optionunder both the Plan offers facility of Payout,ReinvestmentandSweep.
Note:^Theabovemeasureshavebeencalculatedbytakingrollingreturnsfora3yearperiodwith6.05%riskfreerateofreturn(1days-MIBORRateasonFebruary28,2018).** The Portfolio Turnover Rate (PTR) means the lower of aggregate sales or purchases made during the 12 month rolling year/period divided by the 12 month rolling year/period Average asset under Management for the relevant year/period.# TotalExpenseRatioisweightedaverageforthemonth.RatioexcludesGSTonmanagementfees.@Forequityportiononly.
Fund Manager DetailsName: P.V.K.Mohan(ForEquityPortion)
& Bekxy Kuriakose (For Debt Portion)Managing Since: May 2010 & Mar 2016
Total Experience: 24 years & 17 years
Expense Ratio# (AsonFebruary28,2018)Direct Plan - 0.63%
Century Textiles & IndustriesLtd. Stock Future -3.18
MarutiSuzukiIndiaLtd. Auto 3.06MarutiSuzukiIndiaLtd. Stock Future -3.08Sun Pharmaceutical IndustriesLtd. Pharmaceuticals 3.02
Sun Pharmaceutical IndustriesLtd. Stock Future -3.04
State Bank of India Banks 2.50
Dividend UpdateDate Regular Plan Direct Plan
Dividend (`/Unit)* Cum Dividend NAV Dividend (`/Unit)* Cum Dividend NAV16-Feb-18 0.1396 15.2700 0.1532 16.760017-Jan-18 0.1426 15.6200 0.1562 17.100015-Dec-17 0.1489 15.5500 0.1627 17.000017-Nov-17 0.1503 15.6700 0.1641 17.1100Past performance may or may not be sustained in the future. * On face value of `10.Note: All Dividend (`/Unit)figuresareGrossDividend.Pursuant payment of dividend, the NAV of Dividend Option of schemes/plans would fall to the extent of payout and statutory levy, if applicable.
Note:^Theabovemeasureshavebeencalculatedbytakingrollingreturnsfora3yearperiodwith6.05%riskfreerateofreturn(1days-MIBORRateasonFebruary28,2018).** The Portfolio Turnover Rate (PTR) means the lower of aggregate sales or purchases made during the 12 month rolling year/period divided by the 12 month rolling year/period Average asset under Management for the relevant year/period.# TotalExpenseRatioisweightedaverageforthemonth.RatioexcludesGSTonmanagementfees.
DataasonFebruary28,2018
For NAV details, please refer page 6
Minimum Investment Amount (`)Lumpsum Special ProductsNew Investor- `5,000 SIP-`2,000Existing Investor- `1,000STP-`1,000 RWP-` 500 6 installments each
Load StructureEntry Load: NILExit Load: If redeemed/ switched on or be-fore1yearfromthedateofallotment.-Nilfor redemption/ switch out of units upto 24% of the units allotted (the limit) - 1%onredemptioninexcessof24%ofthelimitstated above - Redemption of units would be done on First in First out Basis (FIFO) Nil thereafter
Plans RegularPlan&DirectPlan.Options Both the Plans offer Growth & Monthly Dividend Option. Monthly Dividend Optionunder both the Plans offers facility of Payout,ReinvestmentandSweep.
Expense Ratio# (AsonFebruary28,2018)Direct Plan - 0.64%
Regular Plan - 2.64%`
Sector Allocation of Equity Instruments (Top 10) (As on February 28, 2018) (% of NAV)
Consumer Non Durables 4.72% Software 3.03% Banks 3.02% Power 2.84% Auto 1.78% ConstructionProject 0.91% Finance 0.90% Minerals/Mining 0.89% Petroleum Products 0.85% Pharmaceuticals 0.44%
Performance (As on 28/02/2018)
Period Principal Smart Equity Fund
CRISIL Hybrid 35+65 - Aggressive Index*
(Scheme’s Benchmark)
Nifty 50 - TRI(Additional Benchmark)
Returns (%)
$PTP Returns
Returns (%)
$PTP Returns
Returns (%)
$PTP Returns
1 Year (28-02-2017 to 28-02-2018) 8.18 10818.23 14.71 11470.87 19.75 11975.133 Years (27-02-2015 to 28-02-2018) 5.52 11754.18 8.96 12941.30 7.21 12327.305 Years (28-02-2013 to 28-02-2018) 12.50 18023.79 13.72 19024.16 14.41 19608.54Since Inception (16-12-2010 to 28-02-2018) 9.86 19700.00 10.05 19937.10 9.51 19244.20Different plans shall have a different expense structure. The performance details provided herein are of Regular Plan - Growth option.Past performance may or may not be sustained in future.Returns(in%)arecalculatedonCompoundedAnnualisedBasis(CAGR).$PTP(PointtoPoint) Returns are based on standard investment of `10,000/-madeatthebeginningofrelevantperiod.Performanceofthedividendoptionfortheinvestorswouldbenetofdividenddistributiontax,asapplicable.Pleasereferpage27forannexureofreturnsforallschememanagedbythefundmanager.* The equity component of CRISIL Hybrid 35+65 - Aggressive Index is represented by total returns variant of S&P BSE 200
Fund Details
Name Rating / Industry % to Net Assets
% to Net Assets
DerivativesState Bank of India Stock Future -2.52Indiabulls Housing FinanceLtd. Finance 2.49
Indiabulls Housing FinanceLtd. Stock Future -2.50
BajajAutoLtd. Auto 1.65BajajAutoLtd. Stock Future -1.66
FortisHealthcareLtd. Healthcare Services 1.55
FortisHealthcareLtd. Stock Future -1.55EscortsLtd. Auto 1.25EscortsLtd. Stock Future -1.25RelianceInfrastructureLtd. Power 0.92RelianceInfrastructureLtd. Stock Future -0.93Chennai Petroleum CorporationLtd.
Petroleum Products 0.91
Chennai Petroleum CorporationLtd. Stock Future -0.92
TataMotorsLtd.A-DVR Auto 0.63TataMotorsLtd.A-DVR Stock Future -0.63TechMahindraLtd. Software 0.51TechMahindraLtd. Stock Future -0.51ReliancePowerLtd. Power 0.47ReliancePowerLtd. Stock Future -0.47
BalrampurChiniMillsLtd. Consumer Non Durables 0.29
BalrampurChiniMillsLtd. Stock Future -0.29
ITCLtd. Consumer Non Durables 0.22
ITCLtd. Stock Future -0.22JetAirways(India)Ltd. Transportation 0.21JetAirways(India)Ltd. Stock Future -0.21Commercial Paper 11.26HSILLtd. [ICRA]A1+ 2.84Cox&KingsLtd. BWRA1+ 2.83HCLInfosystemsLtd. [ICRA]A1 2.81KribhcoFertilizersLtd. [ICRA]A1+ 1.73Cox&KingsLtd. BWRA1+ 1.05Treasury Bill 0.48TBILL 323 DAYS 2018 Sovereign 0.48BONDS & NCDs 10.09JMFinancialProductsLtd. CRISIL AA 2.29ManappuramFinanceLtd. CARE AA 1.91TataMotorsLtd. CARE AA+ 1.73PiramalEnterprisesLtd. [ICRA]AA 1.72Dewan Housing Finance CorporationLtd. BWRAAA 1.16
Indiabulls Housing FinanceLtd. BWRAAA 0.69
Power Grid Corporation of IndiaLtd. CRISIL AAA 0.59
Investment Funds/Mutual Funds 1.96
Principal Cash Management Fund - Growth Option Mutual Fund 1.96
CBLO / Reverse Repo Investments 2.58
Cash & Cash Equivalents 7.09Net Assets 100.00
17
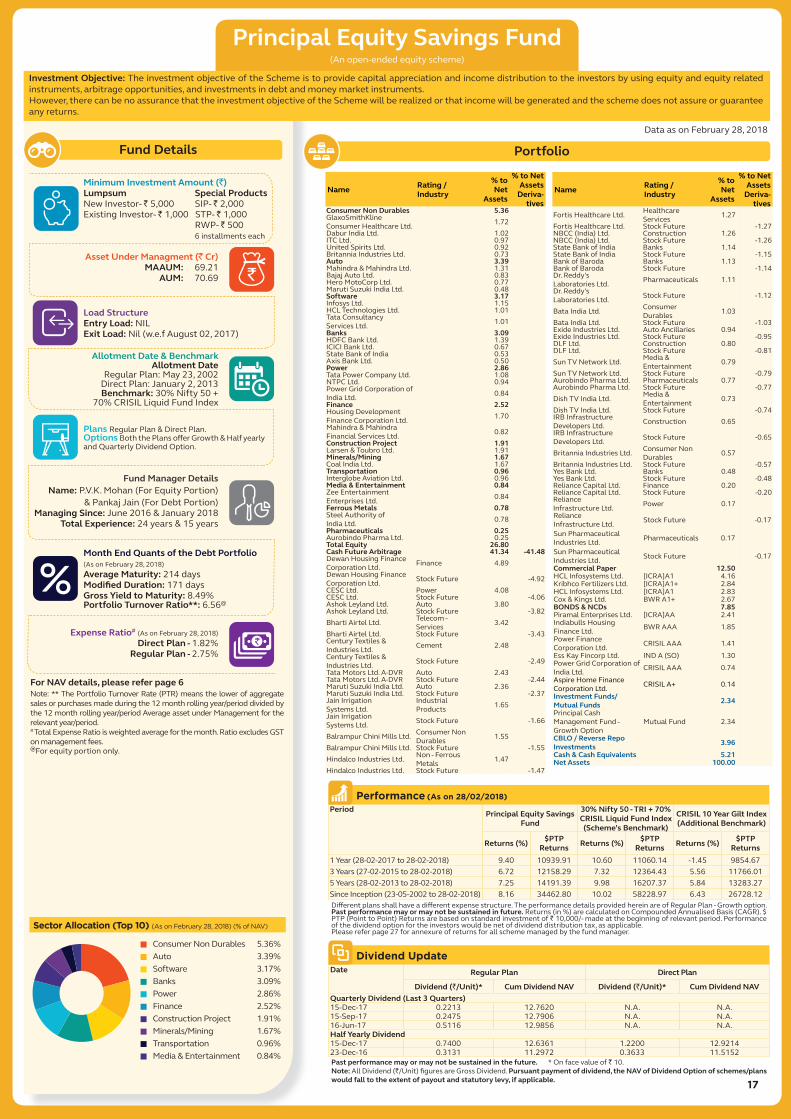
Principal Equity Savings Fund(An open-ended equity scheme)
Fund Details Portfolio
Dividend UpdateDate Regular Plan Direct Plan
Dividend (`/Unit)* Cum Dividend NAV Dividend (`/Unit)* Cum Dividend NAVQuarterly Dividend (Last 3 Quarters)15-Dec-17 0.2213 12.7620 N.A. N.A.15-Sep-17 0.2475 12.7906 N.A. N.A.16-Jun-17 0.5116 12.9856 N.A. N.A.Half Yearly Dividend15-Dec-17 0.7400 12.6361 1.2200 12.921423-Dec-16 0.3131 11.2972 0.3633 11.5152Past performance may or may not be sustained in the future. * On face value of `10.Note: All Dividend (`/Unit)figuresareGrossDividend.Pursuant payment of dividend, the NAV of Dividend Option of schemes/plans would fall to the extent of payout and statutory levy, if applicable.
DataasonFebruary28,2018
Minimum Investment Amount (`)Lumpsum Special ProductsNew Investor- `5,000 SIP-`2,000Existing Investor- `1,000STP-`1,000 RWP-` 500 6 installments each
Plans RegularPlan&DirectPlan.Options Both the Plans offer Growth & Half yearly andQuarterlyDividendOption.
Month End Quants of the Debt Portfolio (AsonFebruary28,2018)Average Maturity: 214 daysModified Duration: 171 daysGross Yield to Maturity: 8.49% Portfolio Turnover Ratio**: 6.56@
Note:**ThePortfolioTurnoverRate(PTR)meansthelowerofaggregatesales or purchases made during the 12 month rolling year/period divided by the 12 month rolling year/period Average asset under Management for the relevantyear/period.# TotalExpenseRatioisweightedaverageforthemonth.RatioexcludesGSTonmanagementfees.@Forequityportiononly.
Fund Manager DetailsName: P.V.K.Mohan (For Equity Portion)
Sector Allocation (Top 10) (As on February 28, 2018) (% of NAV)
Consumer Non Durables 5.36% Auto 3.39% Software 3.17% Banks 3.09% Power 2.86% Finance 2.52% ConstructionProject 1.91% Minerals/Mining 1.67% Transportation 0.96% Media & Entertainment 0.84%
Performance (As on 28/02/2018)
Period Principal Equity Savings Fund
30% Nifty 50 - TRI + 70% CRISIL Liquid Fund Index (Scheme’s Benchmark)
CRISIL 10 Year Gilt Index(Additional Benchmark)
Returns (%) $PTP Returns Returns (%) $PTP
Returns Returns (%) $PTP Returns
1 Year (28-02-2017 to 28-02-2018) 9.40 10939.91 10.60 11060.14 -1.45 9854.673 Years (27-02-2015 to 28-02-2018) 6.72 12158.29 7.32 12364.43 5.56 11766.015 Years (28-02-2013 to 28-02-2018) 7.25 14191.39 9.98 16207.37 5.84 13283.27Since Inception (23-05-2002 to 28-02-2018) 8.16 34462.80 10.02 58228.97 6.43 26728.12Differentplansshallhaveadifferentexpensestructure.TheperformancedetailsprovidedhereinareofRegularPlan-Growthoption.Past performance may or may not be sustained in future.Returns(in%)arecalculatedonCompoundedAnnualisedBasis(CAGR).$PTP (Point to Point) Returns are based on standard investment of `10,000/-madeatthebeginningofrelevantperiod.Performanceofthedividendoptionfortheinvestorswouldbenetofdividenddistributiontax,asapplicable. Pleasereferpage27forannexureofreturnsforallschememanagedbythefundmanager.
Name Rating / Industry
% to Net
Assets
% to Net Assets
Deriva-tives
Consumer Non Durables 5.36GlaxoSmithKline ConsumerHealthcareLtd. 1.72DaburIndiaLtd. 1.02ITCLtd. 0.97UnitedSpiritsLtd. 0.92BritanniaIndustriesLtd. 0.73Auto 3.39Mahindra&MahindraLtd. 1.31BajajAutoLtd. 0.83HeroMotoCorpLtd. 0.77MarutiSuzukiIndiaLtd. 0.48Software 3.17InfosysLtd. 1.15HCLTechnologiesLtd. 1.01Tata Consultancy ServicesLtd. 1.01Banks 3.09HDFCBankLtd. 1.39ICICIBankLtd. 0.67State Bank of India 0.53AxisBankLtd. 0.50Power 2.86TataPowerCompanyLtd. 1.08NTPCLtd. 0.94Power Grid Corporation of IndiaLtd. 0.84Finance 2.52Housing Development FinanceCorporationLtd. 1.70Mahindra & Mahindra FinancialServicesLtd. 0.82Construction Project 1.91Larsen&ToubroLtd. 1.91Minerals/Mining 1.67CoalIndiaLtd. 1.67Transportation 0.96InterglobeAviationLtd. 0.96Media & Entertainment 0.84Zee Entertainment EnterprisesLtd. 0.84Ferrous Metals 0.78Steel Authority of IndiaLtd. 0.78Pharmaceuticals 0.25AurobindoPharmaLtd. 0.25Total Equity 26.80Cash Future Arbitrage 41.34 -41.48Dewan Housing Finance CorporationLtd. Finance 4.89Dewan Housing Finance CorporationLtd. Stock Future -4.92CESCLtd. Power 4.08CESCLtd. Stock Future -4.06AshokLeylandLtd. Auto 3.80AshokLeylandLtd. Stock Future -3.82BhartiAirtelLtd. Telecom -
FortisHealthcareLtd. Stock Future -1.27NBCC(India)Ltd. Construction 1.26NBCC(India)Ltd. Stock Future -1.26State Bank of India Banks 1.14State Bank of India Stock Future -1.15Bank of Baroda Banks 1.13Bank of Baroda Stock Future -1.14Dr.Reddy's LaboratoriesLtd. Pharmaceuticals 1.11Dr.Reddy's LaboratoriesLtd. Stock Future -1.12
BataIndiaLtd. Consumer Durables 1.03
BataIndiaLtd. Stock Future -1.03ExideIndustriesLtd. Auto Ancillaries 0.94ExideIndustriesLtd. Stock Future -0.95DLFLtd. Construction 0.80DLFLtd. Stock Future -0.81SunTVNetworkLtd. Media &
Entertainment 0.79SunTVNetworkLtd. Stock Future -0.79AurobindoPharmaLtd. Pharmaceuticals 0.77AurobindoPharmaLtd. Stock Future -0.77DishTVIndiaLtd. Media &
Entertainment 0.73DishTVIndiaLtd. Stock Future -0.74IRB Infrastructure DevelopersLtd. Construction 0.65IRB Infrastructure DevelopersLtd. Stock Future -0.65
BritanniaIndustriesLtd. Consumer Non Durables 0.57
EssKayFincorpLtd. IND A (SO) 1.30Power Grid Corporation of IndiaLtd. CRISIL AAA 0.74
Aspire Home Finance CorporationLtd. CRISIL A+ 0.14
Investment Funds/Mutual Funds 2.34
Principal Cash Management Fund - Growth Option
Mutual Fund 2.34
CBLO / Reverse Repo Investments 3.96
Cash & Cash Equivalents 5.21Net Assets 100.00
18
Principal Cash Management Fund(An open-ended liquid scheme)
Investment Objective: To provide investors with as high a level of income available from short-term investments as is considered consistent with preservationofcapitalandmaintenanceofliquidity,byinvestinginaportfolioofmoneymarketandinvestmentgradedebtinstruments.
Fund Details Portfolio
Dividend Update
Date Regular Plan Direct PlanDividend (`/Unit)* Cum Dividend NAV Dividend (`/Unit)* Cum Dividend NAV
Monthly Dividend (Last 3 Months)16-Feb-18 5.5953 1028.3197 5.6544 1028.395617-Jan-18 6.1099 1028.8343 6.1756 1028.916815-Dec-17 4.9877 1027.7121 5.0477 1027.7889Past performance may or may not be sustained in the future. * On face value of `1,000.Note: All Dividend (`/Unit)figuresareGrossDividend.Pursuant payment of dividend, the NAV of Dividend Option of schemes/plans would fall to the extent of payout and statutory levy, if applicable.
Performance (As on 28/02/2018)
Period Principal Cash Management Fund
CRISIL Liquid Fund Index
(Scheme’s Benchmark)
CRISIL 1 Year T-Bill Index
(Additional Benchmark)Returns
(%)$PTP
ReturnsReturns
(%)$PTP
ReturnsReturns
(%)$PTP
Returns1 Year (28-02-2017 to 28-02-2018) 6.75 10674.56 6.68 10667.99 5.65 10565.423 Years (27-02-2015 to 28-02-2018) 7.51 12432.03 7.36 12380.34 6.96 12242.765 Years (28-02-2013 to 28-02-2018) 8.15 14801.68 8.08 14749.72 7.05 14058.24Since Inception (30-08-2004 to 28-02-2018) 7.57 26805.90 7.12 25335.48 6.06 22137.48Differentplansshallhaveadifferentexpensestructure.TheperformancedetailsprovidedhereinareofRegularPlan-Growthoption.Past performance may or may not be sustained in future.Returns(in%)arecalculatedonCompoundedAnnualisedBasis(CAGR).$PTP (Point to Point) Returns are based on standard investment of `10,000/-madeatthebeginningofrelevantperiod.Performanceofthedividendoptionfortheinvestorswouldbenetofdividenddistributiontax,asapplicable. Pleasereferpage27forannexureofreturnsforallschememanagedbythefundmanager.
DataasonFebruary28,2018
Rating Profile (As on February 28, 2018) (% of NAV)
InrespectofLiquidScheme(s)NAVapplicableshallbesubjecttoreceiptofvalidapplication/switch-inrequestattheOPTand credit of entire subscription/switch-in amounts into the Bank Account of the concerning Scheme(s)/Plan(s) and funds areavailableforutilizationbytheScheme(s)/Plan(s),withinrelevantcut-offtimeasapplicabletotherelevantScheme(s)/Plan(s).Past performance is no guarantee of future result.(++forratingmethodologypleasereferpage4.)
19
Principal Low Duration Fund(An open-ended debt scheme)
Date Regular Plan Direct PlanDividend (`/Unit)* Cum Dividend NAV Dividend (`/Unit)* Cum Dividend NAV
Monthly Dividend (Last 3 Months)16-Feb-18 5.9037 1145.0230 6.2910 1147.364917-Jan-18 4.4564 1143.5757 4.8771 1145.951015-Dec-17 4.6883 1143.8076 5.0496 1146.1235Past performance may or may not be sustained in the future. * On face value of `1,000.Note: All Dividend (`/Unit)figuresareGrossDividend.Pursuant payment of dividend, the NAV of Dividend Option of schemes/plans would fall to the extent of payout and statutory levy, if applicable.
DataasonFebruary28,2018
Rating Profile (As on February 28, 2018) (% of NAV)
27.37%18.78%
14.34%10.86%
8.91%4.84%4.56%
2.66%0.69%
6.99%
0.00% 10.00% 20.00% 30.00%
AAAAA
A1+AA-
A1AA+(SO)
AA+A(SO)
SovereignCash & Cash Equivalents
Minimum Investment Amount (`)Lumpsum Special ProductsNew Investor- `5,000 SIP-`2,000Existing Investor- `1,000STP-`1,000 RWP-` 500 6 installments each
Past performance is no guarantee of future result.(++forratingmethodologypleasereferpage4.)
Credit Risk Rating [ICRA] A1+mfs++
Performance (As on 28/02/2018)
Period Principal Low Duration Fund
CRISIL Liquid Fund Index
(Scheme’s Benchmark)
CRISIL 1 Year T-Bill Index
(Additional Benchmark)Returns
(%)$PTP
ReturnsReturns
(%)$PTP
ReturnsReturns
(%)$PTP
Returns1 Year (28-02-2017 to 28-02-2018) 6.87 10686.86 6.68 10667.99 5.65 10565.423 Years (27-02-2015 to 28-02-2018) 7.90 12567.36 7.36 12380.34 6.96 12242.765 Years (28-02-2013 to 28-02-2018) 8.22 14844.15 8.08 14749.72 7.05 14058.24Since Inception (14-09-2004 to 28-02-2018) 7.78 27416.00 7.14 25296.79 6.07 22119.31Differentplansshallhaveadifferentexpensestructure.TheperformancedetailsprovidedhereinareofRegularPlan-Growthoption.Past performance may or may not be sustained in future.Returns(in%)arecalculatedonCompoundedAnnualisedBasis(CAGR).$PTP (Point to Point) Returns are based on standard investment of `10,000/-madeatthebeginningofrelevantperiod.Performanceofthedividendoptionfortheinvestorswouldbenetofdividenddistributiontax,asapplicable. Pleasereferpage27forannexureofreturnsforallschememanagedbythefundmanager.
20
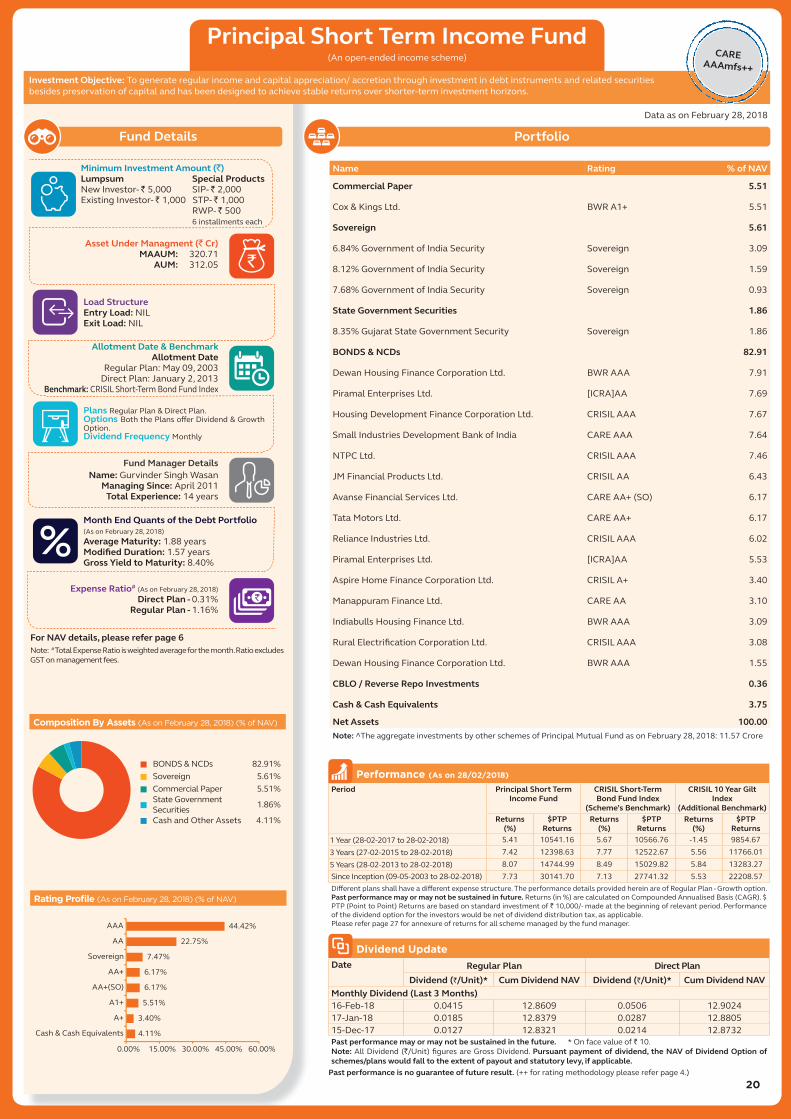
Principal Short Term Income Fund(An open-ended income scheme)
Investment Objective: To generate regular income and capital appreciation/ accretion through investment in debt instruments and related securities besidespreservationofcapitalandhasbeendesignedtoachievestablereturnsovershorter-terminvestmenthorizons.
Portfolio
Dividend Update
Date Regular Plan Direct PlanDividend (`/Unit)* Cum Dividend NAV Dividend (`/Unit)* Cum Dividend NAV
Monthly Dividend (Last 3 Months)16-Feb-18 0.0415 12.8609 0.0506 12.902417-Jan-18 0.0185 12.8379 0.0287 12.880515-Dec-17 0.0127 12.8321 0.0214 12.8732Past performance may or may not be sustained in the future. * On face value of `10.Note: All Dividend (`/Unit)figuresareGrossDividend.Pursuant payment of dividend, the NAV of Dividend Option of schemes/plans would fall to the extent of payout and statutory levy, if applicable.
DataasonFebruary28,2018
Rating Profile (As on February 28, 2018) (% of NAV)
Net Assets 100.00Note: ^TheaggregateinvestmentsbyotherschemesofPrincipalMutualFundasonFebruary28,2018:11.57Crore
CARE AAAmfs++
Past performance is no guarantee of future result.(++forratingmethodologypleasereferpage4.)
Performance (As on 28/02/2018)
Period Principal Short Term Income Fund
CRISIL Short-Term Bond Fund Index
(Scheme’s Benchmark)
CRISIL 10 Year Gilt Index
(Additional Benchmark)Returns
(%)$PTP
ReturnsReturns
(%)$PTP
ReturnsReturns
(%)$PTP
Returns1 Year (28-02-2017 to 28-02-2018) 5.41 10541.16 5.67 10566.76 -1.45 9854.673 Years (27-02-2015 to 28-02-2018) 7.42 12398.63 7.77 12522.67 5.56 11766.015 Years (28-02-2013 to 28-02-2018) 8.07 14744.99 8.49 15029.82 5.84 13283.27Since Inception (09-05-2003 to 28-02-2018) 7.73 30141.70 7.13 27741.32 5.53 22208.57Differentplansshallhaveadifferentexpensestructure.TheperformancedetailsprovidedhereinareofRegularPlan-Growthoption.Past performance may or may not be sustained in future.Returns(in%)arecalculatedonCompoundedAnnualisedBasis(CAGR).$PTP (Point to Point) Returns are based on standard investment of `10,000/-madeatthebeginningofrelevantperiod.Performanceofthedividendoptionfortheinvestorswouldbenetofdividenddistributiontax,asapplicable. Pleasereferpage27forannexureofreturnsforallschememanagedbythefundmanager.
21
Principal Dynamic Bond Fund(An open-ended income scheme)
Investment Objective: To generate regular income and capital appreciation/accretion through investment in debt instruments and related securities besides preservation of capital.
Portfolio
Dividend Update
Date Regular Plan Direct PlanDividend (`/Unit)* Cum Dividend NAV Dividend (`/Unit)* Cum Dividend NAV
Quarterly Dividend Option (Last 3 Quarters)15-Dec-17 - - 0.0158 13.323415-Sep-17 0.2001 13.4490 0.2240 13.546016-Jun-17 0.3941 13.6613 0.4209 13.7595Annual Dividend Option (Last 3 Years)15-Sep-17 0.8390 12.1187 0.9571 12.557423-Sep-16 1.1602 12.4565 1.2865 12.902024-Sep-15 1.3206 12.5520 1.4457 12.9921Past performance may or may not be sustained in the future. * On face value of `10.Note: All Dividend (`/Unit)figuresareGrossDividend.Pursuant payment of dividend, the NAV of Dividend Option of schemes/plans would fall to the extent of payout and statutory levy, if applicable.
Period Portfolio (%)0-1 year 8.561-3 years 8.823-5 years 23.565-10 years 32.50Above 10 years 23.88Cash & Others Assets 2.69
Performance (As on 28/02/2018)
Period Principal Dynamic Bond Fund
CRISIL Composite Bond Fund Index
(Scheme’s Benchmark)
CRISIL 10 Year Gilt Index
(Additional Benchmark)Returns
(%)$PTP
ReturnsReturns
(%)$PTP
ReturnsReturns
(%)$PTP
Returns1 Year (28-02-2017 to 28-02-2018) 3.18 10318.39 4.25 10425.13 -1.45 9854.673 Years (27-02-2015 to 28-02-2018) 6.58 12111.05 7.60 12462.52 5.56 11766.015 Years (28-02-2013 to 28-02-2018) 7.54 14388.84 8.26 14872.83 5.84 13283.27Since Inception (09-05-2003 to 28-02-2018) 7.44 28950.50 6.55 25599.35 5.53 22208.57Differentplansshallhaveadifferentexpensestructure.TheperformancedetailsprovidedhereinareofRegularPlan-Growthoption.Past performance may or may not be sustained in future.Returns(in%)arecalculatedonCompoundedAnnualisedBasis(CAGR).$PTP (Point to Point) Returns are based on standard investment of `10,000/-madeatthebeginningofrelevantperiod.Performanceofthedividendoptionfortheinvestorswouldbenetofdividenddistributiontax,asapplicable. Pleasereferpage27forannexureofreturnsforallschememanagedbythefundmanager.
22
Principal Credit Opportunities Fund(An open-ended debt scheme)
Date Regular Plan Direct PlanDividend (`/Unit)* Cum Dividend NAV Dividend (`/Unit)* Cum Dividend NAV
Monthly Dividend (Last 3 Months)16-Feb-18 6.8732 1242.3917 6.9380 1245.401917-Jan-18 6.7861 1242.3046 6.8591 1245.323015-Dec-17 4.6011 1240.1196 4.6622 1243.1261Past performance may or may not be sustained in the future. * On face value of `1,000.Note: All Dividend (`/Unit)figuresareGrossDividend.Pursuant payment of dividend, the NAV of Dividend Option of schemes/plans would fall to the extent of payout and statutory levy, if applicable.
DataasonFebruary28,2018
Rating Profile (As on February 28, 2018) (% of NAV)
36.95%19.16%
9.78%9.69%
7.40%6.04%5.73%
1.16%0.14%
3.95%
0.00% 10.00% 20.00% 30.00% 40.00%
AAAA1+AAA1
A(SO)AA-
AA+A+
SovereignCash & Cash Equivalents
Fund Details
Minimum Investment Amount (`)Lumpsum Special ProductsNew Investor- `5,000 SIP-`2,000Existing Investor- `1,000STP-`1,000 RWP-` 500 6 installments each
Returns1 Year (28-02-2017 to 28-02-2018) 6.97 10696.57 6.68 10667.99 5.65 10565.423 Years (27-02-2015 to 28-02-2018) 8.18 12666.77 7.36 12380.34 6.96 12242.765 Years (28-02-2013 to 28-02-2018) 8.31 14910.82 8.08 14749.72 7.05 14058.24Since Inception (14-09-2004 to 28-02-2018) 7.65 26990.30 7.14 25296.79 6.07 22119.31Differentplansshallhaveadifferentexpensestructure.TheperformancedetailsprovidedhereinareofRegularPlan-Growthoption.Past performance may or may not be sustained in future.Returns(in%)arecalculatedonCompoundedAnnualisedBasis(CAGR).$PTP (Point to Point) Returns are based on standard investment of `10,000/-madeatthebeginningofrelevantperiod.Performanceofthedividendoptionfortheinvestorswouldbenetofdividenddistributiontax,asapplicable. Pleasereferpage27forannexureofreturnsforallschememanagedbythefundmanager.
23
Principal Debt Savings Fund(An open-ended income fund)
Investment Objective: To seek to generate stable returns and capital appreciation through investment in Debt instruments and related securities over medium to long term investmenthorizon.
Portfolio
Dividend Update
Date Regular Plan Direct PlanDividend (`/Unit)* Cum Dividend NAV Dividend (`/Unit)* Cum Dividend NAV
Monthly Dividend (Last 3 Months)15-Sep-17 0.0244 10.2866 N.A. N.A.16-Aug-17 0.0344 10.2966 N.A. N.A.17-Jul-17 0.0446 10.3068 N.A. N.A.Quarterly Dividend (Last 3 Quarters)15-Sep-17 0.1281 12.1944 N.A. N.A.16-Jun-17 0.3584 12.4305 N.A. N.A.23-Dec-16 0.3421 12.4063 N.A. N.A.Past performance may or may not be sustained in the future. * On face value of `10.Note: All Dividend (`/Unit)figuresareGrossDividend.Pursuant payment of dividend, the NAV of Dividend Option of schemes/plans would fall to the extent of payout and statutory levy, if applicable.
DataasonFebruary28,2018
Rating Profile (As on February 28, 2018) (% of NAV)
41.83%
18.33%
15.58%
9.46%
7.08%
7.72%
0.00% 15.00% 30.00% 45.00%
Sovereign
AAA
AA
A+
AA+
Cash & Cash Equivalents
Fund Details
Minimum Investment Amount (`)Lumpsum Special ProductsNew Investor- `5,000 SIP-`2,000Existing Investor- `1,000STP-`1,000 RWP-` 500 6 installments each
Managing Since: January01,2018Total Experience: 14 years
Expense Ratio# (AsonFebruary28,2018)Direct Plan - 0.53%
Regular Plan - 1.82%`
For NAV details, please refer page 6
Composition By Assets (As on February 28, 2018) (% of NAV)
BONDS & NCDs 50.45% Sovereign 22.02%
State Government Securities 18.96%
Treasury Bill 0.85% Cash and Other Assets 7.72%
Name Rating % of NAV
Treasury Bill 0.85
TBILL 323 DAYS 2018 Sovereign 0.85
Sovereign 22.02
6.68%GovernmentofIndiaSecurity Sovereign 21.10
6.84%GovernmentofIndiaSecurity Sovereign 0.92
State Government Securities 18.96
8.35%GujaratStateGovernmentSecurity Sovereign 18.96
BONDS & NCDs 50.45
AspireHomeFinanceCorporationLtd. CRISIL A+ 9.46
PiramalEnterprisesLtd. [ICRA]AA 8.46
PNBHousingFinanceLtd. IND AAA 8.36
ManappuramFinanceLtd. CARE AA 7.12
TataMotorsLtd. CARE AA+ 7.08
NTPCLtd. CRISIL AAA 4.75
DewanHousingFinanceCorporationLtd. BWRAAA 4.75
DewanHousingFinanceCorporationLtd. BWRAAA 0.47
CBLO / Reverse Repo Investments 4.97
Cash & Cash Equivalents 2.75
Net Assets 100.00
Performance (As on 28/02/2018)
Period Principal Debt Savings Fund
CRISIL Short-Term Bond Fund Index
(Scheme’s Benchmark)
CRISIL 10 Year Gilt Index
(Additional Benchmark)Returns
(%)$PTP
ReturnsReturns
(%)$PTP
ReturnsReturns
(%)$PTP
Returns1 Year (28-02-2017 to 28-02-2018) 2.00 10200.42 5.67 10566.76 -1.45 9854.673 Years (27-02-2015 to 28-02-2018) 6.07 11939.15 7.77 12522.67 5.56 11766.015 Years (28-02-2013 to 28-02-2018) 6.79 13889.42 8.49 15029.82 5.84 13283.27Since Inception (30-12-2003 to 28-02-2018) 7.79 28970.00 7.18 26735.52 5.12 20300.60Differentplansshallhaveadifferentexpensestructure.TheperformancedetailsprovidedhereinareofRegularPlan-Growthoption.Past performance may or may not be sustained in future.Returns(in%)arecalculatedonCompoundedAnnualisedBasis(CAGR).$PTP (Point to Point) Returns are based on standard investment of `10,000/-madeatthebeginningofrelevantperiod.Performanceofthedividendoptionfortheinvestorswouldbenetofdividenddistributiontax,asapplicable. Pleasereferpage27forannexureofreturnsforallschememanagedbythefundmanager.
24
Principal Money Manager Fund(An open-ended Money Market scheme)
Date Regular Plan Direct PlanDividend (`/Unit)* Cum Dividend NAV Dividend (`/Unit)* Cum Dividend NAV
Monthly Dividend (Last 3 Months)16-Feb-18 5.5326 1064.3618 6.0822 1064.950817-Jan-18 4.9619 1063.7911 5.5879 1064.456515-Dec-17 4.2935 1063.1227 4.8242 1063.6928Past performance may or may not be sustained in the future. * On face value of `1,000.Note: All Dividend (`/Unit)figuresareGrossDividend.Pursuant payment of dividend, the NAV of Dividend Option of schemes/plans would fall to the extent of payout and statutory levy, if applicable.
Note:EffectiveOctober21,2011freshsubscriptions/switch-ininanymode(includingSystematicInvestmentPlan[SIP]/SystematicTransferPlan[STP])underDaily&WeeklyDividendOptionandPayout&SweepfacilitytoMonthlyDividendOption under the Regular Plan of the Scheme are not available.Thesamemayhoweverbeopenandavailablefor subscriptionatalaterdate.
DataasonFebruary28,2018
Rating Profile (As on February 28, 2018) (% of NAV)
83.40%
8.66%
0.41%
7.53%
0.00% 30.00% 60.00% 90.00%
A1+
A1
Sovereign
Cash & Cash Equivalents
Minimum Investment Amount (`)Lumpsum Special ProductsNew Investor- `5,000 SIP-`2,000Existing Investor- `1,000STP-`1,000 RWP-` 500 6 installments each
Managing Since: January2012Total Experience: 15 years
Expense Ratio# (AsonFebruary28,2018)Direct Plan - 0.44%
Regular Plan - 1.10%`
For NAV details, please refer page 6
Composition By Assets (As on February 28, 2018) (% of NAV)
Commercial Paper 92.06% Treasury Bill 0.41% Cash and Other Assets 7.53%
Name Rating % of NAV
Commercial Paper 92.06
DewanHousingFinanceCorporationLtd. [ICRA]A1+ 9.30
IndiaInfolineHousingFinanceLtd. CRISIL A1+ 8.05
AvanseFinancialServicesLtd. CRISIL A1+ 7.98
KribhcoFertilizersLtd. [ICRA]A1+ 7.96
Cox&KingsLtd. BWRA1+ 7.67
VardhmanSpecialSteelsLtd. CRISIL A1+ 6.77
AlembicPharmaceuticalsLtd. CRISIL A1+ 6.77
APLApolloTubesLtd. CRISIL A1+ 6.77
SudarshanChemicalIndustriesLtd. IND A1+ 6.77
HCLInfosystemsLtd. [ICRA]A1 6.63
IndiabullsHousingFinanceLtd. CRISIL A1+ 5.44
SBICards&PaymentServicesPvt.Ltd. [ICRA]A1+ 5.41
Cox&KingsLtd. BWRA1+ 3.83
HCLInfosystemsLtd. [ICRA]A1 2.03
KribhcoFertilizersLtd. [ICRA]A1+ 0.68
Treasury Bill 0.41
TBILL 323 DAYS 2018 Sovereign 0.41
CBLO / Reverse Repo Investments 7.90
Cash & Cash Equivalents -0.37
Net Assets 100.00
Performance (As on 28/02/2018)
Period Principal Money Manager Fund
CRISIL Liquid Fund Index
(Scheme’s Benchmark)
CRISIL 1 Year T-Bill Index
(Additional Benchmark)Returns
(%)$PTP
ReturnsReturns
(%)$PTP
ReturnsReturns
(%)$PTP
Returns1 Year (28-02-2017 to 28-02-2018) 6.04 10603.67 6.68 10667.99 5.65 10565.423 Years (27-02-2015 to 28-02-2018) 7.52 12435.05 7.36 12380.34 6.96 12242.765 Years (28-02-2013 to 28-02-2018) 8.35 14938.56 8.08 14749.72 7.05 14058.24Since Inception (28-12-2007 to 28-02-2018) 6.77 19477.10 7.55 20973.02 6.43 18861.49Differentplansshallhaveadifferentexpensestructure.TheperformancedetailsprovidedhereinareofRegularPlan-Growthoption.Past performance may or may not be sustained in future.Returns(in%)arecalculatedonCompoundedAnnualisedBasis(CAGR).$PTP (Point to Point) Returns are based on standard investment of `10,000/-madeatthebeginningofrelevantperiod.Performanceofthedividendoptionfortheinvestorswouldbenetofdividenddistributiontax,asapplicable. Pleasereferpage27forannexureofreturnsforallschememanagedbythefundmanager.
25
(An open-ended Fund of Funds scheme)
Asset Under Managment (` Cr) MAAUM:17.39AUM:17.67`
Fund Manager DetailsName: RajatJainManaging Since: March 2004Total Experience: 28 years
Portfolio
Name Industry % of NAV
Units of Mutual Fund / Units Trust 98.86
Principal Global Investors Fund - Emerging Markets Equity Fund Mutual Fund 98.86
CBLO / Reverse Repo Investments 3.08
Cash & Cash Equivalents -1.94
Net Assets 100.00
Performance (As on 28/02/2018)
Period Principal Global Opportunities Growth
MSCI World Net - Total Return Index
(Scheme’s Benchmark)
Nifty 50 - TRI(Additional Benchmark)
^Returns (%)
$PTP Returns
Returns (%)
$PTP Returns Returns (%) $PTP
Returns1 Year (28-02-2017 to 28-02-2018) 29.42 12941.58 14.69 11469.09 19.75 11975.13
3 Years (27-02-2015 to 28-02-2018) 10.75 13593.30 10.18 13383.71 7.21 12327.30
5 Years (28-02-2013 to 28-02-2018) 7.33 14246.66 14.78 19928.55 14.41 19608.54
Since Inception (29-03-2004 to 28-02-2018) 8.36 30615.50 10.33 39329.38 15.17 71471.57
Differentplansshallhaveadifferentexpensestructure.TheperformancedetailsprovidedhereinareofRegularPlan-Growthoption. Past performance may or may not be sustained in future.Returns(in%)arecalculatedonCompoundedAnnualisedBasis(CAGR).$PTP(Point to Point) Returns are based on standard investment of `10,000/-madeatthebeginningofrelevantperiod.Performanceofthedividendoptionfortheinvestorswouldbenetofdividenddistributiontax,asapplicable. ^GrowthOptionPleasereferpage27forannexureofreturnsforallschememanagedbythefundmanager.
Fund Details
Minimum Investment Amount (`)Lumpsum Special ProductsNew Investor- `10,000SIP-`2,000Existing Investor- `1,000STP-`1,000 RWP-` 500 6 installments each
Allotment Date & Benchmark Allotment Date RegularPlan:March29,2004DirectPlan:January2,2013Benchmark: MSCIWorldNetIndex
Plans & Options RegularPlan&DirectPlan.Dividend Frequencies Both the Plans offer Growth&DividendOption.DividendOptionunderboththePlanoffersfacilityofPayout,ReinvestmentandSweep.
Load StructureEntry Load: NILExit Load: If redeemed on or before 1 Year fromthedateofallotment-1%.
Expense Ratio# (AsonFebruary28,2018)Direct Plan - 0.52%Regular Plan - 1.05%
`
Principal Asset Allocation Fund-of-Funds (Conservative Plan)(An open-ended Fund-of-Funds Scheme)
Asset Under Managment (` Cr) MAAUM:2.58AUM:2.52`
Fund Manager DetailsName: RajatJainManaging Since: December 2015Total Experience: 28 years
Fund Details
Minimum Investment Amount (`)Lumpsum Special ProductsNew Investor- `5,000 SIP-`2,000Existing Investor- `1,000STP-`1,000 RWP-` 500 6 installments each
Allotment Date & Benchmark Allotment Date RegularSub-Plan&DirectSub-Plan:December14,2015Benchmark: 15%Nifty50+ 85%CRISILShortTermBondFundIndex
Plans RegularSub-Plan&DirectSub-Plan.Options Both the Sub-Plans offer Growth Option.
Returns (%) Returns (%) Returns (%)1 Year (28-02-2017 to 28-02-2018) 7.64 7.78 -1.45Since Inception (14-12-2015 to 28-02-2018) 8.65 8.93 5.52
Differentplansshallhaveadifferentexpensestructure.TheperformancedetailsprovidedhereinareofRegularPlan-Growthoption.Past performance may or may not be sustained in future.Returns(in%)arecalculatedonCompoundedAnnualisedBasis(CAGR).Performanceofthedividendoptionfortheinvestorswouldbenetofdividenddistributiontax,asapplicable. Pleasereferpage27forannexureofreturnsforallschememanagedbythefundmanager.Above one year performance of Principal Asset Allocation Fund-of-Funds (Conservative Plan) is not given as the scheme have not beeninexistencefor3years.
For NAV details, please refer page 6. Note: # Investors may please note that they will be bearing the expenses of this Scheme in addition to the expenses of the underlying Schemes in which this Scheme makes investment.TotalExpenseRatioisweightedaverageforthemonth.RatioexcludesGSTonmanagementfees.
For NAV details, please refer page 6. Note: # Investors may please note that they will be bearing the expenses of this Scheme in addition to the expenses of the underlying Schemes in which this Scheme makes investment.TotalExpenseRatioisweightedaverageforthemonth.RatioexcludesGSTonmanagementfees.
For NAV details, please refer page 6. Note: # Investors may please note that they will be bearing the expenses of this Scheme in addition to the expenses of the underlying Schemes in which this Scheme makesinvestment.TotalExpenseRatioisweightedaverageforthemonth.RatioexcludesGSTonmanagementfees.
For NAV details, please refer page 6. Note: # Investors may please note that they will be bearing the expenses of this Scheme in addition to the expenses of the underlying Schemes in which this Scheme makes investment.TotalExpenseRatioisweightedaverageforthemonth.RatioexcludesGSTonmanagementfees.
Performance (As on 28/02/2018)
Period Principal Asset Allocation
Fund of Funds - Aggressive Plan
80% Nifty 50 - TRI + 20% CRISIL Short
Term Bond Fund Index (Scheme’s Benchmark)
S&P BSE Sensex - TRI(Additional Benchmark)
Returns (%) Returns (%) Returns (%)1 Year (28-02-2017 to 28-02-2018) 16.48 16.93 20.46
Since Inception (14-12-2015 to 28-02-2018) 14.44 14.97 16.38
Differentplansshallhaveadifferentexpensestructure.TheperformancedetailsprovidedhereinareofRegularPlan-Growthoption.Past performance may or may not be sustained in future.Returns(in%)arecalculatedonCompoundedAnnualisedBasis(CAGR).Performanceofthedividendoptionfortheinvestorswouldbenetofdividenddistributiontax,asapplicable.Pleasereferpage27forannexureofreturnsforallschememanagedbythefundmanager.Above one year performance of Principal Asset Allocation Fund-of-Funds (Aggressive Plan) is not given as the scheme have notbeeninexistencefor3years.
Performance (As on 28/02/2018)
Period Principal Asset Allocation Fund of Funds - Moderate
Plan
40% Nifty 50 - TRI + 60% CRISIL Short
Term Bond Fund Index (Scheme’s Benchmark)
CRISIL 10 Year Gilt Index
(Additional Benchmark)
Returns (%) Returns (%) Returns (%)1 Year (28-02-2017 to 28-02-2018) 11.07 11.30 -1.45
Since Inception (14-12-2015 to 28-02-2018) 10.24 11.25 5.52
Differentplansshallhaveadifferentexpensestructure.TheperformancedetailsprovidedhereinareofRegularPlan-Growthoption.Past performance may or may not be sustained in future.Returns(in%)arecalculatedonCompoundedAnnualisedBasis(CAGR).Performanceofthedividendoptionfortheinvestorswouldbenetofdividenddistributiontax,asapplicable.Pleasereferpage27forannexureofreturnsforallschememanagedbythefundmanager.Above one year performance of Principal Asset Allocation Fund-of-Funds (Moderate Plan) is not given as the scheme havenotbeeninexistencefor3years.
FUNDS MANAGED BY MR. GURVINDER SINGH WASAN (TOTAL SCHEME MANAGED : 3 SCHEMES)Principal Short Term Income Fund 5.41 7.42 8.07 7.73
09-05-2003CRISIL Short Term Bond Fund Index 5.67 7.77 8.49 7.13Principal Credit Opportunities Fund 6.97 8.18 8.31 7.65
14-09-2004CRISIL Liquid Fund Index 6.68 7.36 8.08 7.14Principal Debt Savings Fund 2.00 6.07 6.79 7.79
30-12-2003CRISIL Short Term Bond Fund Index 5.67 7.77 8.49 7.18
FUNDS MANAGED BY MR. RAJAT JAIN (TOTAL SCHEMES MANAGED : 6 SCHEMES)Principal Index Fund - Nifty 18.42 6.14 13.34 11.24
27-07-1999Nifty 50 - TRI 19.75 7.21 14.41 13.39Principal Arbitrage Fund 5.22 NA NA 5.52
21-04-2016CRISIL Liquid Fund Index 6.68 NA NA 6.88Principal Global Opportunities Fund 29.42 10.75 7.33 8.36
29-03-2004MSCIWorldNetTotalReturnIndex 14.69 10.18 14.78 10.33Principal Asset Allocation Fund-of-Funds (Conservative Plan) 7.64 NA NA 8.65
14-12-201515%Nifty50-TRI+ 85%CRISILShortTermBondFundIndex 7.78 NA NA 8.93
Principal Asset Allocation Fund-of-Funds (Aggressive Plan) 16.48 NA NA 14.44
14-12-201580%Nifty50-TRI+ 20%CRISILShortTermBondFundIndex 16.93 NA NA 14.97
Principal Asset Allocation Fund-of-Funds (Moderate Plan) 11.07 NA NA 10.24
14-12-201540%Nifty50-TRI+ 60%CRISILShortTermBondFundIndex 11.30 NA NA 11.25
FUNDS MANAGED BY MS. BEKxY KURIAKOSE (TOTAL SCHEMES MANAGED : 3 SCHEMES)Principal Balanced Fund (Debt Portion) 24.85 13.56 18.21 11.77
14-01-2000CRISIL Hybrid 35+65 - Aggressive Index** 14.71 8.96 13.72 NAPrincipal Dynamic Bond Fund 3.18 6.58 7.54 7.44
09-05-2003CRISIL Composite Bond Fund Index 4.25 7.60 8.26 6.55Principal SMART Equity Fund (Debt Portion) 8.18 5.52 12.50 9.86
16-12-2010CRISIL Hybrid 35+65 - Aggressive Index** 14.71 8.96 13.72 10.05PrincipalArbitrageFundwaslaunchedon21stApr2016andisyettocomplete3years&5yearsofperformance.PrincipalAssetAllocationFund-of-Funds(ConservativePlan,AggressivePlan&ModeratePlan)waslaunchedon14thDec2015andisyettocomplete3years&5yearsofperformance.Differentplansshallhaveadifferentexpensestructure.TheperformancedetailsprovidedhereinareofRegularPlan-Growthoption. Past performance may or may not be sustained in future. Returns(in%)arecalculatedonCompoundedAnnualisedBasis(CAGR). Performanceofthedividendoptionfortheinvestorswouldbenetofdividenddistributiontax,asapplicable.Mr.DhimantShahmanagesPrincipalEmergingBluechipFund(w.e.f.June2011),PrincipalLargeCapFund(w.e.f.July2017)andPrincipalDividendYieldFund(w.e.f.December2011)Mr.P.V.K.MohanmanagesPrincipalGrowthFund(w.e.f.September2010),PrincipalTaxSavingsFund(w.e.f.September2010),PrincipalPersonalTaxSaverFund(w.e.f.July2017),PrincipalSMARTEquityFund-EquityPortion(w.e.f.July2017),PrincipalBalancedFund(w.e.f.May2010)andPrincipalEquitySavingsFund-EquityPortion(w.e.f.June2016)Mr.PankajJainmanagesPrincipalCashManagementFund(w.e.f.January2012),PrincipalLowDurationFund(w.e.f.January2012),PrincipalMoneyManagerFund(w.e.f.January2012)andPrincipalEquitySavingsFund-DebtPortion(w.e.f.January01,2018)Mr.GurvinderSinghWasanmanagesPrincipalShortTermIncomeFund(w.e.f.April2011),PrincipalCreditOpportunitiesFundandPrincipalDebtSavingsFund(w.e.f.January01,2018)Mr.RajatJainmanagesPrincipalIndexFund-Nifty(w.e.f.August2015),PrincipalArbitrageFund(w.e.f.April2016),PrincipalGlobalOpportunitiesFund(w.e.f.March2004)andPrincipalAssetAllocationFund-of-Funds(ConservativePlan-AggressivePlan-ModeratePlan)(w.e.f.December2015)Ms.BekxyKuriakosemanagesPrincipalBalancedFund-DebtPortion(w.e.f.Mar2016),PrincipalDynamicBondFund(w.e.f.January2013),andPrincipalSMARTEquityFund-DebtPortion(w.e.f.January01,2018)*PrincipalLargeCapFund-AsTRIdataisnotavailablesinceinceptionofthescheme,benchmarkperformanceiscalculatedusingcompositeCAGRofS&PBSE100IndexPRIvaluesfromdate11-11-2005to29-06-2007and TRI values since 29-06-2007^PrincipalGrowthFund-AsTRIdataisnotavailablesinceinceptionofthescheme,benchmarkperformanceiscalculatedusingcompositeCAGRofS&PBSE200IndexPRIvaluesfromdate25-10-2000to29-06-2007and TRI values since 29-06-2007#PrincipalTaxSavingsFund-AsTRIdataisnotavailablesinceinceptionofthescheme,benchmarkperformanceiscalculatedusingcompositeCAGRofS&PBSE200IndexPRIvaluesfromdate31-03-1996to29-06-2007 and TRI values since 29-06-2007$PrincipalPersonalTaxSaverFund-AsTRIdataisnotavailablesinceinceptionofthescheme,benchmarkperformanceiscalculatedusingcompositeCAGRofS&PBSE100IndexPRIvaluesfromdate31-03-1996to29-06-2007 and TRI values since 29-06-2007** The equity component of CRISIL Hybrid 35+65 - Aggressive Index is represented by total returns variant of S&P BSE 200
29
Official Point of Acceptance (OPA) / Investor Service Centres (ISC)
Principal Pnb Asset Management Company Private Limited - OPA & ISC:
Points of Service (“POS”) of MF UTILITIES INDIA PRIVATE LIMITED (“MFUI”) as Official Point of Acceptance:
The Online Transaction Portal of MF Utility is www.mfuonline.com and the list of POS of MFUI is published on the website of MFUI at www.mfuindia.com,asupdatedfromtimetotime.