Page 1
Payment Reform in Support of
Population Health Management
Charles Chodroff, MD, MBA, FACP
Senior Vice President, Chief Clinical Officer
WellSpan Health
Aligning Forces for Quality
Employers - Providers Summit
October 25, 2011
Page 2
Overview of discussion
• Moving from volume-based to value-based
healthcare delivery (Accountable Care)
• WellSpan’s Population Health strategy. Managing
the health of our own employee population.
• Moving beyond fee-for-service provider payments to
enhance the value of healthcare.
• Engaging the employer community in value-creation
health management strategies
2
Page 3
3
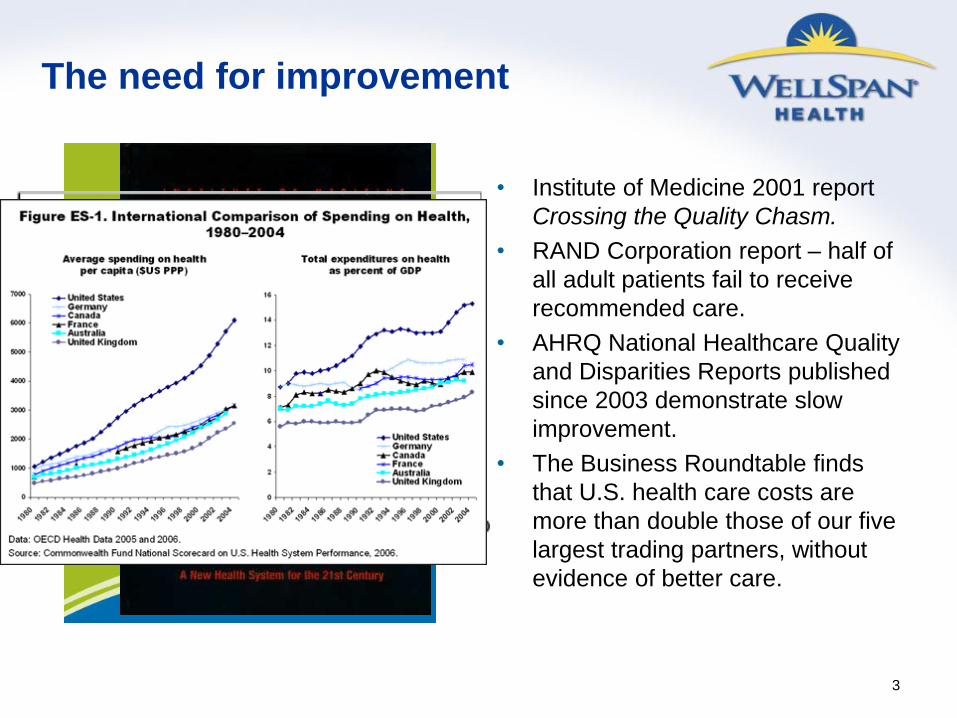
The need for improvement
• Institute of Medicine 2001 report
Crossing the Quality Chasm.
• RAND Corporation report – half of
all adult patients fail to receive
recommended care.
• AHRQ National Healthcare Quality
and Disparities Reports published
since 2003 demonstrate slow
improvement.
• The Business Roundtable finds
that U.S. health care costs are
more than double those of our five
largest trading partners, without
evidence of better care.
Page 4
4
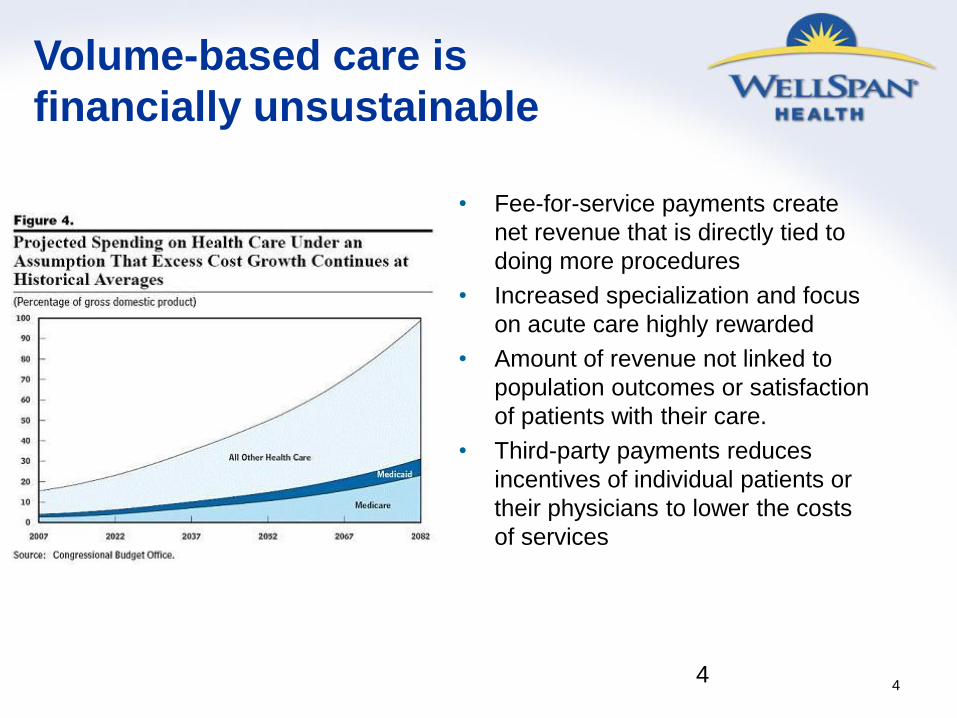
Volume-based care is
financially unsustainable
• Fee-for-service payments create
net revenue that is directly tied to
doing more procedures
• Increased specialization and focus
on acute care highly rewarded
• Amount of revenue not linked to
population outcomes or satisfaction
of patients with their care.
• Third-party payments reduces
incentives of individual patients or
their physicians to lower the costs
of services
4
Page 5
Value-Based Healthcare
5
Value = Outcomes
Cost
Page 6
Three Drivers of Healthcare Value
Benefit Plan design
What’s paid for and
how costs are
shared with
employees
Delivery System Design
How services are
provided to minimize
waste
Continuous improvement
Provider Payment Structure
How providers are paid
creates incentives for
delivery and design of
services
6
Page 7
7
Members Dollars
>$20,000 4% 49%
to $20,000 6% 17%
to $10,000 9% 13%
to $5,000 13% 10%
to $2,500 19% 7%
<$1,000 49% 4%
0%
10%
20%
30%
40%
50%
60%
70%
80%
90%
100%
WellSpan Health Claims Paid (1/1/10 – 12/31/10 by member and dollars)
Page 8
8
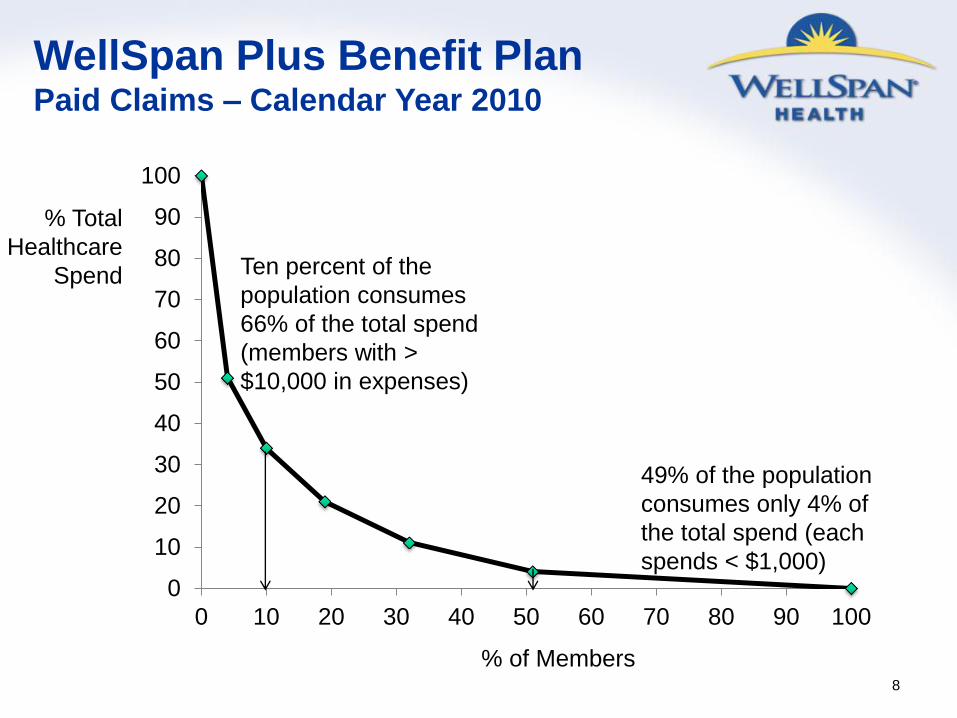
WellSpan Plus Benefit Plan Paid Claims – Calendar Year 2010
0
10
20
30
40
50
60
70
80
90
100
0 10 20 30 40 50 60 70 80 90 100
% Total
Healthcare
Spend
% of Members
Ten percent of the
population consumes
66% of the total spend
(members with >
$10,000 in expenses)
49% of the population
consumes only 4% of
the total spend (each
spends < $1,000)
Page 9
9
0
10
20
30
40
50
60
70
80
90
100
0 10 20 30 40 50 60 70 80 90 100
% Total
Healthcare
Spend
% of Members
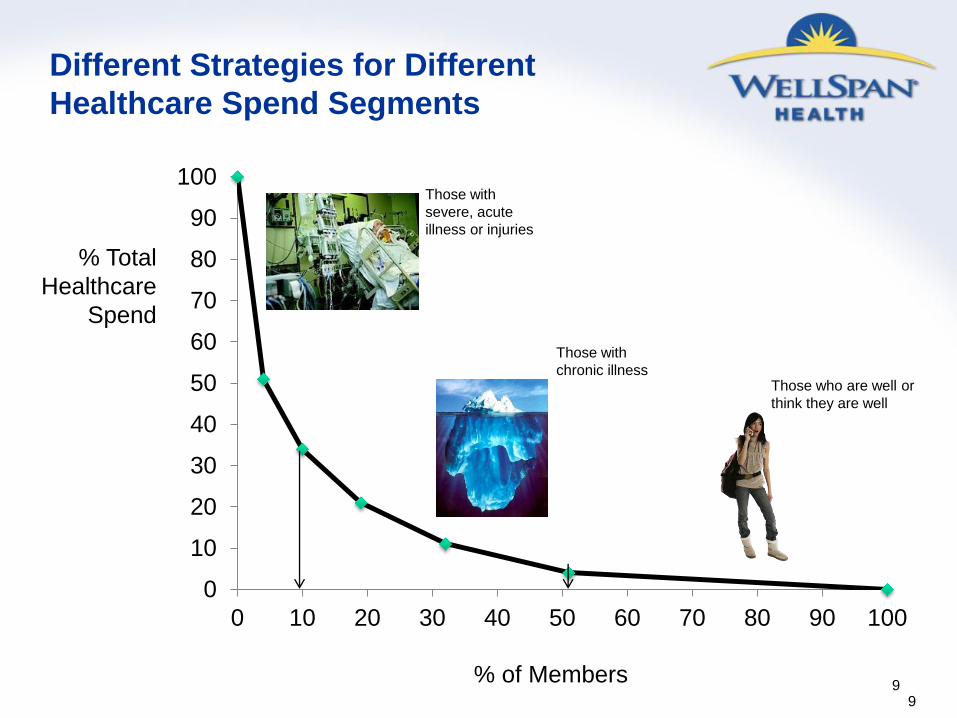
Different Strategies for Different
Healthcare Spend Segments
Those who are well or
think they are well
Those with
chronic illness
Those with
severe, acute
illness or injuries
9
Page 10
10
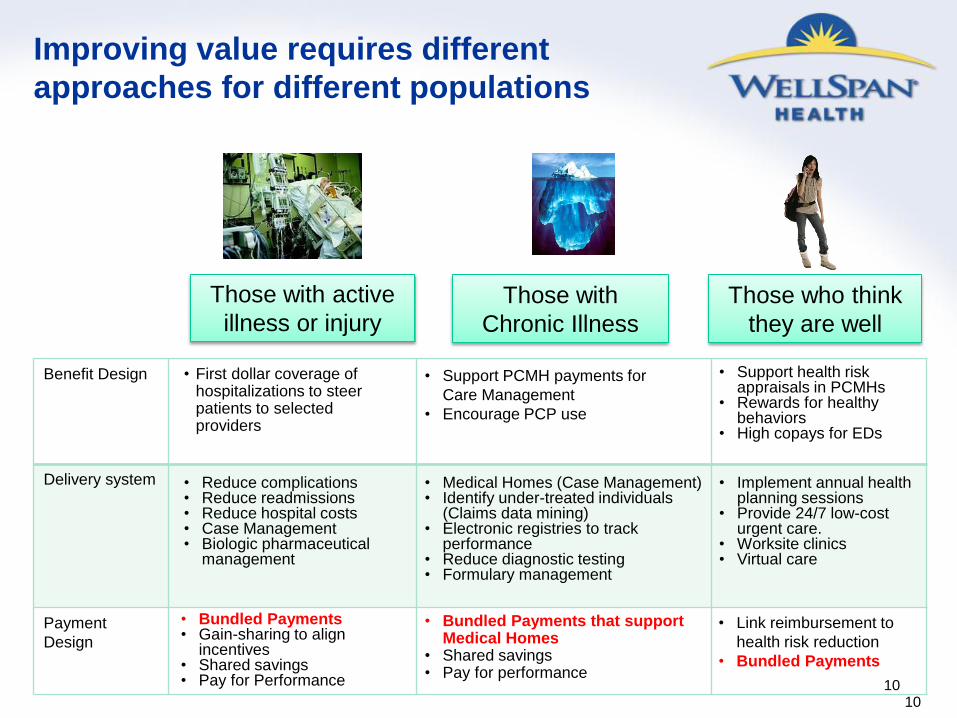
Improving value requires different
approaches for different populations
Those who think
they are well
Those with
Chronic Illness
Those with active
illness or injury
Benefit Design
Delivery system
Payment
Design
• First dollar coverage of hospitalizations to steer patients to selected providers
• Support PCMH payments for
Care Management
• Encourage PCP use
• Support health risk appraisals in PCMHs
• Rewards for healthy behaviors
• High copays for EDs
• Reduce complications • Reduce readmissions • Reduce hospital costs • Case Management • Biologic pharmaceutical
management
• Implement annual health planning sessions
• Provide 24/7 low-cost urgent care.
• Worksite clinics • Virtual care
• Medical Homes (Case Management) • Identify under-treated individuals
(Claims data mining) • Electronic registries to track
performance • Reduce diagnostic testing • Formulary management
• Bundled Payments that support Medical Homes
• Shared savings • Pay for performance
• Link reimbursement to
health risk reduction
• Bundled Payments
• Bundled Payments • Gain-sharing to align
incentives • Shared savings • Pay for Performance
10
Page 11
11
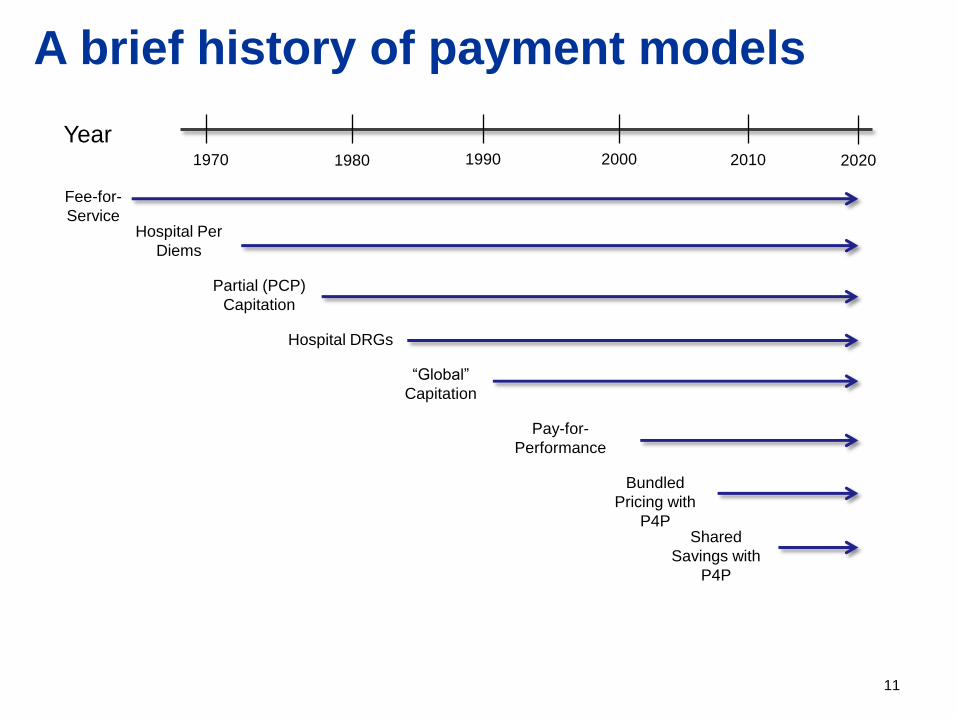
A brief history of payment models
Fee-for-
Service
1970 1980 1990 2000 2010 2020
Hospital Per
Diems
Partial (PCP)
Capitation
Hospital DRGs
“Global”
Capitation
Pay-for-
Performance
Bundled
Pricing with
P4P Shared
Savings with
P4P
Year
Page 12
12
Three forms of risk assumption
Actuarial Risk
The risk that
something unplanned
will happen that will
incur liability for an
obligated party
Utilization Risk
The risk that a
provider will use more
resources than
absolutely necessary
to treat a condition
Performance Risk
The risk that a
provider will cause a
mishap or fail to
perform a necessary
process of care
Page 13
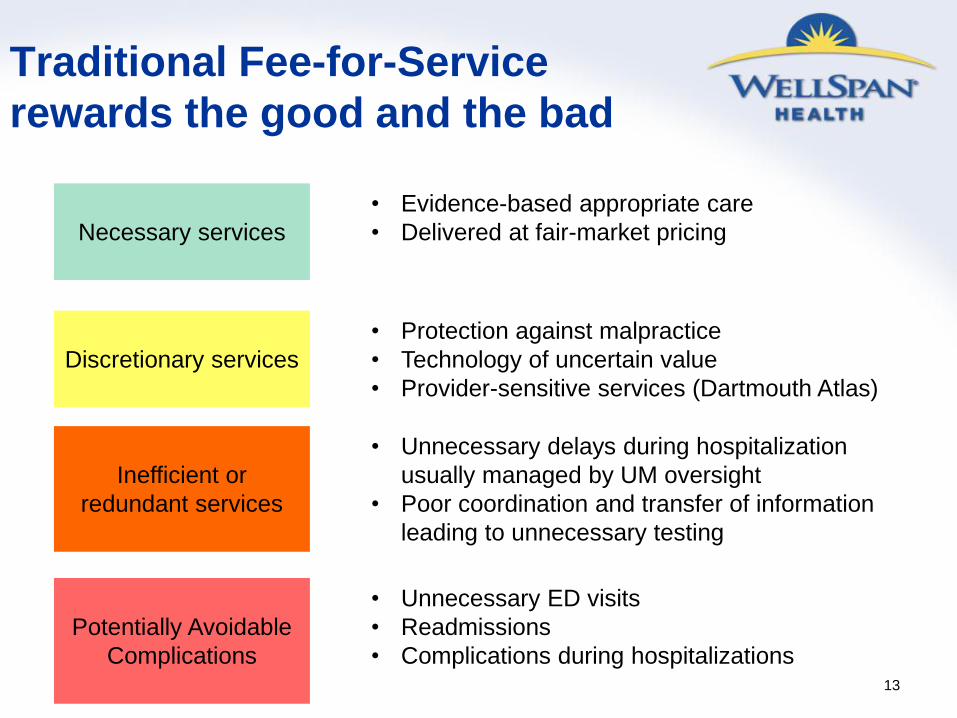
Traditional Fee-for-Service
rewards the good and the bad
13
Necessary services
Discretionary services
Inefficient or
redundant services
• Evidence-based appropriate care
• Delivered at fair-market pricing
• Protection against malpractice
• Technology of uncertain value
• Provider-sensitive services (Dartmouth Atlas)
• Unnecessary delays during hospitalization
usually managed by UM oversight
• Poor coordination and transfer of information
leading to unnecessary testing
Potentially Avoidable
Complications
• Unnecessary ED visits
• Readmissions
• Complications during hospitalizations
Page 14
14
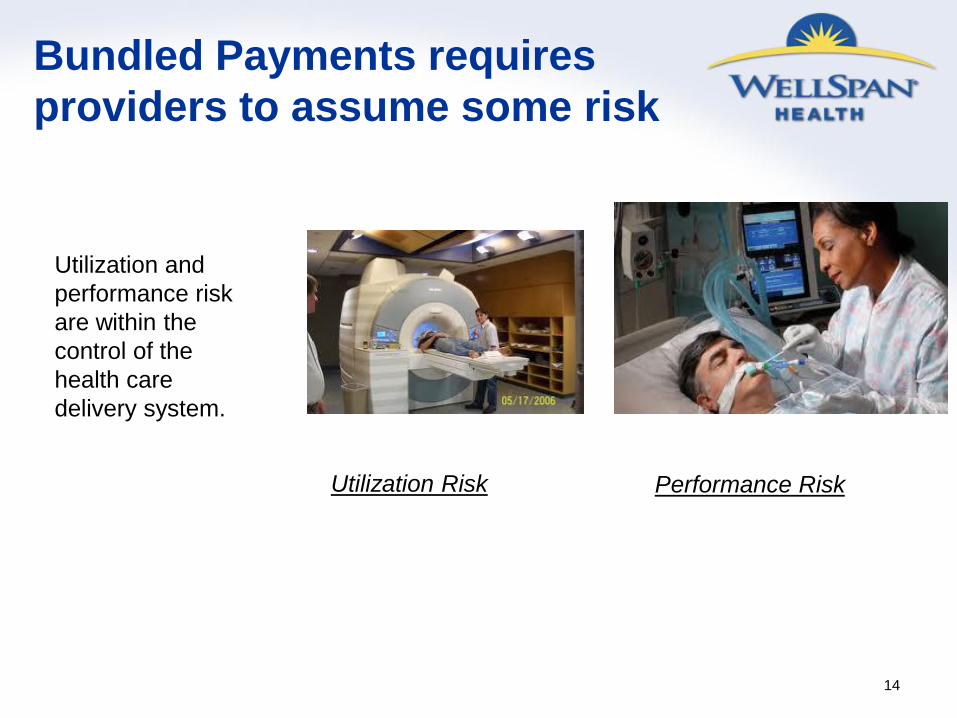
Bundled Payments requires
providers to assume some risk
Utilization Risk Performance Risk
Utilization and
performance risk
are within the
control of the
health care
delivery system.
Page 15
15
Relation of Payment Methodology
to Provider Risk Assumption
Payment
Methodology
Actuarial
Risk
Utilization
Risk
Performance
Risk
Provider
Alignment
Fee-for-
service
Payor Payor Payor None
Pay for
Performance
Payor Payor Provider Unlikely
Per
diems/DRGs
Payor Provider Provider None
Bundled
Payments
Payor Provider Provider Potential
Global
Capitation Provider Provider Provider Substantial
Page 16
Bundled Payments for Acute Illness
and Injury
16
Page 17
17
Bundled Pricing for Acute Care
• A fixed payment that covers all of the associated costs for
the treatment of condition or performance of a procedure.
• Time-delimited
• Includes the cost of all associated complications for a fixed
period of time. Excludes unrelated services.
• Severity adjustments improve fairness of payment
• Achievement of quality thresholds influences total payment
Page 18
An hospital procedure Bundle
18
Pre-hospitalization • Pre-operative testing
Hospitalization • Inpatient hospital charges
• All professional services including
attending physician or surgeon,
anesthesia, consultants
Post-hospitalization • Home care services
• Skilled-nursing facility
• ED visits
• Care Management
• Follow-up office visits
• Related readmissions
• Treatment of related complications
90 Days
Post-Bundle Charges • Billed as Fee-for-Service
or part of a new Bundle
Unrelated charges
billed separately as
fee-for-service
Page 19
19
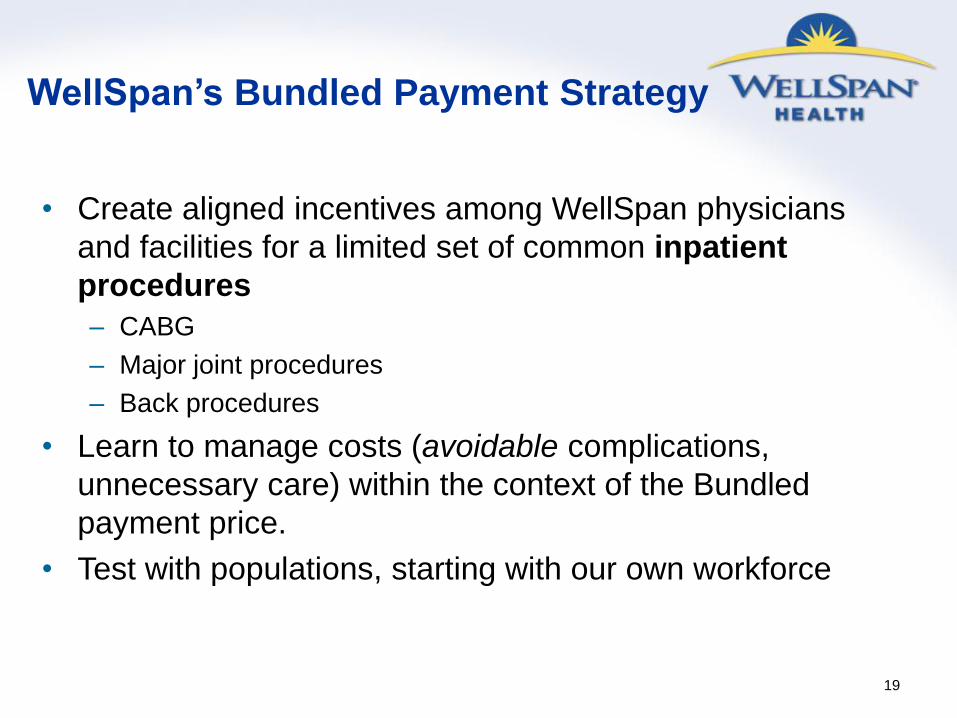
WellSpan’s Bundled Payment Strategy
• Create aligned incentives among WellSpan physicians
and facilities for a limited set of common inpatient
procedures
– CABG
– Major joint procedures
– Back procedures
• Learn to manage costs (avoidable complications,
unnecessary care) within the context of the Bundled
payment price.
• Test with populations, starting with our own workforce
Page 20
20
Requirements for Bundled Pricing
• An economic and clinically integrated group of providers who can
accept and manage the risk of bundled pricing.
– Financial strength to weather downside risk
– Performance improvement infrastructure
• An internal payment system that shares appropriate risk and
reward among various caregivers to align incentives.
• A Bundling Methodology that precisely defines the terms of the
bundle including:
– Price
– Risk sharing between payer and provider group
– Included and excluded services
– Quality metrics
Page 21
21
The PROMETHEUS Payment Model
• Development began in 2006
• Funded by The Commonwealth Fund, Robert
Wood Johnson Foundation
• Based on unique definition of episodes and
“gain-sharing” model built into Evidence-
Informed Case Rates (ECRs)
• Multiple pilot projects underway throughout the
country
Page 22
22
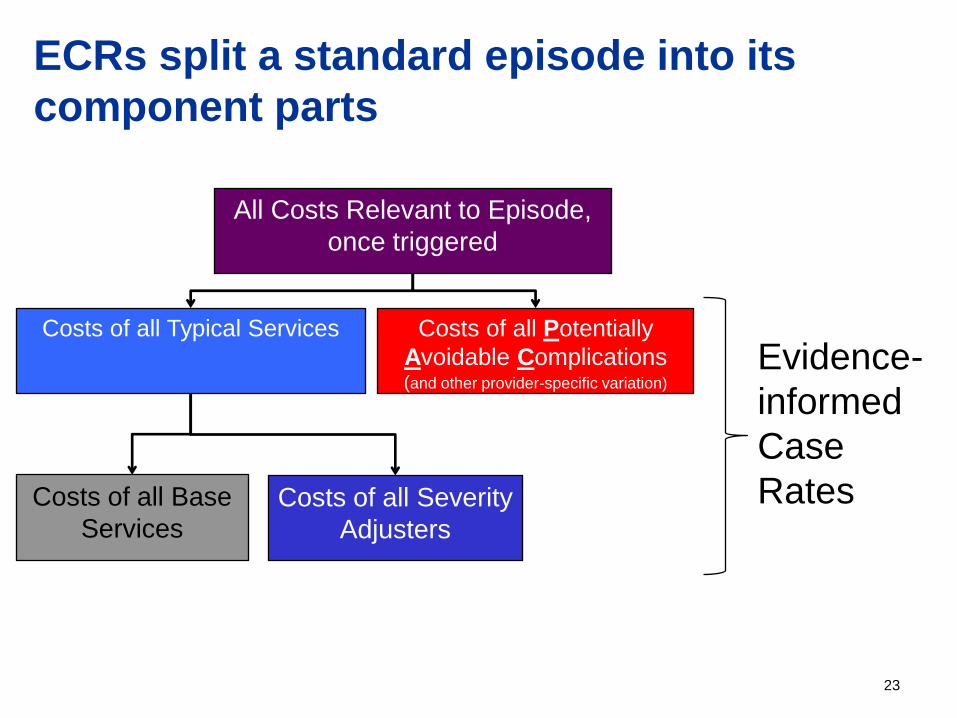
PROMETHEUS Evidence-
Informed Case Rates
• Patient-centered episodes of care for the treatment of
an illness or condition, severity adjusted to that patient.
• The payment rate includes all covered services related
to the care of the condition as determined by medically
accepted clinical practice guidelines.
• Built to identify costs of “typical” services, or the
payments for the essential services of the procedure or
treatment of the condition. These are distinct from
services associated with Potentially Avoidable
Complications (PACs)
Page 23
23
ECRs split a standard episode into its
component parts
All Costs Relevant to Episode,
once triggered
Evidence-
informed
Case
Rates
Costs of all Typical Services Costs of all Potentially
Avoidable Complications (and other provider-specific variation)
Costs of all Base
Services Costs of all Severity
Adjusters
Page 24
Implementing a Bundled Payment Pilot
Page 25
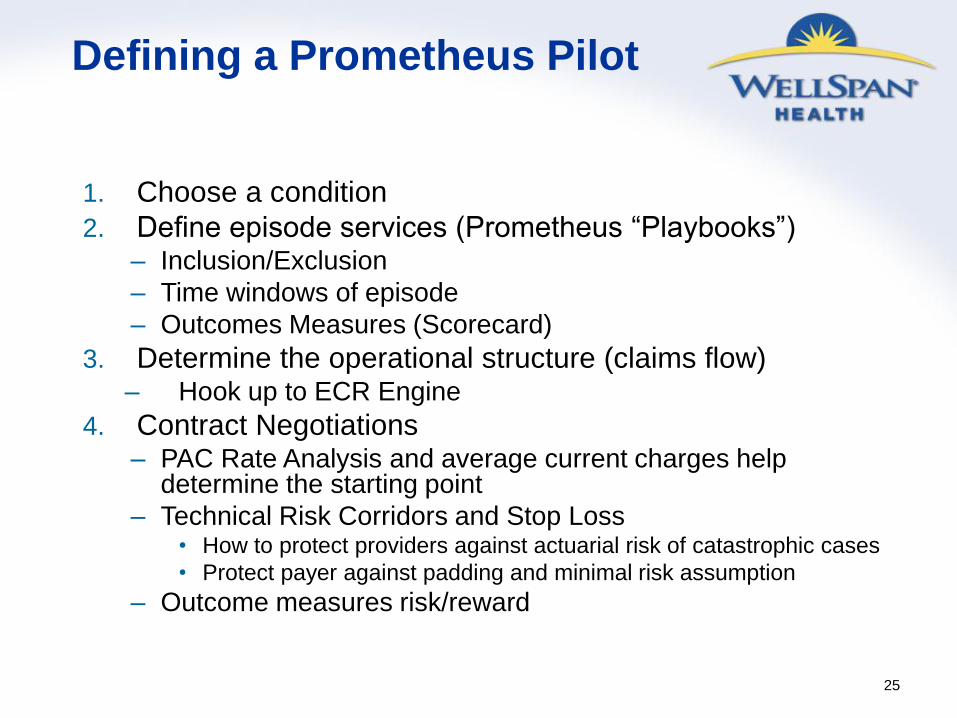
25
Defining a Prometheus Pilot
1. Choose a condition
2. Define episode services (Prometheus “Playbooks”) – Inclusion/Exclusion
– Time windows of episode
– Outcomes Measures (Scorecard)
3. Determine the operational structure (claims flow) – Hook up to ECR Engine
4. Contract Negotiations – PAC Rate Analysis and average current charges help
determine the starting point
– Technical Risk Corridors and Stop Loss • How to protect providers against actuarial risk of catastrophic cases
• Protect payer against padding and minimal risk assumption
– Outcome measures risk/reward
Page 26
26
Inclusion and Exclusion Criteria
The PROMETHEUS “Playbook” defines those
ICD9 and CPT-4 codes that are either
complications (included) or unrelated
(excluded)
CABG
Procedure
All Claims
During Episode
Duration
Typical Services
(Included) Complications (Included)
Unrelated Services
(Excluded)
Page 27
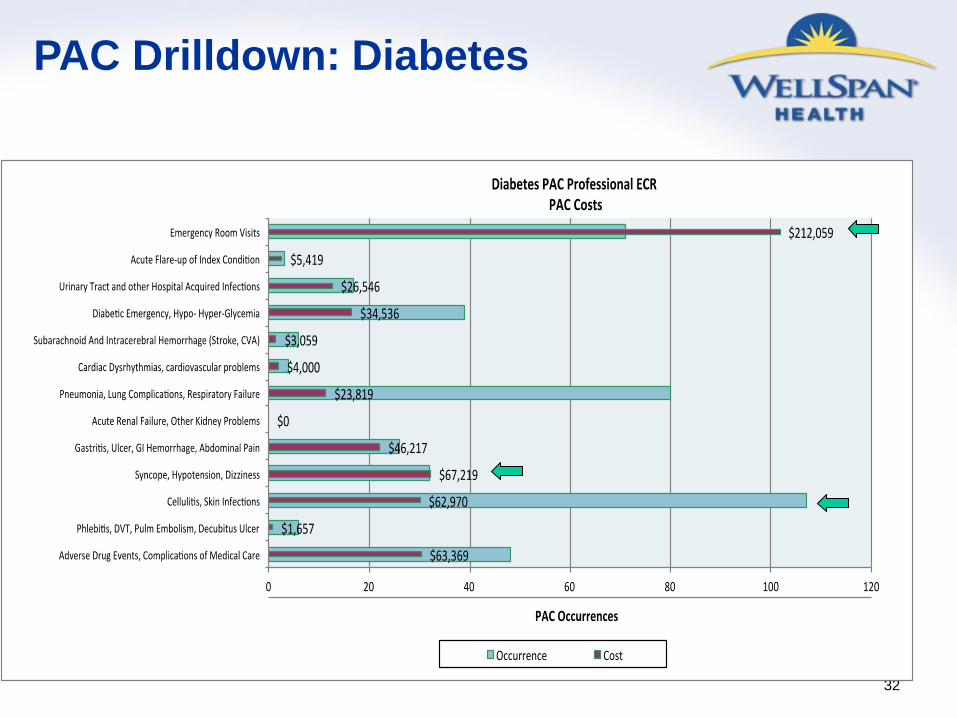
27
Reducing Potentially Avoidable
Complications (PACs) is the Primary
Driver of Patient (and Payer) Value
Page 28
28
Not just for procedures
Type of ECR Trigger Time Window ECRs
Chronic Medical Outpatient
Professional One year from trigger
Diabetes, CHF, COPD,
Asthma, CAD, HTN, GERD
Acute
Medical Inpatient Facility
0-day look-back;
30-day look-forward AMI, Stroke, Pneumonia
Inpatient
Procedural
Inpatient Facility/
Professional
30-day look-back;
180-day look-forward
Hip or Knee Replacement,
CABG, Bariatric Surgery,
Colon Resection
Outpatient
Procedural
Outpatient
Facility/
Professional
30-day look-back;
180-day look-forward
7-day, 30-day
9 months, 2 months
Angioplasty (PCI), Knee
arthroscopy, Hysterectomy,
Cholecystectomy,
Colonoscopy,
Pregnancy & Delivery
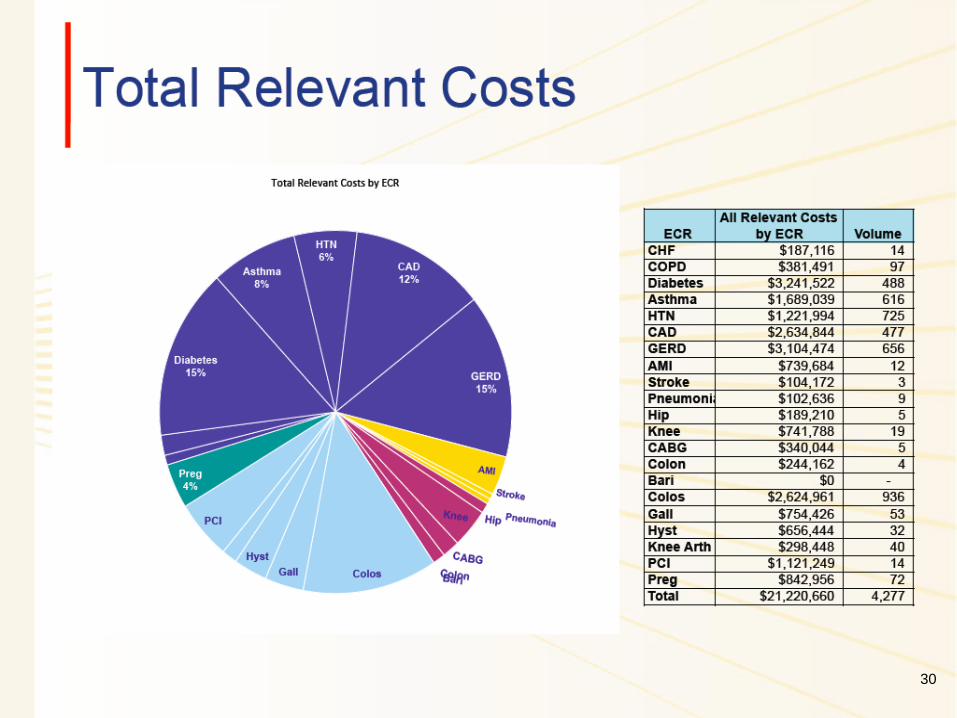
Page 29
29
SCP Data Analysis
Data analyzed and limitations
• WellSpan Plus and Hanover Hospital members
• Date Range: 5/1/2009- 4/30/2011
– Number of Records: 1,477,677
– Number of Unique Patients: 21,109
– Allowed Amounts: $214,449,890
• Limitations of Analysis:
– Small numbers of Acute Medical, Inpatient Procedural ECRs
(<30 relevant patients)
– # Relevant Patients per practice location also <30 for most –
unable to do this level of analysis even for chronic ECRs
Page 31
31
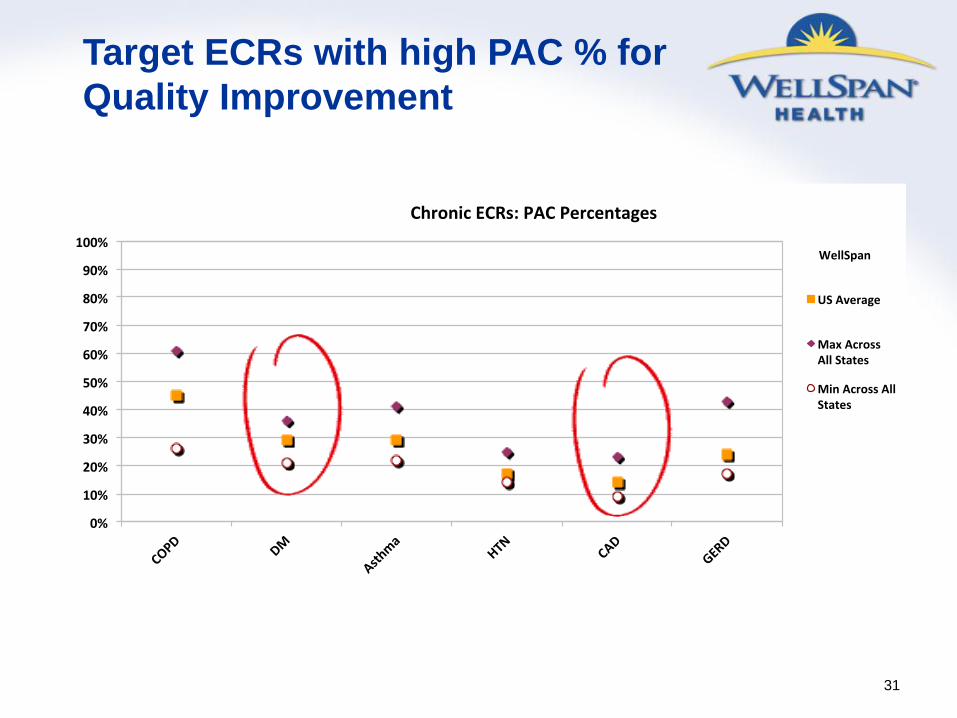
Target ECRs with high PAC % for
Quality Improvement
0%
10%
20%
30%
40%
50%
60%
70%
80%
90%
100%
COPD
DM
Asthma
HTN
CAD
GERD
ChronicECRs:PACPercentages
WellSpan
USAverage
MaxAcrossAllStates
MinAcrossAllStates
Page 32
32
PAC Drilldown: Diabetes
Page 33
Bundled Payments Can
Reduce Costs
• Set a budget for the bundle that
eliminates payment for a small portion
of the PACs
• This aligns providers around reducing
Potentially Avoidable Complications
33
Page 34
Payment Reform for Chronic Illness
34
Page 35
35 35
Improving value requires different
approaches for different populations
Those who think
they are well
Those with
Chronic Illness
Those with active
illness or injury
Benefit Design
Delivery system
Payment
Design
• First dollar coverage of hospitalizations to steer patients to selected providers
• Support PCMH payments for
Care Management
• Encourage PCP use
• Support health risk appraisals in PCMHs
• Rewards for healthy behaviors
• High copays for EDs
• Reduce complications • Reduce readmissions • Reduce hospital costs • Case Management • Biologic pharmaceutical
management
• Implement annual health planning sessions
• Provide 24/7 low-cost urgent care.
• Worksite clinics • Virtual care
• Medical Homes (Case Management) • Identify under-treated individuals
(Claims data mining) • Electronic registries to track
performance • Reduce diagnostic testing • Formulary management
• Bundled Payments that support Medical Homes
• Shared savings • Pay for performance
• Link reimbursement to
health risk reduction
• Bundled Payments
• Bundled Payments • Gain-sharing to align
incentives • Shared savings • Pay for Performance
Page 36
Patient Centered Medical
Homes Value Proposition
• Increased access to care
• Better coordination
• Better chronic disease management
• Using ancillary staff to the “top of their
licenses.”
• Results
– Reduced ED visits
– Reduced hospitalizations 36
Page 37
Significant Benefit from
Medical Home Models
37
Central Aims of Medical Home Model
Comprehensive
Care
Patient
Engagement
Enhanced Access Coordinated Care
Percent Change in Hospitalizations
Resulting from Medical Home Models
Geisinger Health System
Genesee Health Plan
HealthPartners Medical
Group
Community Care of
North Carolina
(14%)
(15%)
(24%)
(40%) Successful implementation of a Medical
Home model in a primary care practice
requires extensive upgrading of staff skills
and investments in care management
services.
Page 38
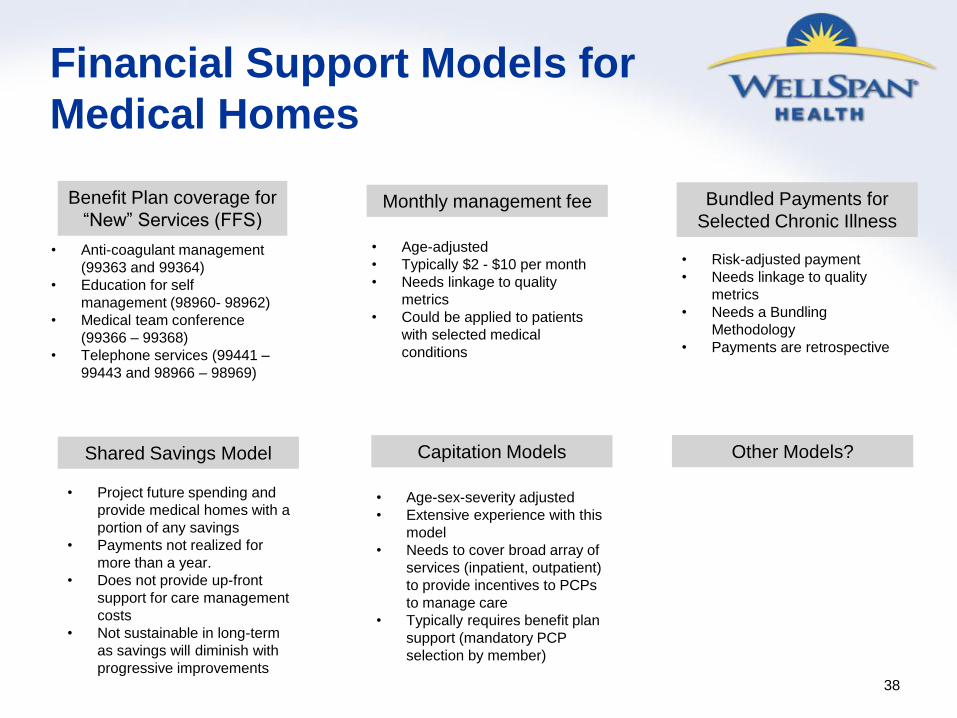
Financial Support Models for
Medical Homes
38
Benefit Plan coverage for
“New” Services (FFS)
• Anti-coagulant management
(99363 and 99364)
• Education for self
management (98960- 98962)
• Medical team conference
(99366 – 99368)
• Telephone services (99441 –
99443 and 98966 – 98969)
Monthly management fee
• Age-adjusted
• Typically $2 - $10 per month
• Needs linkage to quality
metrics
• Could be applied to patients
with selected medical
conditions
Bundled Payments for
Selected Chronic Illness
• Risk-adjusted payment
• Needs linkage to quality
metrics
• Needs a Bundling
Methodology
• Payments are retrospective
Shared Savings Model
• Project future spending and
provide medical homes with a
portion of any savings
• Payments not realized for
more than a year.
• Does not provide up-front
support for care management
costs
• Not sustainable in long-term
as savings will diminish with
progressive improvements
Capitation Models
• Age-sex-severity adjusted
• Extensive experience with this
model
• Needs to cover broad array of
services (inpatient, outpatient)
to provide incentives to PCPs
to manage care
• Typically requires benefit plan
support (mandatory PCP
selection by member)
Other Models?
Page 39
Conclusions
• Enhancing value in healthcare requires movement
away from fee-for-service payments to providers
• New models of payment must support care
management activities that reduce unnecessary
services.
• Providers seek financial incentives to migrate from
the current model
• Change requires alignment of benefit plans
• Beneficiaries need information to select the higher
value providers who can better coordinate their care
and assure better quality 39