44
PBS Surveys Manual A. Todd, J. Boland, R. Horner, and G. Sugai June 2009 www.pbssurveys.org

PBS Surveys Manual
A. Todd, J. Boland, R. Horner, and G. SugaiJune 2009
www.pbssurveys.org

Acknowledgements
PBS Surveys has been supported through Grant # H326S030002 As a result of federal assistance, there is no financial cost to schools for using PBS Surveys.
Each of the surveys is copyrighted, and thanks go to the following authors:
Self-Assessment Survey, version 2.0, 2003, Sugai, Horner, ToddTeam Implementation Checklist, version 2.2, 2002, Sugai,
Horner, Lewis-PalmerSchool Safety Survey, version 2.0, 2002 Sprague, Colvin, IrvinSchool-wide Evaluation Tool, version 2.1, 2005, Sugai, Lewis-
Palmer, Todd, & HornerBenchmarks of Quality, Kincaid, Childs & George, 2005
The online surveys were beta-tested by schools in Eugene, Bethel, and Springfield, Oregon, and by schools in New Mexico. Thank you to the PBS Coordinators in those states for working with us to make the online surveys user-friendly. This includes Celeste Rossetto Dickey, Jim Watson, Rob Bressi, Dale Myers, Carlos Romero, and Jody Esperanza.
Thanks goes to Megan Cave and Katie Conley of the University of Oregon for their editing and formatting skills.
Browser compatibility
One of the following web browsers: Internet Explorer 7.0 or higher, Safari 2.0 or higher, Firefox 2.0 or higher
Table of Contents
Acknowledgements 2Browser compatibility 2Introduction 1
Part 1: Overview 2Login Types and Procedures 2Menus and Navigation 2Survey Response Forms 3Page Links 3Generating Reports 3Exporting Survey Data 3
Part 2: PBS Surveys Respondents 3Part 3: PBS Surveys Coordinator 4
Obtaining a Coordinator Account 4Account/Survey Management 4Managing School Accounts 5Adding School Accounts 5Creating a New School Survey Account 6Survey Management 6Status Reports 7
Survey Download 9View Survey Data 9Survey Scores 9
Part 4: School Safety Survey 10Completing the School Safety Survey 10Generating School Safety Survey Reports 11Individual Respondent Reports 11Comparative Yearly Summaries 12
Part 5: Self-Assessment Survey 13Completing the Self-Assessment Survey 13Generating Self-Assessment Survey Reports 14Individual School Summary Report 14Comparative Summaries Report 15Analysis of School-Wide System Report 15Individual Item Report 16Coordinators 16

Part 6: Team Implementation Checklist 18Completing the TIC 18Generating TIC Reports 19Implementation by Feature 19Overall Implementation 20
Part 7: Benchmarks of Quality 21Scoring the BoQ 21Data Entry 22Generating BoQ Reports 22Overall Scores Report 23Elements Report 24
Part 8: School-wide Evaluation Tool 25SET Overview 25Features of the SET 25Data Sources used for the SET 26Scoring Guide 26Data Entry 26Generating SET Reports 26
Part 9: Developing a PBS Annual Action Plan 28Positive Behavior Support Annual Planning 29Positive Behavior Support Annual Planning Guide 30PBS Action Plan for Getting Started 31PBS Annual Action Plan for Sustainability 33
Part 10: Coordinator Forms 34Local Coordinator Information Form 34
Part 11: Frequently Asked Questions 38Part 12: Technical Support 40
Registration 40Technical Support 40Accounts Management 40Coordination Support 40Researcher Support 40

A.W. Todd, J. Boland, R. Horner, University of Oregon; George Sugai, University of ConnecticutJune, 2009
1
Introduction
The PBS Surveys web site is intended to be used by school staff under the guidance of their school PBS team using the Team Checklist, the Self-Assessment Survey, the Benchmarks of Quality, the School-wide Evaluation Tool and/or the School Safety Survey for evaluation of their School-wide Posi-tive Behavior Support (PBS) efforts.
This manual is not intended to teach about PBS. It teaches how to use the online survey website for data entry and reporting of surveys useful for making decisions toward building positive learning environments in schools. Currently, these surveys include the Team Checklist, the Self-Assessment Survey, the School Safety Survey and the Benchmarks of Quality Survey.
This manual is organized into eight parts:1. An Overview of PBS Surveys : Login, Navigation, and Registration. 2. PBS Surveys Respondent: Surveys and reports available, Locate PBS Surveys
Coordinator. 3. PBS Surveys Coordinator: Obtain Coordinator Account, Account Management,
Status Reports, and Survey Download. 4. The School Safety Survey: Purpose of the survey, Entering School Safety Survey
data, and Generating reports and charts. 5. The Self-Assessment Survey: Purpose of the survey, Entering Self-Assessment
Survey data, and Generating reports and charts. 6. The Team Implementation Checklist: Purpose of the Survey, Entering TIC data, and
Generating reports and charts. 7. The Benchmarks of Quality Survey: Purpose of the survey and understanding the
reports and charts. The PBS Surveys Coordinator generates the BoQ reports.8. The School-wide Evaluation Tool: Purpose of the survey and understanding the
reports and charts. The PBS Surveys Coordinator generates the SET reports.9. PBS Annual Action Planning Guide: Provides a step by step, annual checklist of
features in place across intervention levels and an Action Planning format for Getting Started and for Sustainability
10. Coordinator Forms11. Frequently Asked Questions12. Technical Assistance: Provides contact information and instructions for getting help
and reporting problems.Each of the surveys provides information on a regular basis (monthly, quarterly, and annually depend-ing on the survey) for decision making about school-wide PBS efforts. Each survey report is useful when looked at in isolation as well as when combined with other data sources available to the team.

A.W. Todd, J. Boland, R. Horner, University of Oregon; George Sugai, University of ConnecticutJune, 2009
2
Part 1: Overview
Login Types and Procedures In order to access the PBS Surveys data entry forms, reports, and charts, you must login. To log in to your account, click on “Login” on the PBS Surveys homepage (www.pbssurveys.org). On the Login page, two types of login are available: respondent and coordinator. School and school PBS team respondents will use the respondent login option with the six-digit login number provided by the PBS Surveys Coordinator. PBS Surveys Coordinators will use the coordinator login with the username and password assigned by the PBS Surveys Accounts Manager.
Respondent Login Coordinator Login
Menus and Navigation All areas of the site are accessible through the navigation menu at the top of the page (just below the banner). Some of the menu items have selections within them indicated a small down-arrow. Moving the cursor over the top-level item causes a vertical menu to appear with the selections for that item.
Some areas of the website also include blue, tabbed sections with multiple pages of information and links. An example is the Home section of the website which includes three tabs. Clicking on a tab brings the user to a separate page within the Home section.
A.W. Todd, J. Boland, R. Horner, University of Oregon; George Sugai, University of ConnecticutJune, 2009
3
Survey Response FormsEach survey uses radio buttons ( ) for respondents to indicate their answers to survey questions. The Self-Assessment Survey has four tabs or sections (one page for each section). The “Submit” button will appear on the last page. To navigate forward and backward through the survey, click on the “Next Section” and “Previous Section” links at the top and bottom of the page. The School Safety Survey has two sections (Risk Factors and Protective Factors). The Team Checklist also has two sections (Start-up and On-going) on separate tabs. The Benchmarks of Quality has ten sections, also on separate tabs. Do not click the “Submit” button until you have completed all sections of the survey you are taking.
Page LinksPage links that lead outside the application open in a new window. Links within the site open within the same window.
Generating ReportsUsing the “View Reports” function in each survey, you can view the data that is available for each report.Reports for Safety Survey, Team Checklist, and Self-Assessment are available by clicking on the small gray box with the “+” in it. The available data table(s) will appear. Click on ‘show charts’ for the reports that are needed. Data for open surveys will not be available to view until after the survey close date. Coordinators are able to access reports for Benchmarks of Quality and the School-Wide Evaluation Tool. They are available by selecting the appropriate District(s), School(s), and Year(s) and clicking on “View Report”.
Exporting Survey DataSurvey data can be exported into a variety of file formats:
• XML file with report data• CSV (comma delimited)• TIFF file• Acrobat (PDF) file• Web Archive• Excel
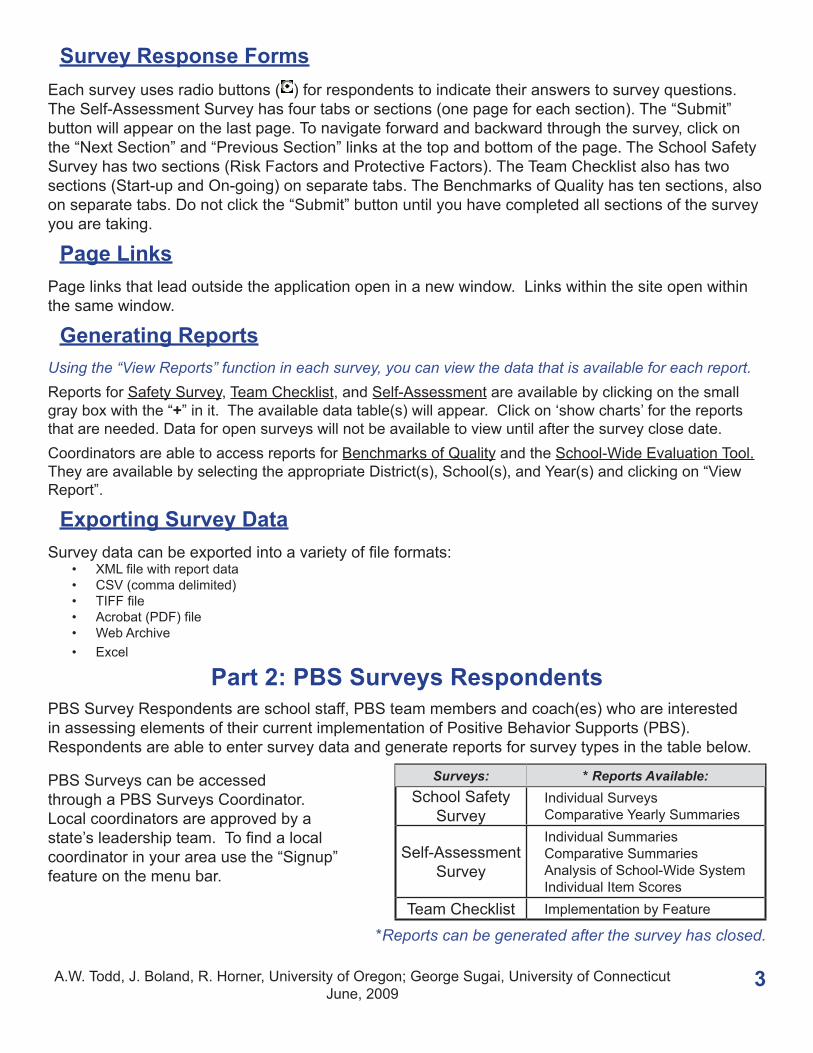
Part 2: PBS Surveys RespondentsPBS Survey Respondents are school staff, PBS team members and coach(es) who are interested in assessing elements of their current implementation of Positive Behavior Supports (PBS).Respondents are able to enter survey data and generate reports for survey types in the table below.
PBS Surveys can be accessed through a PBS Surveys Coordinator. Local coordinators are approved by a state’s leadership team. To find a local coordinator in your area use the “Signup” feature on the menu bar.
Surveys: * Reports Available:School Safety
SurveyIndividual SurveysComparative Yearly Summaries
Self-Assessment Survey
Individual SummariesComparative SummariesAnalysis of School-Wide SystemIndividual Item Scores
Team Checklist Implementation by Feature
*Reports can be generated after the survey has closed.

A.W. Todd, J. Boland, R. Horner, University of Oregon; George Sugai, University of ConnecticutJune, 2009
4
Part 3: PBS Surveys CoordinatorA local PBS Surveys Coordinator will set up survey periods for the school and school PBS team respondents. The coordinator is able to manage surveys for multiple schools, districts, or an entire state and view survey reports when a survey has closed.
Enter the username and password you have chosen or that was assigned to you by the PBS Surveys. Accounts Manager as a result of submitting the Local Coordinator Information Form. Click the “Login” button at the bottom of the form.
Once you have logged in, a new navigation menu item, “Coordinate”, appears. Use the Coordinate drop-down menu to manage school accounts, add schools to the site, generate status reports, and download survey data. Part 3 of this manual explains each of these menu items.
Features specific to the Coordinator site include:
1. Account Management: Management of individual school accounts is available in the coordinator’s site. Coordinators are able to activate schools in the district(s) they coordinate and activate surveys for data entry for individual schools in this section of the website.
2. Status Reports: Status Reports for specific districts and/or schools are available for coordinators to review and use as a tool for supporting school teams when using their data for decision making.
3. Survey Download: This function gives coordinators access to survey reports for one or more schools, for selected schools in a district, for all schools in a district, for selected districts, or for selected schools in selected districts for all years that the school(s) has survey data in the database.
4. The School-Wide Evaluation Tool (SET) and Benchmarks of Quality (BoQ): The SET and BoQ are available for data entry and report generation in the coordinator site. Coordinators will find a section for BoQ & SET data entry and report generation in Parts 7 & 8 of this manual.
Obtaining a Coordinator AccountTo gain access to a coordinator account, contact your state coordinator (see the “Signup” navigation menu item for the name of your state’s coordinator), and complete the Local Coordinator Information Form located in Part 10 of this document, and send the completed form to [email protected]. You will receive a confirmation email and documents from the PBS Surveys Account Manager describing your PBS Surveys coordinator account.
Account/Survey ManagementCoordinators manage survey accounts for all the schools in a district(s) where they coordinate PBS programs. As additional schools implement PBS programs in your district(s), you can also add them to the list of schools in your Coordinator account (see “Adding School Accounts” on page 5).

A.W. Todd, J. Boland, R. Horner, University of Oregon; George Sugai, University of ConnecticutJune, 2009
5
Managing School AccountsThis section of the coordinator site allows you to view currently open surveys, edit start and end dates for current surveys and add new surveys for schools you work with that have been previously activated (e.g., SWIS™ schools or schools that have submitted surveys in the past).
1. Log into your coordinator account.
2. From the navigation menu at the top of the page, select “Coordinate”.
3. From the Coordinate drop-down menu, scroll over “Account Management” and select “Manage School Accounts”. This takes you to the “School Survey Accounts Management” page.
4. Click the “Select School” drop-down arrow to select a school for which you wish to activate survey data entry, view survey status or edit start and end dates for currently open surveys.
This Account Management page allows you to activate the surveys each school will complete. The Select School drop-down list displays all of the schools for which you are coordinator. If a school you coordinate does not show up on the drop-down menu, add it using the Add Schools function.
Adding School Accounts1. Log into your coordinator account.
2. From the navigation menu, select “Coordinate”.
3. From the Coordinate menu, scroll over “Account Management” and select “Add Schools”.
4. Select the district where the school you wish to add is located. Only district schools that are in the National Center for Education Statistics (NCES) database and are not already set up in PBS Surveys (or SWIS) will appear.
5. Locate the school to add from the list and click the box next to the school’s name. You can select multiple schools from the list.
• Check to see if the school is listed under its full name, e.g., Adam C. Nelson Jr. High instead of Nelson Junior High.
6. Click the “Add Selected Schools” button to add the school(s) to your coordinator account. A screen will appear indicating the number of schools you have added. To add more schools either from the same district or a different district, click the Add More Schools link at the bottom of the page.
7. The new schools will now show up in your coordinator drop-down list on the Account Management—School Accounts page.
If a school you want to add does not appear on the list of schools to add from a particular district, it will need to be added manually to the database. Common reasons that a school might not appear include: the school just opened in the last 0-24 months; the school is an alternative school, private school, or a “school-within-a-school” (programs part of a larger school). If you don’t find a school, you will need to complete and return a School Information Form to the PBS
Surveys Account Manager so the school can be added to the database.

A.W. Todd, J. Boland, R. Horner, University of Oregon; George Sugai, University of ConnecticutJune, 2009
6
Creating a New School Survey AccountThe school’s survey account code is the six digit number next to “Surveys Account” in the Account Management – Manage School Accounts section. This is the number you will provide to school users so they can login to their school’s account to enter survey data. If a school does not have a survey account code, click “Create Account”.
Survey ManagementTo add a survey:1. Go to the Account Management page and select “Manage School Accounts”.2. Click “Add Survey”. This will insert a new row.3. Select the survey you want to add from the Survey drop-down list.
To add a survey for multiple schools: 1. Go to the Account Management page and select “Update Survey Periods”. 2. Select the State, District, and All Schools (or use the CTRL key to select multiple schools/
districts).3. Select the survey you want to add from the Survey drop-down list.4. Click “Evaluate Request”. 5. Review the information and if it is correct, select “Update Survey Periods” and the School(s) or
District(s) selected will have updated survey periods.
To open the survey for data entry:1. Enter an Open Date. The Open Date is the day users will be able to first enter data for that
survey and by default is the current day’s date. 2. Enter a Close Date. The Close Date is the day the survey is closed to data entry and by default
is one week after the default open date.3. Click “Update”.
To change the dates for existing surveys:1. Click Edit next to the survey you want to change.2. Change the open and/or close date in the columns.3. Click “Update”.
To delete a survey: 1. Click Delete next to the survey you wish to delete. This will only delete open (non-summarized)
surveys; you cannot delete closed surveys. 2. To delete a closed survey (e.g., data entry errors were made), contact the PBS Surveys
Account Manager.

A.W. Todd, J. Boland, R. Horner, University of Oregon; George Sugai, University of ConnecticutJune, 2009
7
Troubleshooting Information:• To view reports and charts for a given survey, there must be a record for that survey in the
school’s account. If you delete a Team Checklist Survey record from the school’s account, school staff will no longer be able to view Team Checklist reports. To correct the error, simply click Add Survey to the school’s account and select Team Checklist from the surveys drop-down list.
• A school account cannot have two active versions of the same survey. If you try to add a second record, it will produce an error message at the top of the screen.
• PBS Surveys will not allow you to move the close date for the Self-Assessment Survey to a date prior to the last survey entered. You may extend the close date to a day sometime farther in the future if a school needs additional time to complete the survey, however it is important to extend the close date before the survey closes. Alternately, once a close date has passed, you cannot edit or extend the close date, as the system will have summarized the data that have been entered. If you have additional data, the existing summarized survey will have to be deleted, and ALL original and additional surveys re-entered into a new survey.
Status ReportsA Status Report is an easy way to review the data entry status for each school you coordinate. The report will tell you the number of surveys submitted by each respondent type.
Generating a Status Report
1. From the “Coordinate” drop-down menu, select “Status Report”.
2. Select the State, District(s), School(s), and Year(s).If you want to generate a Status Report for all of the schools you coordinate across districts
• Select “All Districts” from the “District” menu.
• Select “All Schools” from the “Schools” menu.
3. Click “View Report”.
This will open a page showing all the surveys for the current year, the respondent role, and the number of surveys by respondent type. Use the scroll bar on the right side of the screen to reveal additional survey data.
If you want to download this report:1. Go to the “Select a format” drop-down menu, choose the format you want to download the data
into, and click “Export”, found just to the right of the drop-down list*.
2. When the dialogue box opens, select “Open File” or “Save”.
*Report Format: The Acrobat (PDF) file will provide you will a report with separate pages for each school.

A.W. Todd, J. Boland, R. Horner, University of Oregon; George Sugai, University of ConnecticutJune, 2009
8
Interpreting the Status Report
Each status report provides the survey name, the respondents’ roles and the number of surveys submitted for that particular data set. The information in this report provides the coordinator with data that supports technical assistance activities with the team.
The status report shown in Table 1 demonstrates in the 2007-08 school year, 7 faculty members completed the Safety Survey. Additionally, 36 faculty members completed the Self-Assessment Survey. The PBS team had submitted three Team Checklists, and Self-Assessment Survey. The coach entered BoQ and SET data.*
Table 1: Example Status Report
School Year Role or Respondent Surveys Submitted200708Safety Survey
administrator 1teacher 4custodial staff 1counselor 1
Total: 7Self-Assessment
administrator 1teacher 15other 5educational assistant 13counselor 1special educator 1
Total: 36SET
Report, Coach 1Total 1
Team ChecklistReport, Team 3
Total: 3Benchmarks of Quality
Report, Coach 1Total: 1
*In this example, all tools were administered. It is important that coaches assist teams in developing evaluation plans, and the plans may not include all of the tools.

A.W. Todd, J. Boland, R. Horner, University of Oregon; George Sugai, University of ConnecticutJune, 2009
9
Survey Download
View Survey DataTo view completed survey data for schools you coordinate:
1. From the “Coordinate” drop-down menu at the top of the screen, select “Survey Download”. 2. Select the State, District(s), and School(s).If you want to generate a Status Report for all of the schools you coordinate across districts
• Select “All Districts” from the District menu.• Select “All Schools” from the Schools menu.
3. Select the “Survey” from the Survey menu.4. Click “View Report”.5. Select the “Report Format” you prefer – HTML, Excel, PDF, Comma Delimited, etc. (PDF will
allow you to have a copy of the survey report for each school on separate pages.)6. Select “Export”.7. Select “Open” or “Save”.
Survey ScoresEach survey has its own unique scoring criteria. PBS Surveys maps each survey question response to a rating score. The scoring translation is defined in Table 2.
Table 2: Scoring Translation
Survey Scoring Criteria
TIC23 total items
2= Achieved 1= In progress 0= Not startedNo Answer = Not Scored
Self Assessment Survey46 total items
2 = In Place/High 1= Partially in Place/Medium 0 = Not in place/LowNo Answer = Not Scored
Safety Survey33 total items
3= Extensive 2 =Moderate 1= Minimum0=Not at AllDon’t Know = Not Scored
SET28 total items
Each item has a specific score as defined that provides a 2, 1, 0 score.
BoQ53 total items
Each item has a specific score as defined that provides a 3, 2, 1, 0 score.

A.W. Todd, J. Boland, R. Horner, University of Oregon; George Sugai, University of ConnecticutJune, 2009
10
Part 4: School Safety SurveyThe School Safety Survey (SSS) assesses risk and protective factors. The SSS is designed to help school leaders evaluate:
• the extent to which the school provides a safe learning environment,• training and support needs related to school safety and violence prevention, and • responses to violence and the effectiveness of protective measures.
Individual school safety surveys are collected during a survey “window”, a period of time (usually at least 7 consecutive days) that your local coordinator has established for your school’s survey. At the end of this period, the individual surveys are summarized and available for reporting and review, including graphs. Prior to this time you cannot retrieve any survey data or charts.
A representative group of school stakeholders (e.g. Administrator, custodian, security staff, parents, staff members) each submit a survey of their perceptions of the school’s risk and protective factors. It is recommended that a minimum of five surveys be submitted.
The reports and charts depict and summarize responses by staff. They can be used for a variety of assessment purposes, including:
• the extent to which the school provides a safe learning environment (low risk scores and high protective scores),
• changes in school safety over time, including overall assessments of risk and protective factors,
• identification of the most and least serious risk factors and strongest and weakest protective factors,
• similarities and differences in staff and community members’ perceptions of risk and protective factors based on occupational positions and roles, and
• staff completion of surveys, including number submitted and percentage of questions answered using the “not at all” to “extensively” scale.
The School Safety Survey is conducted on an annual basis.
Completing the School Safety SurveyTo complete and submit a Safety Survey:
1. Login as a respondent using the account number for your school. 2. From the “Surveys” menu item scroll over “School Safety” and select “Complete
Survey”. If your school is currently conducting the SSS, the survey page will display. (If your school is not currently conducting the SSS, a page with a message informing you of this will be shown – contact your local coordinator.)
3. Select your occupation from the drop-down list. 4. Complete all 17 questions in the “Risk Factors” section. Use “don’t know” for any
question you cannot otherwise answer. 5. Click on the “Safety Factors” tab and answer all 16 questions in this section.
When you have answered all questions, click on the top or bottom “Submit” button. A thank you message should appear. You have completed the survey.

A.W. Todd, J. Boland, R. Horner, University of Oregon; George Sugai, University of ConnecticutJune, 2009
11
Generating School Safety Survey Reports
Individual Respondent ReportsThis report includes one row for each summarized survey the school has previously submitted, in date order. The row provides statistics for the survey, including the overall risk and protection factor scores. A detail section beneath this displays all the individual item scores. Bar charts of these figures can be displayed for each survey by clicking the “Show Charts” button at the right end of each row. The item scores chart can be sorted to show items in either ascending or descending score order. The red line on each graph depicts the average score for that data set.
Risk Factor Item Summary Statistics
Protection Factor Item Summary Statistics

A.W. Todd, J. Boland, R. Horner, University of Oregon; George Sugai, University of ConnecticutJune, 2009
12
Comparative Yearly Summaries This report includes one row of summary statistics for each year that School Safety Surveys were conducted at the school, including the risk factor and protective factor averages across all respondents and the number of people who completed surveys. Bar charts display these statistics across years for visual comparison. Two additional charts display average scores for each risk factor and protection factor, respectively. These charts can be sorted to show items in either ascending or descending score order. These charts are also available for specific years.

A.W. Todd, J. Boland, R. Horner, University of Oregon; George Sugai, University of ConnecticutJune, 2009
13
Part 5: Self-Assessment SurveyThe Self-Assessment Survey examines the perceived current status and need for improvement of four behavior support systems:
• School-wide discipline systems• Non-classroom management systems (e.g., cafeteria, hallway, playground)• Classroom management systems• Systems for individual students engaging in chronic problem behaviors
Each question in the survey relates to one of the four systems. Individual school stakeholders in nine defined occupations and roles and one “other” role submit individual surveys of their perceptions of the status of these four systems.
Individual self-assessment surveys are collected during a survey “window”, a period of time (usually at least 7 consecutive days) that your local coordinator has established for your school’s survey. At the end of this period, the individual surveys are summarized and available for reporting and review, including graphs. Prior to this time you cannot retrieve any survey data or charts. The Individual Items report will be available 24 hours after the survey is closed.
IMPORTANT: If the survey “window” has closed, that is, the period of time the survey was opened has passed, you cannot re-open the survey for additional individual entries; attempting to do so will result in a
separate survey and the results cannot be aggregated into a previously closed survey.
The Self-Assessment Survey is initially completed when a school begins adoption of school-wide positive behavior support systems, then annually thereafter (preferably in the spring) as part of the team’s action planning process.
Individual survey results are summarized and used for a variety of purposes including:
• Annual action planning• Internal decision making• Assessment of change over time• Awareness building of staff• Team validation
The Self Assessment Summary is used to develop an action plan for implementing and sustaining positive behavioral support systems throughout the school. The Self-Assessment data is available in four data reports.
Completing the Self-Assessment SurveyTo complete and submit a Self-Assessment Survey:
1. Login as a respondent using the account number for your school. 2. From the “Surveys” menu item scroll over “Self-Assessment” and select “Complete
Survey”. If your school is currently conducting a Self-Assessment Survey, first page of the survey will display. (If your school is not currently conducting a Self-Assessment,
A.W. Todd, J. Boland, R. Horner, University of Oregon; George Sugai, University of ConnecticutJune, 2009
14
a page with a message informing you of this will be shown – contact your local coordinator.)
3. Select your occupation or role from the drop-down list. 4. The Self-Assessment Survey has four sections, one for each positive behavior support
system: school-wide, non-classroom, classroom, and individual. Questions about each system appear on a separate page, beginning with the school-wide system. You can navigate forward and backward through the survey form pages by clicking on the “Next Section” and “Previous Section” links that appear at the top and bottom of the survey area of each page.
5. Answer all the questions you can in each section. If you cannot answer a question, leave it blank (do not select any value).
6. When the last section, “Individual Student Systems”, is completed, click on the “Submit” button at the top or bottom of the survey area of the page.
Generating Self-Assessment Survey Reports
The reports and charts summarize responses by staff to the Self-Assessment Survey at a school. Some reports depict the status of PBS systems at a given time; others allow you make comparisons across time. The reports are used to:
• determine the status of PBS in a school and • guide the development of an action plan for improving PBS.
The resulting action plan can be focused on any combination of one or more of the four PBS system areas (school-wide, nonclassroom, classroom, individual).
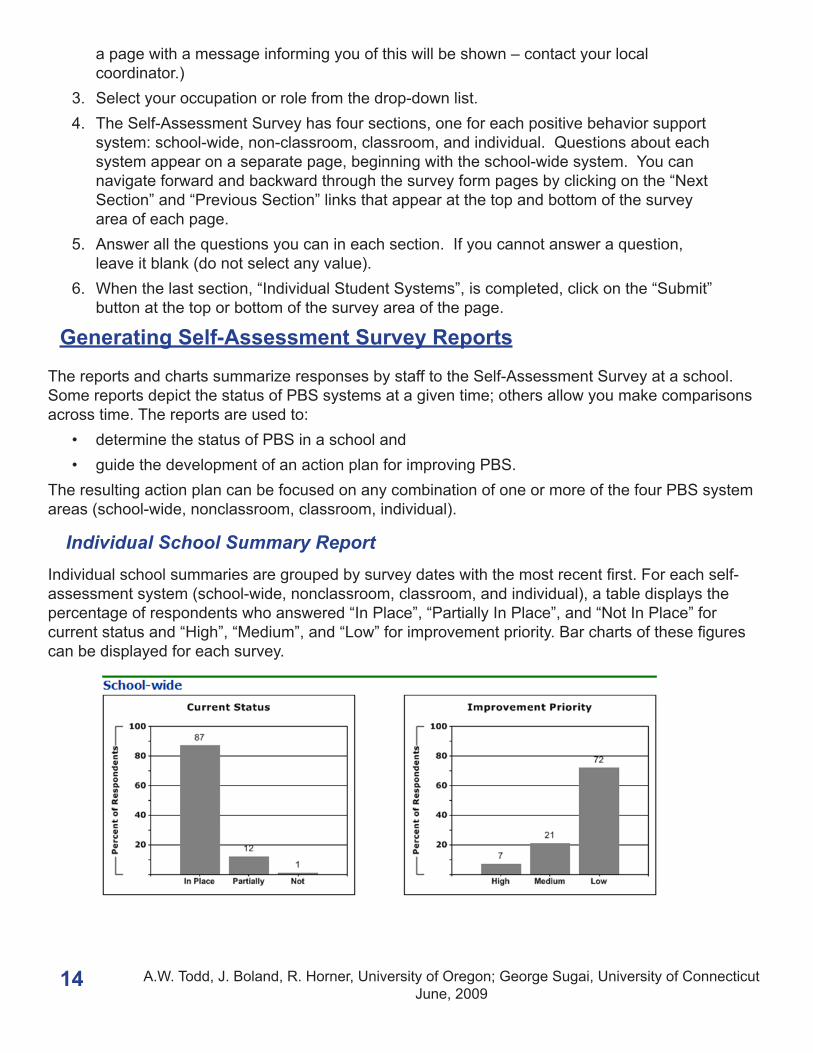
Individual School Summary ReportIndividual school summaries are grouped by survey dates with the most recent first. For each self-assessment system (school-wide, nonclassroom, classroom, and individual), a table displays the percentage of respondents who answered “In Place”, “Partially In Place”, and “Not In Place” for current status and “High”, “Medium”, and “Low” for improvement priority. Bar charts of these figures can be displayed for each survey.

A.W. Todd, J. Boland, R. Horner, University of Oregon; George Sugai, University of ConnecticutJune, 2009
15
Comparative Summaries ReportThis report compares surveys conducted on different dates up to a maximum of five. The report compares the reported status and improvement priority of each self-assessment system on each date. A bar chart comparing the current status of each system on each date, and another comparing the improvement priorities, can be generated.
Analysis of School-Wide System ReportThis report summarizes the school-wide data section for comparison to the School-wide Evaluation Tool (SET) results to the percent of in-place features from the school-wide section of the Self-Assessment summary. The data is summarized in feature areas consistent with the SET. The 18 school-wide Self-Assessment questions are grouped as shown in the parentheses.
• Expectations defined (question 1) • Expectations taught (2) • Reward system (3) • Violations system (4-8) • Monitoring (10-12) • Management (9, 14-16)• District support (17-18)
A.W. Todd, J. Boland, R. Horner, University of Oregon; George Sugai, University of ConnecticutJune, 2009
16
Individual Item ReportThis report gives the percentages of current status (in place, partial, not in place) and improvement priority (high, medium, low) for each item in the self assessment survey. The report provides information for team action planning.
To View Reports for an Individual School:1. Select “School Year”.2. Select “Systems for Report” (Default is “All”).3. Select “Implementation Needs”.
• Selecting “Show” provides highlighted data for items with 0-50% implemented (red), 51-79% implemented (yellow), and 80-100% implemented (white).
• Selecting “Hide” presents the data in black and white.4. Click on “View Report”.
CoordinatorsFor one or more schools:1. Select “State”.2. Select the “District(s)” from the drop down list (use the Control (ctrl) key to select
multiple items).3. Select the “School(s)” from the drop down list (use the Control (ctrl) key to select
multiple items).4. Select the Year you want to view.5. Implementation Needs: Select a Value. (either Show or Hide). 6. System: Defaults to “All”; you can also choose a specific system to review.7. Select “View Report”.8. Select download format: Typically Acrobat (PDF file) is the most useful, but the same
options as in other survey download pages are available. Choose the format, click “Export” to open/print or save the file.
For all districts in your coordinator account, or for all schools in a district or districts:1. Select “State”.2. Select “All Districts” or select the District(s) from the drop down list (use the Control (ctrl)
key to select multiple items).3. Select “All Schools”.4. Select “View Report”.5. Implementation Needs: Select a Value (either Show or Hide). 6. System: Defaults to “All”; you can also choose a specific system to review.7. Select Format: Acrobat (PDF) is the most useful but the same options as in other
download pages are available. Choose the format, click “Export”, which will then allow you to open, print, or save the file.

A.W. Todd, J. Boland, R. Horner, University of Oregon; George Sugai, University of ConnecticutJune, 2009
17
PBS Self Assessment SurveysAssessing and Planning Behavior Support in Schools
School Year2008-09
Number of Responses16
Date Completed03/31/2009
Current Status: Feature: Improvement Priority:In
Place Partial Not System: schoolwide High Medium Low
94% 6% 0% 1. A small number (e.g. 3-5 of positively and clearly stated student expectations or rules are defined.
0% 8% 92%
88% 13% 0% 2. Expected student behaviors are taught directly 8% 31% 62%81% 19% 0% 3. Expected student behaviors are rewarded regularly 8% 15% 77%81% 19% 0% 4. Problem behaviors (failure to meet expected student
behaviors) are defined clearly.0% 31% 69%
69% 25% 6% 5. Consequences for problem behaviors are defined clearly
14% 43% 43%
38% 50% 13% 6. Distinctions between office v. classroom managed problem behaviors are clear.
23% 46% 31%
75% 13% 13% 7. Options exist to allow classroom instruction to continue when problem behavior occurs.
15% 23% 62%
100% 0% 0% 8. Procedures are in place to address emergency/dangerous situations
8% 15% 77%
88% 6% 6% 9. A team exists for behavior support planning and problem solving.
8% 38% 54%
88% 13% 0% 10. School administrator is an active participant on the behavior support team
8% 23% 69%
94% 6% 0% 11. Data on problem behavior patterns are collected and summarized within an on-going system
8% 15% 77%
69% 31% 0% 12. Patterns of student problem behavior are reported to teams and faculty for active decision-making on a regular basis (e.g. monthly)
23% 31% 46%
81% 13% 6% 13. School has formal strategies for informing families about expected student behaviors at school.
15% 23% 62%
38% 38% 25% 14. Booster training activities for students are developed, modified, & conducted based on school data.
21% 50% 29%
80% 20% 0% 15. School-wide behavior support team has a budget for (a) teaching students, (b) on-going reqards, and (c) annual staff planning.
0% 33% 67%
50% 44% 6% 16. All staff are involved directly and/or indirectly in school-wide interventions.
8% 46% 46%
75% 25% 0% 17. The school team has access to on-going training and support from district personnel
0% 31% 69%
87% 7% 7% 18. The school is required by the district to report on the social climate, discipline level or student behavior at least annually.
8% 17% 75%

A.W. Todd, J. Boland, R. Horner, University of Oregon; George Sugai, University of ConnecticutJune, 2009
18
Part 6: Team Implementation Checklist (TIC)The Team Implementation Checklist, also known as the Team Checklist or TIC, characterizes the evolution of PBS implementation at a school based on survey data submitted since the start of implementation. The charts are used to evaluate the extent of implementation, to identify remaining implementation needs, and to assess the success of the implementation process.
The Team Checklist can be completed on either a quarterly or a monthly basis. Regardless of the time period your school’s PBS team chooses, it is important to remember to submit only ONE survey for each time period; the PBS team arrives at a consensus on each item and submits a single team checklist survey per month or quarter.
Completing the TICTo complete and submit a Team Checklist, follow these steps:
1. Login as a respondent using the account for your school.
2. From the “Surveys” menu item scroll over “Team Checklist” and select “Complete Survey”. If your school is currently conducting a Team Checklist, the survey form page will display. (If your school is not currently conducting a Team Checklist, a page with a message informing you of this will be shown – contact your local coordinator.)
3. Optionally, select your name from the drop-down list. If your name does not appear on the staff list, you may add it using the link that appears immediately below the drop-down.
4. The Team Checklist consists of two sections: Start-up Activities (17 questions) and On-Going Activities (6 questions). Respondents must answer all questions in one or both of these sections. When the page first displays, the “Start-up Activities” tab is on top. To switch to the On-Going Activities section, simply click on the “On-Going Activities” tab.
5. Each section has a link to explain the achieved criteria for each item in the section. Click on the blue box, “More About These Items”, to display this information.
6. When you have answered all questions in one or both sections, click on the top or bottom “Submit” buttons. You have completed the Team Checklist.
A.W. Todd, J. Boland, R. Horner, University of Oregon; George Sugai, University of ConnecticutJune, 2009
19
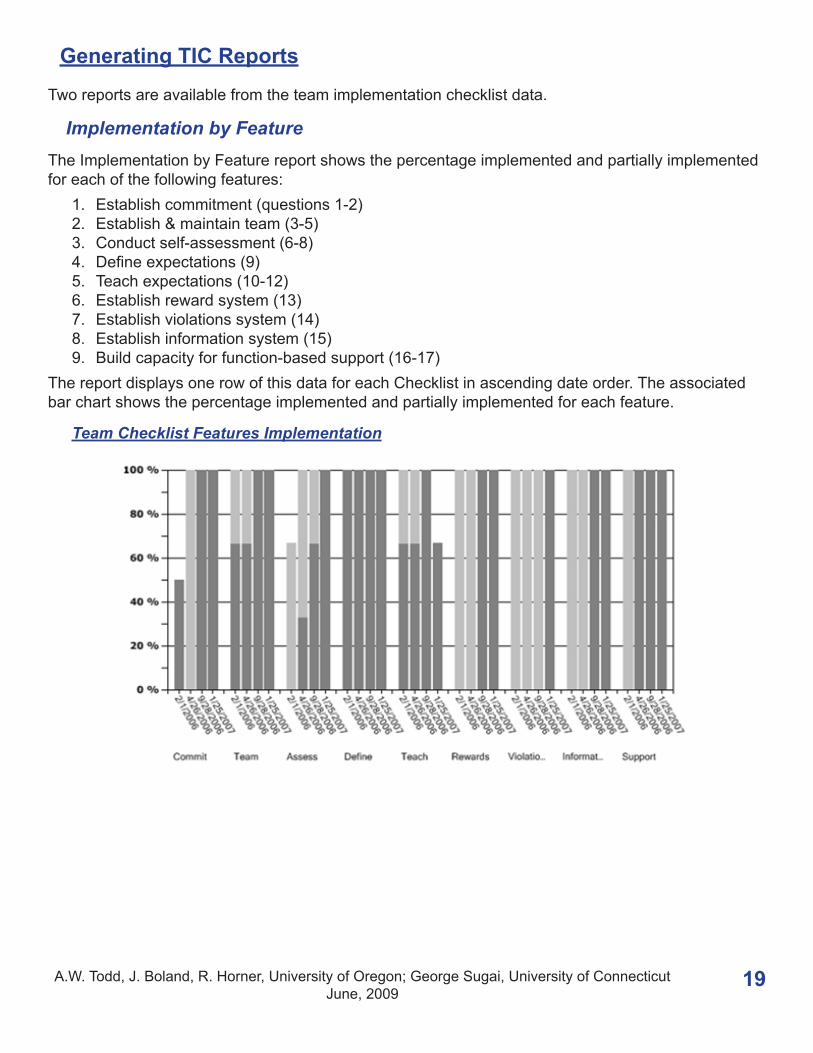
Generating TIC Reports
Two reports are available from the team implementation checklist data.
Implementation by FeatureThe Implementation by Feature report shows the percentage implemented and partially implemented for each of the following features:
1. Establish commitment (questions 1-2) 2. Establish & maintain team (3-5) 3. Conduct self-assessment (6-8) 4. Define expectations (9) 5. Teach expectations (10-12) 6. Establish reward system (13) 7. Establish violations system (14) 8. Establish information system (15) 9. Build capacity for function-based support (16-17)
The report displays one row of this data for each Checklist in ascending date order. The associated bar chart shows the percentage implemented and partially implemented for each feature.
Team Checklist Features Implementation
A.W. Todd, J. Boland, R. Horner, University of Oregon; George Sugai, University of ConnecticutJune, 2009
20
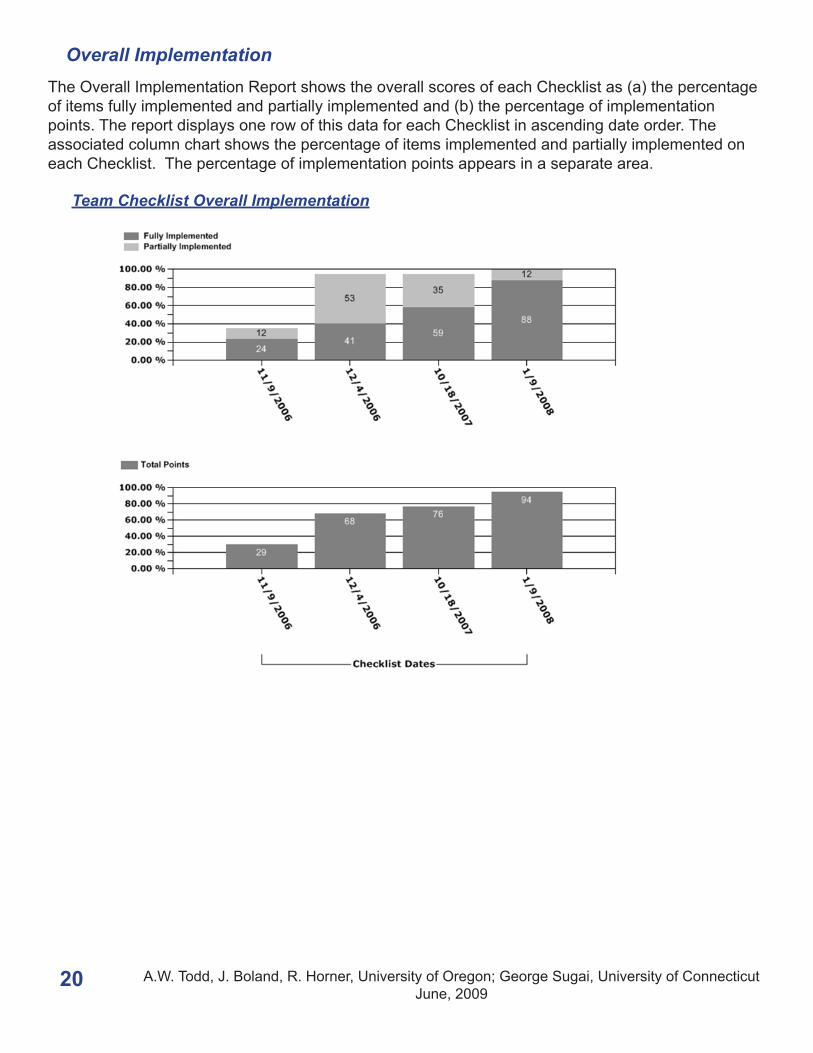
Overall ImplementationThe Overall Implementation Report shows the overall scores of each Checklist as (a) the percentage of items fully implemented and partially implemented and (b) the percentage of implementation points. The report displays one row of this data for each Checklist in ascending date order. The associated column chart shows the percentage of items implemented and partially implemented on each Checklist. The percentage of implementation points appears in a separate area.
Team Checklist Overall Implementation

A.W. Todd, J. Boland, R. Horner, University of Oregon; George Sugai, University of ConnecticutJune, 2009
21
Part 7: Benchmarks of QualityThe BoQ is a rating scale that measures the degree of fidelity with which a school is implementing SWPBS. The BoQ is a self-evaluation tool to allow school teams to review their progress toward implementing critical PBS elements. The critical elements correspond to the 10 subscales of the instrument: PBS Team, Faculty Commitment, Effective Discipline Procedures, Data Entry, Expectations and Rules, Reward System, Lesson Plans, Implementation Plans, Crisis Plans, and Evaluation.
The Benchmarks of Quality (BoQ) is an expedient, effective assessment tool that measures the degree to which a school is implementing the universal level of school-wide positive behavior support (SWPBS). The results of the BoQ provide a mechanism for school teams to identify strengths and weakness based on fidelity criteria for use in establishing future action plans.
The Benchmarks of Quality should be completed by the school team’s coach/facilitator at least annually, but can be completed more often if your school’s PBS team chooses.Note: BoQ Reports are able to be accessed by PBS Survey Coaches only at this time.
Scoring the BoQ
The BoQ consists of three documents: the Coach Scoring Form, the Scoring Guide, and the Team Member Rating Form. The coach first completes the Coach Scoring Form using the Scoring Guide. Each team member then individually completes the Team Member Rating Form, which is a simplified version of the Coach Scoring Form. When the coach and team members have completed the scoring forms, the coach compares his or her ratings with the team members’ ratings, makes note of any discrepancies, and completes a Team Summary Report. Prior to, or during the presentation of the Team Summary Report to the team, the coach can discuss discrepancies and make any necessary adjustments to the score based upon additional information provided by team members.
The BoQ has a total possible score of 100. The score is derived from the items in each of the 10 subscales. Each item has a maximum value between 1 and 3 points, and the points for the items are summed to obtain the total score. The scores for each item are entered into PBS surveys and the scores are tabulated.
Step 1 - Coaches Scoring
The Coach will use his or her best judgment based on personal experience with the school and the descriptions and exemplars in the Benchmarks of Quality Scoring Guide to score each of the 53 items on the Benchmarks of Quality Scoring Form (p.1 & 2). Do not leave any items blank.
Step 2 - Team Member Rating
The coach will give the Benchmarks of Quality Team Member Rating Form to each SWPBS Team member to be completed independently and returned to the coach upon completion. Members should be instructed to rate each of the 53 items according to whether the component is “In Place”, “Needs Improvement”, or “Not in Place”. Some of the items relate to product and process development, others to action items; in order to be rated as “In Place;” the item must be developed and implemented (where applicable). Coaches will

A.W. Todd, J. Boland, R. Horner, University of Oregon; George Sugai, University of ConnecticutJune, 2009
22
collect and tally responses and record on the Benchmarks of Quality Scoring Form the team’s most frequent response using ++ for “In Place,” + for “Needs Improvement,” and – for “Not In Place.”
Step 3 – Team Report
The coach will then complete the Team Summary on p. 3 of the Benchmarks of Quality Scoring Form, recording areas of discrepancy, strength and weakness. Discrepancies - If there were any items for which the team’s most frequent rating varied from the coaches’ rating based upon the Scoring Guide, the descriptions and exemplars from the guide should be shared with the team. This can happen at a team meeting or informally. If upon sharing areas of discrepancy, the coach realizes that there is new information that according to the Scoring Guide that would result in a different score, the item and the adjusted final score should be recorded on the Scoring Form.
Data Entry
To enter a completed BoQ (Note: Only the PBS Surveys Coordinator may enter the BoQ score into PBS Surveys):
1. Login as a coordinator using your assigned username and password.
2. From the “Surveys” menu item scroll over “Benchmarks of Quality” and select “Complete Survey”.
3. Select the School from the drop-down menu.
4. Select your name from the staff list.
5. The BoQ consists of ten sections: Coordinator must answer all questions in each section. To navigate to the next section, click on the tab next to the one you have open (an open tab will be white). Enter the item scores for each of the 53 questions.
6. Each section has a link to explain the achieved criteria for each item in the section. Click on the blue box, “More About These Items”, to display this information.
7. When you have answered all questions in one or both sections, click the “Submit” button. You have completed the Benchmarks of Quality. (Do not click Submit before entering scores for each question.)
Generating BoQ ReportsTo generate a report of BoQ data (Note: Only the PBS Surveys Coordinator can generate a BoQ report):
1. With your cursor over “Surveys” from the menu at the top of the screen, select “Benchmarks of Quality” from the drop-down menu.
2. Click “View Report”.3. Select either the “Overall Scores Report” or the “Elements Report”. (Items Report
is not yet available).

A.W. Todd, J. Boland, R. Horner, University of Oregon; George Sugai, University of ConnecticutJune, 2009
23
4. Select the state from the State menu.5. Select the district from the District menu.6. Select the school from the School menu.
If you want to generate a Status Report for all of the schools you coordinate across districts
1. Select “All Districts” from the District drop-down menu.2. Select “All Schools” from the Schools drop-down menu.3. Select the “Year”.4. Click View Report.5. Select Format: Acrobat (PDF file).6. Click on Export.7. This will create a PDF file and will take time to generate for a district/state.8. Open and print or Save the file.
Overall Scores ReportThe Overall Scores Report will provide the percentage of implementation of the critical PBS elements from each BoQ completed. The report displays a bar chart ordered by date with one bar for each Benchmark survey. Below the chart is a table containing the survey dates and scores. The years to be included on the report are able to be selected.
Elements ReportThe Elements Report shows the percentage of possible points earned for each of the following critical element areas:

A.W. Todd, J. Boland, R. Horner, University of Oregon; George Sugai, University of ConnecticutJune, 2009
24
1. PBS Team (questions 1-4)2. Faculty Commitment (questions 5-7)3. Discipline Procedures (questions 8-14)4. Data Analysis (questions 15-19)5. Expectations Developed (questions 20-24)6. Reward Program (questions 25-32)7. Lesson Plan (questions 33-38)8. Implementation Plan (questions 39-45)9. Crisis Plan (questions 46-48)10. Evaluation (questions 49-53)
The report displays one row of this data for each Benchmark of Quality in ascending date order. The associated bar chart shows the percentage of possible points earned for each critical element.

A.W. Todd, J. Boland, R. Horner, University of Oregon; George Sugai, University of ConnecticutJune, 2009
25
Part 8: School-wide Evaluation ToolSET Overview
The SET is a research-validated instrument designed to assess and evaluate the critical features of school-wide positive behavior support across the school year. The SET was designed to determine:
1. The extent to which schools are already using School-wide Positive Behavior Support (SW-PBS).
2. If training and technical assistance efforts result in change when using SW-PBS.3. If use of SW-PBS procedures is related to valued changes in the safety, social
culture, and violent behavior in schools.By answering each evaluation question within the SET’s seven feature areas, the information gathered can be used to:
1. Assess features that are in place.2. Determine annual goals.3. Evaluate on-going efforts.4. Design and revise procedures.5. Compare year to year efforts in the area of SW-PBS.
The SET is one means of evaluating a school’s level of implementation on school-wide discipline practices and systems. Used in conjunction with other measures, the SET can contribute to a multi-dimensional assessment of school status. Combining SET results with office discipline referral patterns, staff survey results, safety surveys, team checklist data, and other sources of information is encouraged. For more information on decision-making, please refer to the Interpreting and Summarizing section of this manual and the PBIS organization website.
Note: SET Reports are able to be accessed by PBS Survey Coaches only at this time.
Features of the SETThe SET evaluates a total of twenty-eight research questions across seven feature areas. The feature areas include:
1. Expectations defined2. Behavioral expectations taught3. Ongoing system for rewarding positive behavior4. System for responding to behavioral violations5. Monitoring and evaluation6. Management7. District-level support

A.W. Todd, J. Boland, R. Horner, University of Oregon; George Sugai, University of ConnecticutJune, 2009
26
Data Sources used for the SET
Information necessary for the SET is gathered through multiple sources, including a review of school records (including discipline handbook, school improvement plan for safety related goal, instructional materials, meeting minutes), observations, and brief staff and student interviews.
Scoring Guide
The scoring guide is used for calculating the responses and findings of the twenty-eight research questions posed in the SET. The scoring guide is organized by feature area and is formatted to provide the research question and the criteria for scoring each question. Each SET research question has a possible score of two points. Using the established criteria for each question, the SET evaluator determines a 0, 1, or 2 point score for each question. The scoring guide is included with the SET. It is available in Word format and in PDF format.
Data Entry
To enter a completed SET (Note: only the PBS Surveys Coordinator can enter a completed SET):
1. Login as a coordinator using your assigned username and password.
2. From the “Surveys” menu item scroll over “School-Wide Evaluation Tool” and select “Complete Survey”.
3. Select the District from the drop-down menu.4. Select the School from the drop-down menu.
5. Select the school’s current Implementation Status from the drop-down menu.
6. Enter the item scores for each of the 53 questions.
7. When you have answered all questions in one or both sections, click the “Submit” button. You have completed the School-Wide Evaluation Tool.
(Do not click Submit before entering scores for each question.)
Generating SET Reports
To generate a report of SET data
1. From the “Surveys” menu item scroll over “School-Wide Evaluation Tool” and select “View Reports”.
2. Select the State from the drop-down menu.3. Select the District from the drop-down menu.4. Select the School from the drop-down menu.
If you want to generate a Status Report for all of the schools you coordinate across districts1. Select “All Districts” from the District drop-down menu.
A.W. Todd, J. Boland, R. Horner, University of Oregon; George Sugai, University of ConnecticutJune, 2009
27
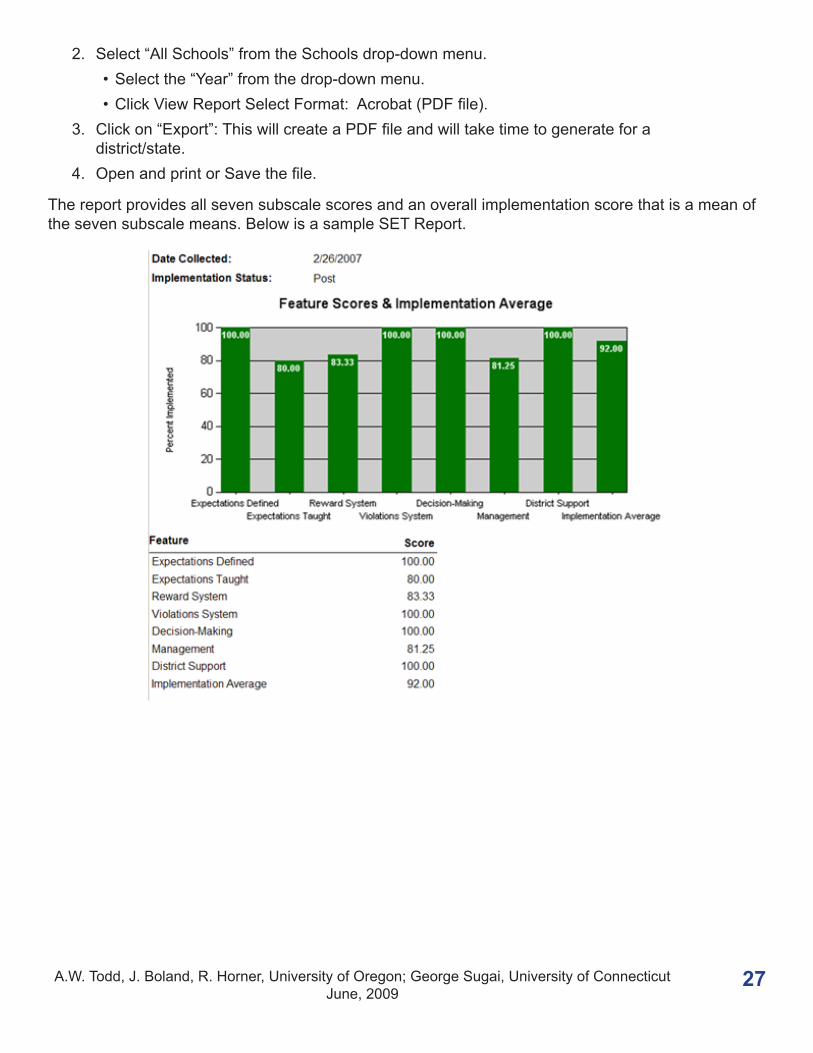
2. Select “All Schools” from the Schools drop-down menu.• Select the “Year” from the drop-down menu.• Click View Report Select Format: Acrobat (PDF file).
3. Click on “Export”: This will create a PDF file and will take time to generate for a district/state.
4. Open and print or Save the file.
The report provides all seven subscale scores and an overall implementation score that is a mean of the seven subscale means. Below is a sample SET Report.

A.W. Todd, J. Boland, R. Horner, University of Oregon; George Sugai, University of ConnecticutJune, 2009
28
Part 9: Developing a PBS Annual Action PlanThe purpose of the PBS Annual Action Plan is to define how positive behavior support can contribute to meeting the School Improvement Goal related to school culture and school safety. The Action Plan should specify how activities, resources, and people will be utilized to address the School Improvement Goal. Using multiple sources of data to measure progress on the established outcomes is a foundational feature for developing Action Plans that guide efficient data use.
The following guidelines should be considered when developing the PBS Annual Action Plan:1. Develop the PBS Annual Action Plan as a team.2. Start by defining the expected outcomes and summarizing last year’s progress.3. Summarize current status, strengths, and areas where improvement is needed.4. Develop goals and activities for two areas:
• Management• Design and Implementation.
5. Use the PBS Annual Planning Guide and the PBS Action Plan as tools to define and document long (1-2 year) and short (3, 6, & 9 month) term objectives.• Specify implementation activities that are discrete and achievable.• Set long term objectives and timelines for activities that require more time and
resources and are more challenging to achieve.• Set short term objectives and timelines for initial activities that have a high
likelihood of being successfully achieved in a short period of time.6. Determine necessary data for measuring the expected outcomes. Data sources for
action planning could include results from:• Benchmarks of Quality• Self-Assessment Survey• Team Implementation Checklist• Office discipline referral patterns• School Safety Survey• Attendance and tardy records• Academic progress records/GPA• Previous documentation of efforts• Other critical information specific to the school
7. Be specific about who will be responsible for each activity.8. Specify when follow-up activities will occur to assess the status or progress.

A.W. Todd, J. Boland, R. Horner, University of Oregon; George Sugai, University of ConnecticutJune, 2009
29
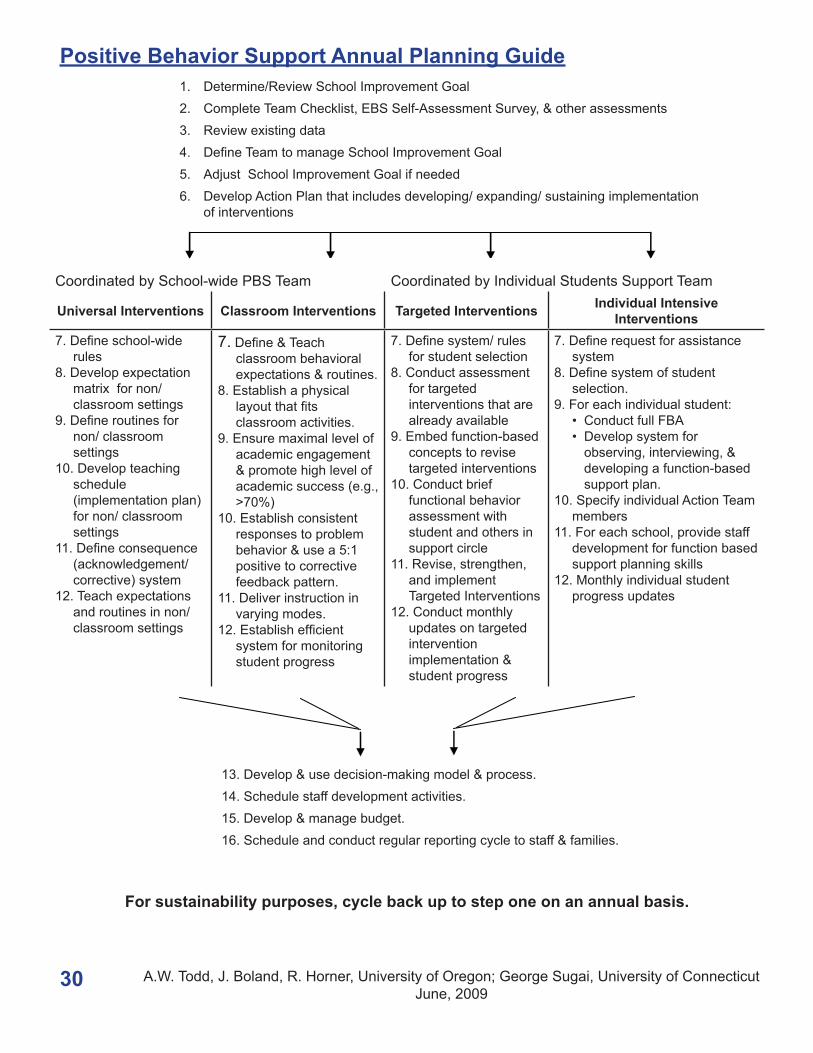
Positive Behavior Support Annual Planning
The planning guide is designed to lead school teams through the Positive Behavior Support (PBS) planning process on an annual basis. PBS in schools incorporates a systems approach to team-based and data-driven practices to develop and sustain a positive instructional climate in schools. Implementation and sustainability of PBS are monitored through data used by a team of staffs/parents/students in the school.
Who should use the PBS Annual Planning Guide
The School-wide Leadership team responsible for developing and monitoring the positive behavior support systems use this guide as a scope and sequence for building a systems approach to PBS that sustains and re-generates for many years.
How to use the PBS Annual Planning Guide
On an annual basis teams start with reviewing the school improvement plan (#1) and move through the sequence of steps to develop an action plan. Based on the results of the action plan, teams move through the sequence of steps for the particular type of intervention area of focus (universal, classroom, targeted, individual).
A.W. Todd, J. Boland, R. Horner, University of Oregon; George Sugai, University of ConnecticutJune, 2009
30
Positive Behavior Support Annual Planning Guide1. Determine/Review School Improvement Goal2. Complete Team Checklist, EBS Self-Assessment Survey, & other assessments3. Review existing data4. Define Team to manage School Improvement Goal5. Adjust School Improvement Goal if needed6. Develop Action Plan that includes developing/ expanding/ sustaining implementation
of interventions
Coordinated by School-wide PBS Team Coordinated by Individual Students Support Team
Universal Interventions Classroom Interventions Targeted Interventions Individual Intensive Interventions
7. Define school-wide rules
8. Develop expectation matrix for non/ classroom settings
9. Define routines for non/ classroom settings
10. Develop teaching schedule (implementation plan) for non/ classroom settings
11. Define consequence (acknowledgement/ corrective) system
12. Teach expectations and routines in non/ classroom settings
7. Define & Teach classroom behavioral expectations & routines.
8. Establish a physical layout that fits classroom activities.
9. Ensure maximal level of academic engagement & promote high level of academic success (e.g., >70%)
10. Establish consistent responses to problem behavior & use a 5:1 positive to corrective feedback pattern.
11. Deliver instruction in varying modes.
12. Establish efficient system for monitoring student progress
7. Define system/ rules for student selection
8. Conduct assessment for targeted interventions that are already available
9. Embed function-based concepts to revise targeted interventions
10. Conduct brief functional behavior assessment with student and others in support circle
11. Revise, strengthen, and implement Targeted Interventions
12. Conduct monthly updates on targeted intervention implementation & student progress
7. Define request for assistance system
8. Define system of student selection.
9. For each individual student:• Conduct full FBA• Develop system for
observing, interviewing, & developing a function-based support plan.
10. Specify individual Action Team members
11. For each school, provide staff development for function based support planning skills
12. Monthly individual student progress updates
13. Develop & use decision-making model & process. 14. Schedule staff development activities.15. Develop & manage budget.16. Schedule and conduct regular reporting cycle to staff & families.
For sustainability purposes, cycle back up to step one on an annual basis.

A.W. Todd, J. Boland, R. Horner, University of Oregon; George Sugai, University of ConnecticutJune, 2009
31
PBS Action Plan for Getting Started
Activity Activity Task Analysis Who When
1. Establish Commitment
• Administrator• Top 3 goal• 80% of faculty• Three year timeline
a.
b.
c.
d.
e.
2. Establish Team• Representative• Administrator• Effective team
operating procedures• Audit of team/
initiatives
a.
b.
c.
d.
e.
3. Self Assessment• EBS survey• Discipline data• Identification of
strengths, focus• Action Plan
developed• Action Plan presented
to faculty
a.
b.
c.
d.
e.

A.W. Todd, J. Boland, R. Horner, University of Oregon; George Sugai, University of ConnecticutJune, 2009
32
4. School-wide Expectations
• Define 3-5 school-wide behavioral expectations
• Curriculum matrix• Teaching plans• Teach expectations• Define consequences
for problem behavior
a.
b.
c.
d.
e.
5. Establish Information System
• System for gathering useful information
• Process for summarizing information
• Process for using information for decision-making
a.
b.
c.
d.
e.
6. Build Capacity for Function-based Support
• Personnel with behavioral expertise
• Time and procedures for identification, assessment, & support implementation
a.
b.
c.
d.
e.
A.W. Todd, J. Boland, R. Horner, University of Oregon; George Sugai, University of ConnecticutJune, 2009
33
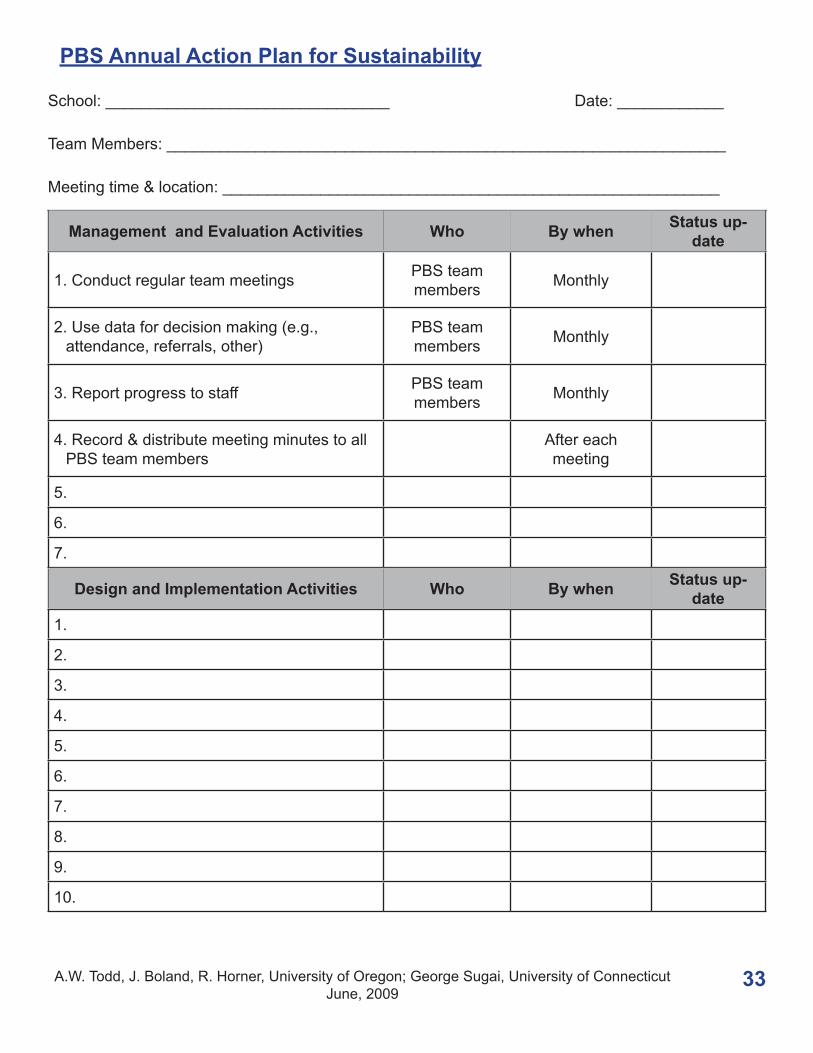
PBS Annual Action Plan for Sustainability
School: ________________________________ Date: ____________
Team Members: _______________________________________________________________
Meeting time & location: ________________________________________________________
Management and Evaluation Activities Who By when Status up-date
1. Conduct regular team meetings PBS team members Monthly
2. Use data for decision making (e.g., attendance, referrals, other)
PBS team members Monthly
3. Report progress to staff PBS team members Monthly
4. Record & distribute meeting minutes to all PBS team members
After each meeting
5.
6.
7.
Design and Implementation Activities Who By when Status up-date
1.
2.
3.
4.
5.
6.
7.
8.
9.
10.

A.W. Todd, J. Boland, R. Horner, University of Oregon; George Sugai, University of ConnecticutJune, 2009
34
Part 10: Coordinator Forms
Local Coordinator Information FormLocal Coordinator Name:
Occupation/Job Title:
Employer/Organization1:
Employer/ Organization website:
Employer Address2: Employer Phone:
Employer Fax:
City and State: Home/Mobile Phone:
Zip:
Local Coordinator Mailing Address3:(If different than employer)
Work Phone: (If different than employer)
Work ext.:
City and State: Fax: (If different than employer)
Zip:
Email4: Preferred password5:
1 Employer /Organization—Name of the agency or company where you work. This must be filled in; if you are self-employed, provide the name of your business.
2 Employer Address—Address of the above listed Employer/Organization.
3 Local Coordinator Mailing Address: Please provide this only if you want your mail to go to someplace other than your Employer Address.
4 Email: Local Coordinator must have an email address. This will be used as your login name.
5 Preferred password: Passwords must be between 8-15 characters, contain at least 1 Uppercase letter and at least 1 number. The password can have special characters.

A.W. Todd, J. Boland, R. Horner, University of Oregon; George Sugai, University of ConnecticutJune, 2009
35
On the following page(s), please list all the states, districts and/or schools for which you will be serving as PBS coordinator. (Note: You do not need to list each school if you have district-wide or state-wide access.)
State-wide access. If you will be accessing all districts and schools in a state please list the state(s) you will be serving.
District-wide access. If you will be serving as PBS Surveys coordinator for one or more whole districts (but not the entire state), please list the districts you will be serving. (Do not repeat if included in state-wide access.)
School-wide access. If you will be serving specific schools within one or more districts (but not the entire district), please list the specific schools by name.

A.W. Todd, J. Boland, R. Horner, University of Oregon; George Sugai, University of ConnecticutJune, 2009
36
Continued...School-wide access. If you will be serving specific schools within one or more districts (but not the entire district), please list the specific schools by name.
Page 1 of 1
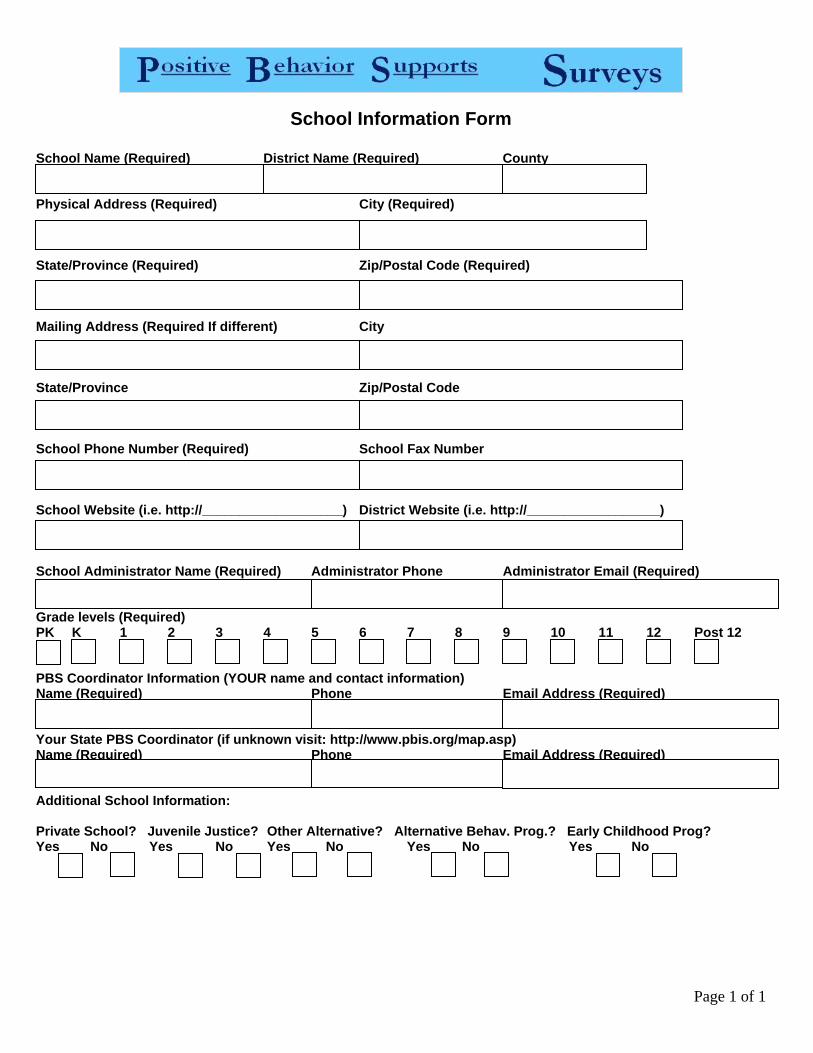
School Information Form
School Name (Required) District Name (Required) County Physical Address (Required) City (Required) State/Province (Required) Zip/Postal Code (Required) Mailing Address (Required If different) City State/Province Zip/Postal Code School Phone Number (Required) School Fax Number School Website (i.e. http://___________________) District Website (i.e. http://__________________) School Administrator Name (Required) Administrator Phone Administrator Email (Required) Grade levels (Required) PK K 1 2 3 4 5 6 7 8 9 10 11 12 Post 12 PBS Coordinator Information (YOUR name and contact information) Name (Required) Phone Email Address (Required) Your State PBS Coordinator (if unknown visit: http://www.pbis.org/map.asp) Name (Required) Phone Email Address (Required) Additional School Information: Private School? Juvenile Justice? Other Alternative? Alternative Behav. Prog.? Early Childhood Prog? Yes No Yes No Yes No Yes No Yes No
A.W. Todd, J. Boland, R. Horner, University of Oregon; George Sugai, University of ConnecticutJune, 2009
38
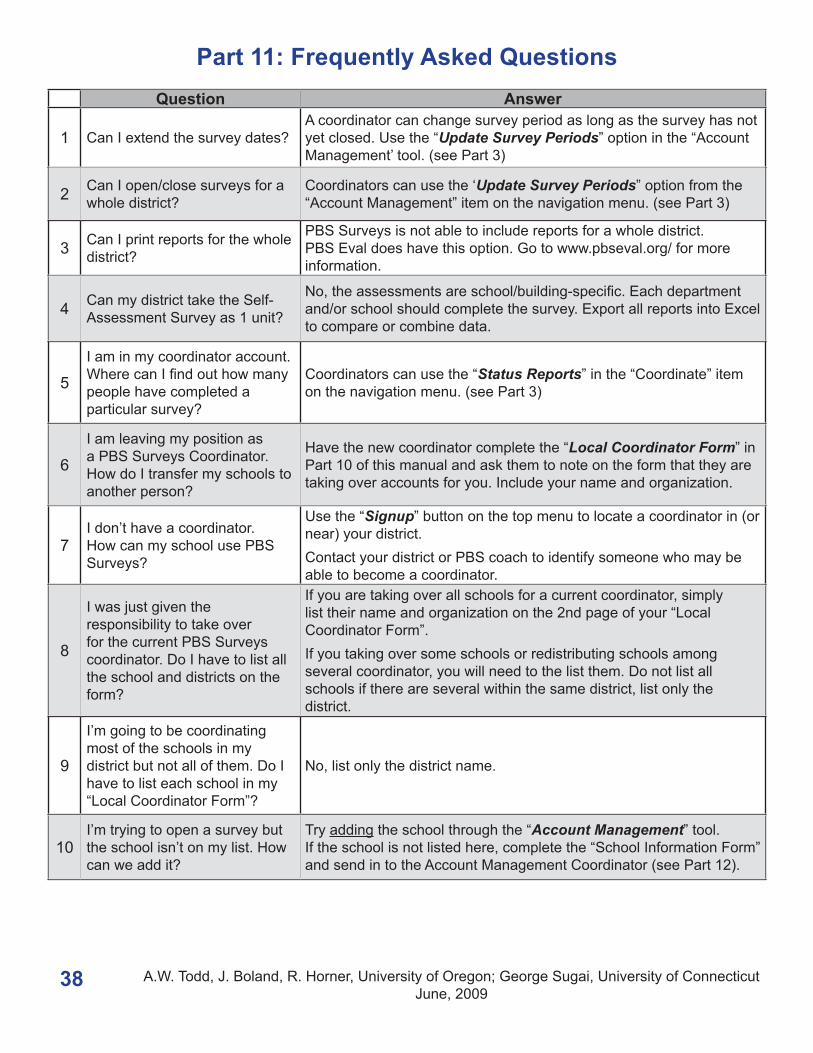
Part 11: Frequently Asked QuestionsQuestion Answer
1 Can I extend the survey dates? A coordinator can change survey period as long as the survey has not yet closed. Use the “Update Survey Periods” option in the “Account Management’ tool. (see Part 3)
2 Can I open/close surveys for a whole district?
Coordinators can use the ‘Update Survey Periods” option from the “Account Management” item on the navigation menu. (see Part 3)
3 Can I print reports for the whole district?
PBS Surveys is not able to include reports for a whole district. PBS Eval does have this option. Go to www.pbseval.org/ for more information.
4 Can my district take the Self-Assessment Survey as 1 unit?
No, the assessments are school/building-specific. Each department and/or school should complete the survey. Export all reports into Excel to compare or combine data.
5
I am in my coordinator account. Where can I find out how many people have completed a particular survey?
Coordinators can use the “Status Reports” in the “Coordinate” item on the navigation menu. (see Part 3)
6
I am leaving my position as a PBS Surveys Coordinator. How do I transfer my schools to another person?
Have the new coordinator complete the “Local Coordinator Form” in Part 10 of this manual and ask them to note on the form that they are taking over accounts for you. Include your name and organization.
7I don’t have a coordinator. How can my school use PBS Surveys?
Use the “Signup” button on the top menu to locate a coordinator in (or near) your district. Contact your district or PBS coach to identify someone who may be able to become a coordinator.
8
I was just given the responsibility to take over for the current PBS Surveys coordinator. Do I have to list all the school and districts on the form?
If you are taking over all schools for a current coordinator, simply list their name and organization on the 2nd page of your “Local Coordinator Form”. If you taking over some schools or redistributing schools among several coordinator, you will need to the list them. Do not list all schools if there are several within the same district, list only the district.
9
I’m going to be coordinating most of the schools in my district but not all of them. Do I have to list each school in my “Local Coordinator Form”?
No, list only the district name.
10I’m trying to open a survey but the school isn’t on my list. How can we add it?
Try adding the school through the “Account Management” tool. If the school is not listed here, complete the “School Information Form” and send in to the Account Management Coordinator (see Part 12).

A.W. Todd, J. Boland, R. Horner, University of Oregon; George Sugai, University of ConnecticutJune, 2009
39
11My school is trying to take the Benchmarks of Quality (BoQ) survey but we can’t find it.
The Benchmarks of Quality Survey is entered only once, by the PBS Surveys coordinator. For more information see Part 7 of this manual.
12 Should I become a coordinator?
Do you have the task and FTE to coordinate PBS Surveys for multiple schools in your region or district? Contact your state PBS coordinator for permission. Locate your state coordinator through the “Signup” button on top menu.
13 What reports can the school access vs. the coordinator?
The respondent can access reports for the School Safety Survey, the Self-Assessment Survey, and the Team Implementation Checklist. Coordinators have access to all available reports.
14
When I log in to complete my survey, the banner at the bottom of the screen covers the last few questions. What should I do?
Try updating your browser version to Internet Explorer 8 or using Mozilla Firefox.
15 Why can’t I access my reports?
1. Check that the survey “window” is closed.2. Check the school name and year. 3. Verify that the school/team entered survey data.
For more information, locate the section that addresses the appropriate survey reports. Note: The Self-Assessment Survey requires 24 hours after closing to
generate reports.
16 Who is my PBS Surveys Coordinator?
To locate your coordinator use the “Signup” item on the navigation menu or the “Find Coordinator” tab in the Help Section.
17
Why can’t teams enter the BoQ data? Why do coordinators have to enter on behalf of the team?
The Benchmarks of Quality is completed in various ways. The goal is that the school teams and the facilitator each complete the survey Ideally the team and facilitator come to a consensus so that only 1 score is entered. (This can also be done at one meeting with the facilitator there). The facilitator (coach) enters the score on PBS Surveys, much the same as is done for the SET. The scores entered for the BoQ are an agreement of team/coach.
18How do I activate a school so they can start using PBS Surveys?
Click the gray button that says “Create Account”.
19How do I add a survey to a new school in my coordinator account?
At the bottom of the screen next to “Surveys for this School”, click on “Add Surveys”.
20 Where can I find directions while I’m taking the survey?
Directions can be found in the users manual which can be downloaded from the “Help” Section.

A.W. Todd, J. Boland, R. Horner, University of Oregon; George Sugai, University of ConnecticutJune, 2009
40
Part 12: Technical SupportIf you have questions about or problems with the use of the PBS Surveys website or with the surveys themselves and need further assistance, please contact one of the following:
RegistrationIf you would like to use PBS Surveys at your school, select “Signup” from the menu bar and follow instructions to find your local and statewide coordinators. They will enable you to use the application. If there is no local or statewide coordinator in your area, contact us at [email protected] for assistance.
Technical SupportTo report problems with the PBS Surveys application, for help using it, and for requests for features, send an email to [email protected] or contact:
Joseph BolandApplication DeveloperEducational & Community [email protected](541) 346-2459
Accounts ManagementFor help with school accounts, please contact your local or state PBS coordinator. For assistance with coor-dinator accounts and with any school account issue your local and state coordinators cannot resolve, send an email to [email protected] or contact:
Mona WoodsAccount ManagerEducational & Community [email protected](541) 346-2347
Coordination SupportIf you are a local or statewide PBS coordinator and need assistance, or if you have question about coordina-tion, send an email to [email protected] or contact:
Katie ConleyTechnical Assistance CoordinatorEducational & Community Supports(541) 346-2248
Researcher SupportIf you need assistance with the application’s research tools or have suggestions for new researcher features, contact:
Anne ToddTechnical Assistance CoordinatorEducational & Community [email protected](541) 346-2482
Celeste Rossetto DickeyTechnical Assistance CoordinatorEducational & Community [email protected](541) 346-1462


