Policy Coherence Initiative on Growth, Investment and Employment The Case of Malaysia Development Policies, Macroeconomic Regime and Employment in Malaysia Prepared for the ILO by Jomo K. S. Wee Chong Hui ILO Regional Office for Asia and the Pacific, Bangkok ILO Policy Integration and Statistics Department, Geneva
Transcript
Policy Coherence Initiative on Growth, Investment and Employment
The Case of Malaysia
Development Policies, Macroeconomic Regime and
Employment in Malaysia
Prepared for the ILO by
Jomo K. S. Wee Chong Hui
ILO Regional Office for Asia and the Pacific, Bangkok ILO Policy Integration and Statistics Department, Geneva
1
Development Policies, Macroeconomic Regime and Employment
in Malaysia
Jomo K. S.
Wee Chong Hui
Malaysia has generally had relatively low unemployment (Table 1). In recent decades, unemployment peaked at 8.6 per cent in 1986. Otherwise, its unemployment rate has been lower than in many other economies, including advanced, industrialized countries, since the 1980s. Since the 1990s, its unemployment rate has been lower than in most countries in Southeast Asia and even in some newly industrialized economies of East Asia (Table 2). Like Singapore and Thailand, it has imported labour, in significant numbers at least since the early 1990s.
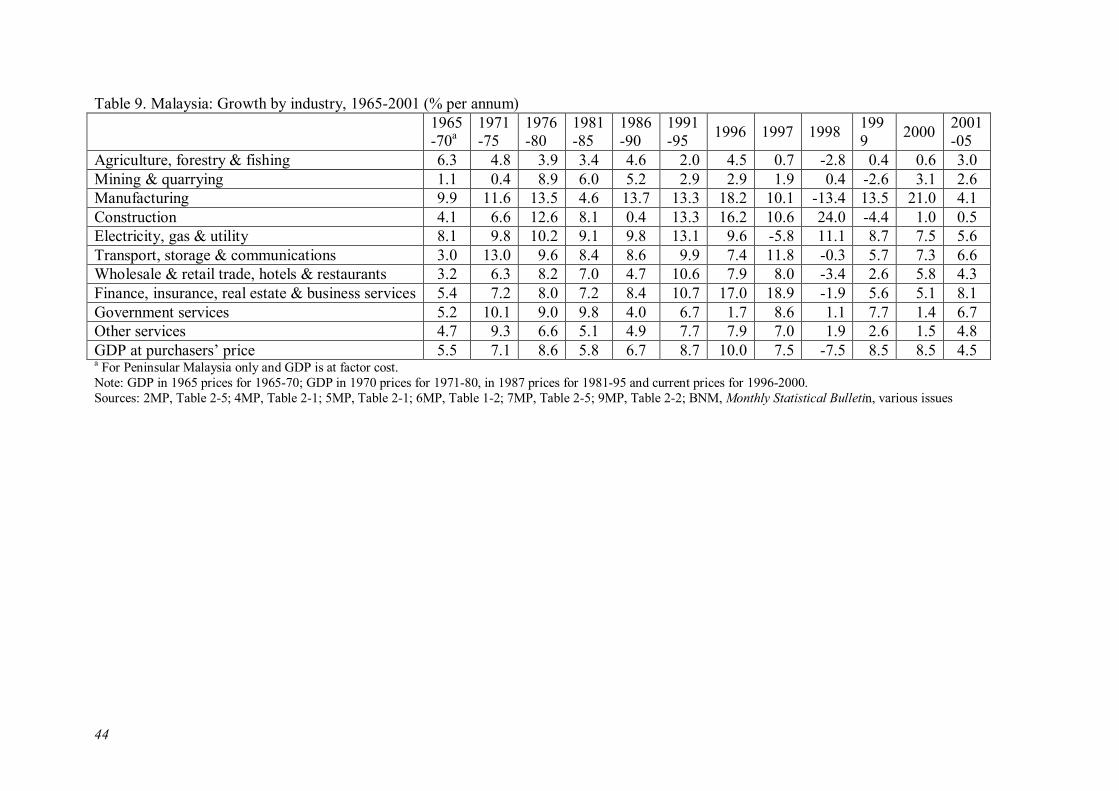
In recent decades, Malaysia’s employment record has reflected general growth and industrialization trends. Real gross domestic product (GDP) growth averaged 7.5 per cent per annum in 1971-80, 6.0 per cent per annum for 1981-90, 9.2 per cent in 1991-97 and 5.3 per cent per annum in 1998-2005, while the consumer price index (CPI) increased by averages of 5.9 per cent, 3.8 per cent, 3.6 per cent and 1.9 per cent respectively. Malaysia’s per capita income rose over the years to an estimated US$4,772 in 2005.
After strengthening for over a decade with the advent of flexible exchange rates in 1973, the ringgit was depreciated in the mid-1980s against the dollar as the greenback began its decade-long decline against the yen from September 1985. Although the yen-dollar relationship was reversed from mid-1995, the Malaysian authorities allowed the ringgit to strengthen against the strengthening US dollar until the regional crisis began two years later in July 1997 when it began a precipitous half-year decline to US$1=RM4.88 in January 1998 until it began strengthening slowly and was pegged at US$1=RM3.80 from September 1998 (Jomo, 2001a). After de-pegging on 21 July 2005, the ringgit has strengthened slightly though less than in neighbouring Thailand.
Malaysia’s concern with ensuring competitive labour costs to attract foreign investments has continued from the 1970s. After the racial riots of 1969, Malaysia formulated the New Economic Policy (NEP), especially in business, a commitment to reduce poverty and an ethnic affirmative action policy to reduce inter-ethnic disparities, especially in business, employment and education. Malaysia has also sought to increase its supply of skilled labour as it has undergone much structural transformation over the years. In particular, GDP from manufacturing and modern services have overtaken output from agriculture and low value-added services respectively.
Meanwhile, manufactured exports have increased greatly with the growth of primary commodity processing as well as export-led industrialization in export processing zones and licensed manufacturing warehouses since the 1970s. This paper examines the impact of macroeconomic and development policies on employment in Malaysia. It considers Malaysia’s experience of structural transformation and the impact of major policies, including ethnic affirmative action, and examines labour conditions over the years, focussing on more recent developments.
Macroeconomic Regime
Malaysia has long sought to achieve growth subject to price and balance of payments constraints. The objectives of the First Malaysia Plan (1966-1970) included employment creation for the country’s growing labour force as well as improved welfare and social infrastructure development, especially in the poorer rural areas where most of the population
2
still resided. With the NEP, the First Outline Perspective Plan (OPP1, 1971-1990) – associated with the New Economic Policy (NEP) – aimed to achieve a growth rate of 8.0 per cent per annum, while the Second Outline Perspective Plan (OPP2, 1991-2000) and the Third Outline Perspective Plan (OPP3, 2001-2010) aimed to achieve growth rates of 7.0 to 7.5 per cent per annum. Trade-off between Growth and Inflation
The focus of macroeconomic management has been on sustaining high growth by raising productive investments. Price stability has been a key, but generally subsidiary goal. A trade-off between growth or employment and inflation has been presumed by policymakers as the rapid growth of aggregate demand has led to cost and price pressures. Also, as full employment is reached, labour demand pressures raise wages.
But despite then Prime Minister Mahathir’s “zero inflation” rhetoric in the mid-1990s, Malaysia has not been obsessed with checking inflation. Thus, when high growth has brought about inflationary pressures, the authorities have not reacted by engineering slow-downs, e.g. by raising interest rates. Actions to slow down the economy have only been taken after exhausting efforts to reduce price pressures in other ways. Policy instruments for managing the level and direction of investments have generally been preferred to raising interest rates.
The price constraint is supposed to be built into these growth-cum-investment targets. The investment rate is set to be in line with the country’s capacity to “absorb” investment. The absorptive capacity for investment is the investment rate that can be comfortably absorbed without giving rise to major inefficiencies in the form of cost escalation, shoddy implementation or inadequate labour or infrastructure. Balance of Payments’ Constraint to Growth
Rapid growth may lead to a rapid rise in imports, not fully matched by export increases, resulting in a growing balance of payment deficit. The rate of growth of exports should exceed or at least parallel the target import growth rate. Rapid growth in the tradable sector can contribute positively to increasing net export earnings.
Planners aim for an investment rate deemed manageable considering the country’s saving rate and expected long-term capital inflows. With the savings-investment gap covered by the capital account surplus and assuming that the savings-investment gap approximates the current deficit, the overall balance of payments would help achieve a stable reserves situation and ringgit value.
Given the Malaysian population growth of over 2 per cent per annum, a high annual growth rate of 7 to 8 per cent was considered desirable for an annual increase in per capita income of between 4.5 to 5.5 per cent.
National Policies and Targets
A growth rate of 8 per cent per annum was also deemed necessary to achieve the New Economic Policy (NEP) objectives, during the OPP1 period (1971-1990), formulated after the 1969 racial riots, to ‘eradicate poverty’ and ‘restructure society’ in order to reduce inter-ethic economic disparities. While increasing per capita income improves living standards, the growth of urban manufacturing industries drew the majority indigenes from the relatively backward rural agricultural areas. The successors to the NEP – namely the National Development Policy (NDP, 1991-2000) (during OPP2) and the National Vision Policy (NVP, 2001-2010) (during OPP3) – declared slightly lower growth – 7.0 to 7.5 per cent per annum respectively – targets.
3
The investment targets for the NEP, NDP and NVP were 22.3 per cent of GNP for 1990, 34.6 per cent for 2000 and 30.7 per cent for 2010 respectively, translated into real investment growth rates of 12.6 per cent per annum for OPP1 and OPP2, and 8.1 per cent per annum for OPP3. To avoid “balance of payments’ constraints to growth” over the long term, Malaysian planners usually target an operating deficit or surplus of between 1 to 2 per cent of GNP.
Investment is critical, not only as a factor input, but also because it induces technological change, skills upgrading as well as improved coverage and efficiency of social and physical infrastructure. By influencing the rate and allocation of investment, policy-makers also hope to induce desired structural change.
Inflation below 5 per cent per annum used to be deemed acceptable, with 4 to 5 per cent used as “the target” for planning purposes. An investment rate of 30+ per cent of GDP was long considered feasible without causing labour, infrastructure and other implementation constraints. Such an investment rate usually translated into growth of between 6 to 8 per cent per annum, regarded as sustainable without being too inflationary.
Unorthodox Interventions Though Malaysia’s overall macroeconomic management has been quite conventional, some policy criteria, tools and targets have been “unorthodox” (Ghazali, 1990). Macroeconomic management in Malaysia owes more to development economics than to conventional macroeconomics, with the primary focus of macroeconomic management being “growth”. Higher growth was always welcome, and it has been rare for growth to be deliberately constrained for fear that it may be inflationary. Problems leading to “overheating” were often treated as due to structural reasons requiring long-term solutions.
The focus on structural factors reflects development economics’ much longer term perspective than conventional macroeconomics. Economic policymakers relied on direct investment-oriented policies, rather than merely on monetary or fiscal policies. Macroeconomics practice was thus more involved and detailed than is conventionally the case.
Policy-makers were not merely counter-cyclical with their fiscal and monetary policies, leaving the rest to market forces. They were also concerned with consolidating resources, facilitating investment, managing structural transformation, defining sectoral policies, pursuing trade policies, undertaking public investment, facilitating and guiding private investment, upgrading social and physical infrastructure, planning human resources, etc. Such policies were all considered part of the “macroeconomic framework” in Malaysia. This framework was revised at regular intervals through plan documents and declared policies and strategies. Neither monetary nor fiscal policy was independent. The central bank often used monetary policy to stabilize prices or to ensure a competitive exchange rate. Fiscal and administrative measures were often used to influence private sector consumption and investment behaviour. These policies addressed short-term concerns, while involving longer term national policies.
Investments
During the era of state-led growth, forecasting private investment and adjusting public investment were undertaken to achieve investment targets. Public investment has been controlled through budget allocations. Should the amount of public investment required exceed revenues, domestic or foreign borrowing makes up the difference. Most public sector borrowings are from the Employees’ Provident Fund (EPF), a compulsory saving schemes equivalent to some 20 per cent of employees’ salaries. Interest rate policy has rarely been used to try to influence the level of investment, including private investment. Private
4
investment has instead been encouraged by tax and other incentives, rather than by adjusting interest rates. Not surprisingly, most empirical studies find only a weak relationship between interest rates and investment rates.
While growth has been private sector-led, public development expenditure has been an important counter-cyclical tool. For example, government development expenditure was rescheduled in the 1996 Budget to avoid excessive investment. The government has also influenced investments by offering and adjusting investment special incentives in favoured sectors and industries. Other methods of influencing private investment have included directing bank loans to favoured sectors, amending policy measures for approval of foreign investment and rescheduling government projects, including privatization. The procedures for influencing the level of investments have been modified to benefit favoured sectors and to discourage investments in others. In this way, not only the level, but also the sectors for investment have been influenced.
The key positive feedbacks targeted in Malaysian planning are those between output growth, savings and exports. Output growth in excess of the population growth rate should lead to higher per capita incomes and savings, i.e. the rate of growth of consumption is slower than the rate of output growth. Appropriate policies encourage savings or restrain consumption. The development of financial markets is enhanced to facilitate savings – providing a reliable legal and institutional framework, maintaining low rates of inflation or even raising the EPF rate of mandatory savings. Consumption, meanwhile, may be restrained by making credit tighter, and by administrative measures besides raising interest rates. As long as growth supports savings, and investments, growth becomes self-sustaining. Focusing on the tradable sectors so that output growth leads to either rising export earnings or import-substitution has ensured positive feedback between output growth and export growth. In this way, export performance has been a policy sensitive variable. Restraints on Inflation
Selective credit controls have been used to contain price increases as well as facilitate growth. Credit regulations (e.g. amount of collateral or down payment, interest rate, credit period) and moral suasion encourage or discourage particular kinds of investment or consumption. Price controls and rationing have eased inflationary pressures, including price manipulation by vested interest groups. Meanwhile, government supports for industrialization include provision of start-up capital, equipment, infrastructure, information and training, interest-free loans and loans at concessionary interest rates and tax incentives.
Macroeconomic managers went to great lengths to sustain growth, even when the economy was “overheating”. Firstly, inflation can be due to demand-side or supply-side factors. To maintain growth, re-balancing the two sides has focused on improving supply (by increasing local output via increased imports, even of labour), rather than on reducing demand. Fiscal Policy
Fiscal policy has been employed for conventional demand management purposes, usually through the annual budget. The chief tools have been adjustments in the level and incidence of taxes, duties and tariffs (i.e. revenue), and spending allocations. Fiscal policy is primarily used to influence the level and direction of public sector investment. Spending authority is approved by Parliament through the annual Budget supply bills.
While public investments have been used to cover shortfalls in expected private investments, they have also been postponed to align investment with absorptive capacity and inflation targets. The government started with budgetary deficits, also financed by foreign government grants and external private loans. “Fiscal prudence” began after escalating debts
5
and their servicing burden during the recessionary mid-1980s. The fiscal deficit was targeted at below 3 per cent of GNP, debt service ratio at below 20 per cent, and the external debt service ratio at below 3 per cent. The government attempted to maintain balanced budgets in the 1990s until the 1997-98 crisis.
In the 1960s and 1970s, export duties (e.g. on rubber and tin) were an important source of government revenue. Export duties (e.g. on rubber and tin) were regressive, being more burdensome on relatively poor small producers than on large operations (Khoo, 1980; Narayanan, 1986: Table 5.2).
As government revenues from import tariffs and export duties were reduced with trade liberalization, sales and services taxes were put in place. The statutory corporate income tax rate was 40 per cent until it was reduced to 35 per cent in 1994, 30 per cent in 1995 and 28 per cent in 1998. The reductions in the statutory corporate income tax rate have ostensibly been designed to encourage investment.
The effective tax rate was lower in view of the generous investment incentives, including the accelerated depreciation allowances introduced in 1977, as well as the generosity of depreciation allowances from 1980 and of re-investment allowances from 1988. The marginal effective tax rate (METR) for investments – the difference between pre-tax and post-tax rates of return to investments, i.e. the tax due – payable on equity was lower than in all other ASEAN countries except Singapore and Thailand (Table 3). The World Bank (cited in Wee, 1997) estimated that the METR would be zero if the statutory tax rate were less than 30 per cent in the presence of the investment incentives.
Over the years, the statutory personal income tax rate has been reduced to encourage individuals to earn work and save more to generate growth. There have been increasing tax exemptions for spending on insurance, education and computers, which facilitate the accumulation of funds for investment as well as human resource development. Monetary Policy
Macroeconomic management in Malaysia has been led by the real side. Thus monetary management has been mainly facilitative in nature, and largely implemented by managing money supply. Money supply growth is targeted to be in line with the growth target, which allows for increased monetization and some “tolerated” inflation. Government bonds have been used to “mop up” excess liquidity. However, interest rate management is not central to Malaysian efforts to control inflation because other tools are used to manage aggregate demand and prices.
Interest rate policy has been used to cope with currency volatility, especially when caused by short-term flows into and out of the country. Thus, if there is speculation against the ringgit, causing the currency to weaken excessively, the central bank may increase short-term interest rates to attract funds from abroad. Interest rate policy has primacy over other tools in the central bank’s management of foreign reserves.
As monetary variables may be quite volatile, the money supply target is only a rough benchmark, and not rigidly adhered to as long as growth, prices, exchange rates, etc. remain within acceptable bounds. There has been no significant need to engage interest rate policies to encourage investments
After the Malaysian banking crisis of the late 1980s, when the share of non-performing loans in the system rose to almost 30 per cent, the authorities significantly strengthened prudential regulation, e.g. through the Banking and Financial Institutions Act (BAFIA), 1989. Although this regulation was subsequently undermined by various liberalization measures, it nevertheless served to protect Malaysia to a greater degree than in the other crisis-hit countries in 1997-98. In fact, the Malaysian financial system had been mainly bank-based before the 1990s, when a far greater role for the capital market emerged.
6
The External Sector
Malaysia had long maintained relatively liberal foreign exchange controls until September 1998. Generally, both residents and non-residents were allowed to freely send funds abroad.
After the collapse of the Bretton Woods system in 1971, the ringgit was floated in 1973, and regulations on foreign exchange transactions were progressively relaxed. Malaysia managed the ringgit float despite the official claim that the value of the ringgit was determined by its weighted value with respect to the currencies of its principal trading partners. The central bank also bought and sold ringgit to manage the float, especially against speculation impact. Subsequent to the financial crisis of 1997-98, the ringgit was pegged at US$1 = RM3.80 from 2 September 1998 to 21 July 2005, after which a managed float has prevailed once again.
Despite its high savings rate, Malaysia encourages foreign direct investment (FDI) to provide additional financial resources for growth and employment creation, secure access to new technology, accelerate structural change as well as provide access to foreign markets. Until September 1998, Malaysia maintained liberal exchange controls to sustain investor confidence. It concluded investment guarantee agreements providing for protection against nationalization and expropriation, compensation in the event of nationalization, capital and fees payment as well as settlements in accordance with the Convention on Settlement of Investment Disputes. The government also grants generous tax holidays, investment tax allowances, reinvestment allowances and export allowances to encourage investors to establish operations in Malaysia.1
The 1959 Pioneer Investment Ordinance sought to attract import-substituting industrial investments while the Investment Incentives Act (1968) sought export-oriented industrial investments; the latter was later replaced with the Promotion of Investment Act (1986). In 1985, a major revision to the 1968 Act liberalized the guidelines on FDI to allow foreigners greater equity participation in companies. Full foreign ownership was permitted for projects that export at least 80 per cent of their products. Projects that export less than 80 per cent were allowed less foreign equity participation, with the maximum permissible level rising with the degree of export-orientation, the level of technological sophistication, as well as positive spin-off effects, the capital outlay and the value-added. These investment regulations have been further liberalized since the 1998 recession. FDI – rather than portfolio investment – has long been attracted as the desired source of net capital inflows from abroad.
Although FDI was expected to fill the savings-investment gap in OPP1 and OPP2 (16.2 per cent and 22.3 per cent of GNP respectively), the high savings rate over the years suggests the financing gap has not been major. In the 1990s, prior to the East Asian financial crises, the government also promoted outward direct investment, especially in other developing countries, in line with South Commission recommendations (Jomo 2002). Overseas investments were expected to enhance international market shares for Malaysian
1 One of the first steps taken to attract FDI in export-oriented industries was the creation of free trade zones for factories to manufacture products for export. To date, there are 12 such zones all over the country. Companies located in the zones are subjected to minimal customs control formalities for their imports of raw materials, parts, machinery and equipment as well as for exports of their finished products. Licensed Manufacturing Warehouses (LMWs) have also been established where it is neither practical nor desirable to establish a free trade zone. This facility was first introduced in 1975 and is offered to companies that export at least 80 per cent of their products and import almost all their raw materials. A number of other export incentives appeal to both foreign and domestic investors. They include export credit refinancing; double tax deduction for expenses incurred for export promotion and export credit insurance; industrial building allowance for warehousing export goods; import duty exemption and drawback of excise and sales taxes paid for imported intermediate goods; sales tax exemption for imports of machinery and equipment; and other tax incentives for R&D, training and industrial upgrading to promote efficiency.
7
firms and to utilize Malaysian expertise and experience (especially for resource extraction, agricultural development and property as well as infrastructure development). The government also relaxed Malaysian FDI and portfolio investments overseas to increase profit incomes from abroad.
Malaysia maintained a relatively free trade regime, with the exceptional rise of tariff protection during the import substitution industrialization efforts of the early 1960s and heavy industrialization of the early 1980s. Tariffs have been reduced and abolished with trade liberalization commitments, e.g. with participation in the General Agreement on Tariffs and Trade (GATT) and its successor World Trade Organization (WTO). They have also been reduced for imports from partners in free trade agreements such as the ASEAN (Association of Southeast Asian Nations) Free Trade Area (AFTA).
The tariff rates introduced after independence were low by international standards and declined over time except for the new protection for heavy industrialization in the early 1980s. Un-weighted average import tariffs decreased from 14.1 per cent in 1960 to 9.0 per cent in 1980, 4.9 per cent in 1990, 1.2 per cent in 2000 and 0.8 per cent in 2005. Export duties have also been reduced from 9.2 per cent of in 1980 to 2.5 per cent in 1990, 0.3 per cent in 2000 and 0.4 per cent in 2005 (calculated with data from Bank Negara Malaysia).
Malaysia’s resource wealth and relatively cheap labour have also long sustained production for export of agricultural, forest, mineral and, more recently, manufactured products. In fact, Malaysia can hardly be considered labour friendly beyond its broad commitment to reducing unemployment. There is no general minimum wage policy, formal unemployment insurance or unemployment relief scheme. The authorities discourage trade unionism to attract investments, while enforcement of regulations designed for labour protection leaves much to be desired.
Labour The Malaysian population grew at an annual average of 2.3 per cent for 1970-80, 2.7 per cent for 1980-91, 4.2 per cent for 1991-95 and 2.6 per cent for 1995-2005 to reach an estimated 26.13 million in 2005 (Table 4). The relatively high population growth from the early 1990s was due to the massive inflow of foreign workers into the country. Foreigners formed 8.9 per cent of thus employed in 1995, and increased to 9.9 per cent in 2005 despite the 1997-98 crisis. Labour force participation has averaged about 65 per cent throughout with male labour participation exceeding female labour participation, i.e. over 80 per cent compared to less than 50 per cent.
Most of the employed were employees, with their proportion of the total employed increasing from 58.3 per cent in 1980 to 75.7 per cent in 2005 (Table 5). Own account workers, mainly smallholder-farmers and owner-operators of small businesses, decreased from 27.0 per cent to 16.6 per cent, while unpaid family workers decreased from 11.0 per cent to 4.5 per cent.
The Ministry of Human Resources (MHR) is the principal agency responsible for most matters affecting the labour market.1 It regulates labour in accordance with various laws, described below, legal precedents in the common law system:
• Employment Act (1955) (EA), which sets out the terms and conditions of service, and the minimum benefits that have to be accorded.
• Employees’ Social Security Act (1969), essentially an insurance scheme to protect workers in establishments with five or more employees and earning less than RM2000 per month against contingencies. The Social Security Organization (SOCSO) was set up to
1 In the case of Sabah and Sarawak, the respective State Labour Departments are in charge of most matters concerning the labour market.
8
implement, administer and enforce the Act, which offers two protection schemes, i.e. the Employment Injury Scheme and the Invalidity Pension Scheme.
• Workmen’s Compensation Act (1952), applicable to all manual workers as well as private sector workers earning less than RM500 per month and public sector workers earning less than RM400 per month.
• Employees’ Provident Fund Act (1951), requiring both employers and employees to make mandatory contributions to the Fund, which can be withdrawn upon retirement, death, disability or emigration. Partial withdrawals are allowed for specific purposes.
• Wages Councils Act (1947), providing for minimum wages in sectors or regions of the country where deemed necessary; Malaysian has no statutory national minimum wage regulation.
• Workers’ Minimum Standards of Housing and Amenities Act (1990), regulating the type of housing and basic utilities to be provided to employees on plantations
• Occupational Safety and Health Act (1994).
• Industrial Relations Act (1967) (IRA), which defines the legal framework for employer-employee relations.
• Trade Union Act, 1959 (TUA), allowing most Malaysian workers with some exceptions, to engage in trade union activities.
The EA is the most important legislation, stipulating minimum standards with respect to wages, working hours, leave, termination and lay-off benefits. However, the Act covers only those earning RM1,500 or less and those engaged in manual labour irrespective of their wages. The terms and conditions of employment of others are regulated by common law or by employment contracts. The IRA and TUA deal specifically with industrial relations in the country. The rest of the legislation provides for the welfare of workers, mostly in accordance with ILO Conventions and Recommendations although Malaysia is not a signatory to most. To ensure greater flexibility in wage determination and to foster the growth of a responsible workforce, amendments were made in 1988 to the EA, IRA and TUA. The amendments claimed to promote industrial harmony, reduce wage rigidities and raise labour productivity to improve Malaysia’s international competitiveness. Some of these reforms were revised following the 1997-98 crisis.
The MHR consults the National Labour Advisory Council, a tripartite forum of relevant government agencies, employers’ associations and trade unions under the Minister’s chairmanship, set up in the mid-1970s to discuss labour relations issues.1 Convening four times a year, it is a consultative mechanism to resolve problems through a consensus, though it does not have much of a track record to inspire confidence.
Conditions The law permits a 48-hour work week, with daily working hours not exceeding eight hours. These eight hours of work must be performed within ten continuous hours from the time work begins for the day. If work is performed after the completed ten-hour period, it is deemed overtime work even though a worker may not have actually eight hours of work in the day. Time for rest is excluded in calculating working hours. The average number of hours worked varies by industry, ranging from 39 hours in the banking industry to about 46 hours in manufacturing.
The Child and Young Persons Employment Act (1966) prohibits the employment of children (below 14 years) and young persons (14 to 16 years), except under certain conditions. The main conditions imposed concern the number of working hours and the times during which they are allowed to work (Table 6).
1 Members from the employers’ associations and trade unions are appointed by the Minister of Human Resources for a term of two years at a time.
9
As amended, the Employment Act (1955) provides for various allowances, leave and retrenchment benefits for private sector workers with wages not more than RM1,500 per month in Peninsular Malaysia, while the Labour Ordinance (Sabah Cap. 67) and Sarawak Labour Ordinance (Cap 76) (SLO, 1959) provide for the respective states.1
An employee is entitled to paid annual leave at the ordinary rate of pay after having completed twelve months of continuous service with an employer. The number of days of annual leave increases with the duration of employment:
• 8 days if employed for less than two years
• 12 days if employed for two or more, but less than five years
• 16 days if employed for five years or more. Malaysia provides generous maternity benefits. Female workers in the private sector
are entitled to 60 consecutive days of maternity leave with pay, while those in the public sector are given 60 days with pay for up to five surviving children. Employers are prohibited from terminating the services of a female employee during this period, or during the 90 days following her maternity leave if she has been certified unfit to work due to pregnancy-related illness.
Paternity leave is not provided for under the law, but it has become a common practice for the private sector to grant leave, ranging from a minimum of one to a maximum of four days. The norm is one day, but increasingly, more companies are granting two days.
The public sector offers better working conditions, particularly for those categories of labour not in great demand by the private sector. However, the government sector has been decreasing in relative size after the early 1980s; its proportion of the labour force rose sharply from 11.0 per cent in 1970 until around 1982 before falling to 9.7 per cent in 2005.
Workers in an industry who believe they need the protection of a minimum wage may request that a wage council be established. Representatives from labour, management and government sit on the council. Currently, minimum wages apply only to employees in hotel and catering services, shop assistants, cinema workers, as well as stevedores and cargo handlers in Penang. There are an estimated 140,000 workers, or two per cent of the workforce, covered by the minimum wages set by the various Wage Councils.
Malaysian laws are silent on temporary workers. Most temporary workers have oral understandings that can be modified from day to day or from week to week. Others have a written contract for some short-term period (e.g. 1 to 3 months). Hence, employment conditions and job security of these workers are at risk.
The incidence of part-time workers increased as employers began to hire more part-timers to cope with economic uncertainties during the recession (e.g. 1.4 per cent in manufacturing in 1985 compared to 1.2 per cent in 1992 and 0.8 per cent in 2004). The EA has been reviewed to specify the terms and conditions of part-time and temporary work with the objective of encouraging housewives, students and retirees to enter the job market when the labour market is tight.
Malaysia does not have any legal provisions for worker participation in management. However, a few manufacturers, especially electronic firms moving away from labour-intensive assembly operations to high-technology-based production, operate more flexible work practices
1 In 1983, eleven of the largest unions in Sarawak, representing 80 per cent of the union membership in the
state, presented a memorandum to the Sarawak Chief Minister, the Prime Minister and the Federal Minister of Labour and Manpower for the extension of the more labour-friendly EA to the state. Negotiations led to the inclusion in the SLO of clauses similar to those in the EA, providing for the above benefits to be effective from 2005. Apparently, some employers communicated with the Minister of Human Resources, who subsequently used his “power of exclusion” to declare a reduction in the wage threshold for the SLO. This will deprive some workers who would otherwise benefit from the SLO amendments. Some employees have initiated a court case to challenge the Minister’s action (documents of the Sarawak Bank Employees’ Union, interviews).
10
to encourage worker participation. These new production processes use techniques such as Total Quality Control (TQM), Just-in-Time (JIT) and Materials Requisition Planning (MRP), requiring worker inputs in shop-floor decisions.
There is no anti-discrimination legislation to guarantee equal opportunities in recruitment, career development, social security and working conditions, regardless of race, religion or gender. The Federal Constitution, however, provides for equality of persons under Article 8, Clause 1, which states, “All persons are equal before the law and entitled to equal protection of the law”. Clause 2 states “Except as expressly authorized by this Constitution, there shall be no discrimination against citizens on the ground of religion, race, descent or place of birth in any law or in the appointment to any office or employment under a public authority or in the administration of any law relating to the acquisition, holding, or disposition of any property or the establishing or carrying on of any trade, business, profession, vocation or employment”.
Discrimination is allowed in accordance with the special provisions of the Constitution for Malay “special privileges” to compensate for the economic backwardness of this “indigenous community”. Since the Independence of Malaya in 1957, such privileges are supposed to have been extended to the aboriginal communities (Orang Asli) of the peninsula and since the formation of Malaysia in 1963, to the “indigenous” (Bumiputera) communities of Sabah and Sarawak. These privileges include access to educational opportunities and financing, especially at the tertiary and secondary levels, as well as public sector employment and promotion opportunities. It is commonly alleged that Malays and other Muslims gained disproportionately from these privileges, that non-Bumiputeras (mainly ethnic Chinese and Indians) as well as non-Muslim Bumiputeras, constituting the largest cultural groups in Sarawak and Sabah) experience official discrimination. Conversely, many Bumiputeras and Indians allege discrimination by Chinese and sometimes by foreign employers.
As mentioned earlier, privileges for Bumiputera affect access to education. Educational credentials are an important determinant of employment prospects and occupational mobility. Globalization has enhanced the premium attached to the command of the English language and other languages of commercial importance such as Chinese and Japanese. Ethnic segregation and streaming in schools (e.g. for religious education) reinforce and formalise ethnic and linguistic differences in job access.
Disability, Health and Safety The Employment Injury Scheme funded by employers is administered by SOCSO. It provides an employee with protection for industrial accidents that occur at work and while travelling from residence to work place, where the worker eats during an authorized break or during journeys directly related to his work. It also provides coverage for occupational diseases. The Invalidity Pension Scheme to which the employee contributes 0.5 per cent of his wage provides employees with 24-hours coverage in the event of invalidity or death resulting from whatever cause. All employees earning RM3,000 (raised from RM2,000 in 2005) or less monthly are required to contribute to SOCSO, while those earning more than RM3,000 are given the option to join, subject to agreement by both employer and employee.
The Workmen's Compensation Act pays compensation to workers for injuries arising out of, and in the course of employment. Medical fees are borne by the employee. If the disability lasts for fourteen days or more, compensation will be paid for the disability period up to a maximum of five years, for the days the worker is unable to work, equivalent to one-third of the wage, or RM135, whichever is lower. For total disability, lump sum compensation, depending on the age of the employee, is paid. In the event of death, a lump sum equal to 45 months earnings, or RM14,000, whichever is less, is paid.
11
Health and safety in factories were once the responsibility of the Factories and Machinery Department, which enforced the Factories and Machinery Act (1967). In 1994, the Occupational Safety and Health Act (OSHA) was introduced, with wider scope and coverage to include all workplaces. The aim is to emphasize the importance of health and safety in the industrial sector, which was increasingly being compromised. There have been slightly over a hundred thousand reported industrial accidents yearly since 1991, and over 50 per cent of the industrial accidents reported in the country are in manufacturing.
The MHR monitors, inspects and audits safety and health hazard control measures at workplaces. It formulates regulations and guidelines and undertakes promotional and advisory work pertaining to occupational safety and health. Finally, it conducts investigations on work-related accidents and diseases. The Act also provides for the establishment of a National Occupational Safety and Health Council – a tripartite forum for discussing, studying and investigating matters regarding safety, health and welfare at the workplace. There is also the National Institute of Occupational Safety and Health, which provides consultancy and advisory services to industries, develops and conducts training programs, and carries out research on occupational health and safety.
Enforcement
According to the Employment Act, an employer has the right to terminate an employee after giving notice for a minimum period, which varies according to the number of years of service: four weeks for less than two years; six weeks for two to five years; eight weeks for five years and more. Termination without notice by either party is possible in the event of wilful breach of any condition in the contract of service.
The Termination and Lay-off Benefits Regulation, 1980 provides benefits to a worker whose employment is terminated or laid-off after he/she has been in employment for a continuous period of not less than 12 months. Before an employee is laid-off, he/she must be given prior notice as provided for in the terms and conditions of service. The employer must also pay for the balance of annual leave due and other minimum benefits. The minimum benefits that the employee is entitled to are:
• 10 days’ wages for every year of continuous service with the employer if he has been employed for a period of less than 2 years.
• 15 days’ wages for every year of continuous service with the employer for a period of 2 – 5 years.
• 20 days’ wages for every year of continuous service with the employer if he has been employed for 5 years or more.
In the case of unfair dismissal, all employees can lodge a complaint with the Industrial Relations Department. The Industrial Court has the right to grant reinstatement or compensation. Compensation is usually awarded, instead of reinstatement, in cases where both parties have lost confidence in each other and/or where the hostility between the two parties has become irreparable.
The EA provides for the Labour Court, where an employee may seek redress on disputes arising out of any of the provisions of the Act. The Labour Court is presided over by a gazetted Labour Officer, using informal hearing procedures where parties may or may not be represented by counsel. The Labour Courts provide speedy relief at low cost to aggrieved employees who would otherwise have to go through protracted litigation at considerable cost in civil courts. For workers earning more than RM1,500 per month and hence, outside the scope of the EA, common law or the terms and conditions of their employment contract are relevant in establishing their legal rights. For other infringements of their rights, employees have to seek redress through civil courts.
12
Trade Unions The authorities have discouraged trade unionism to attract investments, especially foreign investments in labour-intensive export-oriented (EO) industries. In 1971, amendments to the Industrial Relations Act of 1967 limited the right to strike by designating various issues non-“strikeable”, strengthened the power of management by no longer requiring employers to state reasons for dismissal, bolstered “responsible” unions and fragmented labour unity. Under provisions of the Employment Ordinance, officers of the Labour Department are empowered to decide on matters relating to conditions of employment and wage advances; their decisions can only be reversed by the High Court. This exposes workers to the whims and fancies of officials.
The period since independence has seen the introduction of generally more stringent laws and regulations, and the use of the Internal Security Act (ISA) — which provides for arbitrary arrest and indefinite detention without trial — against labour (Jomo and Todd, 1994). Though any seven persons can form a union, the Director-General of Trade Unions has wide discretionary powers in recognizing unions, including the ability to accord or cancel registration (e.g. cancelling registration if there are more than two unions catering to the same workers), and to determine the nature of the bargaining unit. The government has been known to encourage rival labour centres. Trade union membership has declined over the decades as a share of all wage employees in response to repressive legislation and official hostility, but has grown with their increase. This has been attributed to the increased number of Malays in wage employment, especially in the public sector, and the desire of the government to project a new social contract in the early 1970s.
In 1980, the government introduced amendments to further limit union rights and otherwise constrain unions, while improving overtime payments and retrenchment benefits. “Management functions” pertaining to recruitment, job assignments, transfers, promotions and redundancies are considered prerogatives not subject to collective bargaining, and a federation of unions can only be formed if it consists of unions whose membership is confined to a particular trade or industry. In line with Mahathir’s Look East policy, the government encouraged Japanese-style in-house unions and the laws allow the formation of in-house unions even when a national union already exists in the industry. Trade unions were not allowed in electronic industries before 1989, and even then, only in-house unions were allowed.
Ostensibly prioritizing economic development over workers’ rights, the government focused on legislative measures to establish minimum labour standards to safeguard worker security and welfare. As wages covered by collective agreements rose in the tight labour market in the 1990s (e.g. 10 per cent in 1995), the government announced its support for productivity-linked wages. The government has stressed the need for productivity-driven growth (as against input-driven growth) since the Seventh Malaysia Plan (1996-2000). The shift towards a more market-driven approach to economic development to cope with constraints and challenges due to liberalization and globalization have not been accompanied by minimal liberalization in the control of labour.
Union membership grew by 5.9 per cent annually in the 1970s and by 2.3 per cent per annum in the 1980s. In 1995, there were 504 unions with a total membership of 706,000 members, about 9 per cent of the total employed in the country. In 2005, there were 621 trade unions with a membership of 761,000 (Department of Statistics, Malaysia). Less than 10 percent of the labour force and 15 per cent of all wage labour is organized. The Malaysian Trade Unions Congress (MTUC) is the association of unions, mainly from the private sector, while the Congress of Unions of Employees in the Public and Civil Services (CUEPACS) is the representative organization of public sector unions. The degree of unionization in the public sector has been greater than in the private sector, though industrial actions have been more
13
frequent in the private sector. Public sector unions have fewer rights than private sector unions.
Earlier trend towards large memberships in a relatively small number of unions has been partly reversed by government efforts to promote in-house unions. Most of the unions are small, with about 46 per cent having less than 200 members. In 1995, there were 366 in-house unions, accounting for about 43 per cent of total union membership, with about half in the private sector. Though less bureaucratic and better able to handle problems of individual members in particular work places, small unions lack the necessary clout and resources to bring about significant change.
Government interventions alone did not suppress trade union development. Internal disputes, arising from differences in opinions on labour issues and personal rivalry and power struggles, prevented unions from representing labour effectively. Frequent public bickering, particularly between public and private sector unionists, has seriously affected their creditability and strength, making it easier for employers and the government to undermine the labour movement. Unions could not oppose labour laws such dissent does not come within the definition of a “trade dispute”, and therefore, no dissenting industrial action could be legally organized.
With structural change and the sectoral redistribution of labour, union membership in agriculture fell from about a third in 1969 to 14 per cent in 1991, as membership in manufacturing increased three-fold from 7 to 22 per cent, while union membership in services expanded marginally by 3 per cent. In 2003, 9 per cent of union for membership was in the primary sector, 15 per cent in the secondary sector and 76 per cent in services sector (Ministry of Human Resources, Malaysia). Over the years growing use of cheaper immigrant labour and, increasing labour flexibility have also weakened unions.
In recent years, outsourcing has advanced in both private corporate entities and public agencies with liberalization, labour flexibility, as well as privatization of public enterprises. Such developments have further undermined unions and their ability to protect and advance labour interests.
Collective Bargaining and Disputes
Since 1975, it has been mandatory to register all collective agreements (CAs) with the Industrial Court, though CAs providing better terms and conditions of service or employment than those provided for under the EA are prohibited during the first five years of operation for pioneer industries. The number of CAs thus recognized rose from 155 in 1975 to 373 in 1990 and 324 in 2004. All CAs are binding for a period of three years. However, the coverage of workers by CAs is very uneven; some industries have well-established CA procedures while others have none.
Strikes are allowed, but are subject to various restrictions: prior notice has to be given, a strike ballot has to be taken, the secret ballot registered within seven days with the Director-General, who has ninety days to check its validity. Strikes are prohibited once a dispute has been referred for arbitration by the Minister of Labour. The definition of strikes has been expanded to include unauthorized reductions in work such as go-slows. Government actions since 1980 have forced trade unions to resort to less effective forms of industrial action, such as picketing.
Strikes decreased from a peak of 64 with 45,749 workdays lost in 1975 to only 9 strikes in 1988, involving 5,784 workdays lost. Apparently, the tighter labour market conditions thereafter emboldened workers and trade unions, with the number of strikes increasing to 23 in 1991 before decreasing after the Asian crises to 3 in 2004.
The government prioritizes conciliatory services, referring to the Industrial Court for binding arbitration in the event of failure or following joint application by both parties. The success rate of collective bargaining is 50 per cent at the stage of bilateral negotiation, 25 per
14
cent at the stage of conciliation, with the remaining 25 per cent referred to arbitration. Of deadlocked negotiations, 50 per cent are referred to arbitration at the request of both parties. As noted, strike activity is minimal, with about three per cent of total disputes in 1991 resulting in strikes.
The Court is required to “have regard for the public interest, the financial implications, and the effect of the award on the country, the industry concerned and also to the probable effect on similar industries” in making an award. As noted earlier, all collective agreements have to be recognized by the Industrial Court, implying that the Court has the power to refuse to register a collective agreement if not deemed to be in the national interest. The Industrial Court is headed by a President, who is assisted by eight other chairpersons from the legal profession with at least ten years experience. Each of the cases referred to are presided by the President, over a Chairperson and two other panel members. The panel members for each case are chosen from a gazetted list of about 100 people nominated by employers’ associations and trade unions for terms of two years.
Education and Training Education has been regarded as preparation for later work. It has facilitated upward mobility for many as individual incomes have been positively correlated with education level, and education has provided high internal rates of return. The government’s general commitment to education heavily focuses on the restructuring objective of the NEP. Government expenditure on education has been high, especially from the 1970s. Government expenditure on social services has formed some 25 to 35 per cent of total expenditure since 1963, and expenditure on education accounts for at least half the expenditure on social services (calculated with data from Economic Report, various issues). There are no school fees, but students incur other out-of-pocket expenses, e.g. for transport, uniforms, stationery. The subsidization rate has been over 90 per cent and the level of subsidy per student increases with education level (Wee, 2006a). Government expenditure on education has been no more than 7 per cent of GDP, while private tertiary education services have grown since the mid-1980s (Wee, 2006a).
Emphasis on science/technical education at the school level is weak. The bias towards art-based courses is also reflected at the tertiary level. The National Vocational Training Council (NVTC) promotes and coordinates public and private vocational and industrial skills training, including the establishment of trade standards and curriculum development. Public training institutions provide pre-employment training, and more recently, some skill up-grading to meet specific industrial needs and retraining. However, the MHR provides certificate courses at ten Industrial Training Institutes (ITIs) and skill training at its Centre for Instructors and Advanced Skills Training (CIAST). The Manpower Department also operates the National Apprenticeship Scheme, which is partly sponsored by employers. The Human Resource Development Council recently launched another industry-specific apprenticeship scheme, partly financed by employers, who may claim 95 per cent reimbursement from the HRDF.
The Ministry of Youth and Sports provides certificate courses through nine Youth Training Centres and an Advanced Skills Training Centre, while the Council of Trust for the Indigenous People (Majlis Amanah Rakyat or MARA) provides courses through thirteen MARA Skills Institutes. MARA also provides courses in craftsmanship skills through over a hundred MARA Skills Centres. Various statutory bodies run training programs in their fields of specialization as part of their research activities. Local governments and some private firms collaborate on skills development centres for core skill training.
The recent and demand for technical education emphasis on human resource development has seen the establishment of foreign-assisted training institutions such as the German-Malaysia Institute for production technology and industrial electronics, the French-Malaysian Institute and the Japan-Malaysia Training Institute.
15
Private “twinning” or credit transfer programs allow students to do part of their credit hour requirements locally and complete their studies in universities overseas. The Private Higher Educational Institutions Act (1996) liberalized the provision of tertiary education, allowing local and foreign universities with science and technical subject-based programs to establish branch campuses and award degrees, subject to ministerial approval. Training Requirements
Malaysia allows employment of limited numbers of foreign technical and skilled personnel in industrial establishments to attract new investments and encourage technology transfer. A company with foreign paid-up capital of at least US$2 million is automatically allowed five expatriate posts. However, the government requires training programs for Malaysians to acquire the needed skills and expertise to eventually replace the expatriates. The training requirement was not very explicit until 1984/85, when additional incentives were provided for training and manpower. Even so, the incentives were limited to tax exemptions for buildings used for training.1 In 1991, double deductions for expenses were given for approved training for the manufacturing sector to encourage companies, including those not yet engaged in production, to undertake approved training programs to develop and upgrade skills.
In 1993, the government set up the Human Resources Development Fund (HRDF) with a grant of RM55 million. HRDF is an economy-wide payroll levy and training subsidy scheme. Firms employing more than fifty workers are required to contribute the equivalent of one per cent of their wage bill to the Fund. They could then apply for reimbursement for up to 98 per cent of expenses for approved training.
In 1995, the HRDF was extended to companies with a minimum of RM25 million paid-up capital and more than ten employees. In addition to these benefits, other incentives have also been developed, such as special capital allowances for computers2 and single deductions for pre-operation training expenses incurred. Over time, reforms have also simplified and streamlined application and withdrawal procedures to facilitate access to the HRDF.
In 1995, a 100 per cent investment tax allowance was also given to firms that give training for 10 years. For companies already providing training, a similar incentive has been given to companies intending to undertake technical/vocational training. Double deductions have also been given automatically for training by approved institutions.3 Besides DDI and the HRDF mentioned earlier, private sector participation in training is encouraged with exemptions on imports and sales duties. Employment Requirements
Malaysia’s unemployment rate was 7.5 per cent in 1970. The labour force was growing at a rate of 3.2 per cent per annum. Although the share of agricultural employment was around half in 1970, agriculture’s capacity to generate new employment was low. The industrial sector was therefore expected to play a leading role in employment generation (Malaysia, 1971; MITI, 1996). Malaysia was also rapidly urbanizing and there was an urgent need to create employment opportunities for the fast growing urban population. The switch to attracting labour-intensive industries was initiated in the late sixties (Malaysia, 1973). To support this shift, employment requirements were introduced in 1972 with the introduction of the Labour Utilization Relief (LUR) incentive. The tax exemptions
1 Firms were allowed an initial allowance of 10 per cent and subsequent annual allowances of two per cent. 2 Special Capital Allowance for computer and IT assets: initial allowance of 20 per cent and annual allowance of 40 per cent. 3 This incentive is limited to those not required to contribute to the HRDF.
16
for pioneer status industries depended on the number of full-time paid employees. Firms with 51 to 100 employees were eligible for two years of income tax exemption; those with 101 to 200 employees were eligible for three years tax exemption; those with 201 to 350 for four years tax exemption; and those with 351 or more employees could enjoy up to five years tax exemption. The employment requirement continued into the early 1990s and was still a condition for awarding pioneer status to companies that invested more than RM25 million in fixed assets, and employed 500 or more full time Malaysian workers. Apart from employment generation, the manufacturing sector was expected to bring about greater Bumiputera1 economic participation in the modern sector. In 1970, Bumiputera participation in manufacturing sector employment was only 28.9 per cent, compared to its 53.0 per cent of the population (Malaysia, 1973) as most Bumiputera were still engaged in agriculture. Under the 1975 Industrial Coordination Act, the manufacturing licence included ethnic composition requirements at all levels of employment. This ethnic composition requirement forced firms to recruit Bumiputeras right up to the managerial level. If a company complied with government policy on equity participation or employment on or after 1 January 1986, it qualified for an abatement of five per cent on adjusted income for five consecutive years. However, these requirements were subsequently removed for the establishment of new firms from the mid-1990s as Malaysia started to face labour shortages though employment requirements were never removed from the licenses of firms established earlier.
Employment Initiatives
The Manpower Department provides employment services through its state-wide offices. Job-seekers can register with the department, which then places them to fill vacancies reported by employers. An Electronic Labour Exchange was launched in 2001 to facilitate job search and placements. The Labour Department also provides career guidance to job-seekers. These measures were designed not only to benefit job-seekers, but were also supposed to facilitate employee search in tight labour markets. The Manpower Department also provides job placement services for the handicapped and for rehabilitated drug addicts. With full employment and tight labour market in the early 1990s, measures were targeted at such marginalized segments of society and at selected ethnic groups.
The Private Employment Agencies Act (1981) requires licensing of private agencies by the Manpower Department. These agencies charge fees for job or employee search. Foreign workers may apply for work permits in Malaysia, while regulations exist to stem undocumented migration (e.g. stiffer penalties were introduced for those hiring or harbouring illegal migrants from August 2002). In the tight labour market of the early 1990s, the agencies focused on foreign labour, and employers tended to absorb the fees charged. There were 760 registered private employment agencies, with the majority located in the Kelang Valley.
Besides job placement services were training programs for the marginalized and selected ethnic groups. The Handicapped Rehabilitation Centre and the Juvenile Schools under the Ministry of Youth and Sports also provide basic technical training for the handicapped and juvenile delinquents. MARA) operates the MARA Skills Centres to provide training besides otherwise helping in the establishment and operation of small businesses.
A wide range of fiscal incentives have been provided since 1994 to encourage private sector participation in education and training. From 1992, for example, companies providing training for handicapped non-employees are given double deduction for the training expenses.
1 Bumiputera, meaning “sons of the soil“, refers to indigenous Malaysians, as distinct from the ethnic Chinese and Indian populations who have settled in Malaysia.
17
Fiscal incentives for child-care centres at the workplace aim to encourage more married women to enter the labour market and increase the relatively lower female labour participation. As of 1994, 10 per cent of the expenditure on buildings used for the provision of child-care facilities for employees is tax exempt.
The increase in nominal federal expenditure on training and education for 1986-90 was 33 per cent compared to the previous five years, and rose by 66 per cent for 1991-95 –a doubling of the increased allocations after the recessionary 1980s. Allocations were increased even more for 2001-05, by 124 per cent compared to the previous five years, though the increase for 1996-2000 was by only 39 per cent (calculated with data from Economic Report, various issues). Policy Impact
Malaysia’s employment experience has been shaped by public policies in changing domestic and external economic environments. The population has increased with improvements in the standard of living. The expansion of education has shifted job interest to the modern sectors. While agriculture, industry and services expansion continued rapidly through the 1980s, manufacturing grew faster and agriculture least, as the economy became more open to trade and capital flows. 1957-1969
After the independence of Malaya (now Peninsular Malaysia) in 1957 and the formation of Malaysia in 1963, the government adopted a conservative, non-interventionist stance with minimal budgetary deficits. Government-subsidized land development schemes increased the acreage of export crops such as rubber and oil palm, helping reduce population pressures on shrinking peasant farms. Technical progress and diversification in both plantation and peasant agriculture also increased productivity and exports.
Malaysia first encouraged foreign-led import-substituting industrialization (ISI) from the late 1950s, with the promotion of private industries and public investments in infrastructure. Industrial estates, power and communication facilities were developed with the Pioneer Industries Act (1958). The government’s commitment to industrial development saw an increase in development allocations for trade and industry compared to the colonial eras (Table 7). Tariff protection increased with the level of processing. However, tariff imposition was ad-hoc, and some industries successfully requested exemptions. Until the mid-1960s, tariff protection was low, in consideration of public reaction, tin and rubber exporters’ fear of increasing input costs, as well as the newly elected government’s fear of being perceived as favouring the predominantly Chinese (non-indigenous) business class most likely to benefit (Alavi, 1996).
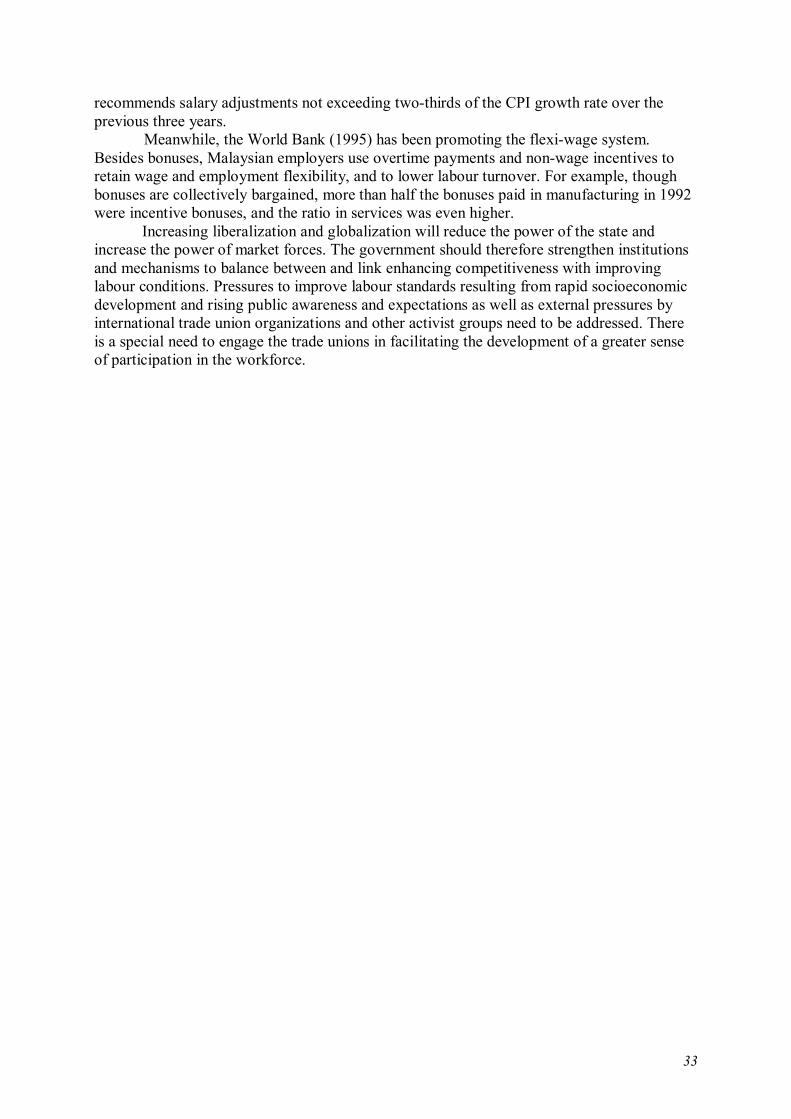
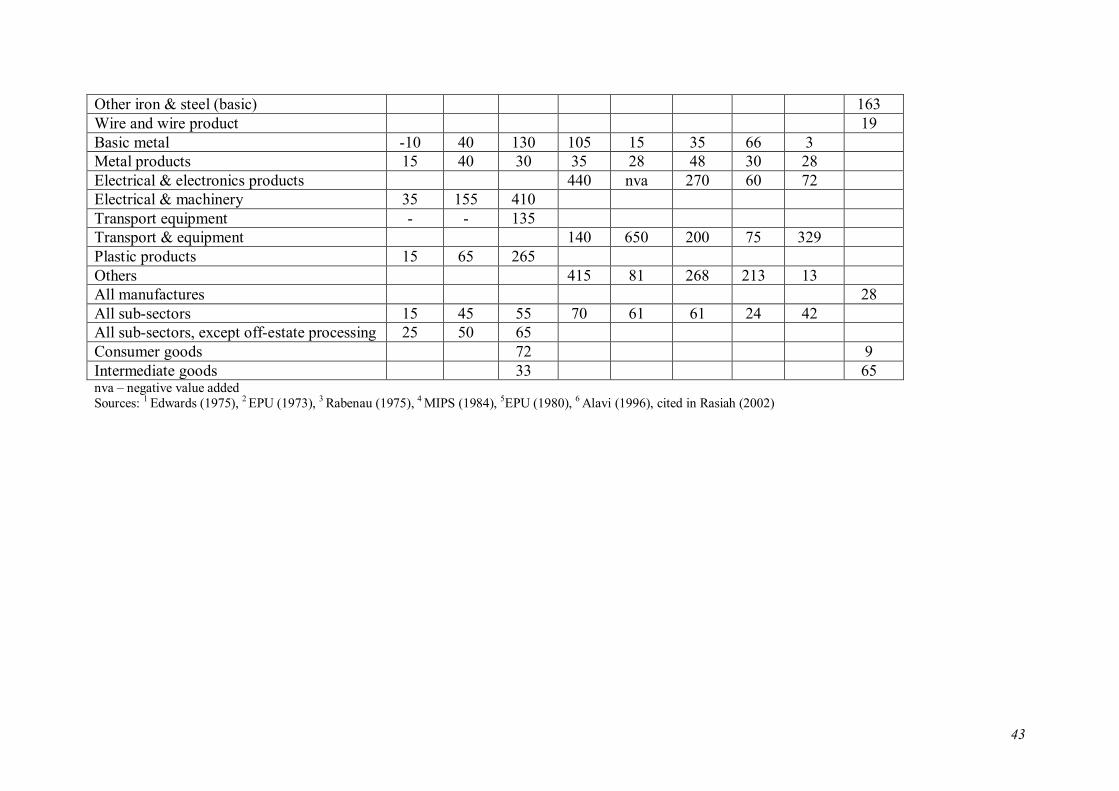
By 1969, consumer goods had an average effective protection rate (EPR) of 72 per cent, and intermediate goods, 33 per cent (Table 8). However, industries given protection often remained inefficient, except for some light processing and assembly industries (garments, wood and furniture). There was no effective appraisal or monitoring to ensure these industries became internationally competitive (Rasiah, 1995). Nonetheless, manufacturing experienced the highest growth rate by sector (Table 9) but did not generate much employment, with its small economic base of 9 per cent of GDP in the early 1960s, the capital intensity of much import-substitution, foreign direct investment and its limited linkages to the rest of the domestic economy (World Bank, 1980). In 1970, manufacturing generated 13.9 per cent of GDP and 8.7 per cent of employment (Table 10). Malaysia always had favourable merchandise balances, increasing with the increase of agricultural commodities from old and new plantations as well as land development schemes (Table 11). However, its services balance was negative for decades, mainly because of the
18
heavy use of foreign shipping and insurance services for merchandise exports and the repatriation of profits to FDI.
The Federal Government enjoyed current budget surpluses, but development expenditure led to overall budgetary deficits (Table 12). Nonetheless, the deficit was still a relatively low 3.9 per cent of GNP in 1970 when it started to rise sharply (Table 13). In the 1960s and 1970s, the government borrowed mainly from domestic sources to finance development. 1970s
The launch of the New Economic Policy (NEP) in 1970 saw nominal government expenditure on development doubling from the First Malaysia Plan (1966-1970) to the Second Malaysia Plan (1971-1975) (Table 12). Development allocations for trade and industry were among the highest, accompanied by allocations for education to accelerate modernization and the movement of Bumiputera into the secondary and tertiary sectors in line with the NEP’s restructuring objective (Table 7). Allocations for agricultural and rural development were also increased to increase outputs and exports, as well as reduce poverty.
The trends continued into the Third Malaysia Plan period (1976-1980). By 1980, the overall budgetary deficit was 13.7 per cent of GNP (Table 13). Government borrowings increased from about RM310 million in 1970 to RM2,120 million in 1975 (i.e. by 70 times) and to RM2,640 million in 1980 (by another 20 per cent). External borrowings accounted for 43.0 per cent of total government borrowing in 1975 and 11.7 per cent in 1980 respectively. Debt service increased from 11.0 per cent in 1970 to 12.6 per cent in 1975 and 15.0 per cent in 1980, while the external debt service ratios were 2.6 per cent, 3.4 per cent and 1.9 per cent respectively.
Malaysia concentrated on export-oriented industrialization (EOI) in the 1970s, with its promise of a larger international market compared to the limited domestic market for import substituting industrialization (ISI). Tax concessions (e.g. investment tax credits, accelerated depreciation allowances, tariff exemptions on imported raw materials) and infrastructure were provided under the 1968 Investment Incentives Act and 1971 Free Trade Zones Act. Incentives to encourage employment and industrial dispersal included the labour utilization relief and locational incentives.
The NEP target of 30 per cent foreign ownership by 1990 was qualified to only affect firms selling to the domestic market, and not fully export-oriented firms located in the country or fully foreign-owned firms registered abroad, according to the 1975 Industrial Coordination Act. Malaysia attracted FDI in manufacturing, involving the relocation of certain aspects of the production processes of foreign firms enjoying technological and market leadership (Rasiah, 1996). Foreign ownership of fixed assets in manufacturing industries averaged 52 per cent in 1975, with the highest for electrical/electronic products (82 per cent), beverages and tobacco (79 per cent), petroleum and coal (79 per cent), textiles (63 per cent) as well as furniture and fixtures (59 per cent).
The dominant position for FDI cannot be said to have been required by the small domestic savings-investment gap, i.e. ranging from -0.2 per cent of GNP in 1975 to -0.9 per cent of GNP in 1980 (Table 14). Instead, FDI access to the latest labour-intensive technology and international markets was probably far more important than capital per se for Malaysia. The overall balance of payments did not deteriorate and the ringgit remained stable (Table 1). Domestic savings still increased and government spending expansion kept the investment rate high, even when private investments declined (the investment rate varied from 30.1 per cent of GNP in 1970 to 28.5 per cent in 1980).
Growth in Malaysia’s open economy has long been export-led. Primary commodities continued to be its major exports, albeit accounting for a decreasing share of total exports
19
(Table 15). Its GDP grew at the high average rate of 7.1 per cent per annum in the period 1971-75 and accelerated to 8.6 per cent per annum in 1976-80 (Table 9). In particular, GDP growth due to manufacturing expansion which accelerated from 11.6 per cent per annum to 13.5 per cent per annum in the two periods. By 1980, GDP from manufacturing (19.6 per cent) was almost at the level of GDP from agriculture and forestry (22.9 per cent) (Table 10).
Employment opportunities increased by 31.0 per cent during the period 1970-75 and by 10.1 per cent during 1976-80 (Table 16). Employment creation from physical development by the construction industry was highest, at 126.4 per cent and 31.2 per cent respectively in the first and second halves of the decade. This was followed by manufacturing at 107.0 per cent and 21.2 per cent respectively. Employment in manufacturing as a share of total employment almost doubled, from 8.7 per cent in 1970 to 15.7 per cent in 1980 (Table 10). Such growth of the secondary and tertiary sectors was accompanied by increased urbanization – the urban share of the population grew from 19.0 per cent in 1957 to 28.8 per cent in 1970 and 37.5 per cent in 1980 (Table 17).
Nonetheless, the unemployment rate rose to 5.6 per cent in 1980 because of increasing entrants into the labour-force. Real wage increases were also limited because of the large labour reserve. Malaysia’s openness led to inflationary pressures in 1975 following the first oil crisis, but inflation was otherwise kept under control. The labour-intensive industries mainly employed dexterous, low-wage female workers, in turn limiting more general increases in real wages.
Changes in government expenditure were another source of growth fluctuations. The government sector had considerable influence on the economy, with government services accounting for over 10 per cent of GDP (Figure 1) and growing faster than most other sectors, i.e. at 10.1 per cent per annum in 1971-75 and 9.0 per cent in 1976-80, compared to 7.1 per cent and 8.6 per cent for the whole economy (Table 9). Government current or operating expenditure tends to be determined by the size of the public sector. Unlike operating expenditure, government development expenditures can be greatly changed in the short run in response to available financial resources (e.g. tax revenues or debt finance). Malaysia’s development expenditure for agriculture and rural development, trade and industry, health, education and housing fluctuated greatly in the 1970s (Table 7).
Nominal development expenditure on agriculture and rural development as well as trade and industry were more than ten times that for health, while that for education was about five times that for health. In addition, the ratio of the average annual development expenditure for 1971-80 to development expenditure in 1971 was 2.78 for education, 2.42 for agriculture and rural development, and 2.00 for health, indicating the government’s priorities over the decade (calculated with data from Economic Report, various issues). Although agriculture and forestry generated higher GDP over this period, their contribution to total employment fell from 53.5 per cent in 1970 to 39.7 per cent in 1980. Progress towards achieving the Bumiputera participation target was significant. In 1970, Bumiputera employment accounted for 29 per cent of manufacturing employment; by 1980, their share had increased to 41 per cent. However, as the pool of available Bumiputera managers and engineers was limited, this led to better remuneration and promotion prospects to attract (and retain) such Bumiputeras.
The higher Malay and Indian concentration in the slow growing primary sector implied higher unemployment rates compared to Chinese (Table 18). With higher dependency on wage employment compared to self-employed Malay farmers, Indian workers had the highest unemployment rate. Household income has from wages grew with the increase of wage employment. Although average household incomes for Chinese were higher than for Malays and Indians, inter-ethnic disparities declined over the 1970s (Table 19). Disparities within ethnic groups also increased through the 1970s, especially for the Malays. Disparities
20
in urban areas also grew in the 1970s, though urban-rural disparities declined during the 1970s when redistributive efforts were strongest.
1981-1990
With Mahathir’s “Look East Policy”, Malaysia promoted heavy industrialization in the 1980s. The government-sponsored Heavy Industries Corporation of Malaysia (HICOM) had been set up in 1978 set up to spearhead the development of heavy industries. Increased tariff rates have since been used to protect new or expanded automobile, iron and steel, cement as well as petrochemical industries (Table 8). Heavy industries are characterized by high capital intensity, long gestation periods and economies of scale. They have become problematic because of poor domestic linkages, the limited size of the domestic market and slow growth as well as failure to profitably penetrate the international market.
Malaysia failed to effectively monitor and appraise heavy industrialization, as with ISI in the 1960s. The industries depended heavily on imported capital/investment goods as well as intermediate goods. Capital goods increased from 30.0 per cent of imports in 1980 to 37.5 per cent in 1990 (Table 20), while the share of intermediate goods declined a little from 49.8 per cent to 46.8 per cent.
To facilitate export business operations, exchange controls were further loosened on 1 January 1987 (Ariff, Mahani and Tan, 1997). Formalities, which export businesses have to comply with, were also simplified. The move also allowed investors greater access to credit facilities, enabling them to expand their domestic productive capacities.
In the mid-1980s, the Malaysian ringgit depreciated following some appreciation from the mid-1970s, hence reducing production costs and attracting foreign investments in export-oriented manufacturing. Towards the end of the 1980s, Malaysia attracted industries relocating from the first-tier East Asian newly industrialized economies of Singapore, South Korea, and Taiwan because of their rising labour costs, strengthening currencies and the 1988 withdrawal of privileges under the Generalized System of Preferences (GSP). Net foreign direct (corporate) investments rose from RM2,935 million in 1980 to RM7,665 million in 1990 (Table 11), i.e. from 4.0 per cent to 5.5 per cent of GNP respectively.
With the recession of the mid-1980s, Malaysia re-emphasized EOI with the first Industrial Master Plan (1986-1995). Tax incentives (e.g. double deductions on export credit refinancing, other export promotion incentives) as well as greater access to credit – by raising financing limits – and subsidized interest rates prior to or upon shipment of products were provided. The government continued to sponsor infrastructure development. Tax exemptions and infrastructure provision successfully attracted more FDI. The repatriation of FDI profits (investment income) overseas increased some three-fold from 1980 to 1990. ‘Leakages’ – through such net transfers of profits overseas as well as payments for imported capital and intermediate goods – reduced domestic retention of value-added.
Malaysia’s merchandise exports increased by 180 per cent from 1980 to 1990, as did its net trade surplus by 35 per cent (Table 11). Manufactured exports more than doubled from 20.6 per cent of exports in 1980 to 58.9 per cent in 1990 (Table 21). However, there was a limited range of manufactured exports as well as weak linkages between export-oriented and domestic-oriented (DO) industries. The two most important exports, i.e. electronic and electrical goods as well as textiles, clothing and footwear, increased their total share from 60 per cent of manufactured exports in 1980 to 65 per cent in 1990. These two non-resource based manufactures were followed by food, petroleum products, and manufactures of metal and transport equipment, with each ranging from 4 to 8 per cent of exports during the period. Such structural change increased urbanization to 54.7 per cent by 1990 (Table 17).
State-led heavy industry investments and near full employment in the early 1980s saw some improvement of employment conditions. Annual bonuses and regular salary revisions in
21
the public sector influenced trade union negotiations with private employers. However, growing unemployment, privatization and recession in the mid-1980s undermined unions in their negotiations, and weakened labour interests more generally. Increased controls introduced since the 1970s have weakened trade unions, curtailing industrial action. Industrial action has been curtailed and the number of strikes declined drastically. The growth of the Malaysian economy in the 1980s was slower than in the 1970s because of falling commodity prices, a slowdown in electronic exports, and world recession. The unemployment rate increased from 5.6 per cent in 1980 to 8.3 per cent in 1986, before declining to 6.0 per cent in 1990 (Table 1). Employment decreased in the mining and quarrying industries and in many services (Table 16). Meanwhile, average annual wage growth in manufacturing picked up from 1.58 per cent in 1971-79 to 5.94 per cent in 1979-85, before declining by 1.17 per cent in 1985-90. In contrast to the 1970s, the average wage in EOI grew slower than in DOI (5.6 per cent per annum in 1979-85 and –1.1 per cent per annum in 1985-90, compared to 6.15 per cent and –0.09 per cent) (Rasiah, 2002: Table 14; Appendix Table 4). Unemployment continued to be higher among Malays and Indians, who were still concentrated in agriculture (Table 18). Migrant Malays among the urban unemployed increased after the expansion of the public sector slowed down from 1982, leading to a higher unemployment rate for the Malays than the Indians. Agriculture continues to loom large in states categorized as “less developed states” in comparison to the “more developed states”. The slower growth of agriculture compared to manufacturing seems to explain the higher unemployment rates in the less developed states (Table 22) (see also Wee, 2006b).
Female labour participation continued to increase in the late 1980s (Table 23). In manufacturing, where employment opportunities increased most, there were faster increases in better-paid skilled and semi-skilled employment. As the economy recovered in the second half of the decade, domestic demand increased, and female employment in manufacturing increased rapidly to 50.8 per cent. Female labour participation at all skill levels continued to increase, although overall skilled labour participation decreased during the period. Employment in construction decreased minimally after the large increase in employment by 40.2 per cent in the first half of the decade (Table 16). The recession, and accompanying unemployment, involved relatively low-income workers in both private manufacturing and the government sector. These developments probably contributed to the political challenges to the leadership of the ruling party.
Since the mid-1980s, increasing casualization has occurred in selected sectors through the use of more contract workers, directly or through contractors and subcontractors, part-time work and home-based work. Casualization is more prevalent in sectors hiring more migrant workers (e.g. plantations, construction, sales of lower-end services and components production, such as for garments, electronics, metal fabrication and wood-based industries). It has led to poorer wages and working conditions for foreign workers generally, especially for the illegal and undocumented.
Career counselling services of the Labour Department are in greater demand during periods of high unemployment, such as in the mid-1980s. Of the 7,385 manufacturing licence approvals granted by MIDA between 1972 and 1986, only 90 received the Labour Utilization Relief (LUR) incentive. Projects enjoying the LUR incentive only generated 16,749 job opportunities, while the total number of jobs created by projects approved during the period was 731,642. However, this does not mean that the LUR incentive was not effective. Since projects could only enjoy either the Pioneer Status (PS) or the LUR incentives, most projects applied for the more attractive PS incentive.
The recession saw a decrease in nominal household income from 1984 to 1987, particularly for urban households and, for Chinese households. Meanwhile, urban-rural
22
disparities as well as inter and intra-ethnic disparities in household incomes narrowed minimally (Table 19)
The recession also affected government finances. It had budgetary current deficits for the first time – increasing from -RM556 million, or 0.8 per cent of nominal GDP, in 1986 to -RM2,042 million, or 2.5 per cent of GDP in 1987. Although it had mainly borrowed from domestic sources (Table 13), and its external debt (Table 24) and obligations (Table 25) were relatively low, debt service charges represented increasingly higher proportions of government current expenditure (15.0 per cent in 1980, 26.2 per cent in 1985 and 27.7 per cent in 1990). In mid-1982, after winning the April general elections, the government reversed its earlier counter-cyclical public employment creation efforts and instead began an austerity drive and job freeze, slowing down employment creation. Subsequently, there were decreases in government expenditure in 1983, 1985 and 1987 (Figure 1). The government was fiscally prudent thereafter, extending privatization initiatives, from the mid-1980s until the 1997-98 crisis.
The recession of the mid-1980s also saw non-performing loans in commercial banks increasing to 30 per cent in 1987 and 1988. The Banking and Financial Institutions Act (BAFIA, 1989) was designed to strengthen prudential regulation and supervision after the banking crisis to avoid any recurrence. Foreign borrowing was limited, but lending for property, securities and consumption was not, and their shares of all loans were to increase and fuel real estate and stock prices bubble in the next decade, culminating in the 1997-98 financial crisis. 1991-1997
The government continued its policy of fiscal prudence into the 1990s, restraining increases in total, especially development expenditure, and fluctuating in the process (Figure 1 and Table 7). As the global economy recovered from the downturn of the early and mid-1980s, Malaysia’s export-oriented (EO) industries grew rapidly, and their growth, in turn, fuelled domestic demand due to their wealth and employment effects (Tables 9 and 10). The Malaysian economy grew by 8.7 per cent per annum in the period 1991-95 and by 8 per cent during 1988-97. Malaysia experienced labour shortages and had to import more labour. Rising wages in the tight labour market led to some automation which lowered the proportion of female workers, recruited into the more labour-intensive EO industries (Table 23).
Employment creation and Bumiputera participation in the modern sector were satisfactory, with Bumiputera comprising half of manufacturing employees by mid-1990s. There is no evidence of the Bumiputera employment requirement deterring FDI1, and ethnic wage discrimination was not explicit. However, there were relatively fewer skilled, semi-skilled, technical and professional workers in 1990 than in 1985 because of the lower skill requirements for new entrants into the most fast expanding industries. Despite the availability of the HRDF for training, skill formation was limited by the persistence of labour-intensive production with imported workers from neighbouring countries. Skilled male and female labour force participation only increased by about one per cent in the early 1990s.
The tight labour market raised wage levels, with higher increases for skilled labour. The nominal average monthly wage weighted by employment in manufacturing, construction, mining and rubber rose from RM574 in 1985 to RM790 in 1992, growing at 4.1 per cent per annum
1 The companies are supposed to report to the Ministry of International Trade and Industry (MITI) on an annual basis. In certain cases, the companies have to submit their reports to MITI every six months. Failure to do so merits a visit from MITI officials. In addition, companies are required to submit a headcount annually with detailed information on gender and ethnicity, to the Labour Department, under the Ministry of Human Resources.
23
during this period. The labour-intensive construction sector recorded the highest wage rise as it grew by a high 12 per cent. The average real wages for EO industries outgrew those for domestically oriented (DO) industries. Only wages for DO industries with high value-added and tariff protection were higher than for EO industries.
There is gender wage inequality, with men’s wages sometimes nearly twice as high as women’s wages and worse for considerable higher occupational categories (World Bank, 1995). The main reason for the large overall gender wage inequality is the predominance of female workers in low-wage activities. While there is little formal discrimination against women, subtle and informal discrimination is widespread in certain occupations and in promotion prospects.
Employment initiatives such as official job placement efforts for the handicapped and for rehabilitated drug addicts seek to overcome discrimination. For example, the government placed 1,434 rehabilitated drug addicts and 500 disabled persons in employment in 1995. The number of foreigners with valid work permits from 290,000 (4.3 per cent of the employed) in 1990 to 1.5 million in 1997, though unofficial estimates undocumented immigrant workers were one million in 1997 (Ministry of Finance, Economic Report, 1997/98: 25) – bringing the immigrant worker population to well over 28. per cent of the total employed. However, the impact of the training requirement has not been impressive. Despite the Double Deduction Incentive (DDI) aimed at encouraging training, overall private sector participation in training was inadequate to meet the demand for skilled labour (Malaysia, 1991). Feedback from firms suggests that the DDI was neither as well conceived nor as effectively implemented as investment incentives. The reasons cited for the lack of enthusiasm include rigid procedures, excessive red tape and unnecessary as well as burdensome queries by the government agencies involved. The DDI’s “spend first and claim later” approach was also viewed as risky since expenditure incurred could later be deemed non-deductible for income tax purposes. In addition, the DDI is not attractive to pioneer firms which pay no income tax anyway (DCT, 1999).
In comparison, the HRDF has had better results. In the first three years after inception, it trained over 800,000 workers, spending over RM165.5 million. Quality and productivity related skills accounted for more than a quarter of the training, facilitating progress into higher quality and higher value-added products. However, a World Bank study concluded that the “HRDF has had a significant role in increasing training among medium and large firms… but not small firms… Among purely domestic firms, HRDF has only been effective in increasing the training of large firms with over 250 employees” (Felker and Jomo, 2003). HRDF has thus encouraged companies to train their workers (contributing to continuous human resource development), mainly because they are entitled to a 50 to 80 per cent reimbursement of training costs if they send their workers to HRDF approved training institutes or programs.
Investment grew rapidly, from 32.7 per cent of GNP in 1990 to 45.8 per cent in 1995 (Table 14). Private investment was for more significant, increasing from 20.7 per cent of GNP to 32.7 per cent, compared to the 12.0 per cent to 13.0 per cent rise for public investment. At the same time, FDI fell from 5.5 per cent of GNP in 1990 to 4.3 per cent in 1995. Guimaraes and Unterberdoerster (2006) claim “sustained over-investments” in the (four) years prior to the 1998 crisis, with rapid increases in lending for property, securities and consumption (Table 26). Speculative inflows rose sharply from the early 1990s as the Malaysian authorities promoted its stock market in the financial capitals of the world (Figure 2).
In early 1994, the central bank responded to sudden massive outflows in late 1993 by tightening exchange controls such as by imposing statutory reserves and liquidity requirements for deposits, limits on net outstanding non-trade-related external liabilities, restrictions on sales of short-term monetary instruments to non-residents, requirements for
24
commercial banks to place ringgit funds of foreign institutions in non-interest-bearing vostro accounts with the central bank and forbidding non-trade-related swaps or outright forward transactions on the bid side for foreign clients.
These measures were repealed in August 1994 when pressure from short-term capital flows was said to have eased. The authorities also wanted new foreign investments in the stock market, which had been languishing after the introduction of the controls. Exchange controls were further relaxed in December 1994, ostensibly to reduce the costs of compliance, allow greater access to foreign credit facilities, enhance efficiency in cross-border transactions by residents and encourage multinational corporations to relocate their operational headquarters in Malaysia (Ariff, Mahani and Tan, 1997).
Further capital account liberalization in the face of greater speculative flows led to losses from mopping-up excess liquidity and coping with foreign exchange speculation. While providing some semblance of monetary and financial stability, Malaysia’s managed currency float against the greenback ensured export competitiveness against the rising yen during 1985-95. As with the currencies of other Southeast Asian newly-industrialized economies, the 1990 and 1994 devaluations of the renminbi and the reversal of the decade-long decline of the US$ against the yen in June 1995 pressured the dollar-pegged ringgit to appreciate. Imports of inputs and equipment for (non-tradable) construction and infrastructure also increased.
Speculative investments, with considerable flows into the property and stock markets, fuelled asset price inflation, mainly involving real estate and share prices1. Failure to diversify sufficiently into higher value-added production, due to inadequate or misallocated public investments and poor incentives for education and training, as well as limited internationally competitive indigenous industrial capacities, further jeopardized export and growth prospects, as Malaysia’s labour shortages and rising real wages exacerbated the problem. The 1997-98 Financial Crisis
Although portfolio inflows declined after the BNM’s control measures of early 1994, the controls were lifted later that year. Subsequent inflows were sufficient to cause sharp drops in the ringgit exchange rate following speculative attacks from early July 1997. The attacks by speculators spread from Thailand to other currencies in the region thought to be maintaining unsustainable US$ pegs, after sustained attacks on the Thai baht led to its floating on 2 July 1997. BNM put up an expensive fight at the cost of almost US$4 billion to defend the ringgit before abandoning the effort in mid-July. The depreciated ringgit increased the magnitude of the mainly privately-held foreign debt as well as the external debt-servicing burden. After reaching a peak of around 1300 in February 1997, the decline of the Malaysian stock market index was greatly worsened by the currency collapse as well as its repercussions for the banking system. The KLSE index had fallen by about four-fifths from its peak in the first quarter of 1997, to reach its nadir of 262 on 2 September 1998, the day after the announcement of capital controls on outflows. With the relatively higher stake of foreign portfolio investors in the Malaysian capital market, especially on the first or main board of the Kuala Lumpur Stock Exchange (KLSE), came its greater collapse. The proportionately very high capitalization of Malaysia’s share market meant that the adverse wealth effect of this
1 Some commentators claim that the resultant property price bubble has its roots in Japanese-type or more generically East Asian culture, norms and relations which ‘compromise’ hands-off relations between the state and the private sector as well as among businesses, instead involving welfare-reducing, if not debilitating rent-seeking behaviour. In so far as such relations are believed to exclude outsiders, their elimination was believed to contribute to levelling the playing field and to bringing about an inevitable convergence towards supposedly Anglo-American style arms-length market relations.
25
collapse was probably greater than elsewhere in the region. Besides the stock market, the property sector was also adversely affected by asset price deflation, with significant consequences for the banking sector, e.g. due to the declining value of collateral, etc. The reversal of the property sector’s fortunes also adversely impacted the construction sector as well as supplier industries. Compared to other East Asian economies hit by the 1997-98 crisis, Malaysia’s foreign loans were relatively low despite significant increases in 1996 and the first half of 1997. In fact, Malaysia’s sovereign debt decreased after the crisis of the mid-1980s (Table 24), and foreign borrowings were limited by the 1989 BAFIA. Foreign borrowings as a proportion of funds raised by the private sector decreased from 23 per cent in 1980-85 to 14 per cent in 1990-96 (BNM). Further, most of these borrowings were not short-term in nature in spite of Malaysia’s open economy and the widespread use of short-term trade credit.
In late August 1997, the authorities designated the top one hundred indexed KLCI share counters, i.e. requiring actual presentation of scrip at the moment of transaction (rather than later, as was the practice), ostensibly to check “short-selling”, which was exacerbating the stock market collapse.
After the government cut proposed spending in its counter-cyclical mid-October 1997 Budget for 1998 in early December 1997, BNM also raised its 3-month intervention rate from 8.7 per cent in December 1997 to 11.0 per cent in early February 1998. It re-defined non-performing loans (NPLs) as loans in arrears for more than 3 months (reduced from the previous 6 months), exacerbating the liquidity squeeze. Banks were also required to have higher statutory reserve requirements.
Such contractionary pro-cyclical measures helped transform the currency crisis into a more general economic crisis. In the wake of the currency collapse, interest rates rose – reflecting tighter liquidity as money supply contracted due to capital flight in response to the currency devaluation, the reversal of capital inflows (due to foreign bank lending), and tighter central bank monetary policy (as demanded by financial markets and the IMF). Credit growth slowed down and barely rose after September 1998 despite central bank directives to increase credit growth to 8 per cent in both 1998 and 1999.
Poor loan recovery further reduced liquidity and constrained the financial system, eventually limiting potentially expansionary economic activity and leading Malaysia (as well as its neighbours) into recession. In Malaysia, GDP growth fell from 10.0 per cent in 1996 to 7.5 per cent in 1997 and -7.5 per cent in 1998 (Table 9). The largest sectoral decline in 1998 was by -13.4 per cent for manufacturing.
In December 1997, the government sought an IMF recommended budgetary surplus in 1998, but later opted again in mid-1998for a budgetary deficit to counter the downturn. Construction grew by 24.0 per cent in 1998, its collapse delayed by building for major events such as the Commonwealth Games and the Asia-Pacific Economic Cooperation (APEC) Summit in Kuala Lumpur, as well as the new Putrajaya administrative capital and other infrastructure projects. Given the heavy exposure of KLCI’s top one hundred counters to the property sector, these measures probably delayed corporate distress. Increased lending quotas for share purchases also helped boost the stock market. Consumer credit was encouraged, particularly for vehicle and residential property purchases.
Danaharta, Danamodal and the Corporate Debt Restructuring Committee (CDRC) were set up in mid-1998. Danaharta was set up to “take out” NPLs from the portfolios of the worst affected banks and financial institutions, while Danamodal was set up to re-capitalize the banking sector. CDRC was set up to mediate between borrowers and creditors to facilitate debt restructuring without legal action and/or liquidation. Government-controlled funds, such as the EPF, Petronas (the national petroleum corporation) and Khazanah (the investment holding arm of the Treasury), were used to buy over failing projects, including privatized
26
projects which had suffered losses. Much of this was perceived as bailing out politically-connected and influential corporate interests.
Malaysia pegged the ringgit at US$1=RM3.80 from 2 September 1998. Offshore ringgit trading was banned while export and import of the ringgit as well as ringgit loans to non-residents were restricted. The peg probably gave some desperately needed stability, and helped corporate planning and recovery. Non-residents were also compelled to retain portfolio investments for at least 12 months from September 1998, , these new regulations were revised again from 15 February 1999. A levy, declining with time to zero in September 1999, was imposed instead. A flat 10 per cent levy on repatriated profits from portfolio investments was imposed from 21 September 1999 until 2001. The levy was later abolished. Social Impact
Malaysia’s dependency on imports led to a burst of inflation as the ringgit exchange rate fell. Escalating food prices were particularly burdensome in 1998 (Table 27). However, the weaker exchange rate after the start of the crisis in 1997 gave Malaysian exports a new competitive edge. Despite massive labour immigration, real wages had risen in the fast-growing, full employment economy of the early and mid-1990s, with the labour situation especially tight for some skilled and white-collar work.
Nonetheless, employment opportunities decreased as the economy contracted (Table 16) and retrenchments increased from 1997 to 1998 (Table 28). The impact of the financial crisis on employment was most pronounced in construction. Changes in EPF contributions broadly parallel formal sector wage employment and contribution rates. The number of net additional EPF contributors declined by 17.5 per cent from 186,805 for the first eight months of 1997 to 154,029 for the same period in 1998. However, the deportation of foreign workers reduced the rise in official unemployment rate. The number of work permits issued to foreign workers dropped from 1.2 million in 1997 to 0.78 million in 1998 (Bank Negara Malaysia, Annual Report: 77), as official unemployment rose to 3.2 per cent as labour supply fell by 1.7 per cent.
While the most devastating impact of the recession was on those who lost jobs, it also adversely impacted others who did not lose their jobs. After the growth rate of average wages increased from 4.4 per cent in 1995 to 20.9 per cent in 1996, the rate slowed down to 5.9 per cent in 1997 and -2.7 per cent in 1998 (Economic Report, various issues). Wages form a significant proportion of total household incomes. For many households, especially those with low and medium incomes, wages are the principal source of income. In a recession, reductions in economic activity – and consequently, in demand for labour – push wages down. Malaysian unions have limited membership and influence, often failing to safeguard workers’ wages. While the welfare of low-income groups may not receive much media coverage or policy attention, their plight is nonetheless real. Most experienced lower real incomes because of reduced overtime work opportunities (on which many workers depend for supplementary incomes), lower nominal wage rates and price inflation, exacerbated by currency depreciation (Ishak, et al., 1999: 42).
Women comprised about 45 per cent of the labour force, but a higher portion of women were registered as job-seekers, suggesting higher female unemployment (Table 29). The majority (65 per cent) of retrenched women were in manufacturing, where weaker unionization among women as well as other cultural and structural factors made them more vulnerable to coercion and exploitation.
Public Service Department data, updated in April 1999, show the majority of government employees at the second lowest rung on the salary scale, with 44.5 per cent receiving RM500-1,000 monthly, 29.6 per cent receiving RM1,001-1,500, while 12.4 per cent were paid RM1,501-2,000. However, lower wages have been compensated for by the greater
27
financial and psychological security of public sector employment as public sector employment is generally secure for life.
Not long after the onset of the 1997-98 financial crisis, wages in the public sector were reduced or frozen, as part of the early government response to the crisis. Government employees later gained from the government’s counter-cyclical spending increases from mid-1998, including a RM7 billion fiscal stimulus package (Malaysia, 1999b). Civil servants also benefited from government inducements for political support, e.g. in the wake of the 1998-99 political crisis, before the November 1999 general elections, or in 2007 before a much anticipated early general election.
The Ministry of Human Resources established the Human Resource Development Fund (HRDF) to, among others, retrain retrenched workers. Only 572 workers benefited from the fund in 1998, and another 426 in 1999. These were mainly skilled, rather than unskilled workers. The disparities between the average wages for skilled and semi-skilled labour and those for unskilled labour increased slightly between 1995 and 1999 (Table 23). Counter-cyclical fiscal policy in the aftermath of the crisis was pro-growth, rather than pro-equity.
The overall incidence of poverty has declined since the launch of the NEP, from 49.3 per cent in 1970 to 6.1 per cent in 1997 before the crisis (Economic Report, 2003/2004). The crisis saw a temporary reversal, with the poverty rate rising to 7.6 per cent in 1998 and 8.5 per cent in 1999. Urban poverty increased from 2.1 per cent in 1997 to 3.3 per cent in 1999, while rural poverty increased from 0.9 per cent to 14.8 per cent (Economic Report, 2006/2007). The efficacy of official policies – e.g. RM100 million allocation to Amanah Ikhtiar Malaysia (AIM) for the provision of interest-free loans to the very poor, RM200 million for a micro-credit scheme to assist petty traders and hawkers in urban areas (Malaysia, 1999b: 48) – in actually addressing poverty is difficult to ascertain, though such efforts increased during the downturn, especially from mid-1998.
Though nominal household income continued to grow in the 1990s, household income remained serious and worsened ethnic inequality most among Chinese (Table 30). Since many of the predominantly urban Chinese were worse off due to the crisis, inter-ethnic disparities improved, as did the urban-rural gap. 1999-2007
The government continued to maintain budget deficits after 1998, e.g. for the Eighth (2001-2005) and Ninth (2006-2010) Malaysia Plans (Table 12). As domestic debt increased, it sought long-term foreign financing to smoothen repayments and then made early settlements when the opportunity arose to reduce its external debt as well as debt servicing (Table 13). The government also relaxed access to foreign exchange, including access to foreign funds for export businesses to reduce the costs of borrowing and increase competitiveness. Limits to Malaysian investments overseas, in the form of FDI or portfolio investments, were also lifted in the hope of eventually increasing investment incomes from abroad.
However, private investments have remained sluggish, falling from 15.9 per cent of GNP in 2000 to 11.9 per cent in 2005 – far below the pre-crisis level (Table 14). Ironically, the dominance of the property sector in commercial bank lending from the 1980s has grown since the crisis (Table 26). Guimaraes and Unterberdoerster (2006) suggest that sluggish investments in recent years reflected excessive earlier investments, particularly in the property sector, with its more durable “capital stock” and slower adjustment characteristics. They also argued that lower profitability has adversely affected investments in manufacturing, consumer goods and services. While the share of domestic loans for broad property and consumer credit has continued to grow, the domestic savings-investment gap has narrowed (Table 14).
28
Except for increased growth of agriculture, forestry and fishing (Table 9) and of commodity exports (Tables 15 and 21), overall growth has been much slower after 1998 compared to the previous decade.
The creation and strengthening of domestic linkages for heavy industries the diversification of manufactured exports and the development of resource-based industries besides palm oil processing have all been slow. Malaysia still mainly imports capital and intermediate goods (Table 20). While the merchandise trade surplus, as well as earnings from tourism and travel have continued to increase, the services trade account still registers deficits (Table 11). FDI as well as portfolio investments have also picked up again (Table 14 and Figure 2), albeit more modestly, while investment income continues to raise the services deficit.
The mid-2005 ringgit float saw a minimal appreciation in the exchange rate. Meanwhile, Prospects for increased manufacture and exports of electronic goods seem bleak while no new growth sectors have emerged.
The authorities have taken the opportunity to consolidate the banking sector through directed mergers and acquisitions. In mid-1999, the government announced a controversial scheme to merge all commercial banks, merchant banks and finance companies into six groups decided by the authorities. Widespread unhappiness with the scheme obliged the government to suspend the scheme before the November 1999 general election. In early 2000, however, the Prime Minister announced an amended scheme for ten – instead of six – groups. The four additional “anchor groups” were all led by bankers with personal connections to the Prime Minister, three of whom were previously thought to have fallen from grace. The process of consolidation has since proceeded, though quite differently from what was as anticipated, it is unclear that though the new groups will be able to survive foreign competition when the time comes.
Bank mergers have increased the capitalization of the remaining banks, ostensibly for the purpose of improving their competitiveness and resilience in the face of greater financial globalization. Most bank workers and owners had opposed the government-determined mergers, the former for fear of losing employment or having to accept poorer work conditions, and the latter to protect their interests in the face of likely takeover by others.
Similarly, the moves to privatize public health services have evoked suspicion of cronyism, poorer public services and higher patient charges. Contracts for various components of public health services have already been given to favoured, suppliers, resulting in increasing costs. Changes have also been made to various regulations to encourage the development of private health services for both local and foreign users. Given the shortage of health personnel and increasing demand for healthcare, low-income groups will probably have reduced access to poorer services.
Although overall employment creation has picked up (Table 16), it has been insufficient to reduce the official unemployment rate (Table 2). Employment creation has slowed down in manufacturing, the largest employment category after services (Table 10). The less developed states, especially Sabah, Sarawak and Terenganu, continue to have relatively high unemployment rates (Table 22). With the decline of employment in garments and electronics manufacturing, female labour participation in manufacturing has also continued to decrease (Table 23).
As before, the GDP growth rate in recent years continues to exceed employment increases, indicating improvements in worker output or productivity, though Malaysia’s labour costs are considered less competitive than many of its neighbours, including China and India. The growth of real average wages picked up from -2.7 per cent in 1998 to -1.7 per cent in 1999 and 12.3 per cent in 2001, before slowing down to 3.4 per cent in 2002 and –7.5 per cent in 2005 (Economic Report, various issues).
29
Meanwhile recent oil price increases and the Malaysian Government’s withdrawal of fuel subsidies have reduced real wages. Based on a Consumer Price Index (CPI) of 100 in January 2003, the CPI increased to 101.0 in December 2003, 103.1 in December 2004, 106.7 in December 2005 and 109.4 in July 2006 (calculated with data from BNM Monthly
Statistical Bulletin, various issues). After picking up from 3.4 per cent in 2001 to 10.1 per cent in 2002, the growth rate of average real wages declined to 3.7 per cent, -2.8 per cent and -7.5 per cent in 2003, 2004 and 2005 respectively (Economic Report, various issues).
With economic recovery, the number of immigrant workers with work permits rose to 1.9 million by 2005. The Malaysian labour force has improved its educational profile over the decades (Table 31) as the government remains committed to education and human resource development. HRDF-approved financial assistance had risen to almost RM114 million and the number of trainees rose to 301,791 by 2000 (HRDC, 2000: Table X). However, there have been significant increases in unemployment among the better educated (Table 32). Summary
Malaysia has had relatively low unemployment rates since Independence compared to most other developing countries, and it has been government policy to keep unemployment down. Government efforts to maintain rapid economic growth and accelerate structural change from a predominantly agricultural economy to a developed, industrialized economy have created better employment opportunities for its growing labour force.
Malaysia’s open economy has been profoundly influenced by the global economy, especially those aspects with a stronger bearing on its economy. Poverty was widespread in the early years, especially in peasant agriculture. Growth came with new land development and agricultural modernization, though falling world prices for agricultural commodities have countered this trend. The agriculture sector continued to grow until the 1980s with the expansion of land cultivation, but recent expansion has been limited to the Borneo states of Sabah and Sarawak since. Agricultural prices remain subject to the vicissitudes of the global market.
Labour-intensive export-oriented industrialization has directly created many employment opportunities in the 1970s and 1980s, especially for women in electronics and garments. However, such employment has also been more vulnerable to changing international demand as other more competitive production sites have emerged, e.g. in China. Skilled labour has commanded a premium over unskilled labour, with the wage rates of the latter growing in tight labour conditions, prompting automation and demand for specific skills.
Growth and employment generation have been achieved with both public and private investments, which have made different contributions over time for various reasons. Public investments have taken the form of land development for expansion of agricultural cultivation and infrastructure to encourage manufacturing industries. Private investments are subject to investor sentiments and perceptions. Savings were mobilized for investments – public investments have drawn heavily on EPF “forced savings”, while private investments have drawn on credit facilities which have also contributed to asset price bubbles. Besides compulsory savings through the EPF, banking facilities and regulations were designed to encourage savings.
Government Interventions
Fiscal conservatism through the 1960s was replaced by the expansionary policies of the 1970s in the first decade of the NEP and the financing of heavy industries in the early 1980s. Escalating public debt led to fiscal contraction and privatization from the mid-1980s to reduce government financial burdens, when tax revenues fell drastically following world economic
30
recession and lowered tax rates ostensibly due to “tax competition” in the region to attract investments. Growth in manufacturing, including resource-based exports, from the late 1980s increased domestic demand, spurring further growth.
The government has generally been more sympathetic to investor over labour interests. Trade unionism has been curbed to encourage private investments. There is no minimum wage rate, again to attract investors. Although facilitating investment, and thus creating employment, such measures have failed to ensure “decent work”.
Inflation has generally been low and the prices of essential goods have also been limited by administrative measures. Nevertheless, the open economy has been adversely affected by international oil price increases, food price hikes, falling exchange rates and asset price collapses. Monetary and exchange-rate policies have generally served the interests of the real economy, in order to facilitate growth, e.g. by providing credit for productive investments. However, the unprecedented increase in lending for speculative property and securities purchases from the 1990s rendered the financial system, and ultimately, the real economy as well, much more vulnerable to exchange-rate speculation and the financial crisis of 1997-98. State intervention in Malaysia has been of much poorer quality and considerably less effective than in the first-tier newly industrialized East Asian economies of South Korea, Taiwan and Singapore for various reasons. Instead, there has been much more state intervention motivated by non-developmental considerations, especially in Malaysia and Indonesia (Jomo, et al., 1997). Such interventions – often cited as evidence of “crony capitalism” – bear some responsibility for the vulnerability of the second-tier Southeast Asian NICs to the factors that precipitated the financial crisis in the region from mid-1997. Even more importantly, such interests influenced government policy responses in ways that exacerbated the crisis. In other words, while “crony capitalism” does not really explain the origins of the crisis, except in so far as crony financial interests were responsible for the financial policies from the mid-nineties that led to the crisis, it exacerbated the crisis in Malaysia. Besides efforts to rescue “cronies” in distress, there have also been efforts by the politically best connected and those who came through the crisis relatively strong to consolidate and extend their business interests (e.g. by influencing the bank mergers). In practice, restructuring efforts have been largely aimed at increasing the share of Bumiputera capital as well as the number of Bumiputera businessmen and professionals by using the public sector and state intervention extensively. The NEP’s restructuring prong mainly involves redistribution of corporate stock ownership, employment and education, with the latter two sometimes considered together. Thus, wealth restructuring – particularly the 30 per cent target for Bumiputera share ownership by 1990 – remains the main concern in most discussions about the NEP. Bumiputera trust agencies were set up to expand Bumiputera share ownership. The focus is on ownership of the modern corporate sector, though only a small minority of the population is actually involved, reflecting the dominance of capitalist interests in defining supposed ethnic or communal interests. More generally, the redistribution of wealth ownership – whether of shares or other wealth – mainly involves the interests of small elite.1
1 The high concentration of share capital ownership within each ethnic community was almost definitely
understated in the case of the ASN during the 1980s, and the ASB since then. Although well over two million Bumiputeras were involved by the late 1980s, the vast majority had invested RM500 or less, while about 1.3 percent of all eligible Bumiputeras owned 75 per cent of all ASN shares!
31
Trade and Currency Controls
Malaysia has maintained a relatively free trade regime since colonial times – with the exception of tariff protection to encourage import-substituting industrialization from the early 1960s and heavy industrialization from the early 1980s. The scope and statutory rates of import duties have been progressively reduced with participation in GATT, the WTO, regional trade arrangements and bilateral free trade agreements.
Malaysia has also maintained an undervalued exchange rate policy since the mid-1980s. The capital account has been kept open, until briefly in 1998-99, to encourage foreign investor confidence. Speculative inflows were discouraged in early 1994 after massive capital flight from the stock market at the end of 1993, but the controls were lifted later that year. Currency controls were introduced in September 1998, fourteen months after the Asian financial crisis began in Bangkok in July 1997.
The public-sector debt grew sharply in the 1970s, with the government borrowing heavily from domestic sources, especially the EPF. Public sector foreign debt rose sharply in the early 1980s, and was reduced after the Southeast Asian currency devaluations of the mid-1980s. The 1989 BAFIA imposed much tighter regulation and supervision of commercial banking. Nonetheless, regional contagion, currency speculation and the flight of portfolio investments led to the 1997-98 crisis and ensuing recession. Subsequently, the government temporarily imposed currency controls as well as a ringgit peg to the US dollar.
It is not possible to definitively prove that the controls were crucial for Malaysia’s recovery from the 1997-98 crisis as other economies in the region recovered around the same time. After all, capital controls were imposed after 14 months of capital flight, i.e. almost like closing the stable doors after the horses have bolted. Malaysia recovered from the second quarter of 1999, after South Korea, Thailand and Indonesia began recovering from the last quarter of 1998. Also, the Malaysian recovery was weaker than South Korea’s, but stronger than Thailand’s (Jomo, 2001a: 45).
However, there is also no proof that the September 1998 control measures were the disaster that doomsayers claimed they would be. Kaplan and Rodrik (2001) suggest that the controls may have averted another crisis “yet to come”, which had been building up in mid-1998 as overnight ringgit interest rates in Singapore rose to 40 per cent. However, others claim that this speculative market was too “thin” to make much difference.
Regional monetary instability had been reduced after the US Federal Reserve Bank lowered interest rates, allowing East Asian currencies to appreciate and stabilize. With Thai interest rates – much higher than Malaysia’s before the crisis – falling below Malaysia’s, the claim of success for the controls is difficult to prove (Jomo, 2001b: 31). The government also set up special vehicles to help the banking sector handle NPLs and to re-capitalize the sector. It has also forced bank mergers, ostensibly to increase bank capitalization to increase their resilience in the face of the imminent opening up of the banking sector to foreign banks.
The Domestic Economy
There are weak linkages between many export-oriented industries and the domestic economy. Although FDI in free trade zones and licensed manufacturing warehouses directly created many employment opportunities, linkage effects were diminished by substantial imports of semi-processed goods, machinery and equipment. In the early 1990s, rapid export-led growth increased domestic demand, leading to the growth of domestically oriented industries and increasing wage rates, as labour supply tightened and escalating costs reduced the competitiveness of manufactured exports from Malaysia.
Some import-substituting industries have been over-protected and have become quite burdensome. Furthermore, the small domestic market has limited domestically-oriented industrial expansion and employment creation. Rising domestic sales have positive effects on
32
import-substituting industrial sector growth. The predominantly Malaysian-owned small manufacturing and service firms continue to face significant financial constraints (Guimaraes and Unterberdoerster, 2006).
Conclusion
The generation of employment opportunities and improvements in workers’ living standards have mainly been sustained by economic growth, facilitated by investments in response to increasing domestic as well as foreign demand. Political stability, investor sentiment as well as financial and exchange rate stability have encouraged both domestic investments and FDI. Infrastructure provision, labour availability, other inexpensive inputs and tax incentives have all increased returns, thus encouraging investments. This underscores the need for expansionary fiscal policy with appropriate government interventions, including “crowding-in” public investments.
Financial resources for domestic investments include corporate savings and credit availability. Investments have been facilitated by increases in income from growth, as well as a developed banking and financial system. While a developed banking and financial system provides credit facilities, the government may have to direct credit to appropriate sectors for long-term development and employment creation. Domestic investments in Malaysia have long been augmented by FDI, seeking to maximize returns from the protected domestic market or more competitive exports. Skills training for capital-intensive industries can help address some labour shortages and increase wage rates, while also increasing domestic demand to generate further growth and employment opportunities.
Financial, including capital account liberalization successfully encouraged inflows of foreign portfolio investments. The exchange rate has been maintained within a band to minimize disruptive fluctuations, as a hard peg is more expensive to maintain and is more likely to cause market inflexibility and distortions, possibly hindering long-term development. Macroeconomic policy should give priority to overall economic stabilization, especially of the real economy, rather than the current international fad of consumer price stability through inflation targeting.
Recent job losses and price drops have enhanced doubts about the likely welfare gains from further export-oriented industrialization. Generic manufactured goods not enjoying strong intellectual property rights – and the associated protection of monopoly rents – have been almost as vulnerable to downward price pressures as primary commodities. Consequently, productivity gains have not been translated into commensurate welfare gains for producers. The advent of China, India and other lower cost producers in similar production niches in global commodity chains threatens a “race to the bottom” with the intensification of competition. Much will therefore depend on whether Malaysia will be able to constantly transform itself to stay ahead of its competition. However, it is unclear how sustainable short-term successes in particular product niches will be in the medium to long term as suggested by the recent experiences with electronics and garments production.
Education and training increase labour productivity, and life-long learning facilitates technological progress. While the government provides basic facilities and services, private producers should train employees to improve their own competitiveness. Rising wages before the increasing unemployment during recessions have sparked debates on wage rigidity and demands by employers for wage reforms. Though less than one-tenth of wage employees are unionized, their incomes influence wages in the non-unionized sector. Wages in the unionized sector are generally determined through three-yearly collective agreements, without flexibility in the interim, e.g. fixed annual increments and bonuses proportional to basic salaries. In dispute settlements, the Industrial Court normally
33
recommends salary adjustments not exceeding two-thirds of the CPI growth rate over the previous three years.
Meanwhile, the World Bank (1995) has been promoting the flexi-wage system. Besides bonuses, Malaysian employers use overtime payments and non-wage incentives to retain wage and employment flexibility, and to lower labour turnover. For example, though bonuses are collectively bargained, more than half the bonuses paid in manufacturing in 1992 were incentive bonuses, and the ratio in services was even higher.
Increasing liberalization and globalization will reduce the power of the state and increase the power of market forces. The government should therefore strengthen institutions and mechanisms to balance between and link enhancing competitiveness with improving labour conditions. Pressures to improve labour standards resulting from rapid socioeconomic development and rising public awareness and expectations as well as external pressures by international trade union organizations and other activist groups need to be addressed. There is a special need to engage the trade unions in facilitating the development of a greater sense of participation in the workforce.
34
References
Alavi, R. (1996). Import-substitution industrialisation: Infant industries in Malaysia. Routledge, London.
Ariff, Mohamed, Z. A. Mahani and E. C. Tan (1997). Trade and Investment Policies in Developing Countries: Malaysia Case Study. Institute of Developing Economies, Tokyo.
Asian Development Bank. www.adb.org/Documents/Books/Key_Indicators/2003/xls (accessed on 31 January 2004)
Canadian Policy Alternatives, undated. http://www.policyalternatives.ca/publicatons/ snakes-and-ladders.pdf (accessed on 31 January 2004)
DCT Consultancy Services Sdn Bhd (1999). “Profile of Export Processing Zones in Malaysia.” Processed.
Felker, Greg, & Jomo K. S. (2003). “New Investment Policies in Southeast Asia”. In Jomo K. S. [ed.]. Paper Tigers In Southeast Asia? Behind Miracle And Debacle.
Palgrave, Houndmills. Ghazali Atan (1990). “An empirical evaluation of the effect of foreign capital inflows on the
economy of Malaysia, 1961-1986”. Ph D thesis, International Development Centre, University of Manchester, Manchester.
Guimaraes, Robert, and Olaf Unterberdoerster (2006). “What’s Driving Private Investment in Malaysia? Aggregate Trends and Firm-Level Evidence”. August, International Monetary Fund, Washington, D. C.
HRDC (2000). Annual Report, 2000. Human Resource Development Council, Malaysia, Kuala Lumpur
Ishak Shari, et al. (1999). “Social Impact of Financial Crisis: Malaysia” Report submitted to the United Nations Development Program, Kuala Lumpur.
Jomo (2001a). “From Crisis to Recession”. In Jomo. K. S. (ed.). Malaysian Eclipse: Economic Crisis and Recovery. Zed Books, London.
Jomo (2001b). “Financial Crisis and Macroeconomic Responses to the 1997-8 Financial Crisis in Malaysia”. Paper prepared for the workshop on macroeconomic policies and employment, Bangkok, December.
Jomo K. S. (ed.) (2002). Ugly Malaysians? – South-South Investments Abused. Institute for Black Research, Durban.
Jomo K. S., with Chen Yun Chung, Brian C. Folk, Irfan ul-Haque, Pasuk Phongpaichit, Batara Simatupang, Mayuri Tateishi (1997). Southeast Asia’s Misunderstood Miracle: Industrial Policy and Economic Development in Thailand, Malaysia and Indonesia. Westview, Boulder.
Jomo K. S., Chang Y. T., Khoo K. J. with others (2004). Deforesting Malaysia: The Political Economy and Social Ecology of Agricultural Expansion and Commercial Logging. Zed Books, London.
Jomo, K. S and Patricia Todd (1994) Trade Unions and the State in Peninsular Malaysia. Kuala Lumpur: Oxford University Press.
Kaplan, Ethan, and Dani Rodrik (2001). “Did the Malaysian Capital Controls Works?” NBER Working Paper 8142, National Bureau of Economic Research, Cambridge, MA.
Khoo Khay Jin (1980). “The Marketing of Smallholder Rubber”, Kamal Salih (ed.). Rural-Urban Relations, Special Studies in the Malaysian Case UNCRD Project 50R, Study No. 6, School of Comparative Social Studies, Universiti Sains Malaysia, Penang.
35
Malaysia (1971). The Second Malaysia Plan, 1971-1975. Economic Planning Unit, Kuala Lumpur.
Malaysia (1973). Mid-Term Review of the Second Malaysia Plan, 1971-1975. Economic Planning Unit, Kuala Lumpur.
Malaysia (1976). The Third Malaysia Plan, 1976-1980. Economic Planning Unit, Kuala Lumpur.
Malaysia (1981). The Fourth Malaysia Plan, 1981-1985. Economic Planning Unit, Kuala Lumpur.
Malaysia (1986). The Fifth Malaysia Plan, 1986-1990. Economic Planning Unit, Kuala Lumpur.
Malaysia (1989). Mid-Term Revie of the Fifth Malaysia Plan, 1986-1990. Economic Planning Unit, Kuala Lumpur.
Malaysia (1991a). The Sixth Malaysia Plan, 1991-1995. Economic Planning Unit, Kuala Lumpur.
Malaysia (1991b). The Second Outline Perspective Plan, 1991-2000. Economic Planning Unit, Kuala Lumpur.
Malaysia (1996). The Seventh Malaysia Plan, 1996-2000. Economic Planning Unit, Kuala Lumpur.
Malaysia (1999a). Mid-Term Review of the Seventh Malaysia Plan, 1996-2000. Economic Planning Unit, Kuala Lumpur.
Malaysia (1999b). White Paper: Status of the Malaysian Economy. Government of Malaysia, Kuala Lumpur.
Malaysia (2001a). The Third Outline Perspective Plan, 2001-2010. Economic Planning Unit, Kuala Lumpur.
Malaysia (2001b). The Eighth Malaysia Plan, 2000-2005. Economic Planning Unit, Kuala Lumpur.
Malaysia (2003). Mid-Term Reviewof the Eighth Malaysia Plan, 2000-2005. Economic Planning Unit, Kuala Lumpur.
Malaysia (2006). The Ninth Malaysia Plan, 2006-2010. Economic Planning Unit, Kuala Lumpur.
Malaysia, Accountant-General Malaysia, Federal Public Accounts, various issues. Accountant-General Malaysia, Kuala Lumpur.
Malaysia, Bank Negara Malaysia. Annual Report, various issues. Bank Negara Malaysia, Kuala Lumpur.
Malaysia, Bank Negara Malaysia. Monthly Statistical Bulletin, various issues. Bank Negara Malaysia, Kuala Lumpur.
Malaysia, Department of Statistics. Annual Survey of Manufacturing Industries, various issues. Department of Statistics, Kuala Lumpur.
Malaysia, Department of Statistics (1977). General Report of the Population Census of Malaysia, 1970. Department of Statistics, Kuala Lumpur.
Malaysia, Department of Statistics. Industrial Survey, various issues. Department of Statistics, Kuala Lumpur.
Malaysia, Department of Statistics. Labour Force Survey, various issues. Department of Statistics, Kuala Lumpur.
Malaysia, Department of Statistics, Monthly Consumer Price Index. Department of Statistics, Kuala Lumpur.
Malaysia, Department of Statistics. Yearbook of Statistics, various issues. Department of Statistics, Kuala Lumpur.
Malaysia, Ministry of Finance. Economic Report, various issues. Ministry of Finance, Kuala Lumpur.
36
Malaysia, Ministry of Human Resources (2000). Labour Market Report, 1999. Ministry of Human Resources, Kuala Lumpur.
Malaysian Institute of Economic Research. “Malaysian Economic Outlook”. www.mier.org/surveys/ (accessed on 26 September 2006).
MITI (1996). Second Industrial Master Plan, 1996-2005. Ministry of International trade and Industry, Kuala Lumpur.
Narayanan, Suresh (1986). “Sectoral Tax Incidence in an Open Economy: a Study of Peninsular Malaysia”. Ph D thesis, Boston University, Boston.
Ong Hong Cheong (1998). “Coping with capital flows and the role of monetary policy: the Malaysian Experience, 1990-95”. In C. H. Kwan, Donna Vandenbrink and Chia Siow Yue (eds). Coping with Capital Flows in East Asia, Institute of Southeast Asian Studies, Singapore and Nomura Research Institute, Tokyo.
Ragayah Mat Zin (2008). “Sharing the Pie: Reviewing Income Distribution Policies in Malaysia”. Paper presented at “The 6th International Malaysian Studies Conference”, Kuching, 5 – 7 August.
Rasiah, Rajah (1995). Foreign Capital and industrialization in Malaysia. Macmillan, London. Rasiah, Rajah (1996). “Changing organization of work in the electronics industry in
Malaysia”. Asia Pacific Viewpoint, 37 (1). Rasiah, Rajah (2002). “Manufactured exports, employment, skills and wages in Malaysia”.
Processed, International Labour Office, Geneva. Rasiah, Rajah, H. Osman-Rani, and Rokiah Alavi (2000). “Changing dimensions of
Malaysian trade: beyond neoliberal and dirigiste approaches”. International Journal of Business and Society, 1 (1).
Wee Chong Hui (2006a). Fiscal Policy and Inequality in Malaysia. Universiti Malaya Press, Kuala Lumpur.
Wee Chong Hui (2006b). Regional Disparities and Federalism in Malaysia. Universiti Malaya Press, Kuala Lumpur.
Wee, Victor Eng Lian (1997). “An Analysis of Tax Reform in Malaysia”. Ph D thesis, University of Bristol, Bristol.
World Bank (1980). World Development Report. Oxford University Press, New York. World Bank (1995). Enterprise Training, Technology, and Productivity. World Bank,
Washington, D.C.
37
Tables and Figures
Table 1. Malaysia: Economic indicators, 1971-2005
1971-80 1981-90 1991-97 1998-2005
GDP growth % p. a. 7.5 6.0 9.2 5.3
CPI inflation, % p. a. 5.9 3.8 3.6 1.9
1970 1980 1990 1995 2005e
Per capita GNP (RM) 1,071 3,734 6,513 10,710 18,040
Per capita GNP (USD) 348 1,715 2,414 4,119 4,772
Unemployment rate 2.4 5.6 6.0 2.8 3.5
Inflation (%) 1.9 6.7 3.1 3.4 3.0
RM/USD 3.078 2.218 2.698 2.538 3.78a a The ringgit was pegged as US$1 = RM3.80 for September 1998-May 2006 e Estimate
Sources: Ministry of Finance, Malaysia, Economic Report, various issues. Table 2. Malaysia and the Miracle East Asia: Unemployment rate, 1986-2005 (%)
Malaysia Singapore Hong Kong Thailand
1986 8.3 6.5 2.8 3.5
1990 5.1 2.0 1.3 2.2
1995 3.1 2.0 3.2 1.1
2000 3.1 3.1 4.9 2.4
2005 e 3.6 3.6 7.9
(2003) 2.1
(2004) e Estimate
Sources: Ministry of Finance, Malaysia, Economic Report, various issues
Table 3. East Asia: Marginal effective tax rate, 1989 (%)
Marginal effective tax rate (%)a Statutory Rate
All equity 50% debt
Hong Kong 18.5 17.3 9.6
Indonesia 35.0 41.6 34.1
Japan 33.3 39.2 29.4
Korea 30.0 33.1 24.6
Malaysia 40.0 32.0 20.5
Philippines 35.0 40.4 31.9
Singapore 40.0 28.4 15.2
Taiwan 25.0 31.0 28.0
Thailand 35.0 24.9 18.6 a Difference in rates of return before and after tax Source: Pellechio, Sirat and Dunn (1989), cited in Wee (1997: Table 4.16)
38
Table 4. Malaysia: Population, labour force and labour participation
1970 1980 1991 1995 2005 e
Population (million) 10.44 13.14 17.56 20.70 26.13
Labour force (thousand)
3.61 5.12 7.04 8.14 10,927
Labour force participation rate (%)
65.3 58.9 66.6 66.9
66.0
Male 87.6 84.3 85.7 86.8 85.2
Female 43.1 41.5 47.5 47.1 45.8 e Estimate
Sources: Department of Statistics, Labour Force Survey, various years.
Table 5. Malaysia: Employment status, 1980-2005
1980 1992 1995 2000 2005
Employer 3.8 2.8 2.5 2.8 3.4
Employee 58.3 71.4 72.6 74.5 75.7
Own account worker 27.0 18.3 18.3 16.9 16.6
Unpaid family worker 11.0 7.5 6.6 5.8 4.5
Total 100.0 100.0 100.0 100.0 100.0 Sources: Calculated with data from Department of Statistics, Malaysia; Labour Force Survey, various years; Annual Survey of Manufacturing Industries
Table 6. Malaysia: Employment of children
Employment of a child (below 14 years)
Employment of a young person (14 to 16 years)
• Engaged only in employment involving “light work suitable to his capacity” in any undertaking carried on by his family.
• Only permitted to work between 7am to 8pm.
• Not permitted to work for more than 3 consecutive hours without a period of rest of at least 30 minutes.
• Cannot work for more than 6 hours a day, but if attending school, the total time spent at work and at school cannot exceed 7 hours in a day
• May be engaged in any undertaking (whether or not the undertaking is carried on by his family) where the employment is suitable to his capacity. [However, a female young person may not be employed in hotels, bars, restaurants and boarding houses or clubs unless such establishments are operated by her parents].
• Permitted to work only between 7 am to 8pm.
• Cannot work for more than 7 hours a day, but if attending school, the total period spent in school and at work cannot exceed 8 hours in a day.
• Cannot work for more than 4 consecutive hours without a period of rest of at least 30 minutes.
• Cannot commence work on any day without having a period of rest of not less than 12 consecutive hours free from work.
39
Table 7: Malaysia: Change in nominal Federal Government expenditure, 1963-2006 (% per annum)
GDP at purchasers’ price 5.5 7.1 8.6 5.8 6.7 8.7 10.0 7.5 -7.5 8.5 8.5 4.5 a For Peninsular Malaysia only and GDP is at factor cost. Note: GDP in 1965 prices for 1965-70; GDP in 1970 prices for 1971-80, in 1987 prices for 1981-95 and current prices for 1996-2000. Sources: 2MP, Table 2-5; 4MP, Table 2-1; 5MP, Table 2-1; 6MP, Table 1-2; 7MP, Table 2-5; 9MP, Table 2-2; BNM, Monthly Statistical Bulletin, various issues
45
Table 10. Malaysia: Gross domestic product and employment by industry, 1970-2005
Industry Gross domestic product (%) Employment (%)
Total 100 100 100 100 100 100 100 100 100 100 Note: GDP in 1978 prices except for 2005, which is in 1987prices. Sources: 5MP, Table 3-5; OPP2, Tables 2-3 and 3-2; OPP3, Table 2-5; 8MP Table 2-6 and 4-2.
46
Table 11. Malaysia: Balance of payments, 1965-2005 (RM million)
(% of GNP) (2.4) (0.6) (0.8) (1.9) (4.5) (4.7) (-1.8) (-2.6) (2.9) Note: Data are re-organized in consideration of changes in the format used by BNM. a Includes education for 1985-1995 b Includes employees’ compensation for 2000 and 2005 Sources: Bank Negara Malaysia, Monthly Statistical Bulletin, various issues; Ministry of Finance, Malaysia, Economic Report, various issues
47
Table 12. Malaysia: Federal Government Finance, 1963-2010 (RM million)
Revenue Operating expenditure
Current balance
Development expenditure
Overall balance
1963-1965 4,188 3,959 229 1,527 -1,298
First Malaysia Plan, 1966-1970 9,897 9,309 588 3,187 -2,599
Second Malaysia Plan, 1971-1975 18,645 18,026 619 7,371 -6,752
Third Malaysia Plan, 1976-1980 47,189 38,199 8,990 20,659 -11,669
Fourth Malaysia Plan, 1981-1985 93,025 82,004 11,021 46,571 -35,550
Fifth Malaysia Plan, 1986-1990 114,422 109,480 4,942 28,738 -23,796
Sixth Malaysia Plan, 1991-1995 215,394 164,225 51,169 48,429 2,740
Seventh Malaysia Plan, 1996-2000 301,265 236,360 64,903 90,668 -25,764
Eighth Malaysia Plan, 2001-2005 461,391 397,222 64,668 162,452 -97,784
2006 123,546 107,694 15,852 34,961 -19,109
Ninth Malaysia Plan, 2006-2010 e 683,137 595,529 87,608 195,256 107,648 e Estimate
Sources: Ministry of Finance, Malaysia, Economic Report, various issues; 9MP, Table 2-7
Table 13. Malaysia: Government overall balance and net government borrowings, 1970-2005 (RM million)
Total 100.0 100.0 100.0 100.0 100.0 100.0 100.0 100.0 Sources: 4MP, Table 2-5; Rasiah, Osman and Alavi (2000); Bank Negara Malaysia, Annual Report, various issues.
Total 31.0 10.1 13.5 17.7 18.4 5.3 4.6 -2.9 3.5 4.6 15.9 17.5 Sources: Calculated with data from 5MP, Table 3-5; 6MP, Table 1-11; 7MP, Table 4-2; 8MP, Table 2-4; 9MP, Table 11-2; Economic Report, various issues
50
Table 17. Malaysia: Population by location, 1957-2005
1957 1970 1980 1990 2000 2005
Rural 91.0% 71.2% 62.5% 45.3% 38.1% 37.0%
Urban 19.0% 28.8% 37.5% 54.7% 61.9% 63.0% Sources: Department of Statistics, Population Census, 1957, 1970; Malaysia Plan documents, various years; Malaysia, Yearbook of Statistics, 2005.
Table 18. Malaysia: Unemployment rates by ethnicity, 1967-2005
Year Malay Chinese Indian Others Total
1967/68 5.7 5.1 8.4 4.9 5.8
1970 8.1 7.0 11.0 3.1 8.0
1975 6.1 6.3 10.5 9.2 6.7
1980 6.5 3.9 6.3 3.6 5.6
1983 7.0 4.0 6.4 3.8 5.8
1985 8.7 5.5 8.4 5.0 7.6
1990 5.8 4.5 4.9 1.7 5.1
1993 3.3 2.5 2.7 2.3 3.0
1995 4.6 1.5 2.6 0.4 3.1
2000 4.6 1.6 2.7 2.1 3.4a
2003 4.9 1.9 3.0 2.4 3.8
2005 5.3 2.4 3.1 4.1 4.2a a Economic Report, 2004-2005 indicates that the unemployment rate for 2000 was 3.1%.
Economic Report, 2006-2007 indicates that the unemployment rate for 2005 was 3.5%. Sources: Fifth Malaysia Plan, 1986-1990: Table 3.5; Seventh Malaysia Plan, 1996- 2000: Table 3.2; Eighth Malaysia Plan, 2001-2005: Table 3.7; Mid-Term Review of the Eighth Malaysia Plan, 2001-2005: Table 3.7, Ninth Malaysia Plan, 2006-2010, Table 16-4. Notes: 1985-2005 figures are for Malaysia; the earlier ones are for Peninsular Malaysia only.
51
Table 19. Peninsular Malaysia: Gross monthly household income by ethnicity and stratum in current prices, 1970-87 (RM)
1970 1973 1976 1979 1984 1987
All ethnicities
Mean 264 362 514 693 1095 1074
Median 166 227 313 436 723 738
Mean/median 1.59 1.59 1.64 1.59 1.51 1.46
Malay (M)
Mean 172 242 345 492 852 868
Median 120 163 233 327 581 612
Mean/median 1.43 1.48 1.48 1.50 1.47 1.42
Chinese (C)
Mean 394 534 787 938 1502 1430
Median 268 343 480 620 1024 1021
Mean/median 1.47 1.56 1.64 1.51 1.47 1.40
Indian (I)
Mean 304 408 538 756 1094 1089
Median 194 277 360 521 770 799
Mean/median 1.57 1.47 1.49 1.45 1.42 1.36
Urban (U)
Mean 428 570 830 975 1541 1467
Median 265 345 495 600 1027 1004
Mean/median 1.62 1.65 1.68 1.63 1.50 1.46
Rural (R)
Mean 200 269 392 550 824 853
Median 139 184 262 369 596 629
Mean/median 1.44 1.46 1.50 1.49 1.38 1.36
Disparity ratio
C/M 2.29 2.21 2.28 1.91 1.76 1.65
C/I 1.30 1.31 1.46 1.24 1.37 1.31
I/M 1.77 1.69 1.56 1.54 1.28 1.25
U/R 2.14 2.12 2.12 1.77 1.87 1.72
Gini ratio 0.506 (Rao, 1988)
0.502 (Medhi, 1994)
0.529 (Mehdi, 1994)
0.493 (Rao, 1988; Medhi, 1994)
0.274 (Rao, 1988); 0.480 (Mehdi, 1994)
0.458 (Medhi, 1994)
Notes: Figures for 1970 and 1979 are from Mid-Term Review of the Fourth Malaysia Plan, 1981-1985: Table 3-8. Figures for 1973 and 1976 are from Fourth Malaysia Plan, 1981-1985: Table 3-9. Figures for 1984 are from Fifth Malaysia Plan, 1976-1980: Table 3-4. Figures for 1984 and 1987 are from Mid-Term Review of the Fifth Malaysia Plan, 1976-1980: Table 3-2. Canadian Policy Alternatives, undated (http://www.policyalternatives.ca/publicatons/snakes-and-ladders.pdf)
52
Table 20. Malaysia: Structure of imports, 1980-2005 (%)
Liquefied natural gas - - 2,300 2,635 3,171 11,422 20,790 23,285 Sources: Calculated with data from Bank Negara Malaysia, Monthly Statistical Bulletin, various issues
54
Table 22. Malaysia: Unemployment by state, 1980-2005 (%)
1980 1985 1990 1995 2000 2005
More developed states:
Johor 5.3 6.9 3.3 2.5 2.3 5.8 Melaka 6.4 8.3 4.0 2.2 2.0 0.0 N. Sembilan. 5.5 7.5 3.7 3.0 3.3 3.5 Perak 6.3 8.1 4.5 3.8 3.5 3.5 P. Pinang 5.1 6.4 3.4 1.3 1.7 2.0 Selangor 4.4 6.3 2.9 1.9 1.9 3.0 Less developed states:
Production workers 73.46 71.80 76.9 75.29 73.62 70.16
Skilled & semi-skilled/total production workers 56.11 58.67 54.75 45.30 62.56 na
Female skilled/female production workers 39.70 43.79 35.65 36.54 34.53 na
Male skilled/male production workers 40.39 38.12 32.53 33.69 35.08 na
Female workers/production workers:
Skilled 50.52 54.79 59.11 51.92 52.00 na
Semi-skilled 43.79 36.68 50.62 45.58 51.96 na
Unskilled 53.96 54.18 58.01 50.81 52.70 na
Ratio of average wage:
Skilled: unskilled 1.61 1.70 1.64 1.66 1.70 na
Semi-skilled: unskilled 1.20 1.27 1.25 1.22 1.23 na na – not available Sources: Industrial Surveys, 1983, 1985, 1990; Annual Survey of Manufacturing Industries, 1996, 2002, 2003
56
Table 24. Malaysia: External sovereign debts (more than 1 year), 1980-2004 (% of GDP at current prices)
Grand total Federal Government (% of GDP) End of period US$ million % of GDP Total Market loans Project Suppliers’ credit IMF Disbursement
Non-financial enterprises
1980 3,339 13.6 9.1 4.1 5.0 a 0.0 0.0 4.5
1981 4,927 19.7 14.4 8.3 5.2 a 0.0 0.9 5.3
1982 7,226 27.0 21.0 14.4 5.4 a 0.2 1.1 5.9
1983 10,938 36.3 25.3 17.5 5.5 1.1 1.2 10.9
1984 12,989 38.3 26.2 18.4 5.9 1.0 0.9 12.1
1985 14,202 45.5 29.8 21.0 7.3 1.1 0.3 15.7
1986 16,793 60.5 39.5 28.4 9.8 1.4 0.0 21.0
1987 17,772 55.2 34.1 23.4 9.5 1.2 0.0 21.1
1988 16,082 45.6 28.1 18.7 8.6 0.8 0.0 17.5
1989 13,834 35.6 23.0 15.6 6.9 0.5 0.0 12.6
1990 13,513 30.7 20.8 13.6 6.8 0.4 0.0 9.9
1991 13,483 27.4 18.8 12.4 6.3 0.2 0.0 8.6
1992 12,690 21.5 13.9 8.5 5.3 0.1 0.0 7.6
1993 14,126 21.1 11.2 6.7 4.5 0.0 0.0 9.9
1994 13,415 18.0 7.6 3.7 3.9 0.0 0.0 10.4
1995 16,240 18.3 6.0 2.8 3.2 0.0 0.0 12.3
1996 15,784 15.7 4.1 2.0 2.1 0.0 0.0 11.5
1997 23,254 23.2 4.6 2.3 2.3 0.0 0.0 18.6
1998 16,861 23.4 5.3 2.7 2.6 0.0 0.0 18.1
1999 19,839 25.1 6.1 3.7 2.4 0.0 0.0 19.0
2000 20,628 22.8 5.5 3.5 2.0 0.0 0.0 17.4
2001 24,143 27.4 7.3 5.3 2.0 0.0 0.0 20.2
2002 26,477 27.8 10.0 7.9 2.1 0.0 0.0 17.8
2003 24,665 23.7 8.7 6.4 2.3 0.0 0.0 15.1
2004 24,481 21.7 7.7 5.5 2.2 0.0 0.0 14.0
2005 23,452 18.1 6.1 4.3 1.8 0.0 0.0 12.1 a Included suppliers’ credit and IMF loans Sources: Calculated with data from Bank Negara Malaysia, Monthly Statistical Bulletin, various issues.
57
Table 25. Malaysia: Federal Government guarantee of external debts, 1980-2003
US$ million % of GDP
1984 3,032 8.9
1985 3,717 11.9
1986 4,370 15.8
1987 5,226 16.2
1988 4,708 13.3
1989 3,451 8.9
1990 3,093 7.0
1991 3,170 6.5
1992 3,071 5.2
1993 3,280 4.9
1994 3,414 4.6
1995 3,533 4.0
2001 2,941 3.2
2002 2,791 2.8
2003 2,886 2.8 Sources: Calculated with data from Bank Negara Malaysia, Monthly Statistical Bulletin, various issues and Accountant-General Malaysia, Federal Public Accounts, various issues.
58
Table 26. Malaysia: Commercial banks’ direction of lending a and marketization of the Stock Exchange, 1975-2005.
1975 1980 1985 1990 1995 2000 2005 b
Outstanding loans (%):
Agriculture, hunting, forestry & fishing
7.5 7.8 6.0 5.2 2.1 2.9 2.1
Mining & quarrying 1.6 1.0 1.0 1.0 0.5 0.4 0.2
Manufacturing 19.6 22.3 17.5 23.2 23.3 18.2 11.8
Broad property c 18.9 25.4 34.7 30.0 25.5 37.3 42.5
Transport, storage & communication
1.5 1.9 1.6 1.7 1.6 3.1 1.7
General commerce 26.6 22.1 17.9 14.4 - - -
Electricity, gas & water - - - - 2.0 2.0 0.8
Wholesale & retail, hotels & restaurants
- - - - 10.5 9.7 8.8
Finance, insurance & business services
6.1 11.9 11.3 13.1 8.9 5.8
Consumption creditd - - - - 3.5 6.0 19.3
Securities - - - - 4.4 6.7 3.5
Transport vehicles - - - - - 0.1 0.6
Community, social & personal services
- - - - - 1.4 1.1
Others 24.4 13.3 9.5 13.2 13.6 3.2 1.6
Total 100 100 100 100 100 100 100
Marketization of Stock Exchange (% of GDP)
na na na 110.6 253.8 130.4 145.0
na – not available a Including Islamic banks, also for loans sold to Cagamas and Danaharta. b As at end of July c For construction, residential property, non-residential property and real estate. d For personal use, credit cards, consumer durables and passenger cars Sources: Ministry of Finance, Malaysia. Economic Report, various issues
Sources: Ong (1998: 222); Bank Negara Malaysia. Monthly Statistical Bulletin ,
various issues
68
POSTSCRIPT
GROWTH AND EMPLOYMENT IN MALAYSIA:
POLICY RESPONSE DURING ECONOMIC CRISIS
Wee Chong Hui
Universiti Teknologi MARA Sarawak
THE CURRENT SCENARIO
The growth of the Malaysian gross domestic product (GDP) at constant 2000 prices accelerated from 5.8 per cent in 2006 to 6.8 per cent in 2007. However, the latest estimate (by the Malaysian Institute of Economic Research) indicates a fall to 5.1 per cent for 2008 and 1.3 per cent in 2009, adversely affected by the global financial crisis. The Economic Report, 2008/2009, released in August 2008, forecasted a slowdown in the growth of nominal exports and prices of most major commodity exports (Annex 1). It also forecasted that the production index for export-oriented industries would decrease from 138.8 in 2007 to 138.2 in 2008 (2000 = 100). The issue of private debt equity for manufacturing in January-September 2008 fell from the corresponding period in 2007 by 73.7 per cent to RM786 million, while that for electricity, gas and water fell 68.4 per cent to RM3131 million (Bank Negara Malaysia – BNM, 2008). The ringgit’s strengthening against the US dollar from USD1 = RM3.871 hit USD1 = RM3.158 at the end of April 2008, before weakening thereafter. The exchange rate on 22 January 2009 was USD1 = RM3.6115.
Foreign direct investment for 2008 was estimated at USD12.9 billion, 53.4 per cent higher than for 2007 (UNCTAD). The issue of private debt securities for January-October 2008 was 5.8 per cent higher than for the corresponding period in 2007, with finance, insurance, real estate and business services increasing 61.1 per cent from RM18,387 million to RM29,327 million, followed by construction (16.5 per cent from RM4636 million to RM5401 million) as well as transport, storage and communication (6.5 per cent from RM5435 million to RM5789 million) (BNM, 2008).
Conversely, available data shows that foreign portfolio investment for January-September 2008 was 34.2 per cent lower than for the corresponding period in 2007, which was 125.2 per cent higher than that for 2006. External loans for January-September 2008 was 12.3 per cent lower than the corresponding period in 2007, for which the loan was 72.4 per cent higher than the corresponding period in 2006. Continuous improvement in loan management by the banking institutions saw the amount of non-performing loans failing in service for 3 months decreasing 17.3 per cent from the same period in 2006 and decreasing 18.3 per cent for loans failing in service for 6 months, while the proportion of NPL decreased from 3.4 per cent to 2.4 per cent and from 2.7 per cent to 1.9 per cent respectively (BNM, 2008).
The consumer price index (CPI) decreased from 3.6 per cent in 2006 to 2.0 per cent in 2007, with inflation more burdensome in the rural areas and on households with income less than RM1000 per month compared to those with higher incomes of RM1000-1500 per month (Annex 2).
After decreasing from 3.5 per cent in 2005 to 3.3.per cent in 2006, the unemployment rate is estimated to register increases and expected to hit 4.5 per cent in 2009 (MIER). At the end of September 2009, the number of active job seekers was some 88.5 per cent higher than the number for the corresponding date in 2008. Most of the new registered job seekers in 2007
69
were holders of the Malaysian Certificate of Examination who had finished 6 years of primary schooling and 5 years of secondary schooling (32.8 per cent), degree holder (22.0 per cent) and diploma holder (20.4 per cent), with the same pattern to be expected in subsequent years in view of the output from the education system.
The number those retrenched for comparative dates was almost nine times, with the number of those retrenched from manufacturing representing 88.1 per cent of the retrenched at the end of September 2009 (BNM, 2008). The total number of reported vacancies by sector exceeded the total number of active job seekers and the retrenched taken together, including those for manufacturing (Annex 4). However, most of the vacancies are in elementary jobs, which can be presumed to be low-paying and hence unattractive. These vacancies can be expected offer lower wages than those earned by Malaysians expected to be retrenched from employment in foreign countries such as amongst the mainly unskilled 300,000 Malaysians who form 30 per cent of the workforce in Singapore.
There is no recent information on retrenchment or unemployment by gender or state/region. However, an electronic manufacturing company with branches in the peninsula and Sarawak has considered retrenching employees in Sarawak in its proposal to scale down operation. The decision on which site of its operation to stop is said to be determined by logistics or locational disadvantages. Consequently differences in the economic structure of the 13 Malaysian states will affect unemployment by state. In this case, the less developed state of Sarawak will be more adversely affected. GOVERNMENT RESPONSE
The government’s specific responses are seen in a RM7 billion economic stimulus package, actions on employment as well as increasing disposable income and consumption. It continues its macroeconomic regime of growth subject to balance of payment and inflation restraints amidst bias for business interests as well as rentier and political influences. It makes reference to its development policy of growth with equity in the current Ninth Malaysia Plan (9MP, 2006-2010).
Stimulus Package
In November 2008, the Finance Minister announced a stimulus package of RM7 billion, which is an estimated 1 per cent of the GDP. The stimulus package aims to “reinforce the economy, strengthen national resilience and maintain economic growth momentum to face the increasingly challenging global economic climate”. The stimulus package is supposed to address the concern for the people's well-being and to stimulate private sector confidence. Amongst the projects are:
• RM1.2 billion for the construction of 25,000 low-cost and medium-cost houses.
• RM200 million to revitalise abandoned housing projects. • RM100 million to increase commercial premises and beautify selected small towns. • RM500 million for the refurbishment of police stations and police quarters, as well as
army camps and their living quarters.
• RM600 million for minor projects for the maintenance of public and basic infrastructure such as village roads, small bridges and community halls.
• RM500 million for the preservation and repair of public amenities such as schools, hospitals and roads.
70
• RM500 million for maintenance of public transportation especially the LRT, Komuter and bus systems in urban areas.
• RM500 million for upgrading and construction of rural roads and village roads, including those in Sabah and Sarawak.
• RM1.5 billion to set up an investment fund to attract more private sector investment. • RM400 million to expedite the high-speed broadband project implementation.
• RM200 million for fully-aided religious schools, mission schools, Chinese schools and Tamil schools.
• RM200mil for pre-school education.
• RM300 million for creation of funds and to implement skills training programmes in the Development Corridors (Annex 1).
• RM200 million to build human capital through various training programmes by various ministries.
• RM100 million for youth (Rakan Muda) projects.
Housing, Construction and the Property Sector
The housing projects include those under the Hardcore Poor Housing Programme by the Rural and Regional Development Ministry as well as various government agencies and non-financial public enterprises. An average 100 houses for the hardcore poor are to be built in every district. Meanwhile, the Finance Ministry Incorporated will continue to repair old and dilapidated houses of the hardcore poor. Its subsidiary, Prokhas launched the Amal Jariah programme in early 2008 and repaired some 7000 houses at a cost of RM40 million in 2008. Prokhas will repair 15,000 houses in 2009. Initiatives by government-linked companies will also be coordinated to repair another 5000 houses in 2009.
In addition, 15,000 low cost houses costing RM30-35,000 each in the peninsula and RM35-40,000 each in Sabah and Sarawak are to be built by the Ministry of Rural and Regional Development. A Housing Credit Guarantee Scheme for housing loans up to RM100,000 has been set up to facilitate house ownership by low-income earners such as petty traders, farmers and fishermen. Housing loans for 25-year tenure, provided to government employees, representing 11 per cent of the employed, may be extended to a 30-year tenure. Living quarters of government security employees are also to be refurbished.
Housing programmes for the poor and low-income groups are undeniable welfare-oriented. However, they have often been inefficiently implemented and subject to rent extraction by vested interests. With less and/or cheaper quality inputs, the houses are of low quality and have been known to burden the poor buyers with repairs and maintenance they can ill afford. The location of houses unsuitable in relation to the place of employment fails to meet the need of the poor.
For that matter, some housing projects have been abandoned. In fact, the government deems the need for a RM200 million allocation to revive abandoned projects in viable areas. The government further abolishes import duties for cement and long iron and steel products for the construction (and manufacturing) sector to boost private sector activities. It exempts approved permits for the production of long iron and steel products to drive growth in the construction sector in addition to providing competitivemess in the construction materials supply industry.
The development of commercial premises and beautification of small townsis supposed to help small and medium scale entrepreneurs market their products locally. Nonetheless, the hazards of rent extraction from construction can risk oversupply in the property sector, especially in the current recessionary tendencies.
71
Infrastructure and Public AmenityProjects
Roads, bridges, community halls, schools, transport systems in both the rural and urban areas are to be upgraded, repaired and maintained. The large and less developed, non-peninsular states of Sabah and Sarawak, whose Members of Parliament (MPs) collectively representing the majority in the national ruling coalition, are mentioned for road upgrading. While improving the standard of living, these projects also create employment.
The minor projects are to be distributed to small-time contractors, suggesting the equity intention. However, political patronage is a governance concern. The allocation for minor projects in a constituency has been disbursed through its MP in the ruling coalition or an alternate agent if the MP is not in the ruling coalition. There are recent media reports on members of the ruling coalition debating on the disbursement of allocations through a Sarawak MP who does not belong to any political party, but was perceived to align with the coalition.
Allocation for tranpsort services is justified insofar as spendings on transport averages a substantial 15 per cent of the household expenditure. The allocations for public transport in urban areas can be more efficient and wider in scope than the (elsewhere) proposed increase in loan eligibility for car ownership by government employees. In fact, the allocation for the stimulus package comes from the saving in subsidy for fuel, which affects transport charges. The government claims that it has been subsidising fuel over the years and in response to rising world market price, it raised the control price of fuel in June 2008. The control price has been reduced a few times since as world market price decreases, but inflation has not eased proportionately. The government has to work out the appropriate level of control charges for transport services.
Investment and Mega Projects
The government added another RM5 billion to the original RM5 billion for its ValueCap Sdn Bhd to prop up undervalued stocks. There were concerns that the funds may be used to bail out politically connected individuals or under-performing government-linked companies.
The announcement of the allocation for ValueCap saw the benchmark KLCI rose 13 points. Similarly, the announcement of the RM7 billion stimulus package saw the KLCI opening 6.13 points higher and closing 6.23 points highe. There were interests in construction and property stocks (despite the risk of oversupply mentioned earlier), the industrial index, finance index and plantation index. Productive investment would, however, be preferred for their long-term impact on the real economy than mere market confidence in portfolio investment.
Even productive mega projects should be scrutinised for domestic linkages and distributive impact. Infrastructure with high import contents and commissioning charges have not only strained the balance of trade but also siphoned the bulk of the benefits in the form of commissions to elitist parties awarded contracts for undertaking the projects.
The 9MP lists rural infostructure development and training on ICT usage to bridge the digital divide. However, the poor are less capable and have less paying ability to access the proposed high-speed broadband project. Hence the proper use of the allocations for education and training as well as the appropriate design of youth training programmes can address the problem in the medium and long term.
The launch of the 9MP in 2006 saw the government proclaiming to improve service delivery. The government has proclaimed its haste to recruit employees in critical post and the Project Management Unit of the Ministry of Finance is to monitor and implement critical and high impact projects. It is said that the major portion of the government procurement will be made through open tenders to increase transparency as well as efficiency. Quotas for
72
procurement from Bumiputera businesses are still maintained in accordance with the ethnic affirmative action policy, but competitive bidding are implemented. To increase revenues, the government will invite tenders openly to develop land at strategic locations. Government-linked corporations are to compete on the same footing as private corporations for the land.
However, although the stimulus package was announced at the close of the 2009 Budget, parliamentary debate was denied on the grounds that it was not part of the Budget. Consequently, there is minimal participation in the conduct of the stimulus package.
The religious schools, mission schools, Chinese schools and Tamil schools are community-initiated and traditionally self-determining. Given their scale of operation, they are likely to engage small businesses and collectively contribute towards achieving equity significantly. Nonetheless, it is unclear to what extent they are allowed to independently decide on the use of their allocations under the stimulus package.
Limitations
The RM7 billion economic stimulus package is larger than the RM4.3 billion that the government spent in September 2001 to counter the adverse effects after terrorist attacks in US. However, it is less than the RM7.3 billion to counter the effect of the SARS outbreak in 2003, when the 9/11 effects were still prominent. There have been doubts expressed on the sufficiency of the RM7 billion package and the government has indicated the possibility of further allocations (to the low 1 per cent of GDP). The concern is that government financial resources may be limited as tax revenue is expected to drop with recession and its revenues from petroleum have been dropping with market prices.
Employment
The Ministry of Human Resource (MHR) monitors for retrenchment, especially in prominent manufacturing sectors in Penang, Selangor and Johor. The law requires the payment of retrenchment benefits. A “train and place programme”, implemented for those retrenched without compensation or benefits, pays allowance during the training to help the retrenched tide over the crisis.
The National Action Plan for Employment, 2008-2010
The National Action Plan for Employment (NAPE) provides direction and outline priorities for employment. 190,000-270,000 new jobs are to be created in 2009-10. At the same time, locals are to replace foreign workers, targeted for reduction from the present 2.1 million to 1.6 million by the end of 9MP and 1.5 million by 2015.
NAPE is based on the following principles:
• Updating the present mechanism to improve current job opportunities.
• Creating new job opportunities.
• Creating Smart Partnerships with stakeholders.
• Benchmarking and evaluating the implementation based on internationally-accepted indicators.
Labour Exchange The Ministry of Human Resource (MHR) continues to facilitate search and recruitment for employment. Its free, automated online employment matching service was renamed ‘Jobsmalaysia’. Stalls were strategically set up at shopping malls registered employers with job offers and job-seekers. Career and education fairs in Penang, KL and Johor Baru cater to school leavers, fresh graduates and job-seekers. 17,000 graduates were placed from 2007-June
73
2008 under the Graduate Employability Management Scheme, with 40,000 registered unemployed trained to facilitate their employment. Nationwide employment carnivals were organised as meeting points for employers and job seekers, with 40 state-level carnivals and 20 mini carnivals planned for 2009, the services increasing to include the teaching of soft skills and how to attend interviews. Skill training
Skill training has been designed for the drive towards technology-intensive industries, and the further development of human capital in the 2009 Budget aims to keep Malaysia at par with international competition. Skill development is enhanced through up-skilling and re-skilling for quality and relevant human capital, together with improving quality in education.
RM50 million of the RM7 billion stimulus package is to be used for human capital development, including the production of knowledge workers. The government collaborates with companies on the training, with 800 companies involved as at November 2008. The RM300 million of the stimulus package for skill training in the Development Corridors is disbursed through the corridor development agencies concerned, state skill training centres and relevant organisations (e.g. for tourism, health, construction and business process outsourcing). Another RM200 million has been allocated for youth training, of which RM100m is for specific groups such as those in Sabah and Sarawak and Chinese new villages.
Most training has focussed on industrial skills, although more than 60 per cent of the employed are in the service industries. Hence MHR is considering the introduction of new training courses such as in hospitality and catering services, and even housemaid skills. It was also found that many Malaysians job hop, leading to employer preference for foreign workers. Therefore, training will also address work ethics and culture.
Meanwhile, Malaysia continues to take foreign skilled workers to increase its international competitiveness. Work permits will be given to foreign workers instead of employers for their import of workers, especially to facilitate the intake of knowledge workers. Employment Creation
Automation in manufacturing and the prefabrication system in construction are prioritised to upgrade production technology and in the process, replace unskilled foreign workers and create employment for locals. Malaysia also looks to exporting its expertise in Islamic banking, particularly to the Middle East.
The country continues to woo foreign investment in the hope of acquiring technology. An attractive ceiling of 70 per cent foreign ownership in the services industries will be implemented in 2015 under the ASEAN Free Trade Agreement especially to encourage development in the logistics, telecommunication, health and education sectors. Foreigners and foreign entities are also allowed to buy commercial properties worth RM500,000 or more for personal use without approval from the Foreign Investment Committee.
However, small and medium enterprises are expected to create most of the 190,000-270,000 new employment opportunities in 2009-10. The special funds for SMEs include the RM700 million SME Assistance Facilities, the RM500 million SME Modernisation Facility and the RM200 million micro credit facilities, with a RM100 million revolving fund for the urban micro financing programme. In comparison to large enterprises and foreign corporations, SMEs tend to be locally owned, are domestically linked and have potentials for Malaysian niche positions in the international market as well as collectively generate higher employment.
Reduction in the corporate tax rate continues – 28 per cent in 2006, 27 per cent in 2007 and 26 per cent in 2008 – in the belief that it increases competitveness for foreign investment with increased net returns. To cut inflation, the overnight policy rate (OPR) was
74
reduced by 25 basis points to 3.25 per cent in November 2008, the first reduction since April 2006. The OPR was reduced by another 75 basic points to to 2.50 per cent in late January. To reduce the cost of agricultural inputs, the government has agreed to abolish the 5 per cent import duty on eight fertilisers. The Deputy Prime Minister-cum-Finance Minister claims that in tandem with the fall in crude palm oil prices, fertiliser manufacturers have agreed to help government efforts to cut down prices by at least 15 per cent. The government has also halved the price stabilisation cess oil palm planters to RM2 per tonne. However, planters in Sarawak are requesting for the threshold price for windfall tax to be increased to RM2000-2600 per tonne in consideration of production cost in the state being higher than in the peninsula.
The government is also reductions in electricity tariffs, raised in June 2008 in response to increases in fuel prices, in addition to restructuring financial arrangements in its contracts with independent suppliers for electricity which it sells to the public. Meanwhile operators in the transport industries in Sarawak are asking for fuel subsidy, similar to those provided for fishermen.
On the demand side, the use biodiesel by government vehicles, industries and the transport sectors will begin in February 2009. This is expected to create a need for 500,000 tonne of palm oil per year by 2010. Meanwhile, the government is working with the Indonesian Government to stabilise crude palm oil price at RM2000-2500 per tonne.
Disposable Income and Consumption
From January 2009, workers are given the option to reduce their contribution to the Employees’ Provident Fund (EPF) from 11 per cent of their basic wage to 9 per cent. With this, an estimated RM4.8 billion will be injected into the economy as consumption. Hypermarkets are supposed to operate longer hours to ensure that consumer demand from the increased disposable income is realized to generate economic growth and employment. However, the EPF is already expected to insufficient to maintain the standard of living for most workers upon retirement based on projected cost of living even without proposed privatization of public services.
Salary for employees in the government sector has been adjusted in July 2007, presumably to counter inflation as previously implemented. The government also offers its employees the option to extend the retirement age from 56 years to 58 years, retaining an estimated 15,000 employees ( … per cent of the total employed) who would otherwise retire in 2009. With rising unemployment, however, retaining these employees would only crowd out younger job-seekers.
Government employees under the EPF scheme have also been given the option to convert to the pension scheme of a minimum RM720 pension per month for those who served over 25 years as well as lump sum gratuity payments and medical benefits upon retirement. This is expected to benefit more than 300,000 pensioners with RM1.3 million in 2009. The gratuity payments and medical benefits would improve the social safety net for retirees. Monthly welfare aid have also been increased from RM400 to RM720 for the peninsula, RM830 for Sarawak and RM960 for Sabah, considering the official poverty line income.
The Statutory Reserve Requirement (SRR) is reduced from 3.50 per cent to 2 per cent, effective from February 2009. The government hopes that both the SSR and OPR reduction will provide a more supportive monetary environment for the domestic economy.
75
SOCIAL DEVELOPMENT
After the drastic increase in the control price of fuel in June 2008 (e.g. 40 per cent increase of pump petrol price) and subsequent inflation, the government announced its agreement to consider applications by its employees to work part time to increase their income. The proposal to pay government employees half monthly instead of monthly to appropriately time their liquidity was not implemented after due considerations. Although government employees have improved working conditions, they form a low 11 per cent of the employed.
Malaysia has no general minimum wage and in September 2008, the Malaysian Trade Union Congress (MTUC) of private sector workers reiterated its call for a minimum RM900 a month and a cost of living allowance of RM300. The government said it agreed to a minimum wage across the board, including for foreign workers and domestic maids, but stated that the proposal required further study and deliberations.
The MTUC also protested against the government’s policies, which led to the exploitation of workers through outsourcing, contracting and the influx of foreign workers. Workers’ benefits and compensations are spelt out only for permanent employment under the various labour laws. Outsourcing and contracting employment deny workers of permanent employment, hence their poor working conditions. The labour laws have to be extended to regulate such employment contracts and management structures.
MHR oversees labour matters, but the Department of Immigration is empowered to approve the recruitment of foreign labour. Apparently the Department has loosened the recruitment procedures as it issues licences to labour suppliers importing foreign workers for hire at a fee. The influx of foreign workers has depressed wages. Hence inter-departmental coordination and rather than the narrow interests associated with various departments are required for consistency in promoting decent work.
The government’s allocations on poverty (e.g. on housing) as well as support to small and medium enterprises (e.g. SME funds and business premises) are welfare-oriented and distributional in nature. A significant concern is of governance to maximise the benefits of target groups and avoid rentierism benefiting a limited elite class.
Another concern is the inability of lower income groups to access support programmes which overlook their specific constraints. For example, the high transport costs in remote rural areas reduce returns from enterprise and investment, constraining growth and employment creation. Skill training benefits the more highly educated while low-income groups are left behind. Rural populations have no access to electronic information on employment vacancies, training or government support programmes because of the digital divide. The poor may even be pre-occupied with making a living for short-term needs instead of participating in programme for long-term benefits such as training.
REGIONAL COOPERATION
Malaysia collaborates with its Asian neighbours, contributing towards and benefiting from the cooperation. The Asian Development Bank (ADB), for example, approved a $10 million senior secured loan to Eucalypt (special vehicle of Asia Debt Managemant Hong Kong Lid) to fund purchase of more than 2000 non-performing residential loans from HSBC Bank Malaysia Bhd. ADB and the United Nations Development Programme in Malaysia assist the Malaysian Ministry of Finance to strengthen its capacity to design and estimate the impact of government budget.
Malaysia is involved in the ASEAN+3 bond market initiatives and ASEAN efforts to strengthen the regional market. Malaysia contributes its expertise in developing financial market according to Islamic principles. In fact, Malaysia has improved governance in its
76
corporate sector since the 1997/98 financial crisis. It is reported to be a credit-friendly bankruptcy regime12. Nonetheless, the same cannot be said of governance in its government sector.
CONCLUSION AND RECOMMENDATIONS Malaysia has reserves to finance necessary employment actions as well as welfare-oriented and social development programme in addition to conspicuous projects to generate economic growth. It has an organised administrative machinery with relevant human resources to plan and implement the programmes. However, improved governance of the government sector is required to increase programme efficiency and achieve more equitable distribution. Malaysia has handled the recessionary 1980s and the 1997/97 financial crisis. The latest crisis and threat of recession may have the most challenging magnitude.
Public expectations may be more demanding as the ruling coalition has been denied its usual 2/3 parliamentary majority and concurrent control over various member-states after some 20 years. The government of this centralised federation may have to start working with elected representatives from the opposition rather than by-pass them through administratively created proxies (e.g. government employees appointed to disburse allocations for projects rather than opposition MPs).
Malaysian policies and programmes tend to promote business interests rather than decent work. National affirmative action policy has been confined to the equitable distribution of benefits from economic growth by ethnicity without much consideration for distribution by income groups, even within the majority Malays or the legally proclaimed “Bumiputera” (Malays and other indigene). Rural-urban imbalances and regional disparities have persisted over the years.
Malaysia’s traditional surplus in the balance of trade is threatened by falling commodity prices and external demand, with accompanying decline in foreign direct investment. Promoting equity will accelerate increases in its domestic demand in place of the demand for its exports. While confidence in portfolio investment may promise some financing for productive investment and growth-generating consumption, control is essential to regulate capital flows to avoid excess fluctuations in exchange rate for the open economy. Nonetheless, foreign direct investments and appropriate collaborations with various governments and international agencies (e.g. ASEAN, ADB) can be mutually beneficial.
Malaysia has appropriately supported SMEs, distributive by nature and closely linked to the domestic economy. At the same time, it attempts to increase disposable income consumption, looking towards the domestic demand as growth from external demand now seems limited. It has increased its supply of skilled labour and should continue to improve its education and training programmes. This will not only increase productive capacity but also increase employability of labour and equitably improve their quality of life.
It appears that Malaysia’s ability to manage the current recessionary tendencies and unemployment will depend on the efficient use of its financial resources and borrowing capacity (if necessary) to encourage the development of enterprises with strong domestic linkages. The potentials of domestic investment, including SMEs, and domestic demand should be enhanced, supported by the promotion of equitable distribution. Money supply in the country indicates sufficient funds for domestic investment, which may be encouraged by the provision of supportive infrastructure and investor confidence. The provision of
12 Bernama (2009). “Malaysia is a credit-friendly bankruptcy regime” in Borneo Post, 8 January
77
infrastructure and public amenities will also uplift the standard of living. Relevant education and training programmes should increase long run productivity and decent work for an improved quality of life. There should be control of speculative capital flows with disruptive fluctuations. Conversely, foreign direct investments and collaborative external linkages, especially with neighbouring countries in the region, would be mutually supporting. Finally, political will and governance will ensure policy consistency and public confidence, essential for managing the current scenario.
78
References Malaysia (2006). The Ninth Malaysia Plan, 2006-2010. Economic Planning Unit, Kuala
Lumpur. Malaysia, Bank Negara Malaysia (2008). Monthly Statistical Bulletin, November 2008, Kuala
Lumpur: Bank Negara Malaysia. Malaysia, Ministry of Finance, Economic Report, 2008/2009, Kuala Lumpur: Ministry of
Finance. Malaysia, Ministry of Human Resource. http://www.mohr.gov.my
79
Annex 1. Major Commodities: Exports and Prices, 2006 – 2008.