14
PD-360 Impact for Title 1 Schools Steven H. Shaha, PhD, DBA July 2011
| Date post: | 17-Dec-2015 |
| Category: |
Documents |
| Upload: | veronica-brooks |
| View: | 213 times |
| Download: | 1 times |

PD-360 Impact forTitle 1 SchoolsSteven H. Shaha, PhD, DBA
July 2011

Overarching Research Question:
Does engagement in PD 360significantly affect student success in
Title I schools?

3
Methods
• Design: Quasi-experimental, retrospective, pre-post, normalized treatment-control / participation vs. non-participation (2009-10, 2010-11)
• Goal: Multi-State, large n with comparable student populations (matched, controlled)
• Student Change:* Metric was percent students classified as Proficient or Advanced in respective States. Change was computed as net change year-over-year, divided by Year 1 baseline
* Improvement is percent change: [(Year2-Year1)/Year1]* Comparative change: [School change/District change]

Sample Description
• High Video Utilizers– 422 Schools
• Metrics:– Percent of users
viewing– Student Success
Note:•High video utilizers was defined as minimum average of 90.0 minutes of participation in PD 360 per academic year per teacher for any school collectively.•Percent of users viewing was the percentage of teachers within any school verified as participating in any module within PD 360•Student success was quantified as the sum of percent students classified as either Proficient or Advanced on the respective standardized state test.

School-wide Title 1 Findings
Title 1 PD-360 Schools significantly outperformed their respective Districts
• Math:– 13.2% Advantage for Combined Pct Prof and Adv (p<.001)
• Reading:– 4.6% Advantage for Combined Pct Prof and Adv (p<.001)
NOTES:•Results reflect comparative percent change year-over-year: (Year 2 – Year 1)/Year 1. A 0.0% change would indicate same scores for Year 1 and Year 2 – no gain or loss.•Advantage reflects the net difference in percent change for School vs. Districts: (Pct Sch-Pct Dist). A 0.0% advantage would indicate no difference between Schools and Districts in the percent change year-over-year.

Math Advantages
The Districts fell 5.9%, while PD-360 Schools gained 7.3%for a 13.2% advantage (p<.001)
Pct Change Stat Signi f
PD-360 Schools 7.3% p<.001
Districts -5.9% p<.001
Advantage 13.2% p<.001
NOTES:•Results reflect comparative percent change year-over-year: (Year 2 – Year 1)/Year 1. A 0.0% change would indicate same scores for Year 1 and Year 2 – no gain or loss.•Advantage reflects the net difference in percent change for School vs. Districts: (Pct Sch-Pct Dist). A 0.0% advantage would indicate no difference between Schools and Districts in the percent change year-over-year.
59.7
60.2
64.1
56.6

Math Advantages
The Districts fell 5.9%, while PD-360 Schools gained 7.3%for a 13.2% advantage (p<.001)
Pct Change Stat Signi f
PD-360 Schools 7.3% p<.001
Districts -5.9% p<.001
Advantage 13.2% p<.001
NOTES:•Results reflect comparative percent change year-over-year: (Year 2 – Year 1)/Year 1. A 0.0% change would indicate same scores for Year 1 and Year 2 – no gain or loss.•Advantage reflects the net difference in percent change for School vs. Districts: (Pct Sch-Pct Dist). A 0.0% advantage would indicate no difference between Schools and Districts in the percent change year-over-year.

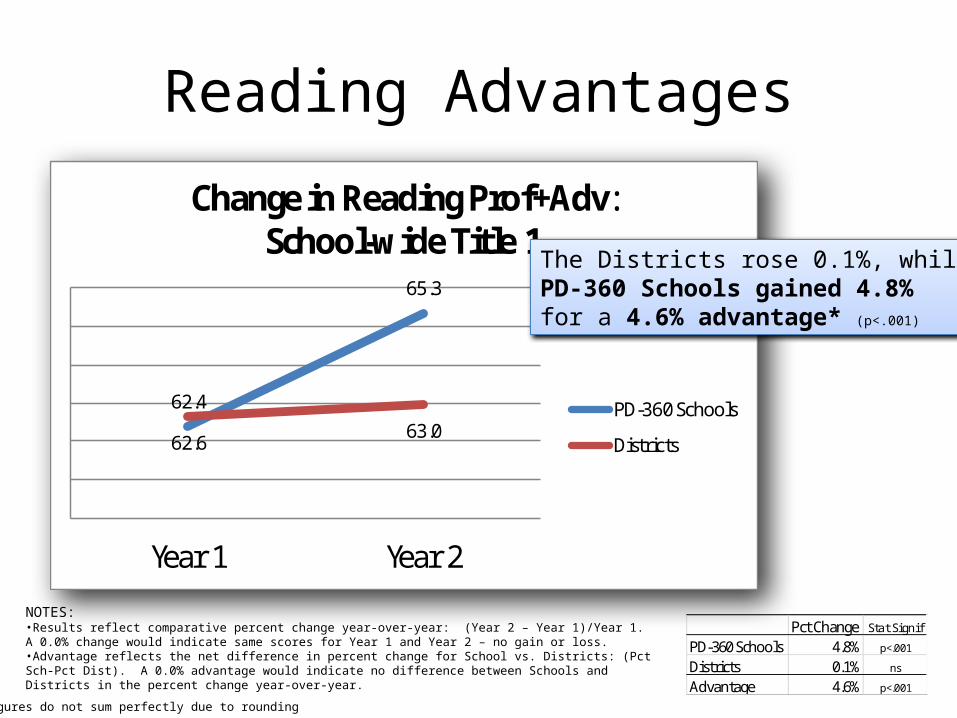
Reading Advantages
The Districts rose 0.1%, while PD-360 Schools gained 4.8%for a 4.6% advantage* (p<.001)
Pct Change Stat Signi f
PD-360 Schools 4.8% p<.001
Districts 0.1% ns
Advantage 4.6% p<.001
* Figures do not sum perfectly due to rounding
NOTES:•Results reflect comparative percent change year-over-year: (Year 2 – Year 1)/Year 1. A 0.0% change would indicate same scores for Year 1 and Year 2 – no gain or loss.•Advantage reflects the net difference in percent change for School vs. Districts: (Pct Sch-Pct Dist). A 0.0% advantage would indicate no difference between Schools and Districts in the percent change year-over-year.
Reading Advantages
Pct Change Stat Signi f
PD-360 Schools 4.8% p<.001
Districts 0.1% ns
Advantage 4.6% p<.001
* Figures do not sum perfectly due to rounding
NOTES:•Results reflect comparative percent change year-over-year: (Year 2 – Year 1)/Year 1. A 0.0% change would indicate same scores for Year 1 and Year 2 – no gain or loss.•Advantage reflects the net difference in percent change for School vs. Districts: (Pct Sch-Pct Dist). A 0.0% advantage would indicate no difference between Schools and Districts in the percent change year-over-year.
62.4
65.3
62.663.0
Year 1 Year 2
Change in Reading Prof+Adv:School-wide Title 1
PD-360 Schools
Districts
The Districts rose 0.1%, while PD-360 Schools gained 4.8%for a 4.6% advantage* (p<.001)

Reading Advantages
The Districts rose 0.1%, while PD-360 Schools gained 4.8%for a 4.6% advantage* (p<.001)
Pct Change Stat Signi f
PD-360 Schools 4.8% p<.001
Districts 0.1% ns
Advantage 4.6% p<.001
* Figures do not sum perfectly due to rounding
NOTES:•Results reflect comparative percent change year-over-year: (Year 2 – Year 1)/Year 1. A 0.0% change would indicate same scores for Year 1 and Year 2 – no gain or loss.•Advantage reflects the net difference in percent change for School vs. Districts: (Pct Sch-Pct Dist). A 0.0% advantage would indicate no difference between Schools and Districts in the percent change year-over-year.

Predictors of Change inPD-360 Title 1 Schools
• Math:– #1 predictor – Percent of Users Viewing
• Reading– #1 predictor – Percent of Users Viewing
*Statistically significant predictors from the regression modelNOTES:•Results reflect comparative percent change year-over-year: (Year 2 – Year 1)/Year 1. A 0.0% change would indicate same scores for Year 1 and Year 2 – no gain or loss.

Predictors of Change in PD-360 Title I Schools:
– Math predictors:1 – Percent of Users Viewing2 – Average Minutes Viewed3 – Total Users
– Reading predictors:1 – Percent of Users Viewing2 – Registered Users Viewing3 – Average Minutes Viewed
*Statistically significant predictors from the regression modelNOTES:•Results reflect comparative percent change year-over-year: (Year 2 – Year 1)/Year 1. A 0.0% change would indicate same scores for Year 1 and Year 2 – no gain or loss.

• Math Advantages– Approx. 13.2% growth advantage per 100 students than their
respective district counterparts
• Reading Advantages– Approx. 4.6% performance advantage per 100 students than their
respective district counterparts
Summary of School Impacts
NOTES:•Results reflect comparative percent change year-over-year: (Year 2 – Year 1)/Year 1. A 0.0% change would indicate same scores for Year 1 and Year 2 – no gain or loss.•Advantage reflects the net difference in percent change for School vs. Districts: (Pct Sch-Pct Dist). A 0.0% advantage would indicate no difference between Schools and Districts in the percent change year-over-year.


