Journal of Physics: Conference Series OPEN ACCESS Machine integrated optical measurement of honed surfaces in presence of cooling lubricant To cite this article: R Schmitt et al 2011 J. Phys.: Conf. Ser. 311 012007 View the article online for updates and enhancements. You may also like Investigation of the effect of contaminations and cleaning processes on the surface properties of brazing surfaces K Bobzin, M Öte and S Wiesner - Identifying lubricant options for compressor bearing designs J Karnaz, C Seeton and L Dixon - Additivation of vegetal oils for improving tribological characteristics C Georgescu, L C Solea and L Deleanu - Recent citations The Proposition of an Automated Honing Cell with Advanced Monitoring Adam Barylski and Piotr Sender - This content was downloaded from IP address 121.149.9.107 on 29/12/2021 at 20:51
Transcript
Journal of Physics Conference Series
OPEN ACCESS
Machine integrated optical measurement of honedsurfaces in presence of cooling lubricantTo cite this article R Schmitt et al 2011 J Phys Conf Ser 311 012007
View the article online for updates and enhancements
You may also likeInvestigation of the effect ofcontaminations and cleaning processes onthe surface properties of brazing surfacesK Bobzin M Oumlte and S Wiesner
-
Identifying lubricant options forcompressor bearing designsJ Karnaz C Seeton and L Dixon
-
Additivation of vegetal oils for improvingtribological characteristicsC Georgescu L C Solea and L Deleanu
-
Recent citationsThe Proposition of an Automated HoningCell with Advanced MonitoringAdam Barylski and Piotr Sender
-
This content was downloaded from IP address 1211499107 on 29122021 at 2051
Machine integrated optical measurement of honed
surfaces in presence of cooling lubricant
R Schmitt12 N Konig12 and H Zheng1
1Laboratory for Machine Tools and Production Engineering of RWTH Aachen UniversitySteinbachstr 19 52074 Aachen Germany2Fraunhofer Institute for Production Technology IPT Steinbachstr 17 52074 AachenGermany
E-mail nkoenigwzlrwth-aachende
Abstract The measurement of honed surfaces is one of the most important tasks intribology Although many established techniques exist for texture characterization such asSEM tactile stylus or white-light interferometry none of them is suited for a machine integratedmeasurement Harsh conditions such as the presence of cooling lubricant or vibrations prohibitthe use of commercial sensors inside a honing machine Instead machined engine blocks needtime-consuming cleaning and preparation while taken out of the production line for inspectionA full inspection of all produced parts is hardly possible this way Within this paper anapproach for a machine-integrated measurement is presented which makes use of optical sensorsfor texture profiling The cooling lubricant here serves as immersion medium The results of testmeasurements with a chromatic-confocal sensor and a fiber-optical low-coherence interferometershow the potential of both measuring principles for our approach Cooling lubricant temperatureand flow scanning speed and measurement frequency have been varied in the tests The sensorwith best performance will later be chosen for machine integration
1 IntroductionWithin the production chain of combustion engines the honing process for the manufacturingof tribological surface structures within cylinder liners is crucial for the efficiency and oilconsumption of the engine The quality inspection of honed textures today is mostly realizedwith tactile stylus fax image analysis [1] or scanning electron microscope (SEM) [2] whiletactile probing is the first choice for the production-related evaluation For all of the existingmeasuring principles the separation of the engine block from the production line and additionalwashing is needed which is time consuming While a complete inspection of all produced parts isimpossible the sample testing causes another problem if the time delay to prepare and measurea cylinder liner is too long a lot of engine blocks can be manufactured with possible defects inthe meantime Therefore a machine integrated measuring method is highly demanded whichenables the fast inspection of the honed texture
2 Optical measurement system21 Conceptual design of the measurement set-upAs introduced above the cooling lubricant has to be cleaned before the tactile measurementof the surface Within this paper an innovative approach with optical sensors is presented in
13th International Conference on Metrology and Properties of Engineering Surfaces IOP PublishingJournal of Physics Conference Series 311 (2011) 012007 doi1010881742-65963111012007
Published under licence by IOP Publishing Ltd 1
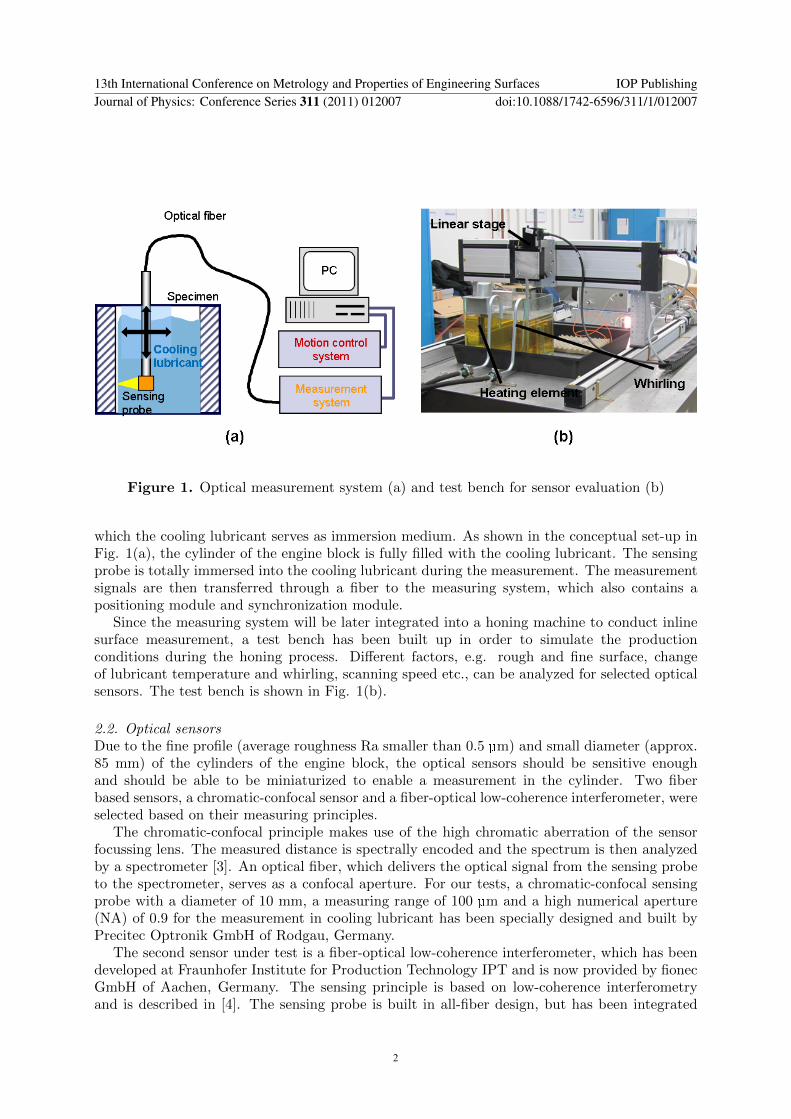
Figure 1 Optical measurement system (a) and test bench for sensor evaluation (b)
which the cooling lubricant serves as immersion medium As shown in the conceptual set-up inFig 1(a) the cylinder of the engine block is fully filled with the cooling lubricant The sensingprobe is totally immersed into the cooling lubricant during the measurement The measurementsignals are then transferred through a fiber to the measuring system which also contains apositioning module and synchronization module
Since the measuring system will be later integrated into a honing machine to conduct inlinesurface measurement a test bench has been built up in order to simulate the productionconditions during the honing process Different factors eg rough and fine surface changeof lubricant temperature and whirling scanning speed etc can be analyzed for selected opticalsensors The test bench is shown in Fig 1(b)
22 Optical sensorsDue to the fine profile (average roughness Ra smaller than 05 microm) and small diameter (approx85 mm) of the cylinders of the engine block the optical sensors should be sensitive enoughand should be able to be miniaturized to enable a measurement in the cylinder Two fiberbased sensors a chromatic-confocal sensor and a fiber-optical low-coherence interferometer wereselected based on their measuring principles
The chromatic-confocal principle makes use of the high chromatic aberration of the sensorfocussing lens The measured distance is spectrally encoded and the spectrum is then analyzedby a spectrometer [3] An optical fiber which delivers the optical signal from the sensing probeto the spectrometer serves as a confocal aperture For our tests a chromatic-confocal sensingprobe with a diameter of 10 mm a measuring range of 100 microm and a high numerical aperture(NA) of 09 for the measurement in cooling lubricant has been specially designed and built byPrecitec Optronik GmbH of Rodgau Germany
The second sensor under test is a fiber-optical low-coherence interferometer which has beendeveloped at Fraunhofer Institute for Production Technology IPT and is now provided by fionecGmbH of Aachen Germany The sensing principle is based on low-coherence interferometryand is described in [4] The sensing probe is built in all-fiber design but has been integrated
13th International Conference on Metrology and Properties of Engineering Surfaces IOP PublishingJournal of Physics Conference Series 311 (2011) 012007 doi1010881742-65963111012007
2
Figure 2 Fiber optic distance sensor for machine integration
into a similar shaped probe housing (Fig 2) as the chromatic-confocal sensor for compatibilityreasons
3 Evaluation measurementsTo evaluate the performance of both sensors a series of test measurements have been carriedout in which different objects have been measured with both sensors in cooling lubricant asfollows
31 CalibrationPrior to roughness measurements the distance between the surface and probe had to becalibrated in cooling lubricant since the refractive index of the lubricant serves as immersionmedium and affects the optical path length of the measuring beam Since the measuringprocesses of both sensors are similar to a tactile stylus profiler a depth-setting standard hasbeen used for calibration according to ISO 5436-1 type A 1 [5] For calibration the length ofmeasurement must be at least three times the width W of the groove To discard data losses orbatwings at the groove edges a range of plusmnW3 is skipped on each side of the groove With theremaining measurement data ranging from point 1 to 2 3 to 4 5 to 6 in Fig 3a the groovedepth D can be determined
To calibrate the measurement scale and to compensate for a possible nonlinearity a depthsetting standard with two grooves of which one is 20 microm and the other 50 microm deep has beenused (Fig 3b) The depth setting standard was calibrated with a white-light interferometerVeeco NT1100 Since the refractive index of the cooling lubricant can change with many factorssuch as temperature cleanliness or type of cooling lubricant a calibration with the depth settingstandard has been conducted for different measuring setups
32 Test on roughness standardsAlthough both sensors have been characterized for roughness measurements in dry conditions[6] different roughness standards with Rz values of 32 microm 10 microm (Fig 4) and 20 micromwere measured in the test bench filled with cooling lubricant Different measuring frequencies(constant sampling interval) and setups were tested
13th International Conference on Metrology and Properties of Engineering Surfaces IOP PublishingJournal of Physics Conference Series 311 (2011) 012007 doi1010881742-65963111012007
3
Figure 3 a) profile section of the depth-setting standard b) diamond turned depth settingstandard
Figure 4 Roughness standard with Rz of 10 microm and profile measured with fiber-optical distancesensor
Both sensors have proven capable for roughness measurement in the cooling lubricant underproduction conditions The results show that the deviations from the calibrated value for themeasured Rz values of both sensors are within plusmn15 and the deviations for measured Ra valuesare within plusmn66
33 Tests on honed cylinder surfacesA series of test measurements on honed cylinder surfaces has been made with both opticalsensors Different factors which may influence the measurement results eg temperaturewhirling lateral resolution and so on have been varied according to a design of experimentstest chart (see table 1)
13th International Conference on Metrology and Properties of Engineering Surfaces IOP PublishingJournal of Physics Conference Series 311 (2011) 012007 doi1010881742-65963111012007
4
Table 1 Experimental design of tests on cylinder surfaces
Factors Factor level 1 (-) Factor level 2 (+)
(A) Lateral resolution 1 microm spacing 15 microm spacing(B) Measuring frequency low (1 kHz) high (2 kHz)(C) Whirling Off On(D) Tilting low (lt 002deg) high (gt 01deg)(E) Temperature 21degC 39degC
Altogether 64 measurements have been conducted with both sensors The results indicatethat the optical measurements are mostly affected by the temperature effect which causes achange in the density of the cooling lubricant and related to that a change of its refractiveindex In real production processes the lubricant temperature is actively cooled and keptconstant within a few degrees of Kelvin so that the temperature effects on the measurementare not considered to be problematical Compared to results that have been acquired withtactile stylus measurements the expanded uncertainty for Ra (using a coverage factor of 2) isapproximately 80 nm for both optical sensors Ligth scattering methods which have emerged inrecent years could be an alternative for a quick inline assessment within cooling lubricant Fora reliable determination of the feasibility extensive optical simulation of the scattering behaviorof the honed structure in cooling lubricant is crucial
4 ConclusionWithin this paper we presented a new approach for a machine integrated inspection of honedsurfaces The used optical sensors provide the potential for the fast inline assessment of thehoned texture Different evaluation measurements show that the sensors are capable for usein cooling lubricant In a next step further evaluation measurements will be performed withcooling lubricant emulsion One sensor will be chosen for integration into a honing machinewhich can later be inserted into a production line for the automated quality inspection andclosed-loop control of the honing process
AcknowledgmentsThe presented results have arisen from the national research project rdquoZOOMrdquo which is kindlysupported by the German Ministry of Education and Science (BMBF) and the VDI (FKZ13N10294)
References[1] Geus D and Stiebler M 2008 Meas Sci Technol 19 064004[2] Willis E 1986 Wear 109 351-66[3] Tiziani H J and Uhde H M 1994 Appl Opt 33 1838-43[4] Depiereux F Lehmann P Pfeifer T and Schmitt R 2007 Appl Opt 46 3425-31[5] ISO 5436-12000 Geometrical Product Specifications (GPS) - Surface texture Profile method Measurement
standards - Part 1 Material measures[6] Schmitt R Konig N and de Araujo E M 2009 Proc of SPIE (Munich) vol 7389 ed P Lehmann (Bellingham
SPIE) p 7389-14
13th International Conference on Metrology and Properties of Engineering Surfaces IOP PublishingJournal of Physics Conference Series 311 (2011) 012007 doi1010881742-65963111012007
5
Machine integrated optical measurement of honed
surfaces in presence of cooling lubricant
R Schmitt12 N Konig12 and H Zheng1
1Laboratory for Machine Tools and Production Engineering of RWTH Aachen UniversitySteinbachstr 19 52074 Aachen Germany2Fraunhofer Institute for Production Technology IPT Steinbachstr 17 52074 AachenGermany
E-mail nkoenigwzlrwth-aachende
Abstract The measurement of honed surfaces is one of the most important tasks intribology Although many established techniques exist for texture characterization such asSEM tactile stylus or white-light interferometry none of them is suited for a machine integratedmeasurement Harsh conditions such as the presence of cooling lubricant or vibrations prohibitthe use of commercial sensors inside a honing machine Instead machined engine blocks needtime-consuming cleaning and preparation while taken out of the production line for inspectionA full inspection of all produced parts is hardly possible this way Within this paper anapproach for a machine-integrated measurement is presented which makes use of optical sensorsfor texture profiling The cooling lubricant here serves as immersion medium The results of testmeasurements with a chromatic-confocal sensor and a fiber-optical low-coherence interferometershow the potential of both measuring principles for our approach Cooling lubricant temperatureand flow scanning speed and measurement frequency have been varied in the tests The sensorwith best performance will later be chosen for machine integration
1 IntroductionWithin the production chain of combustion engines the honing process for the manufacturingof tribological surface structures within cylinder liners is crucial for the efficiency and oilconsumption of the engine The quality inspection of honed textures today is mostly realizedwith tactile stylus fax image analysis [1] or scanning electron microscope (SEM) [2] whiletactile probing is the first choice for the production-related evaluation For all of the existingmeasuring principles the separation of the engine block from the production line and additionalwashing is needed which is time consuming While a complete inspection of all produced parts isimpossible the sample testing causes another problem if the time delay to prepare and measurea cylinder liner is too long a lot of engine blocks can be manufactured with possible defects inthe meantime Therefore a machine integrated measuring method is highly demanded whichenables the fast inspection of the honed texture
2 Optical measurement system21 Conceptual design of the measurement set-upAs introduced above the cooling lubricant has to be cleaned before the tactile measurementof the surface Within this paper an innovative approach with optical sensors is presented in
13th International Conference on Metrology and Properties of Engineering Surfaces IOP PublishingJournal of Physics Conference Series 311 (2011) 012007 doi1010881742-65963111012007
Published under licence by IOP Publishing Ltd 1
Figure 1 Optical measurement system (a) and test bench for sensor evaluation (b)
which the cooling lubricant serves as immersion medium As shown in the conceptual set-up inFig 1(a) the cylinder of the engine block is fully filled with the cooling lubricant The sensingprobe is totally immersed into the cooling lubricant during the measurement The measurementsignals are then transferred through a fiber to the measuring system which also contains apositioning module and synchronization module
Since the measuring system will be later integrated into a honing machine to conduct inlinesurface measurement a test bench has been built up in order to simulate the productionconditions during the honing process Different factors eg rough and fine surface changeof lubricant temperature and whirling scanning speed etc can be analyzed for selected opticalsensors The test bench is shown in Fig 1(b)
22 Optical sensorsDue to the fine profile (average roughness Ra smaller than 05 microm) and small diameter (approx85 mm) of the cylinders of the engine block the optical sensors should be sensitive enoughand should be able to be miniaturized to enable a measurement in the cylinder Two fiberbased sensors a chromatic-confocal sensor and a fiber-optical low-coherence interferometer wereselected based on their measuring principles
The chromatic-confocal principle makes use of the high chromatic aberration of the sensorfocussing lens The measured distance is spectrally encoded and the spectrum is then analyzedby a spectrometer [3] An optical fiber which delivers the optical signal from the sensing probeto the spectrometer serves as a confocal aperture For our tests a chromatic-confocal sensingprobe with a diameter of 10 mm a measuring range of 100 microm and a high numerical aperture(NA) of 09 for the measurement in cooling lubricant has been specially designed and built byPrecitec Optronik GmbH of Rodgau Germany
The second sensor under test is a fiber-optical low-coherence interferometer which has beendeveloped at Fraunhofer Institute for Production Technology IPT and is now provided by fionecGmbH of Aachen Germany The sensing principle is based on low-coherence interferometryand is described in [4] The sensing probe is built in all-fiber design but has been integrated
13th International Conference on Metrology and Properties of Engineering Surfaces IOP PublishingJournal of Physics Conference Series 311 (2011) 012007 doi1010881742-65963111012007
2
Figure 2 Fiber optic distance sensor for machine integration
into a similar shaped probe housing (Fig 2) as the chromatic-confocal sensor for compatibilityreasons
3 Evaluation measurementsTo evaluate the performance of both sensors a series of test measurements have been carriedout in which different objects have been measured with both sensors in cooling lubricant asfollows
31 CalibrationPrior to roughness measurements the distance between the surface and probe had to becalibrated in cooling lubricant since the refractive index of the lubricant serves as immersionmedium and affects the optical path length of the measuring beam Since the measuringprocesses of both sensors are similar to a tactile stylus profiler a depth-setting standard hasbeen used for calibration according to ISO 5436-1 type A 1 [5] For calibration the length ofmeasurement must be at least three times the width W of the groove To discard data losses orbatwings at the groove edges a range of plusmnW3 is skipped on each side of the groove With theremaining measurement data ranging from point 1 to 2 3 to 4 5 to 6 in Fig 3a the groovedepth D can be determined
To calibrate the measurement scale and to compensate for a possible nonlinearity a depthsetting standard with two grooves of which one is 20 microm and the other 50 microm deep has beenused (Fig 3b) The depth setting standard was calibrated with a white-light interferometerVeeco NT1100 Since the refractive index of the cooling lubricant can change with many factorssuch as temperature cleanliness or type of cooling lubricant a calibration with the depth settingstandard has been conducted for different measuring setups
32 Test on roughness standardsAlthough both sensors have been characterized for roughness measurements in dry conditions[6] different roughness standards with Rz values of 32 microm 10 microm (Fig 4) and 20 micromwere measured in the test bench filled with cooling lubricant Different measuring frequencies(constant sampling interval) and setups were tested
13th International Conference on Metrology and Properties of Engineering Surfaces IOP PublishingJournal of Physics Conference Series 311 (2011) 012007 doi1010881742-65963111012007
3
Figure 3 a) profile section of the depth-setting standard b) diamond turned depth settingstandard
Figure 4 Roughness standard with Rz of 10 microm and profile measured with fiber-optical distancesensor
Both sensors have proven capable for roughness measurement in the cooling lubricant underproduction conditions The results show that the deviations from the calibrated value for themeasured Rz values of both sensors are within plusmn15 and the deviations for measured Ra valuesare within plusmn66
33 Tests on honed cylinder surfacesA series of test measurements on honed cylinder surfaces has been made with both opticalsensors Different factors which may influence the measurement results eg temperaturewhirling lateral resolution and so on have been varied according to a design of experimentstest chart (see table 1)
13th International Conference on Metrology and Properties of Engineering Surfaces IOP PublishingJournal of Physics Conference Series 311 (2011) 012007 doi1010881742-65963111012007
4
Table 1 Experimental design of tests on cylinder surfaces
Factors Factor level 1 (-) Factor level 2 (+)
(A) Lateral resolution 1 microm spacing 15 microm spacing(B) Measuring frequency low (1 kHz) high (2 kHz)(C) Whirling Off On(D) Tilting low (lt 002deg) high (gt 01deg)(E) Temperature 21degC 39degC
Altogether 64 measurements have been conducted with both sensors The results indicatethat the optical measurements are mostly affected by the temperature effect which causes achange in the density of the cooling lubricant and related to that a change of its refractiveindex In real production processes the lubricant temperature is actively cooled and keptconstant within a few degrees of Kelvin so that the temperature effects on the measurementare not considered to be problematical Compared to results that have been acquired withtactile stylus measurements the expanded uncertainty for Ra (using a coverage factor of 2) isapproximately 80 nm for both optical sensors Ligth scattering methods which have emerged inrecent years could be an alternative for a quick inline assessment within cooling lubricant Fora reliable determination of the feasibility extensive optical simulation of the scattering behaviorof the honed structure in cooling lubricant is crucial
4 ConclusionWithin this paper we presented a new approach for a machine integrated inspection of honedsurfaces The used optical sensors provide the potential for the fast inline assessment of thehoned texture Different evaluation measurements show that the sensors are capable for usein cooling lubricant In a next step further evaluation measurements will be performed withcooling lubricant emulsion One sensor will be chosen for integration into a honing machinewhich can later be inserted into a production line for the automated quality inspection andclosed-loop control of the honing process
AcknowledgmentsThe presented results have arisen from the national research project rdquoZOOMrdquo which is kindlysupported by the German Ministry of Education and Science (BMBF) and the VDI (FKZ13N10294)
References[1] Geus D and Stiebler M 2008 Meas Sci Technol 19 064004[2] Willis E 1986 Wear 109 351-66[3] Tiziani H J and Uhde H M 1994 Appl Opt 33 1838-43[4] Depiereux F Lehmann P Pfeifer T and Schmitt R 2007 Appl Opt 46 3425-31[5] ISO 5436-12000 Geometrical Product Specifications (GPS) - Surface texture Profile method Measurement
standards - Part 1 Material measures[6] Schmitt R Konig N and de Araujo E M 2009 Proc of SPIE (Munich) vol 7389 ed P Lehmann (Bellingham
SPIE) p 7389-14
13th International Conference on Metrology and Properties of Engineering Surfaces IOP PublishingJournal of Physics Conference Series 311 (2011) 012007 doi1010881742-65963111012007
5
Table 1 Experimental design of tests on cylinder surfaces
Factors Factor level 1 (-) Factor level 2 (+)
(A) Lateral resolution 1 microm spacing 15 microm spacing(B) Measuring frequency low (1 kHz) high (2 kHz)(C) Whirling Off On(D) Tilting low (lt 002deg) high (gt 01deg)(E) Temperature 21degC 39degC
Altogether 64 measurements have been conducted with both sensors The results indicatethat the optical measurements are mostly affected by the temperature effect which causes achange in the density of the cooling lubricant and related to that a change of its refractiveindex In real production processes the lubricant temperature is actively cooled and keptconstant within a few degrees of Kelvin so that the temperature effects on the measurementare not considered to be problematical Compared to results that have been acquired withtactile stylus measurements the expanded uncertainty for Ra (using a coverage factor of 2) isapproximately 80 nm for both optical sensors Ligth scattering methods which have emerged inrecent years could be an alternative for a quick inline assessment within cooling lubricant Fora reliable determination of the feasibility extensive optical simulation of the scattering behaviorof the honed structure in cooling lubricant is crucial
4 ConclusionWithin this paper we presented a new approach for a machine integrated inspection of honedsurfaces The used optical sensors provide the potential for the fast inline assessment of thehoned texture Different evaluation measurements show that the sensors are capable for usein cooling lubricant In a next step further evaluation measurements will be performed withcooling lubricant emulsion One sensor will be chosen for integration into a honing machinewhich can later be inserted into a production line for the automated quality inspection andclosed-loop control of the honing process
AcknowledgmentsThe presented results have arisen from the national research project rdquoZOOMrdquo which is kindlysupported by the German Ministry of Education and Science (BMBF) and the VDI (FKZ13N10294)
References[1] Geus D and Stiebler M 2008 Meas Sci Technol 19 064004[2] Willis E 1986 Wear 109 351-66[3] Tiziani H J and Uhde H M 1994 Appl Opt 33 1838-43[4] Depiereux F Lehmann P Pfeifer T and Schmitt R 2007 Appl Opt 46 3425-31[5] ISO 5436-12000 Geometrical Product Specifications (GPS) - Surface texture Profile method Measurement
standards - Part 1 Material measures[6] Schmitt R Konig N and de Araujo E M 2009 Proc of SPIE (Munich) vol 7389 ed P Lehmann (Bellingham
SPIE) p 7389-14
13th International Conference on Metrology and Properties of Engineering Surfaces IOP PublishingJournal of Physics Conference Series 311 (2011) 012007 doi1010881742-65963111012007