Lockheed Martin Advanced Technology Laboratories Rapid Prototyping of Application-Specific Signal Processors (RASSP) CAD SYSTEM DESCRIPTION BASELINE 2.0 CDRL A007 Contract Number: DAAL01-93-C-3380 June 1998
Transcript
Lockheed MartinAdvanced Technology Laboratories
Rapid Prototyping ofApplication-Specific Signal Processors
(RASSP)
CAD SYSTEM DESCRIPTION
BASELINE 2.0
CDRL A007
Contract Number: DAAL01-93-C-3380
June 1998
Lockheed MartinAdvanced Technology Laboratories
Rapid Prototyping ofApplication-Specific Signal Processors
(RASSP)
CAD SYSTEM DESCRIPTION
BASELINE 2.0
CDRL A007
Contract Number: DAAL01-93-C-3380
Submitted By:
Lockheed Martin RASSP TeamLockheed Martin Advanced Technology LaboratoriesBuilding A&E 2W1 Federal StreetCamden, NJ 08102
For further information contact:
Mr. Dennis BasaraTelephone: 609-338-2545Fax: 609-338-4155E-mail: [email protected]
2.2-1 RASSP Baseline 2 system design tools 2-22.2-2 RTM lifecycle support 2-32.2-3 RDD-100 supports requirements and functional analysis 2-52.2-4 Behavior diagram structures 2-62.3-1 RDD-100/PRICE/RAM-ILS integration 2-132.3-2 Overview of RTM/RDD-00 integration 2-142.3-3 Overview of RDD-100 BONeS integration 2-15
3.1-1 Software architecture 3-13.1-2 Architecture selection toolset 3-23.2-1 Application Interface Builder bridges gap between data flow and
control flow3-6
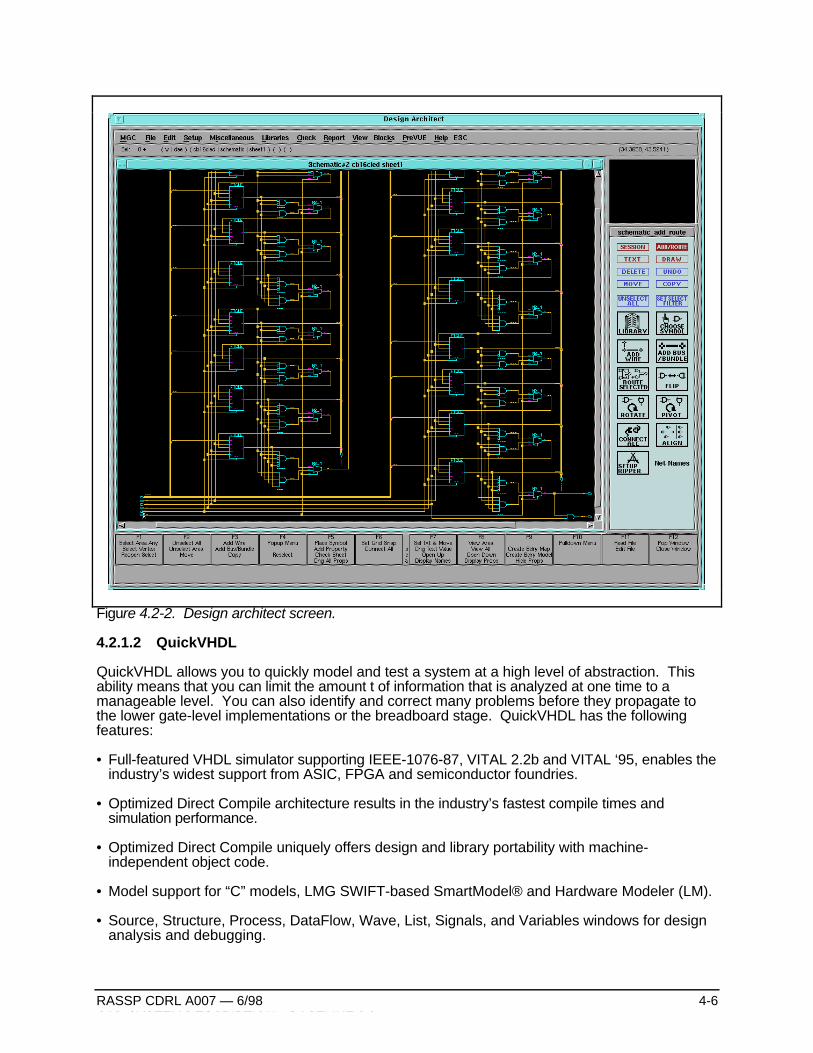
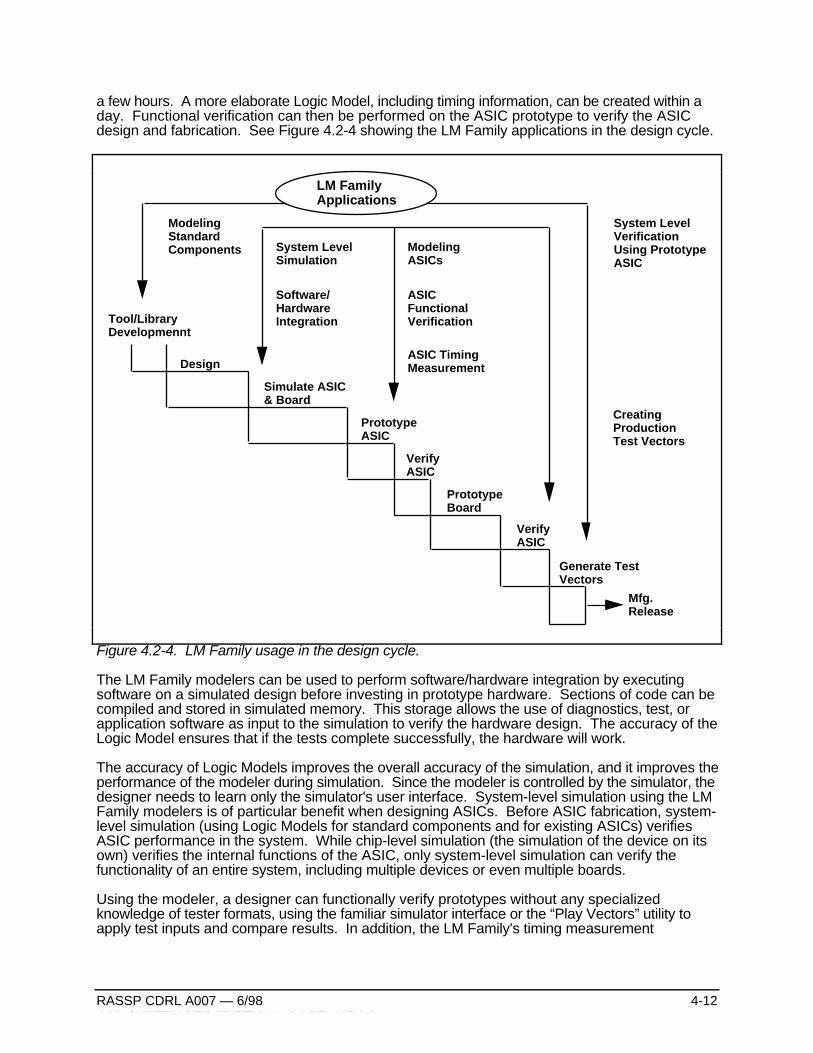
4.1-1 RASSP hardware design tools 4-14.2-1 Mentor IDEA EDA tool set 4-54.2-2 Design architect screen 4-64.2-3 Board designer process flow 4-94.2-4 LM Family usage in the design cycle 4-124.3-1 FALCON Framework components 4-18
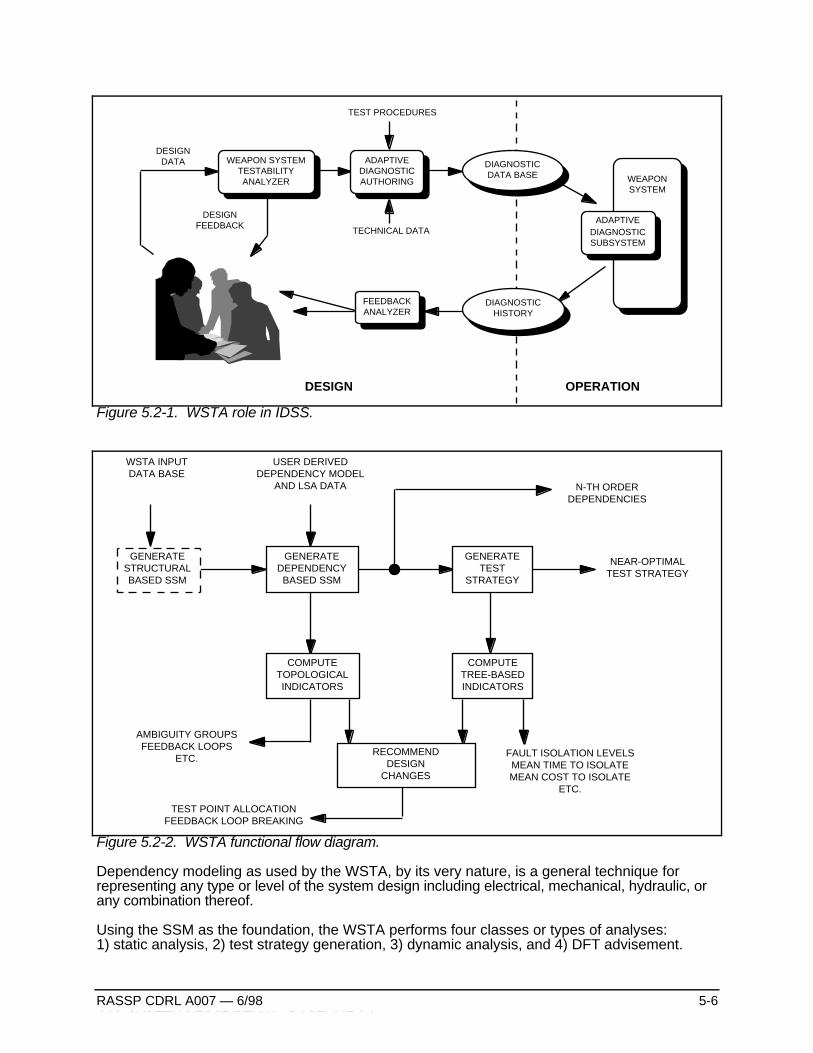
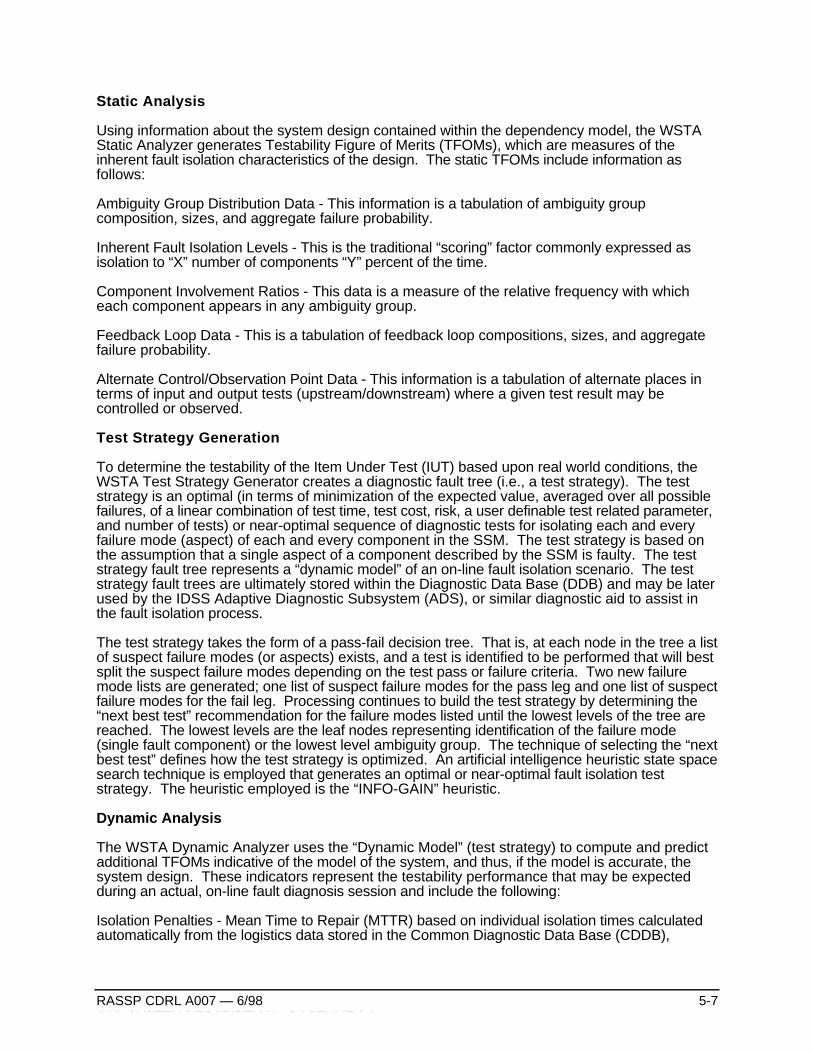
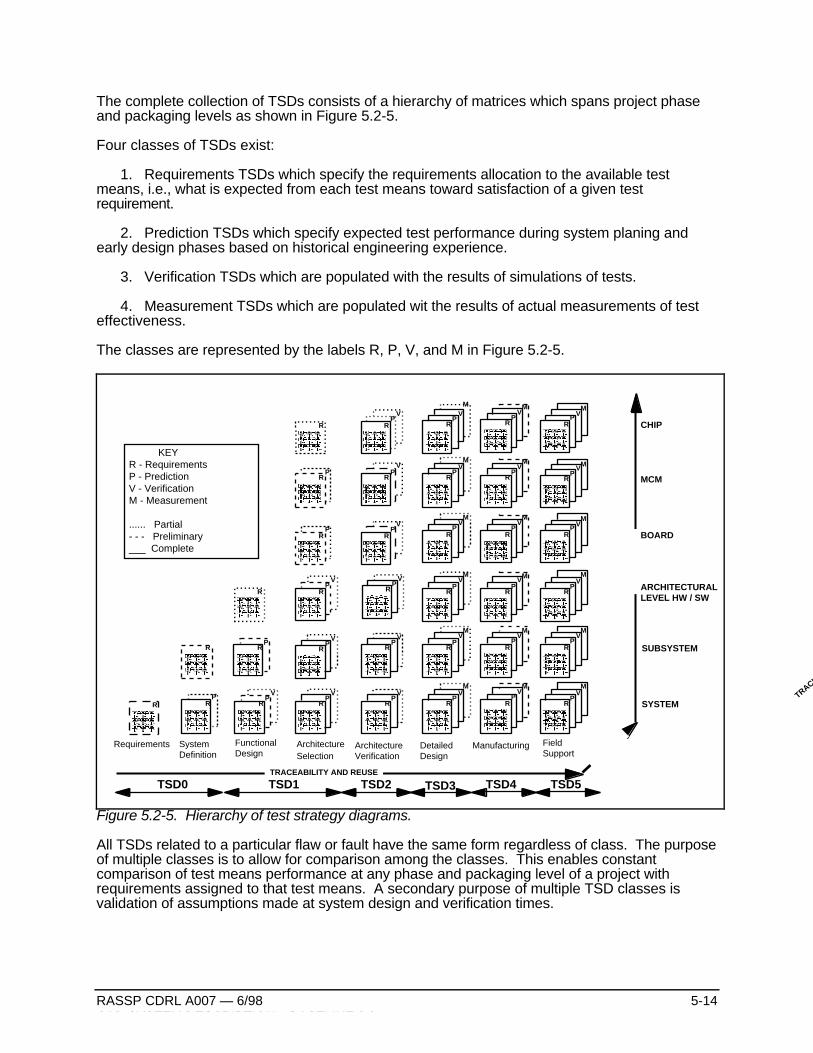
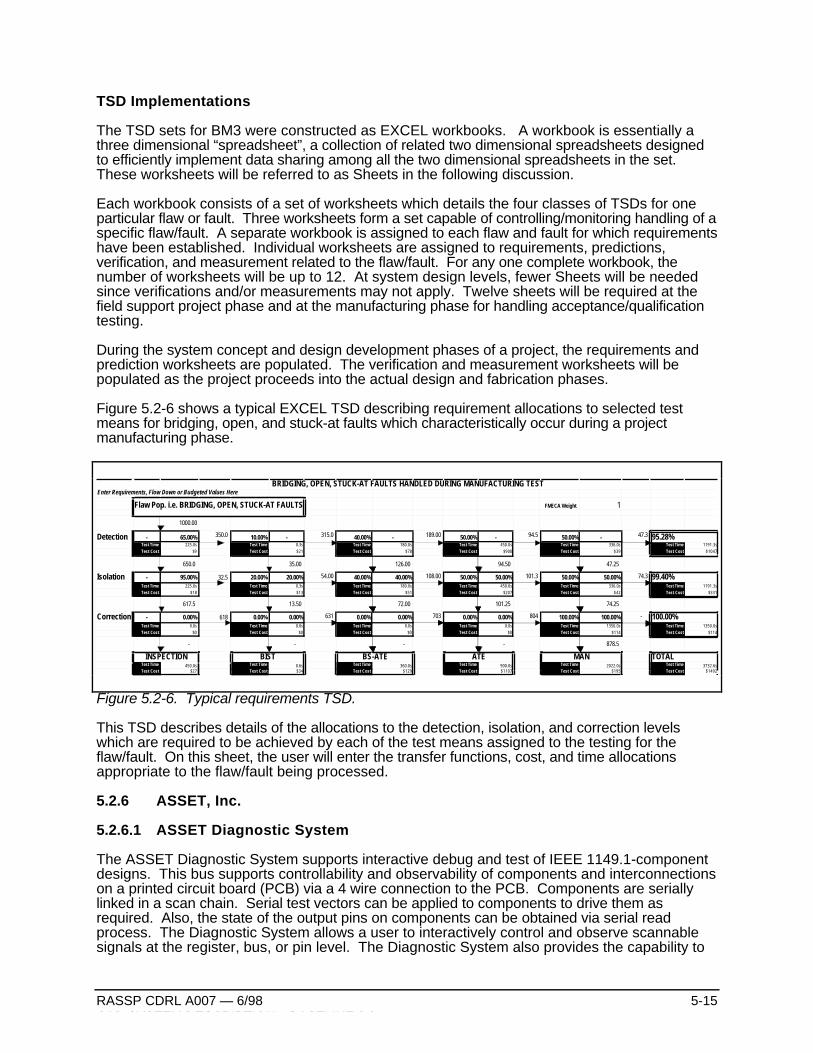
5.2-1 WSTA role in IDSS 5-65.2-2 WSTA functional flow diagram 5-65.2-3 ASICTEST tool suite 5-115.2-4 Test strategy diagram concept 5-135.2-5 Hierarchy of test strategy diagrams 5-145.2-6 Typical requirements TSD 5-15
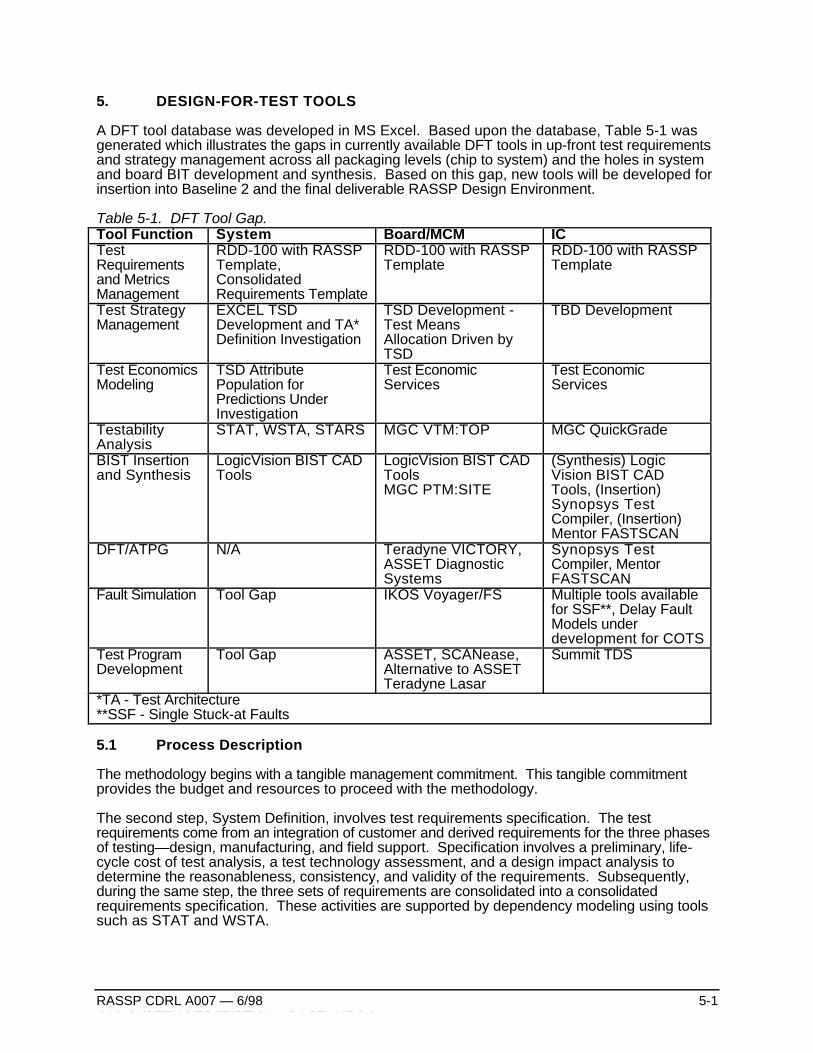
Lockheed Martin ATL's design environment implementation team has leveraged the heritage of itsEngineering Process Improvement (EPI) program to combine a proven set of tools with extendedcapabilities for Baseline 0. Enhancements have been made in tool integration, functionality, andperformance in the CAD system for Baseline 1. Intergraph will provide a framework to integrateall tools and automate process and workflow control. An updated description of the Baseline 1tools is the focus of this document and is referred to as Baseline 2. The tools are organizedaccording to their use within the RASSP design methodology.
1.1 RASSP Baseline 2 CAD System Overview
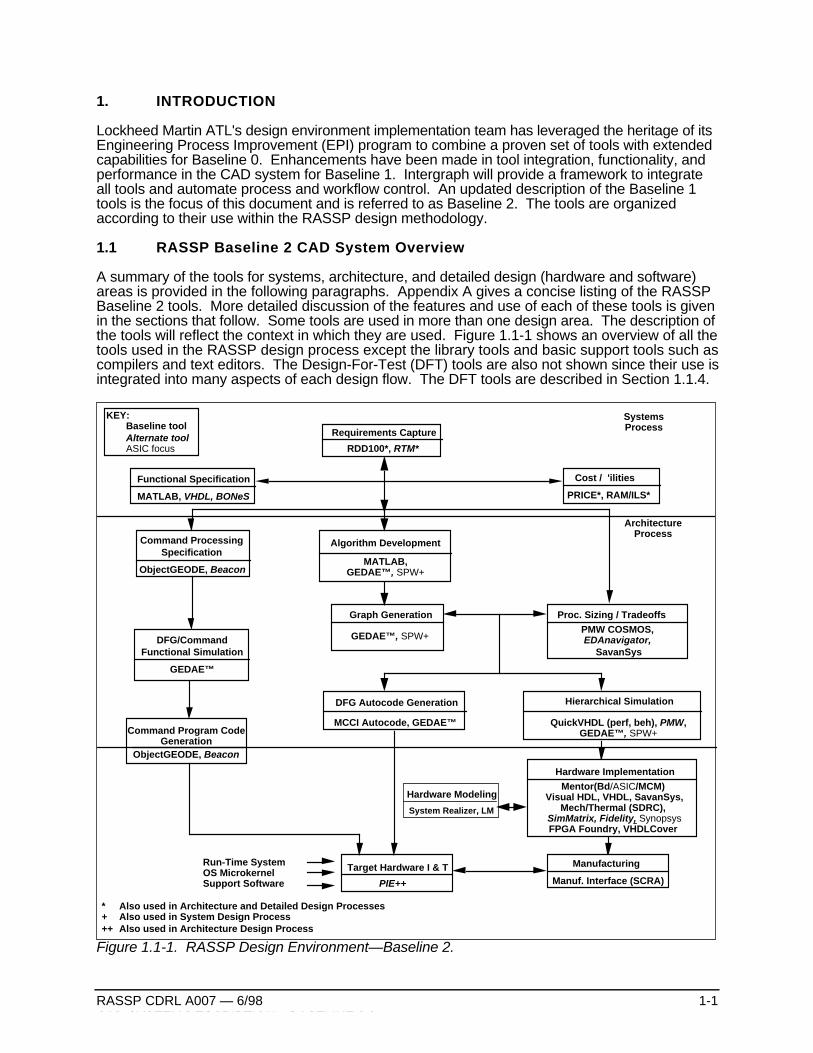
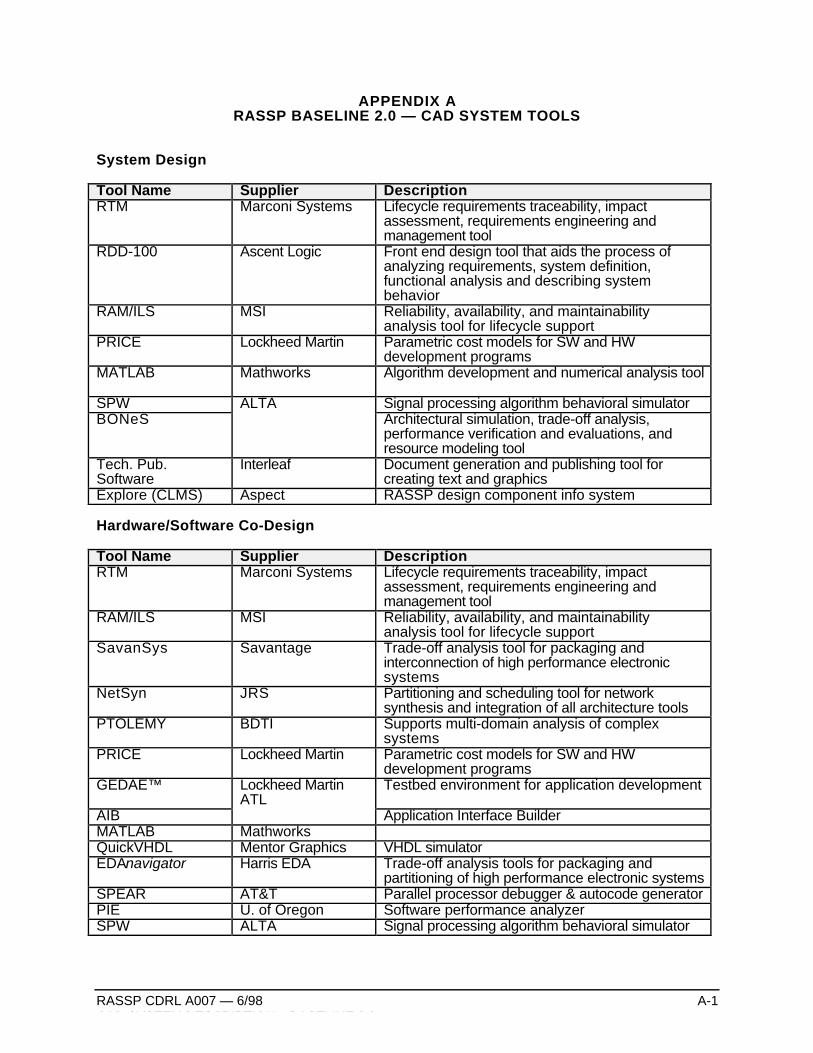
A summary of the tools for systems, architecture, and detailed design (hardware and software)areas is provided in the following paragraphs. Appendix A gives a concise listing of the RASSPBaseline 2 tools. More detailed discussion of the features and use of each of these tools is givenin the sections that follow. Some tools are used in more than one design area. The description ofthe tools will reflect the context in which they are used. Figure 1.1-1 shows an overview of all thetools used in the RASSP design process except the library tools and basic support tools such ascompilers and text editors. The Design-For-Test (DFT) tools are also not shown since their use isintegrated into many aspects of each design flow. The DFT tools are described in Section 1.1.4.
The System design tools support early development of system partitioning, test, reliability, andmaintenance concepts. These tools include the following:
• RTM (Requirements and Traceability Management) from Marconi Systems is used as therequirements traceability tool throughout a program's engineering life cycle.
• RDD-100 (Requirements Driven Development) from Ascent Logic is used to capture systemrequirements, perform functional decomposition, model system behavior, allocate requirementsto components, and generate systems engineering documentation.
• BONeS (Block Oriented Network Simulator) from Alta Group is used to perform token-basedhigh-level system simulation, such as modeling network traffic, and is used to obtain detailedperformance metrics early in the system design.
• PRICE S/M/H/HL from Lockheed Martin PRICE Systems is used for computer-aided parametriccost estimating and enables life-cycle cost analysis throughout the design process.
• RAM/ILS from MSI enables feedback on reliability, availability, maintainability, and integratedlogistics to support early tradeoff analyses.
• GEDAE™ from Lockheed Martin ATL is a graphical programming and autocoding environment.
• MATLAB from Mathworks for algorithm development and numerical analysis.
• SPW from Alta Group for algorithm development.
• The Component and Library Management System (Explore (CLMS)) from Aspect is an object-oriented extension to the existing commercially-available Component Information System (CIS)product.
• Interleaf's Technical Publishing System (TPS) is the documentation production tool, whichsupports all levels of the design process.
The Hardware/Software Co-Design tools support the Functional Design, Architecture Selection,and Architecture Verification efforts of the Architecture Definition process. Software design toolssupport library development, detailed design, and source code development. These tools are:
• JRS Research Laboratories, Inc. NetSyn enables architecture selection via a design advisor.
• SavanSys from Savantage, Inc. is a tradeoff analysis tool focused on packaging andinterconnection of high-performance electronic systems.
• Lockheed Martin ATL’s GEDAE™ provides a workstation environment to develop applications,tools to support multiprocessor scheduling and mapping, and a run-time environment toefficiently execute on scaleable embedded processors.
• Alta Group's Signal Processor Worksystem (SPW) enables interactive design, simulation, andimplementation of digital signal processing and communication systems.
• BDTI/UC Berkeley's Ptolemy supports multi-domain analysis of complex systems.
• RDD-100 (Requirements Driven Development) from Ascent Logic is used to capture systemrequirements, perform functional decomposition, model system behavior, allocate requirementsto components, and generate systems engineering documentation.
• RTM (Requirements and Traceability Management) from Marconi Systems is used as therequirements traceability tool throughout a program’s engineering life cycle.
• PRICE is used for computer-aided parametric cost estimating.
• SimMatrix from Precedence provides a mixed domain co-simulation environment.
• Mentor QuickVHDL provides a VHDL compilation and simulation capability.
• MATLAB is used for algorithm development and numerical analysis.
• Harris EDAnavigator from Harris Electronic Design Automation, Inc. is an alternative tool toSavantage’s SavanSys.
• Performance Modeling Workbench (PMW) from Omniview and Honeywell Technology Centerallows a designer to rapidly create alternative hardware/software architectures and simulatethem to validate system performance.
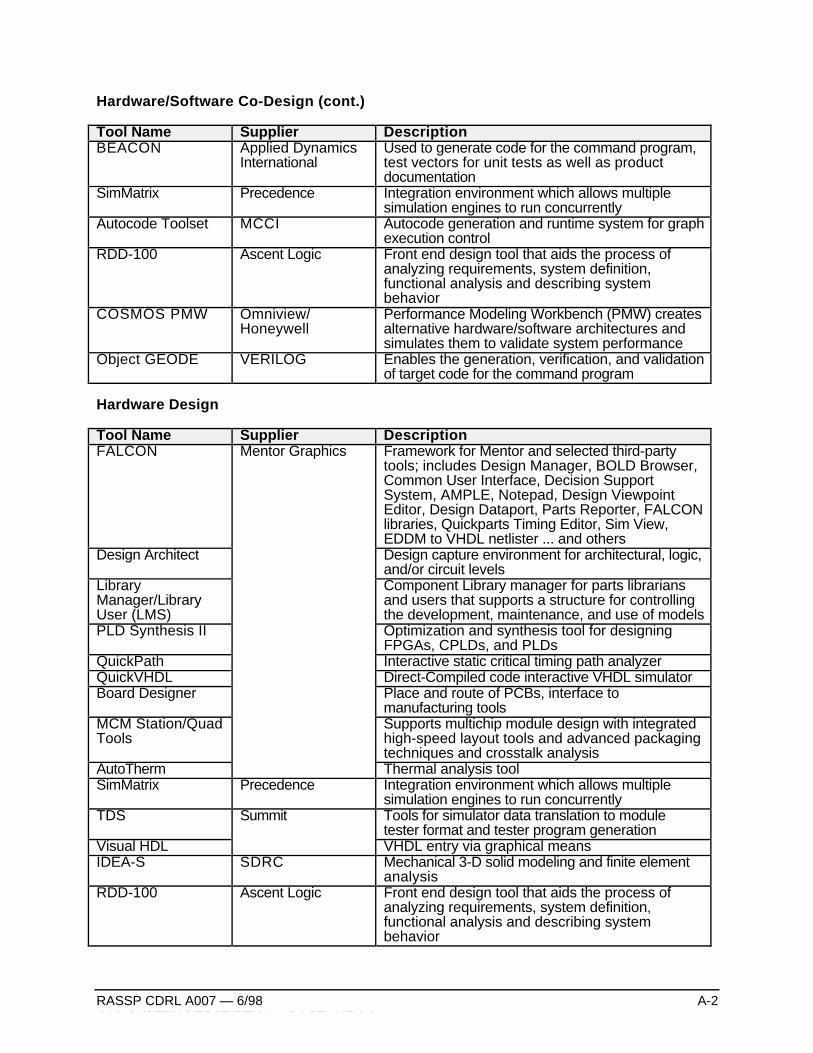
• ObjectGEODE from VERILOG enables the generation, verification and validation of target codefor the command program.
• BEACON from Applied Dynamics International (ADI) is an alternative tool to ObjectGEODE. Itcan be used to generate code for the command program, test vectors for unit tests as well asproduct documentation.
• Lucent’s SPEAR supports a customizable debugging environment for multiprocessors.
• University of Oregon’s PIE is an application and design evaluation environment.
• Management Communications and Control Inc.’s (MCCI) Autocoding Toolset providesautocode generation and a run-time system for graph execution control.
• GEDAE™ from Lockheed Martin ATL is a graphical programming and autcoding environment.
• Interleaf is the documentation production tool.
1.1.3 Hardware Design Tools
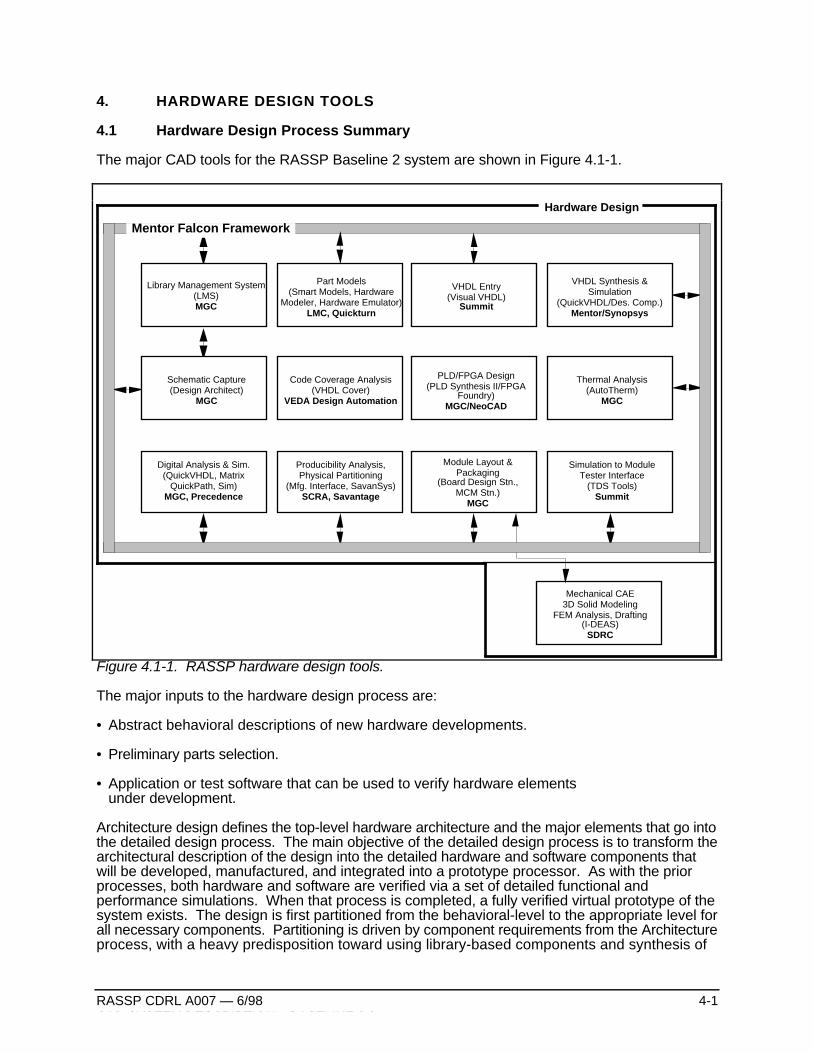
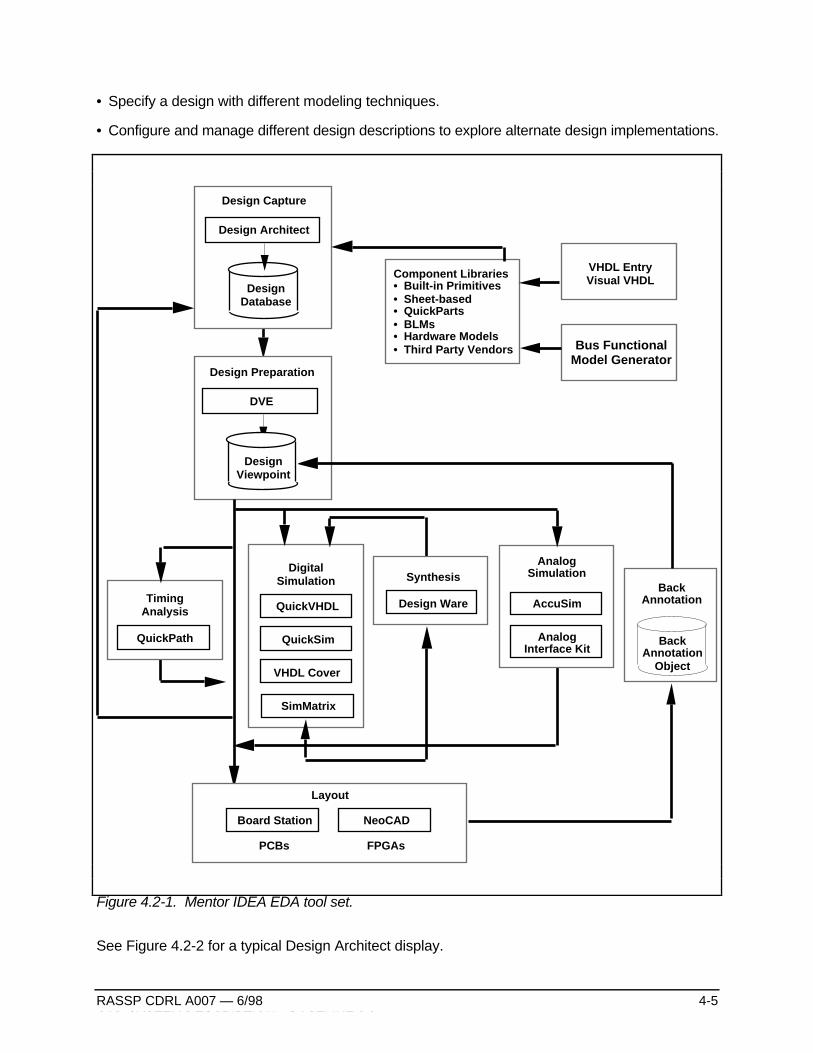
The RASSP Baseline 2 system provides design capabilities for hardware design in the digitaland mechanical areas. The hardware design tools shown in Figure 1.1-1 have been selected andare being integrated to provide a full complement of capabilities. Mentor provides the basesystem for design capture, simulation, and layout.
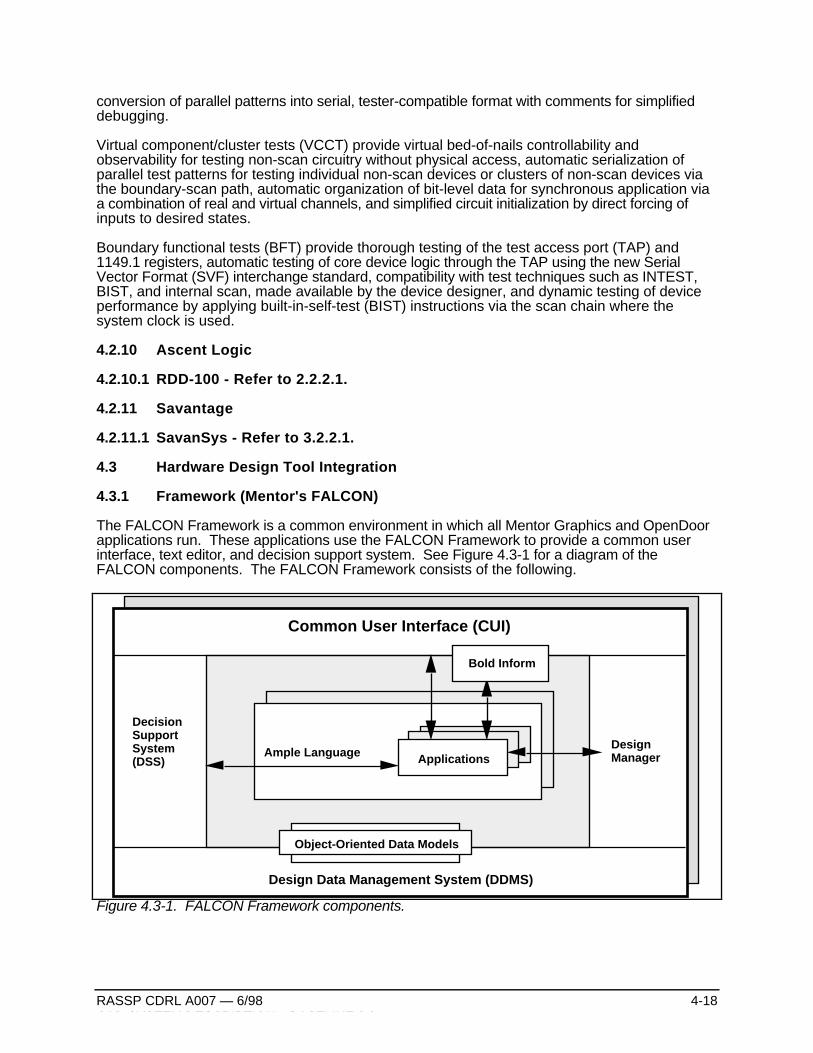
• Mentor's FALCON Framework is used to provide a common user interface and data interchangeand management capabilities. This framework is used to integrate Mentor tools and third-partyapplications into a single environment. The Mentor Graphics tools Design Architect,QuickVHDL, and QuickPath provide design capture, VHDL simulation, critical path analysis,functional simulation, statistical fault grading, and fault simulation, respectively. Physical designof modules is provided by the Board Station, Hybrid Station, and AutoTherm tools from MentorGraphics.
• SimMatrix from Precedence provides a simulation backplane to support co-simulation usingdifferent simulators.
• The System Realizer Family of Modular Emulation Systems from Quickturn Design Systemsprovides the capability for hardware emulations.
• VHDL is generated using the graphical tool, Visual HDL, from Summit Design.
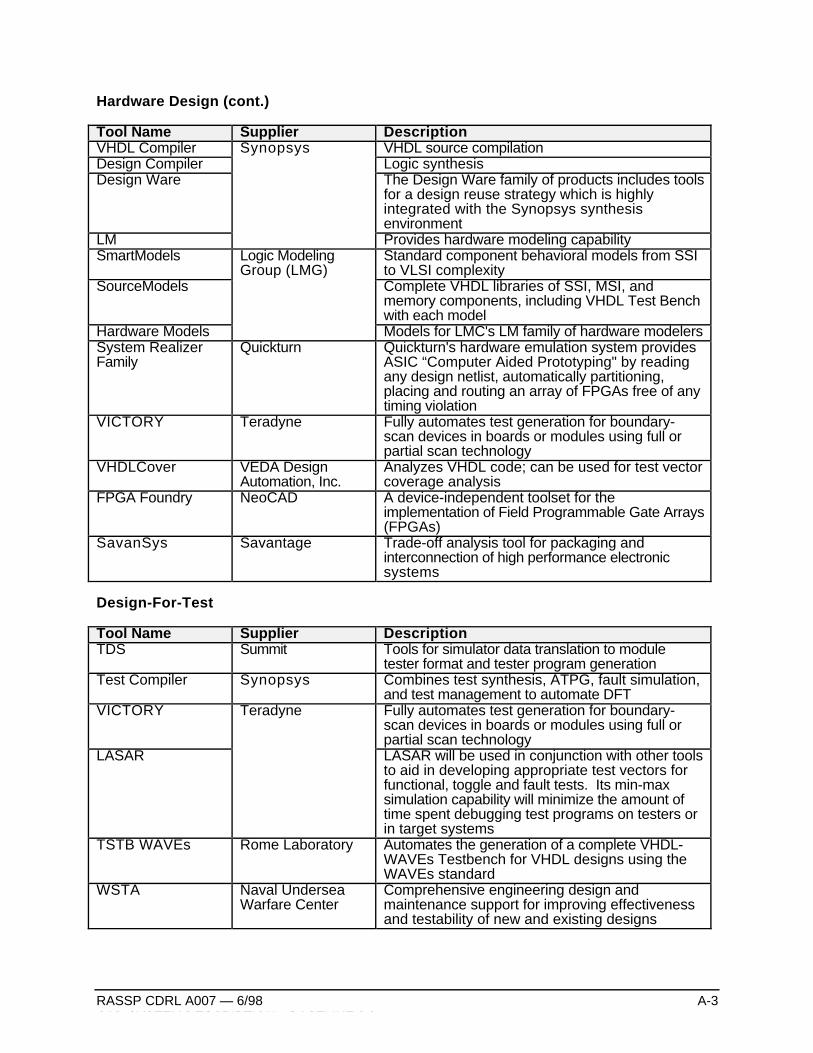
• Synopsys tools provide an environment for compiling, simulating, and synthesizing designdescriptions written in VHDL.
• Programmable Logic Device and FPGA design are supported by MGC's PLD Synthesis II andNeoCAD.
• Hardware modeling capability is provided by the LM family from the Synopsys Logic ModelingGroup.
• SavanSys from Savantage, Inc. is a tradeoff analysis tool focused on packaging andinterconnection of high-performance electronic systems.
• Testability analysis and test database translation is accomplished through VICTORY fromTeradyne and TDS from Summit, respectively.
• Managing part libraries for electrical design is accomplished through Mentor's LibraryManagement System (LMS) software.
• Mechanical design is supported primarily by software supplied by SDRC. Their I-DEASMaster Series software provides a complete complement of mechanical design capabilities,including thermal analysis, 2D (2-dimensional) and 3D design and modeling, and finite elementanalysis.
• VHDLCover from VEDA Design Automation, Inc. analyzes VHDL code and determines howthoroughly the design has been tested.
• RDD-100 (Requirements Driven Development) from Ascent Logic is used to capture systemrequirements, perform functional decomposition, model system behavior, allocate requirementsto components, and generate systems engineering documentation.
• Interleaf is the documentation production tool.
1.1.4 Design-For-Test Tools
The RASSP DFT toolset is integrated into all five processes of the RASSP methodology:systems, architecture, detailed hardware and software design and integration/test. The DFTtoolset interoperates with and in some cases uses functional design tools to support all phases ofthe product life cycle from design verification through manufacturing test and field support.
The Baseline 2 toolset is comprised of COTS tools which have been selected based uponfunction and inter-operability with the functional design tools.
System Process Tools
• TSTB WAVEs Test Vector generation packages from Rome Laboratory and integrated into theMentor QuickVHDL environment are used to develop test benches in WAVEs Level II format.
• WSTA by NUWC develops functional dependency models and diagnostic strategies.
• STAT by Detex Systems, Inc. develops functional dependency models and diagnosticstrategies from Mentor Design Architect netlists. A translator to the Personal Atlas WorkstationSoftware (PAWS) by TYX Corporation facilitates the incorporation of the data into TechnicalRequirement Documents.
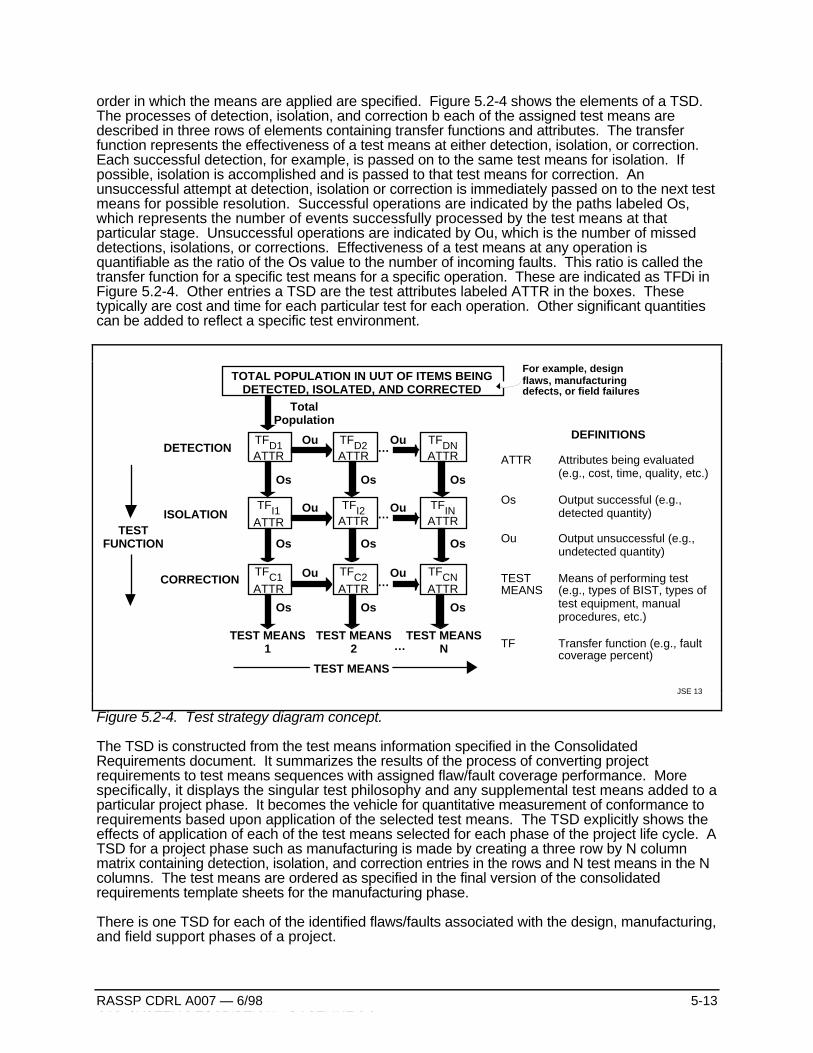
• The Test Strategy Diagram (TSD) is a graphical construct which describes how flaws andfaults associated with the life cycle phases of a project are handled by a set of assignedmeans. It is refined throughout all phases of the design cycle.
Architecture Definition Process Tools
• TSTB WAVEs packages, SW Test Works and STAT are used during the architecture definition(selection and verification) process similar to the system process as described above.
• During Architecture Selection and Verification, BIT and fault tolerant modes/functions arecaptured as algorithms and flowgraphs using the normal functional design tools such as SPWby Comdisco.
• During Architecture Verification BIST insertion, testability analysis and statistical fault gradingtools are used as the preliminary designs are developed. TSTB WAVEs is used to evaluatethe capabilities of test equipment in measurement of required system parameters.
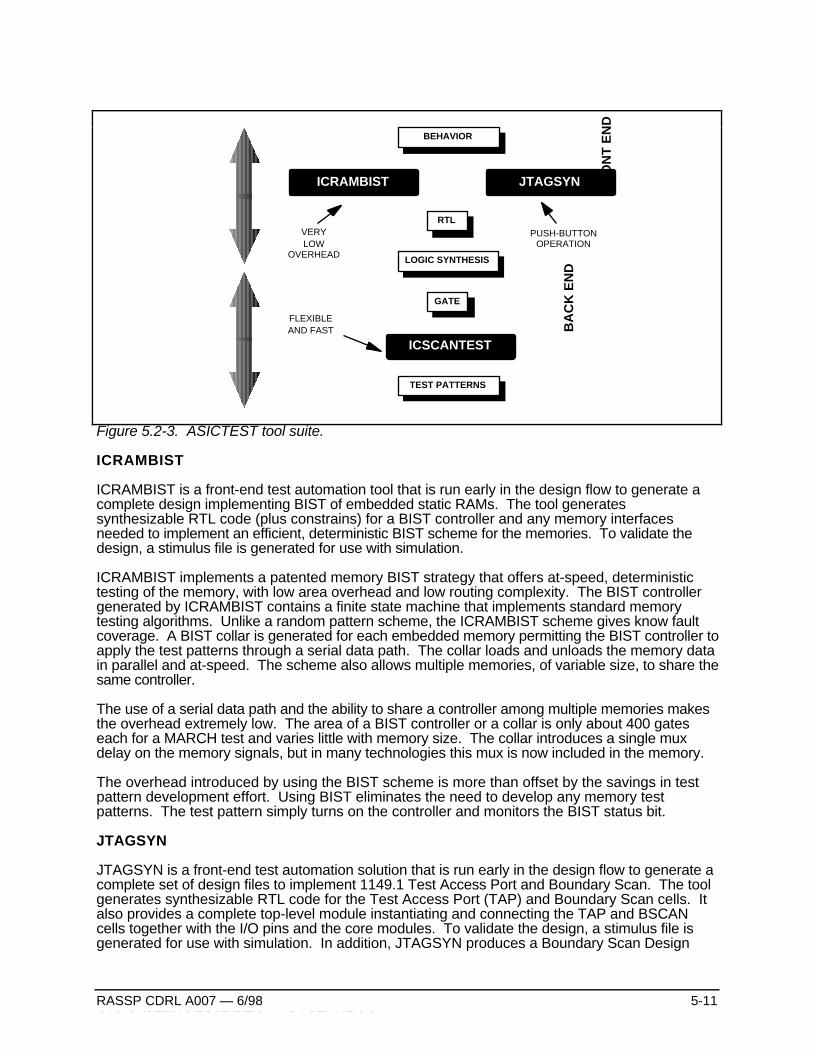
• ASICTEST by Logic Vision SW is used to perform preliminary test structure insertion (BISTand Boundary Scan) and to capture boundary scan descriptions of new ASICs for use inboard level testability analysis tools such as VTM:TOP.
Detailed Design
• TSTB WAVEs Test Vector generation packages from Rome Laboratory and integrated into theMentor QuickVHDL environment are used to develop test benches in WAVEs Level I format.
• STAT by Detex Systems, Inc. develops functional dependency models and diagnosticstrategies from Mentor Design Architect netlists. A translator to the Personal Atlas WorkstationSoftware (PAWS) by TYX Corporation facilitates the incorporation of the data into TechnicalRequirement Documents.
• ASIC Test Tool Suite by Logic Vision SW is used to perform test structure insertion (BIST andBoundary Scan), test pattern generation, fault grading and to capture boundary scandescriptions of new ASICs for use in board level testability analysis tools such as VTM:TOP.
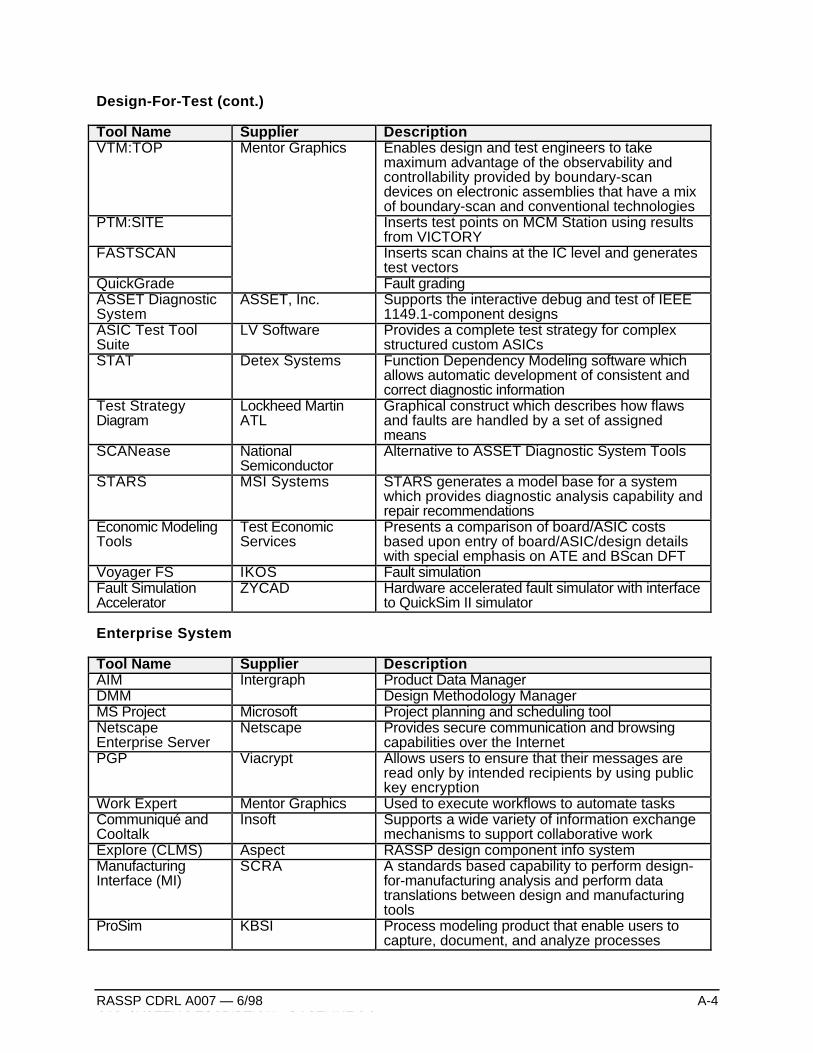
• VTM:TOP by Mentor Graphics is used to assess the board/MCM testability based uponboundary scan and testpoint insertion.
• VICTORY by Teradyne is used to generate boundary scan test vectors for device oriented(BICT, VCT and BFT), network-oriented test (VIT and VCCT) for virtual interconnect test ofcomponents and clusters.
• LASAR will be used in conjunction with other tools to aid in developing appropriate test vectorsfor functional, toggle and fault tests. Its min-max simulation capability will minimize the amount oftime spent debugging test programs on testers or in target systems.
• TDS by Summit is used for conversion and enhancement of simulation test vectors into testerspecific formats.
• ASSET Diagnostic System is used to develop boundary scan test programs and diagnostics.During integration and test phases, ASSET is used to control, debug and isolate problems.ASSET's Scan Function Library and ScanEngine are used to generate test programs forembedded T&M controllers which control 1149.1 resources.
• Synopsys Test Compiler combines test synthesis, ATPG, fault simulation, and testmanagement to automate DFT.
• Mentor FASTSCAN, QuickGrade, and PTM:SITE are used for scan insertion, fault grading, andtest point insertion, respectively.
• SCANease is an alternative to ASSET Diagnostic System Tools.
• STARS (formerly DARTS) from MSI Systems generates a model base for a system whichprovides diagnostic analysis capability and repair recommendations.
• Economic Modeling Tools from Test Economic Services present a comparison of board/ASICcosts based upon entry of board/ASIC/design details with special emphasis on ATE andBScan DFT.
• IKOS Voyager is proposed to be used for fault simulation.
• The Fault Simulation Accelerator from ZYCAD may be used.
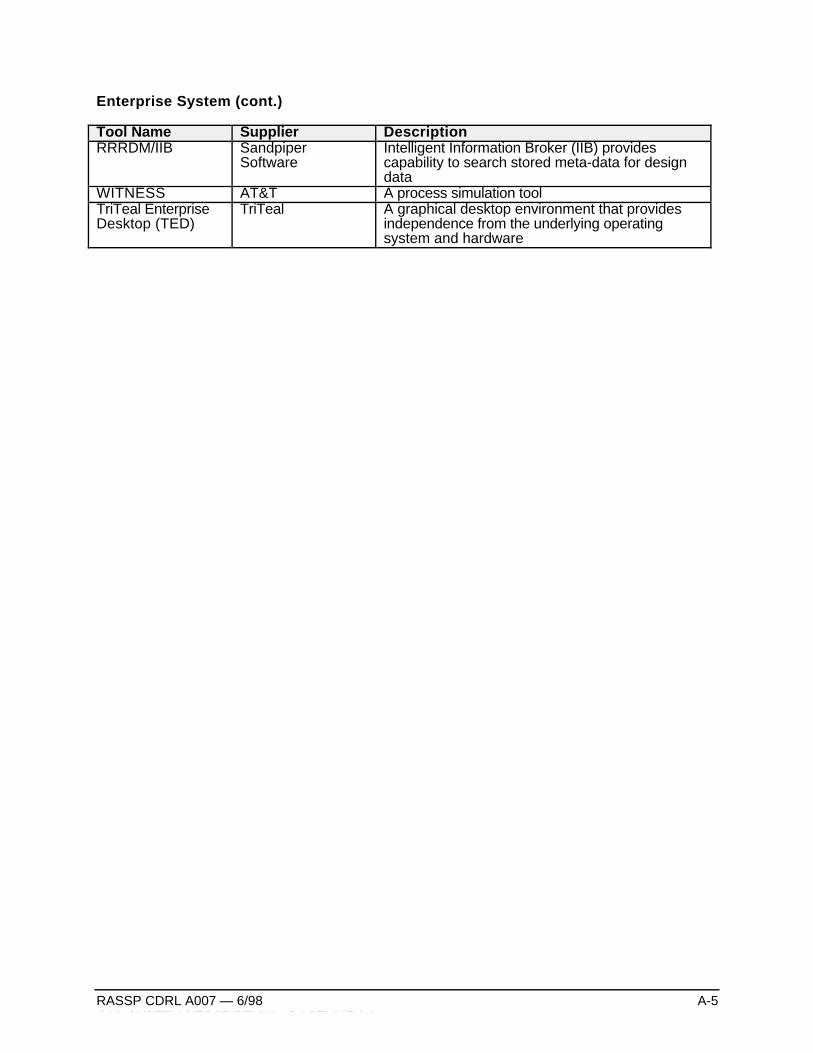
1.1.5 Enterprise System Tools
An enterprise system provides the tools and facilities for managing and providing access to theenterprise information and integrating the automated processes of an enterprise. The enterprisesystem for RASSP is defined as the integrated set of tools and facilities required to support thedevelopment of a signal processor prototype - design, manufacturing, test, management,procurement, etc. These tools include the following:
• DMM (Design Methodology Manager) from Intergraph is used to execute workflows(methodology) defined for a project or a high level task such as detailed design.
• DM (Document Manager) from Intergraph is used to manage product information across theenterprise.
• Explore (CLMS) from Aspect classifies, manages and cross-references all component, supplierand design data and automates the processes associated with this information, as well as theVIP Family of Component Reference Databases.
• TriTeal Enterprise Desktop (TED) from TriTeal is a graphical desktop environment that providesindependence from the underlying operating system and hardware.
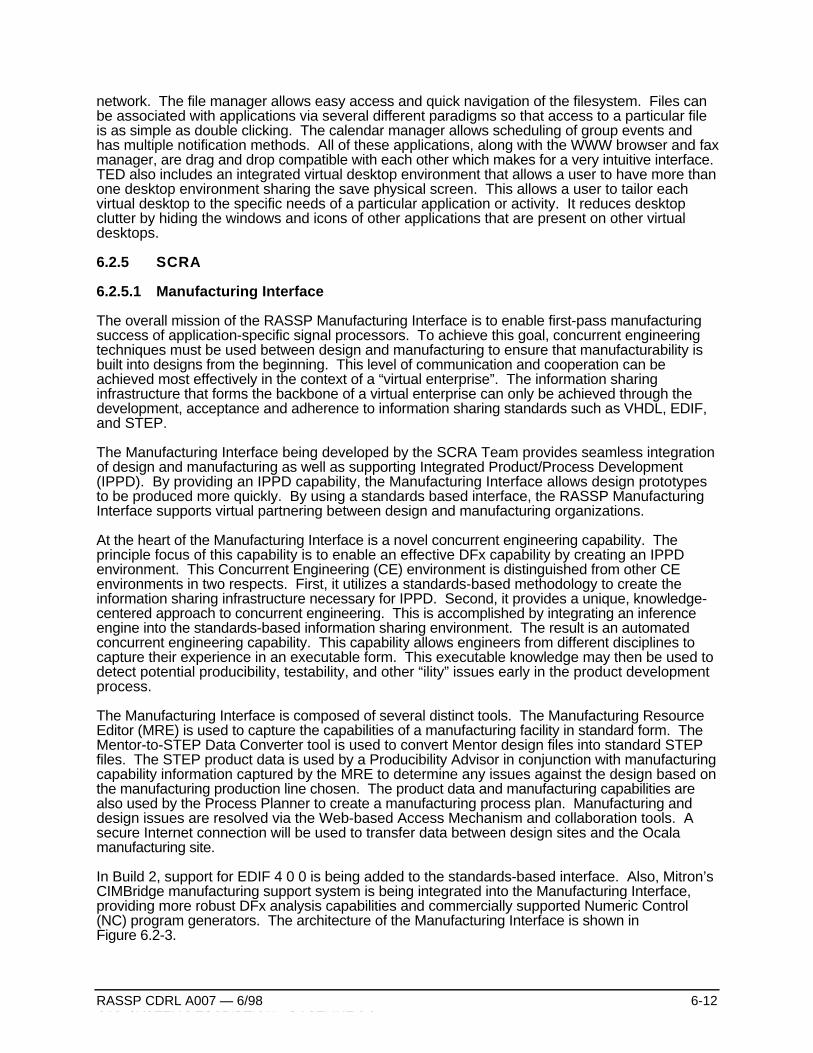
• MI (Manufacturing Interface) from SCRA is a standards based capability to perform design-for-manufacturing analysis and perform data translations between design and manufacturing tools.
• Communiqué and Cooltalk by Insoft support a wide variety of information exchangemechanisms to support collaborative work.
• Netscape Enterprise Server from Netscape provides secure communication and browsingcapabilities over the Internet.
• PGP from Viacrypt allows users to ensure that their messages are read only by intendedrecipients by using public key encryption.
• WorkExpert from Mentor is used to execute workflows to automate tasks.
• ProSim from KBSI is a process modeling tool used to capture processes and tasks relatedinformation. ProSim generates models that can be simulated by simulation tools such asWITNESS.
• WITNESS from AT&T is a discrete event simulation engine that provides capabilities to performwhat-if analysis and evaluate alternatives based on simulation results.
• MS Project from Microsoft is used to perform project planning, scheduling, and tracking.
1.2 Hardware for CAD Environment
The high performance SPARCsystem and Series 700 workstations developed by SUNMicrosystems and Hewlett Packard, respectively, are the hardware platforms that have beenselected to support the RASSP design process. These hardware platforms come in a variety ofconfigurations to support even the most demanding engineering task. The workstation type,RAM, local disk space, and server/network performance are the main factors in determining theoverall performance. Each user's workstation should have sufficient RAM to support the entiretool set. A minimum of 64 MB of RAM is required (128 MB is preferred) for an individualworkstation. At least 300 MB of local hard disk should be allocated for the “swap" area requiredfor the implementation of virtual memory. An initial estimate should be taken to determine the disksize of the server or central repository. At least 10 GB will be required and, depending on thesize of the project, 50 GB or more may be required.
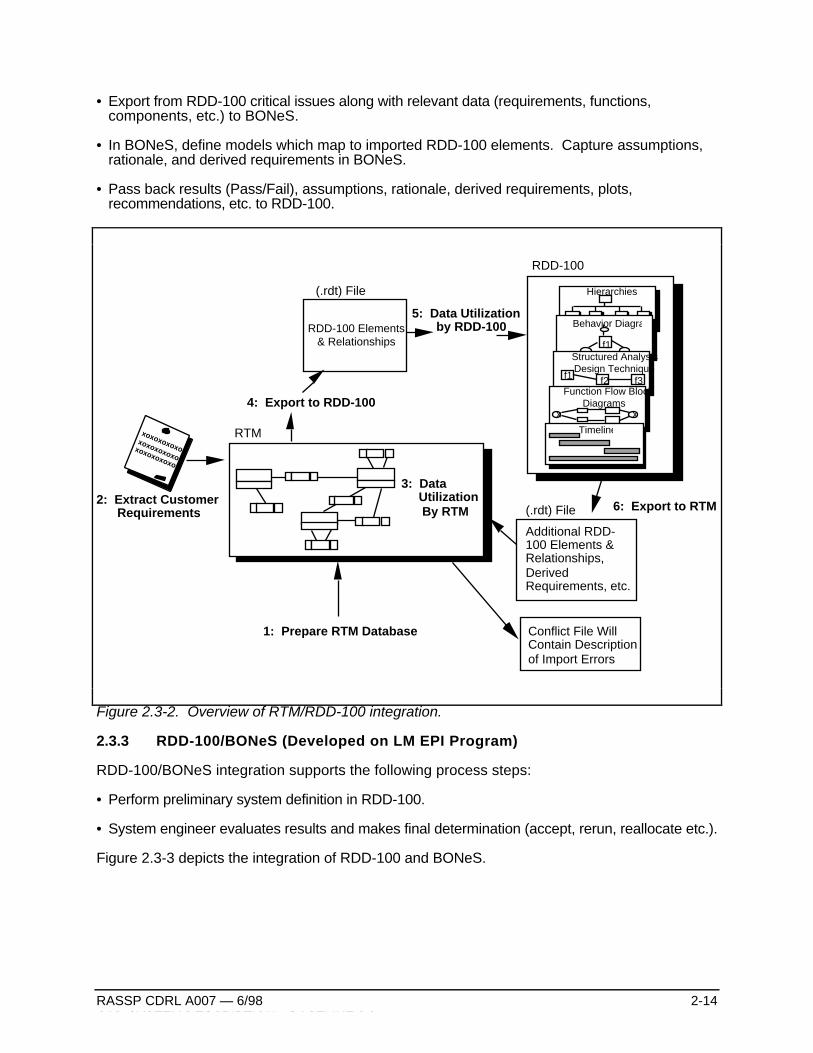
The System design process encompasses the following steps:
• Extract customer requirements from source documents using either RDD-100 or RTM as therequirements tool.
• Perform requirements engineering management/clarification/traceability using the selectedrequirements tool. Define keywords, rules and relationships. Expand/focus requirements fortestability and verification while maintaining an audit trail.
• Export data (requirements, relationships, etc.) to RDD-100 if RTM is used as the requirementstool. One-to-one mapping of elements between RDD-100 and RTM is required. This initialbaseline for requirements analysis can be maintained in RTM for tracking purposes.
• Use RDD-100 in conjunction with BONeS, SPW, and MATLAB to perform System Definition,Functional Analysis, Functional Allocation, Interface Design, scenario development, threadanalysis, etc. Derived requirements will be identified.
• Derived requirements along with functional allocations will be exported back to RTM to maintaintraceability throughout the program lifecycle if RTM is used as the requirements tool.
• RDD-100 will export data which requires detailed simulation, performance verification, andarchitectural tradeoffs to BONeS. Traceability is maintained in RTM if RTM is used as therequirements tool.
• RDD-100 will generate system and subsystem specifications, SSDD, ICD's, etc. in Interleaf.
2.2 System Design CAE Tools
The RASSP Baseline 2 Systems design toolset includes:
• RTM (Requirements and Traceability Management) from Marconi Systems is used as therequirements traceability tool throughout a program's engineering life cycle.
• RDD-100 (Requirements Driven Development) from Ascent Logic is used to capture systemrequirements, perform functional decomposition, model system behavior, allocate requirementsto components, and generate systems engineering documentation.
• BONeS (Block Oriented Network Simulator) from Alta Group is used to perform token-basedhigh-level system simulation, such as modeling network traffic, and is used to obtain detailedperformance metrics early in the system design.
• PRICE S/M/H/HL from Lockheed Martin PRICE Systems is used for computer-aided parametriccost estimating and enables life-cycle cost analysis throughout the design process.
• RAM/ILS from MSI enables feedback on reliability, availability, maintainability, and integratedlogistics to support early tradeoff analyses.
• GEDAE™ from Lockheed Martin ATL is a graphical programming and autocoding environment.
• MATLAB from Mathworks for algorithm development and numerical analysis.
• The Component and Library Management System (Explore (CLMS)) from Aspect is an object-oriented extension to the existing commercially-available Component Information System (CIS)product that forms the basis of the design reuse library.
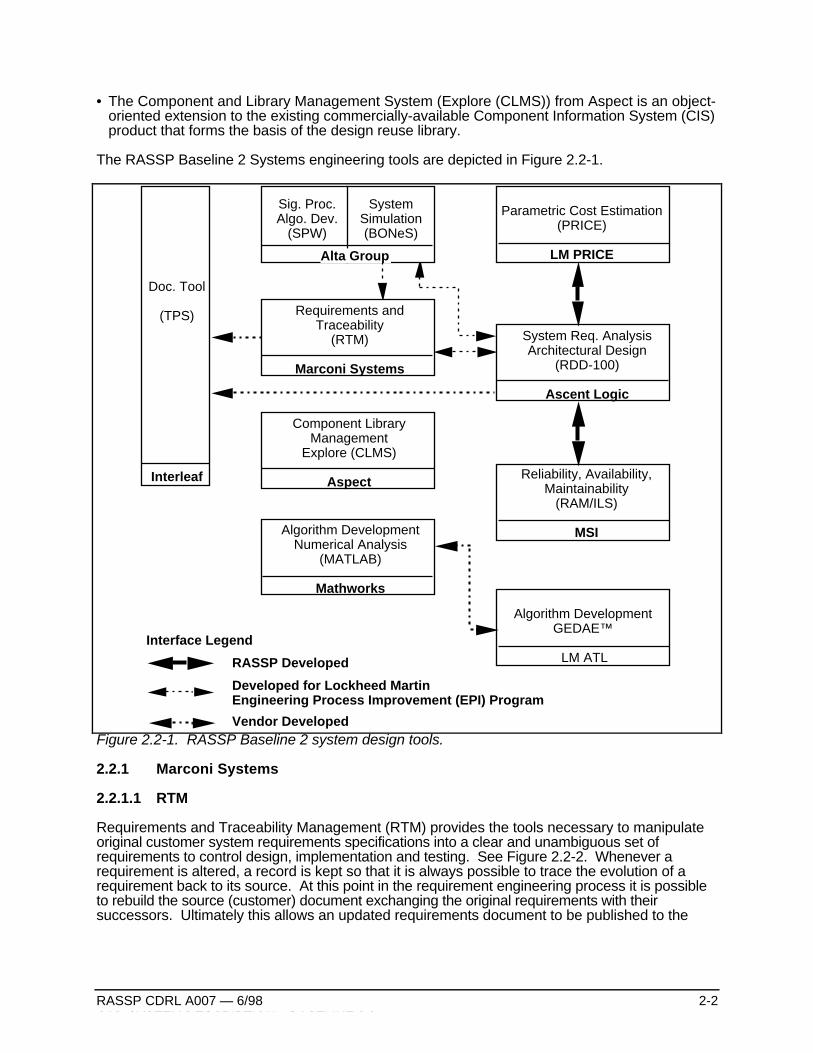
The RASSP Baseline 2 Systems engineering tools are depicted in Figure 2.2-1.
Doc. Tool
(TPS)
Interleaf
System Simulation(BONeS)
Sig. Proc. Algo. Dev.
(SPW)
Alta Group
Parametric Cost Estimation(PRICE)
LM PRICE
Requirements andTraceability
(RTM)
Marconi Systems
System Req. AnalysisArchitectural Design
(RDD-100)
Ascent Logic
Component Library Management
Explore (CLMS)
AspectReliability, Availability,
Maintainability(RAM/ILS)
MSIAlgorithm Development Numerical Analysis
(MATLAB)
Mathworks
Algorithm Development GEDAE™
LM ATLInterface Legend
RASSP Developed
Developed for Lockheed Martin Engineering Process Improvement (EPI) Program
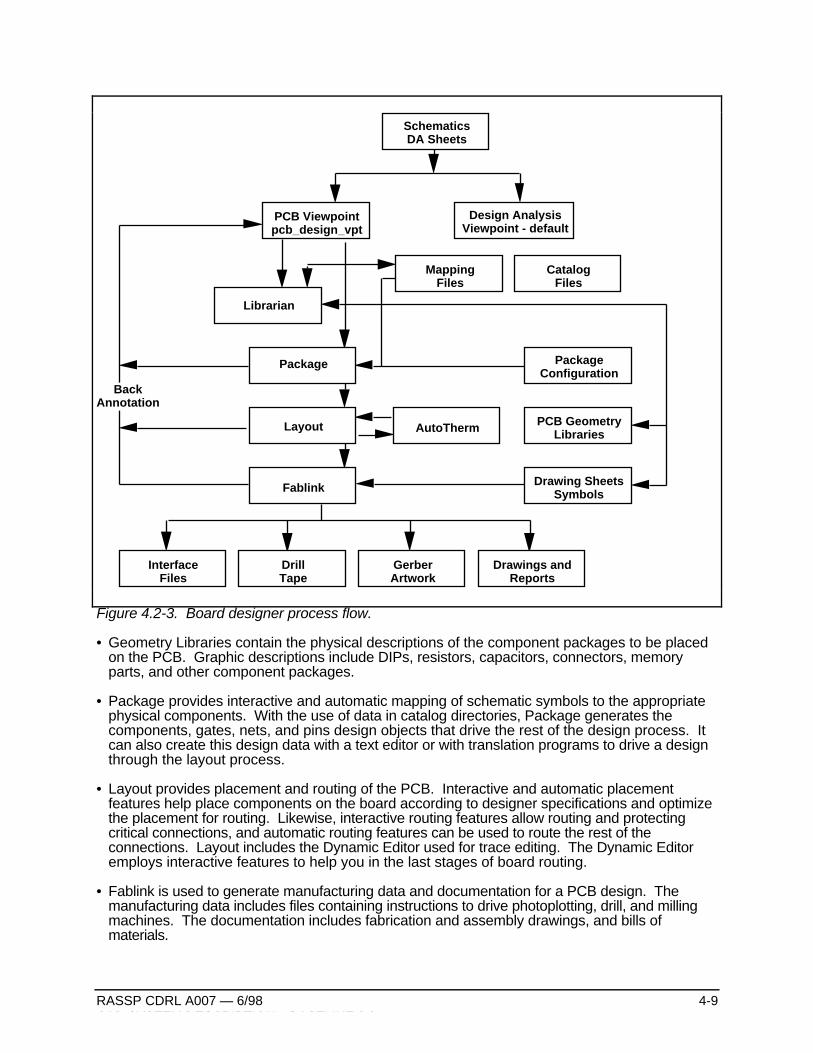
Vendor DevelopedFigure 2.2-1. RASSP Baseline 2 system design tools.
2.2.1 Marconi Systems
2.2.1.1 RTM
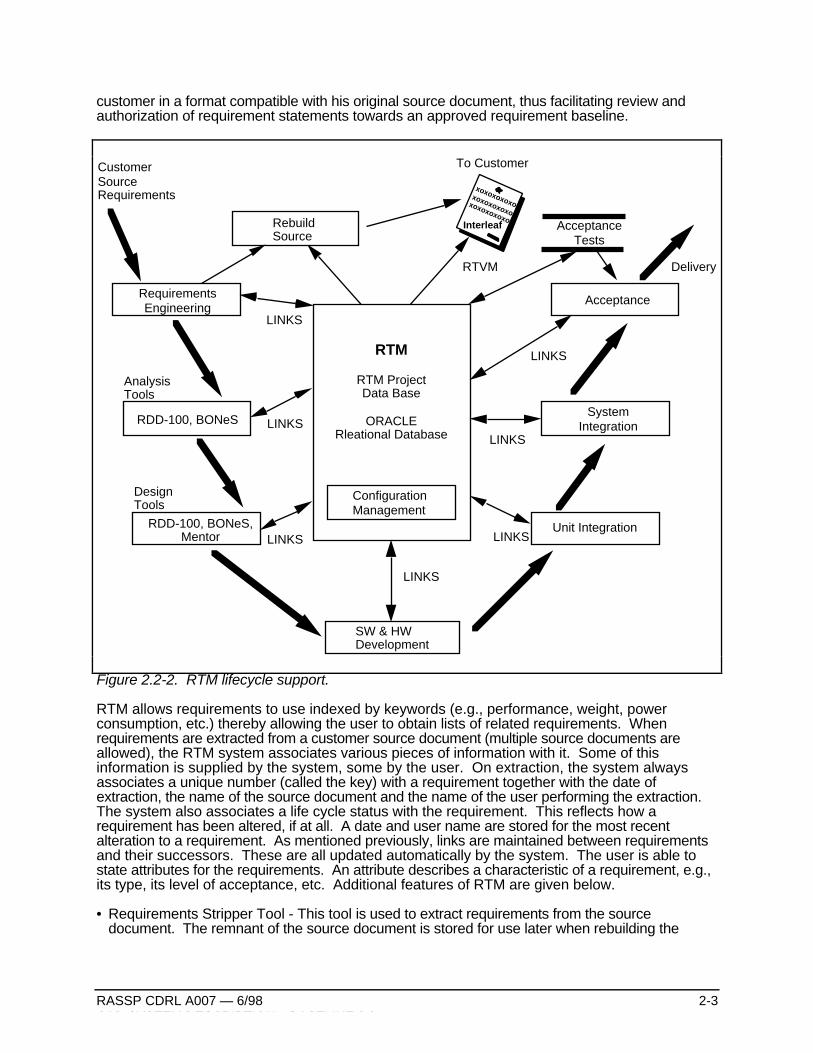
Requirements and Traceability Management (RTM) provides the tools necessary to manipulateoriginal customer system requirements specifications into a clear and unambiguous set ofrequirements to control design, implementation and testing. See Figure 2.2-2. Whenever arequirement is altered, a record is kept so that it is always possible to trace the evolution of arequirement back to its source. At this point in the requirement engineering process it is possibleto rebuild the source (customer) document exchanging the original requirements with theirsuccessors. Ultimately this allows an updated requirements document to be published to the
customer in a format compatible with his original source document, thus facilitating review andauthorization of requirement statements towards an approved requirement baseline.
Requirements Engineering
CustomerSourceRequirements
AnalysisTools
RDD-100, BONeS
DesignTools
RDD-100, BONeS, Mentor
Rebuild Source
To Customer
RTVM
LINKS
LINKS
LINKS
LINKS
LINKS
LINKS
Acceptance Tests
Acceptance
Delivery
System Integration
Unit Integration
SW & HW Development
RTM
RTM Project Data Base
ORACLERleational Database
Configuration Management
xoxoxoxoxoxoxoxoxoxo
xoxoxoxoxoInterleaf
LINKS
Figure 2.2-2. RTM lifecycle support.
RTM allows requirements to use indexed by keywords (e.g., performance, weight, powerconsumption, etc.) thereby allowing the user to obtain lists of related requirements. Whenrequirements are extracted from a customer source document (multiple source documents areallowed), the RTM system associates various pieces of information with it. Some of thisinformation is supplied by the system, some by the user. On extraction, the system alwaysassociates a unique number (called the key) with a requirement together with the date ofextraction, the name of the source document and the name of the user performing the extraction.The system also associates a life cycle status with the requirement. This reflects how arequirement has been altered, if at all. A date and user name are stored for the most recentalteration to a requirement. As mentioned previously, links are maintained between requirementsand their successors. These are all updated automatically by the system. The user is able tostate attributes for the requirements. An attribute describes a characteristic of a requirement, e.g.,its type, its level of acceptance, etc. Additional features of RTM are given below.
• Requirements Stripper Tool - This tool is used to extract requirements from the sourcedocument. The remnant of the source document is stored for use later when rebuilding the
document. As each requirement is extracted, the user optionally enters a paragraph identifier(paragraph ID) and attribute values as appropriate. The paragraph ID is a type of index toindicate the original position in the document of the requirement.
• Requirement Focus Tool - This tool is used to combine requirements with similar meaning, sothat a single consistent version can be maintained. When there are several source documents,there may be several duplicated requirements, possibly with similar wording. The tool may alsobe used to alter or enter clarification and query text, e.g., to justify the focusing of theserequirements together.
• Requirement Expansion Tool - The Requirement Expansion tool is the opposite of the Focustool. It allows extracted requirements to be split into several expansion (substitute)requirements. It is used when a requirement from a source (spec., RFP, etc.) encompasses anumber of individual requirements. Splitting the compound requirement allows each of theconstituents to have its own set of attributes, and to be mapped to the most appropriate part ofthe design process. Clarification and query text may be entered and altered for therequirements.
• Requirement Editor Tool - The Requirement Editor tool provides the remaining functionsessential for requirement alteration. The editor makes it possible to mark a requirement asdeleted (i.e., that it is redundant, no longer required). A requirement may be changed andreplaced. To correct errors, derived requirements (i.e., not directly extracted from the sourcedocument) may be deleted from the Project Database. Clarification and Query text may beentered and altered for the requirements.
• Keyword Editor Tool - This tool performs the task of “grouping" requirements. Keywords maybe entered as a form of classification and requirements may be linked to them in various ways.It is possible to view a list of requirements classified by a particular keyword. Keywords canthemselves be grouped into hierarchies.
2.2.2 Ascent Logic
2.2.2.1 RDD-100
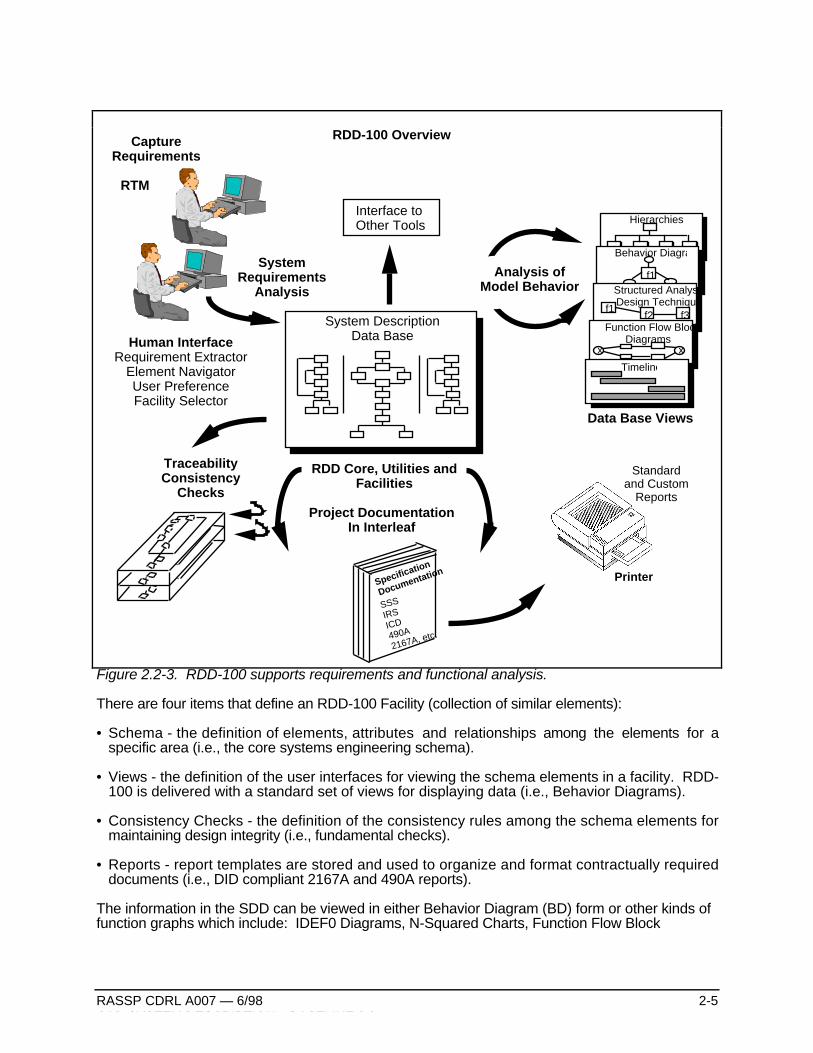
RDD-100 is a front–end tool that supports the requirements and functional analysis steps of theRASSP EPI Baseline Systems Engineering process. It enables the systems engineer to takeRTM-captured requirements for top–level system design, analyze and model behavior thatsatisfies those requirements, design components that implement that behavior, examinearchitecture tradeoffs, and handle exceptions. See Figure 2.2-3.
Throughout this process, RDD-100 performs hundreds of static consistency checks to verify thecompleteness and traceability of the system under design. The Dynamic Verification Facility(DVF) is used observe the dynamic behavior of the system for potential timing or resourceutilization problems.
RDD-100 uses predefined templates to create a variety of customer documents (for example,DOD-STD-2167A System/Segment Specifications, Interface Requirements Specifications, andseveral versions of the Software Requirements Specification). This customer documentation isextracted directly from the data generated during the verification of the design and system modelanalysis. Project documentation is therefore a byproduct of the systems engineering process,and it is always congruent with the system model.
RDD-100 contains a collection of utilities for creating, accessing, manipulating, extending, viewing,analyzing, and interfacing to/from elements in the System Descriptor Database (SDD). Thesystem design is described in an Entity/Relationship/Attribute (ERA) Model. With this notation, auser specifies instances of elements (e.g., System Requirements) and describes their specificattributes and relationships to other elements (e.g., functions that fulfill those requirements).
Element NavigatorUser Preference Facility Selector
TraceabilityConsistency
Checks
RDD Core, Utilities and Facilities
Project Documentation In Interleaf
Printer
System DescriptionData Base
Analysis of Model Behavior
Capture Requirements
RTM
Data Base Views
Hierarchies
f1
Behavior Diagram
f1f2 f3
Structured Analysis Design Technique
Function Flow Block Diagrams
x
Timeline
Standard and Custom
Reports
x
SSS
IRSICD490A
2167A, etc.
Specification
Documentation
Figure 2.2-3. RDD-100 supports requirements and functional analysis.
There are four items that define an RDD-100 Facility (collection of similar elements):
• Schema - the definition of elements, attributes and relationships among the elements for aspecific area (i.e., the core systems engineering schema).
• Views - the definition of the user interfaces for viewing the schema elements in a facility. RDD-100 is delivered with a standard set of views for displaying data (i.e., Behavior Diagrams).
• Consistency Checks - the definition of the consistency rules among the schema elements formaintaining design integrity (i.e., fundamental checks).
• Reports - report templates are stored and used to organize and format contractually requireddocuments (i.e., DID compliant 2167A and 490A reports).
The information in the SDD can be viewed in either Behavior Diagram (BD) form or other kinds offunction graphs which include: IDEF0 Diagrams, N-Squared Charts, Function Flow Block
Diagrams (FFBD), or Data Flow Diagrams (DFD). Behavior diagrams display the most informationand you must create a Behavior Diagram before the information can be displayed in any otherfunction graph type.
Another system view is provided by the Hierarchy Chart. These charts start with a top levelelement and trace through one or more relationships down a hierarchy to any number of levels.
This output can be an Interleaf “book", a postscript file, arbitrary ASCII output, EncapsulatedPostScript files, or Context Document compatible. The user can generate report specificationsfrom scratch, or modify the supplied templates.
A Behavior Diagram is a graphic view which represents both input/output data flow and a timeorder sequence of events. Behavior Diagrams can be decomposed hierarchically, show order offunctional activation (precedence/relationship), define control data flow, and exit (completion)conditions. Related text shows performance traceability and other data (such as textdescriptions). The sequence of behavior flow is generally top down and left to right. Behaviordiagrams are comprised of Functions and Items. Functions and Items can be either Time orDiscrete. A Function is a part of the system that carries out an action (i.e., convert an input to anoutput). An Item is something that a function accepts (input) or produces (output).
Behavior Diagrams have many constructs that control time flow. Refer to Figure 2.2-4. Theyinclude; Sequence, Concurrence, Select, Iterate and Replicate. A sequence is the simplest andmost common structure. It consists of a single, vertical time-flow line with a series of functions inorder from top to bottom.
A concurrence or parallel represents multiple paths of a process that can occur at the same timebased on certain conditions, inputs, etc. Functions below the concurrence cannot start until allbranches of the concurrence have completed. For example if there are two branches in aconcurrence and one branch takes 5 minutes to complete and the other branch takes 5 hours andif both were started at the same time, functions after the concurrence could not be executed untilthe 5 hour branch is complete.
The Block Oriented Network Simulator (BONeS) provides a Motif graphical environment forcapturing the design of communication networks and simulating the performance of the captureddesign. The network design is created graphically by hierarchical, data flow block diagramgeneration.
The Data Structure Editor (DSE) is used to create data structures which are defined hierarchicallyand have an arbitrary number of fields. Fields can contain simple entities such as packet lengthsand time stamps, or other data structures.
The Block Diagram Editor (BDE) is used to create network models. Primitives and other blocksare placed and connected to perform functions.
When the network model is completed, error and consistency checking is done. An event drivensimulation of the network is executed using the Simulation Manager with user specified values formodel parameters. An interactive simulation can be run to watch the flow of data on the diagram.Simulation continues until there are no more data structures in the block diagram or until thesimulation clock reaches a user specified stop time.
During simulation BONeS collects data in the network using a variety of probes at user specifiedlocations. The data collected during simulation is analyzed and displayed graphically using thePost Processor (PP). A variety of statistical analysis routines are available.
2.2.3.2 Signal Processing Worksystem (SPW)
The Signal Processing Worksystem (SPW) provides tools needed to interactively capture,simulate, and test a wide range of digital signal processing (DSP) designs. SPW is used toevaluate various architectural approaches to a design and to develop, simulate and fine tuneDSP algorithms.
The Block Diagram Editor (BDE) is used to create network models. Primitives and other blocksare placed and connected to perform functions.
The Signal Display Editor (SDE) is used to create, display, edit, process and analyze signalwaveforms.
The Simulation Program Builder converts the signal flow block diagram from the BDE databaseinto an executable program that simulates the behavior of the signal processing system. It takesthe simulation inputs from the SDE database and places the simulations outputs into the SDEdatabase
2.2.4 Mathworks
2.2.4.1 MATLAB
MATLAB is a high-performance, interactive numeric computation and visualization environment. Itcombines the advantages of hundreds of prepackaged advanced math and graphics functions,with the flexibility and extensibility of a high-level language to customize and add new functionsas needed. MATLAB combines numeric analysis, matrix computation, sparse matrix computation,signal processing, 2-D and 3-D graphics, and other functions with a user interface whereproblems and solutions are expressed mathematically without the need for traditionalprogramming.
MATLAB application toolboxes extend the functionality of MATLAB by providing algorithms andfunctions developed by renowned experts in digital signal processing, control system design,
neural networks, system identification, dynamic simulation, optimization, and other applicationareas.
The MATLAB Signal Processing Toolbox works with MATLAB numeric computation software for1-D and 2-D digital signal processing and time-series analysis. The Toolbox includes 1-D and 2-D FFTs and inverses, FIR and IIR filter design, filter response and simulation, and powerspectrum estimation.
2.2.5 MSI
2.2.5.1 RAM/ILS
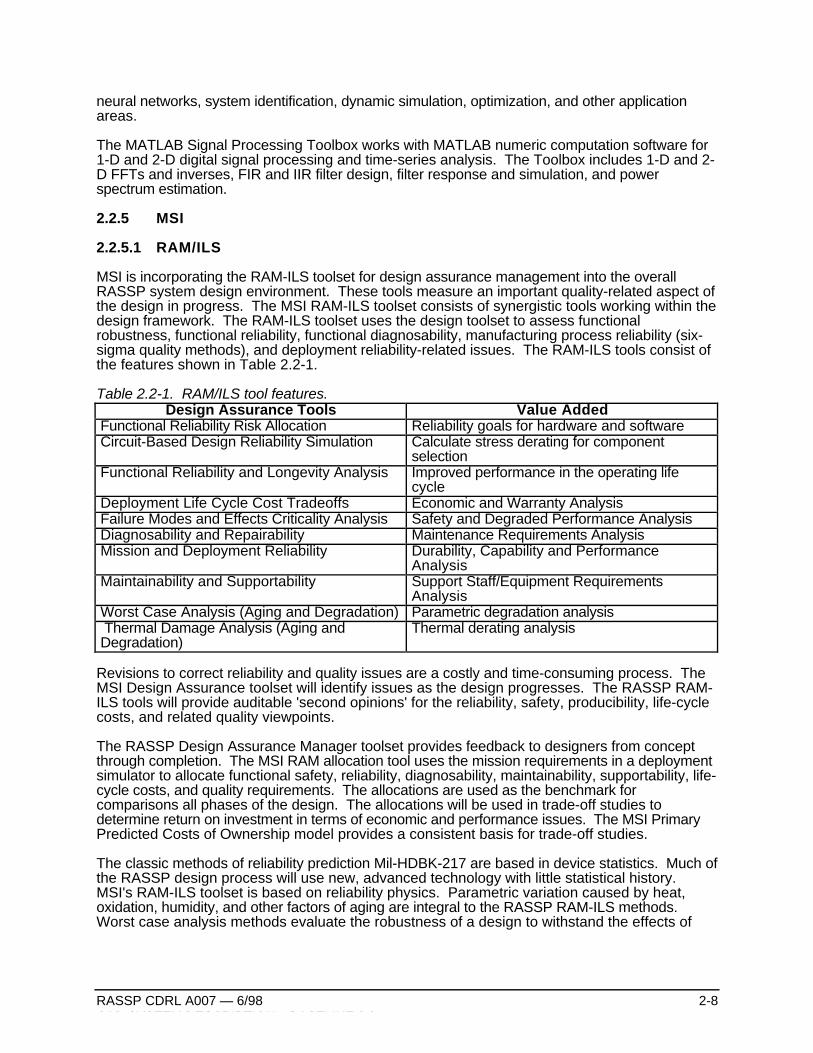
MSI is incorporating the RAM-ILS toolset for design assurance management into the overallRASSP system design environment. These tools measure an important quality-related aspect ofthe design in progress. The MSI RAM-ILS toolset consists of synergistic tools working within thedesign framework. The RAM-ILS toolset uses the design toolset to assess functionalrobustness, functional reliability, functional diagnosability, manufacturing process reliability (six-sigma quality methods), and deployment reliability-related issues. The RAM-ILS tools consist ofthe features shown in Table 2.2-1.
Table 2.2-1. RAM/ILS tool features.Design Assurance Tools Value Added
Functional Reliability Risk Allocation Reliability goals for hardware and softwareCircuit-Based Design Reliability Simulation Calculate stress derating for component
selectionFunctional Reliability and Longevity Analysis Improved performance in the operating life
cycleDeployment Life Cycle Cost Tradeoffs Economic and Warranty AnalysisFailure Modes and Effects Criticality Analysis Safety and Degraded Performance AnalysisDiagnosability and Repairability Maintenance Requirements AnalysisMission and Deployment Reliability Durability, Capability and Performance
AnalysisMaintainability and Supportability Support Staff/Equipment Requirements
AnalysisWorst Case Analysis (Aging and Degradation) Parametric degradation analysis Thermal Damage Analysis (Aging andDegradation)
Thermal derating analysis
Revisions to correct reliability and quality issues are a costly and time-consuming process. TheMSI Design Assurance toolset will identify issues as the design progresses. The RASSP RAM-ILS tools will provide auditable 'second opinions' for the reliability, safety, producibility, life-cyclecosts, and related quality viewpoints.
The RASSP Design Assurance Manager toolset provides feedback to designers from conceptthrough completion. The MSI RAM allocation tool uses the mission requirements in a deploymentsimulator to allocate functional safety, reliability, diagnosability, maintainability, supportability, life-cycle costs, and quality requirements. The allocations are used as the benchmark forcomparisons all phases of the design. The allocations will be used in trade-off studies todetermine return on investment in terms of economic and performance issues. The MSI PrimaryPredicted Costs of Ownership model provides a consistent basis for trade-off studies.
The classic methods of reliability prediction Mil-HDBK-217 are based in device statistics. Much ofthe RASSP design process will use new, advanced technology with little statistical history.MSI's RAM-ILS toolset is based on reliability physics. Parametric variation caused by heat,oxidation, humidity, and other factors of aging are integral to the RASSP RAM-ILS methods.Worst case analysis methods evaluate the robustness of a design to withstand the effects of
radiation, aging, electrical, mechanical, and thermal conditions. Digital and analog design tools areintegral to the RAM-ILS evaluation.
2.2.6 Lockheed Martin ATL
2.2.6.1 GEDAE™
GEDAE™ is a highly interactive graphical programming and autocoding environmentwhich facilitates application development, debugging, and optimization on workstations orembedded systems. Its graphical editor supports building data flow graphs which are veryreadable. Explicit inputs and outputs are identified and user notes can be inserted directly on thegraph canvas. The same user interface which supports the graphical editor is used for controllingall activity within GEDAE™. Capability is provided for the designer to readily partition graphsand map the partitions to multiple workstations or multiple processors in an embedded system.Autocoding generates appropriate schedules and code for each processing element which isefficient in terms of execution time and memory usage.
A GEDAE™ Run-Time Kernel provides all of the interprocessor communication required by theparticular software mapping. Although the designer has flexibility in selecting the type ofcommunication used (e.g., socket, DMA, or shared memory), implementation of the communicationis automatic. Therefore, the application developer never needs to write any interprocessorcommunication software.
Algorithms are captured in GEDAE™ by placing processing functions extracted from a library on acanvas and interconnecting them using the extensive facilities of the graphical editor. Using a topdown design approach, the basic building blocks and data passing requirements can be put onthe canvas. In this way, the application designer can build, test, and analyze algorithms withpoint and click simplicity. Designers can select from functions contained in the extensible library.Library functions are provided for most of the commonly used signal processing functions.Understanding that a function library will never be complete, templates are provided for creatingnew functions. In addition to providing all of the typical data types, GEDAE™ has the importantcapability to define new arbitrary data types (e.g., complex C structures) for use with customprimitives. This ability is of great importance to users who want to capture heritage softwarewhich is generated in modules whose I/O is maintained as complex data structures.
Hierarchy is supported in a flow graph which simplifies complex application understanding.GEDAE™ supports extensive and efficient parallel processing.
Execution of GEDAE™ graphs is controlled through the same interface used to construct thegraph. Users can modify parameters in the graph on the fly and observe the impact of thosechanges. The ease of making modifications to a graph and its operating parameters increasesproductivity by making it easy for designers to fine tune applications quickly. Execution resultsare presented to the designer in the form of detailed timelines and execution schedules along withmemory maps to support the designers analysis of system solutions.
GEDAE™ provides an efficient autocoding capability driven by partitioning and mapping definedby the user. Because GEDAE™ handles all interprocessor communication, the designer neverhas to write any communication software. GEDAE™ launches the compilation, linking, loading,and execution of the application on the embedded hardware. An embedded run-time kernel oneach processor supports execution. GEDAE™ generates the execution schedule for eachprocessor and provides the user the ability to divide schedules into subschedules which may alloperate at different firing granularity to optimize performance. Execution schedules and memorymaps are presented for analysis.
A new architecture is defined as a specific vendor's COTS product in conjunction with theoperating system (or board support software) and optimized function library used by the vendor.There are three steps required to port GEDAE™ to new architectures. First, the communicationsoftware is modified to use the specific operating system and/or board support package provided
by the vendor. Second, all communication mechanisms that are supported by the specifichardware must also be supported by the autocoding for that hardware. For example, someSHARC hardware utilizes only SHARC links for all communication while other hardware alsoprovides switching networks or local buses. In addition, various communication protocols areused including, shared memory, message passing, and DMA. Third, a version of the GEDAE™primitive library which utilizes the optimized math library supplied by the vendor must beprovided.
GEDAE™ is relatively easy to port to new architectures (even those not using an operatingsystem) because the communication layer has been optimized and reduced to approximately 600lines of code. ATL has ported GEDAE™ to various hardware including three different vendor'shardware architectures with different communication mechanisms, both on a board and betweenboards. The currently supported architectures utilize SHARC, Power PC, and i860 processors.
GEDAE™ supports the optimization of partitioning and mapping, memory usage, communicationmechanism selection, schedule firing granularity, queue capacities, and scheduling parameters.GEDAE™ provides the ability to interactively manipulate these items which greatly improves thedesigners ability to optimize processing after retargeting an application to a new architecture.
Under the RASSP program, the synthetic aperture radar (SAR) application was implementedusing the GEDAE™ tool. The application software that was hand-generated for a MercuryRaceWay architecture was re-implemented using the GEDAE™ tool on a similar Mercuryarchitecture. The resulting autocoded application achieved the same execution and memoryefficiency as the hand coded version—with approximately a 10X reduction in implementation time.The same application has been remapped to three other architectures by simply repartitioning,remapping, and reoptimizing the application on the new architecture using the optimizationsupport within the GEDAE™ tool. The time utilized for retargeting was 2-3 days for eachsubsequent architecture.
2.2.6.2 PRICE S/M/H/HL
The PRICE suite of Computer-Aided Parametric Estimating (CAPE) tools are used to estimate thedevelopment, production, maintenance cost, and schedules of Hardware, Software, and Micro-circuits. Parametric cost modeling is based on cost estimating relationships (CERs) that make useof product characteristics (such as hardware weight and software language) to estimate costs andschedules. The family of PRICE parametric tools include four models which are described below.Hardware cost model (PRICE H) - The hardware cost model is used to estimate the cost andschedule for electronic, electro-mechanical, and structural assemblies. This model incorporatesinput data concerning yield, performance, quantity, process and design sensitivity, andcomplexity parameters. The hardware model provides cost and schedule output for thedevelopment and production phases of a program.
Hardware life-cycle cost model (PRICE HL) - The hardware life-cycle cost model is used toestimate the cost of operating and maintaining hardware systems throughout their deployment.Inputs to the life-cycle model include deployment parameters, maintenance concepts, cost, andescalation factors. The life-cycle model is a supplement to and operates in conjunction with thehardware model.
Microcircuit/module cost model (PRICE M) - The microcircuit cost model is used to estimate thecost and schedule for custom microcircuit, printed circuit boards, and electronic modules. Themodel uses functional relationships based upon parameters such as the number of transistors,percentage of new circuit cells, number of pins, board type and size.
Software/software life-cycle cost model (PRICE S) - The software cost model is used to estimatethe cost and schedule for the design, development, integration, testing, and support of software.This model uses functional relationships based upon parameters such as function, lines of code,complexity, platform, application, and design reuse to estimate costs.
The PRICE cost models will be integrated with the RASSP system engineering, life-cyclesupport, and architecture selection tools. These integrations will allow engineers the capability toperform cost/performance trade-offs throughout the design process.
2.2.7 Aspect Development
2.2.7.1 Explore (CLMS)
The Component and Library Management System (Explore (CLMS)) is an object-orientedextension to the existing commercially-available Component Information System (CIS) product.This extension supports the implementation of the RASSP Reuse Data Manager (RRDM)subsystem and consists of the following:
• Data manager extensions
• Object viewer development
• Object editor development
• Meta-model editor development
The data manager is an existing capability which will be extended to manage default objects,template objects, and temporary objects. A default object is a model for the design objects in agiven class. The attributes (properties and values) for a default object may be used as a basisfor creating a new object. Template objects enforce rules about required fields and values.Template objects may be mapped to individual design objects. Temporary objects are added tothe database, but marked to be deleted or moved at a later time. Temporary design objects areuseful for creating test cases for converting existing data.
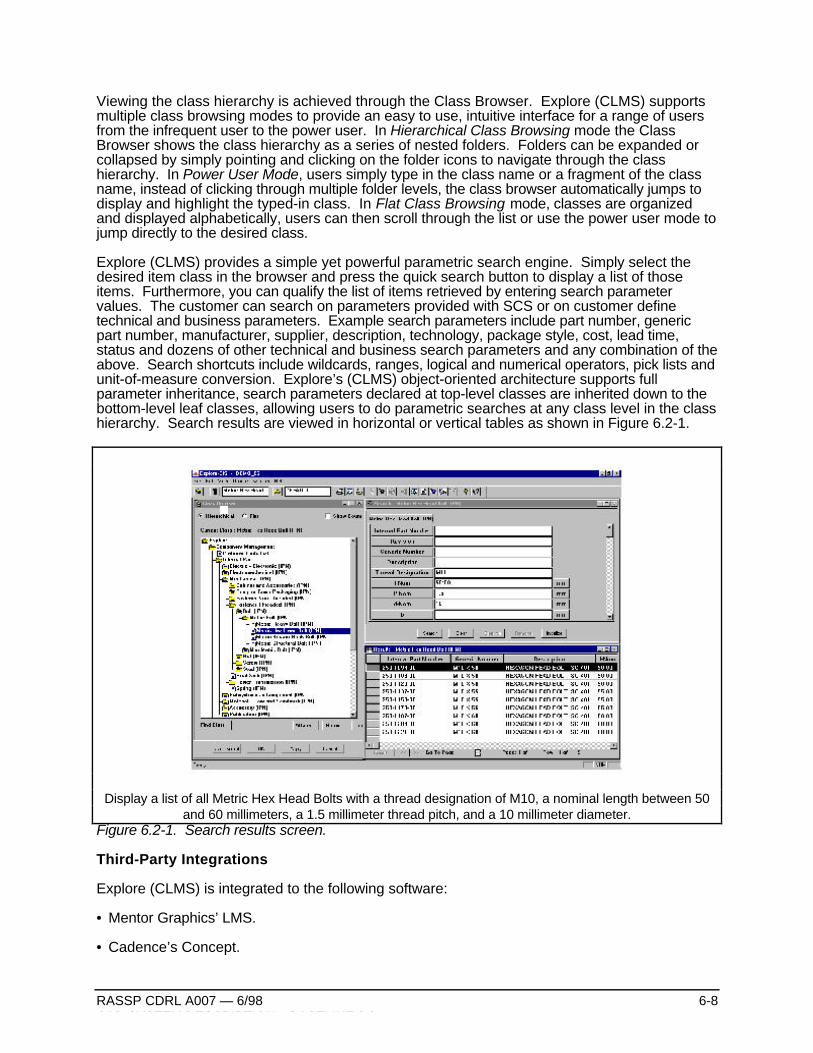
The object viewer will allow users to search for reusable design objects using a powerfulparametric search. It will use two windows; one for entering parametric search data and anotherfor displaying results. The results of performing a search will be a list of all reusable designobjects that match the specified parameters. The user can then pick individual reusable designobjects on the list and view all of the parameters and cross-references associated with eachreusable design object.
The object editor will allow users to enter design objects into the RRDM, or to update existingdesign objects. Updates typically involve adding, deleting, or editing object parameters and testitems associated with a given object, changing permissions for a given object, and copying anobject to a different class. The object editor will also allow users to add mappings betweenobjects.
The meta-model editor will allow the database administrator or librarian to modify the hierarchicalclass structure by adding and deleting classes. The meta-model editor will be available either ininteractive or batch modes.
2.2.8 Interleaf
2.2.8.1 Technical Publishing Software (TPS)
Interleaf TPS is the common tool for document production used to create and manage technicaldocumentation, work instructions, specifications, proposals, reports, data sheets, catalogs, forms,and correspondence.
TPS offers complete word processing, advanced graphics, automatic layout, conditional documentassembly, multi-page tables to support traceability data and technical equations, data-drivencharts, image editing, interactive equations, and centralized control over document content andformat.
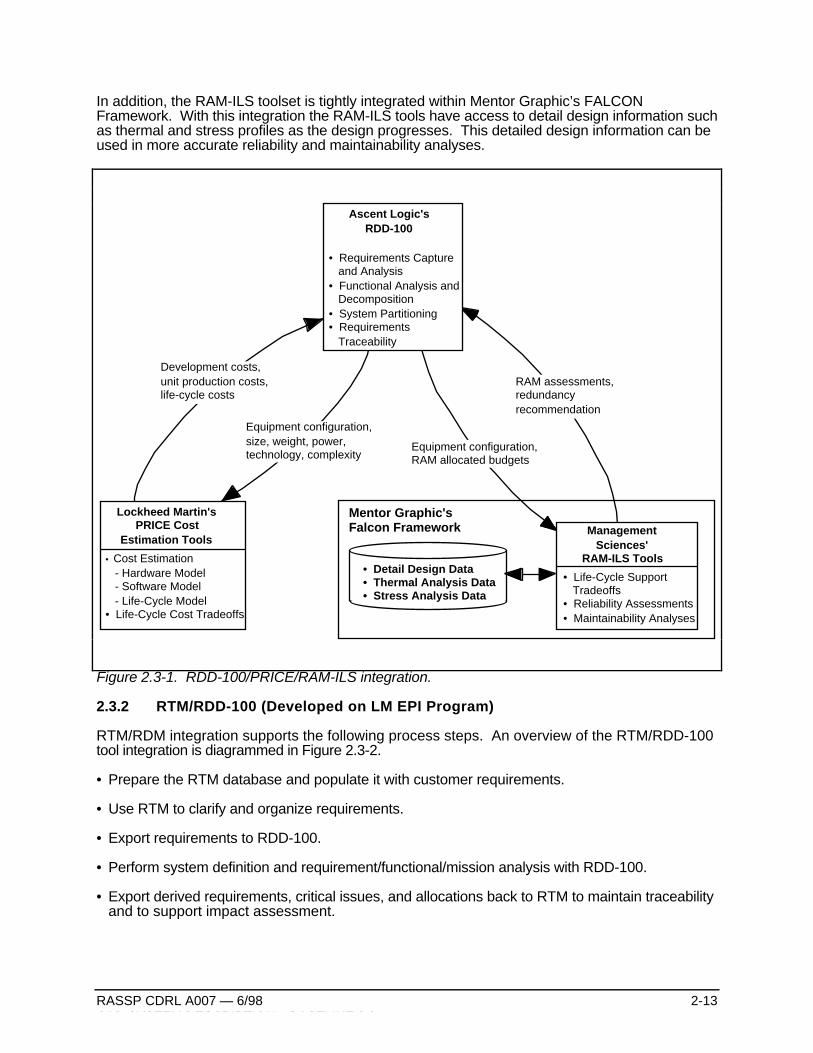
To support the RASSP System Definition Process, Ascent Logic’s RDD-100, Lockheed Martin’sPRICE cost estimating tools and Management Sciences’ RAM-ILS toolset have been integratedtogether to provide a concurrent engineering design environment over multiple domains. Thisinterface is shown in Figure 2.3-1. RDD-100 is used to capture and analyze the requirements, todefine the functional behavior of the signal processor, to allocate the requirements and functions toeach signal processing subsystem and to provide requirements traceability. PRICE costestimating tools are used to estimate the development, production and support costs for thesignal processor. The RAM-ILS tool is used to perform reliability and maintainability analyses.
The types of data which are passed from one tool to another consist of the data that typicallyresides in that tool which can be used by the other tool. For example, system engineering data ispassed from RDD-100 to the PRICE cost estimating tool. A GUI interface for the PRICE tool inRDD-100 was not developed. The types of parameters which are passed from RDD-100 toPRICE include the equipment configuration, size, weight, power, technology and complexityfactors. The development, production and support costs are passed back to RDD-100 from thePRICE tool. On the other side of the interface, the equipment configuration and allocated reliabilityand maintainability budgets are passed from RDD-100 to the RAM-ILS toolset. The reliabilityand maintainability assessments are passed back to RDD-100 from the RAM-ILS tool. Inaddition, optimizations can be performed within the RAM-ILS toolset when the budget is not metand the tool can make recommendation on how redundancy can be added in the system in themost cost effective way to meet the requirements.
In addition, the RAM-ILS toolset is tightly integrated within Mentor Graphic’s FALCONFramework. With this integration the RAM-ILS tools have access to detail design information suchas thermal and stress profiles as the design progresses. This detailed design information can beused in more accurate reliability and maintainability analyses.
Lockheed Martin's PRICE Cost
Estimation Tools
• Cost Estimation - Hardware Model - Software Model - Life-Cycle Model• Life-Cycle Cost Tradeoffs
Development costs, unit production costs, life-cycle costs
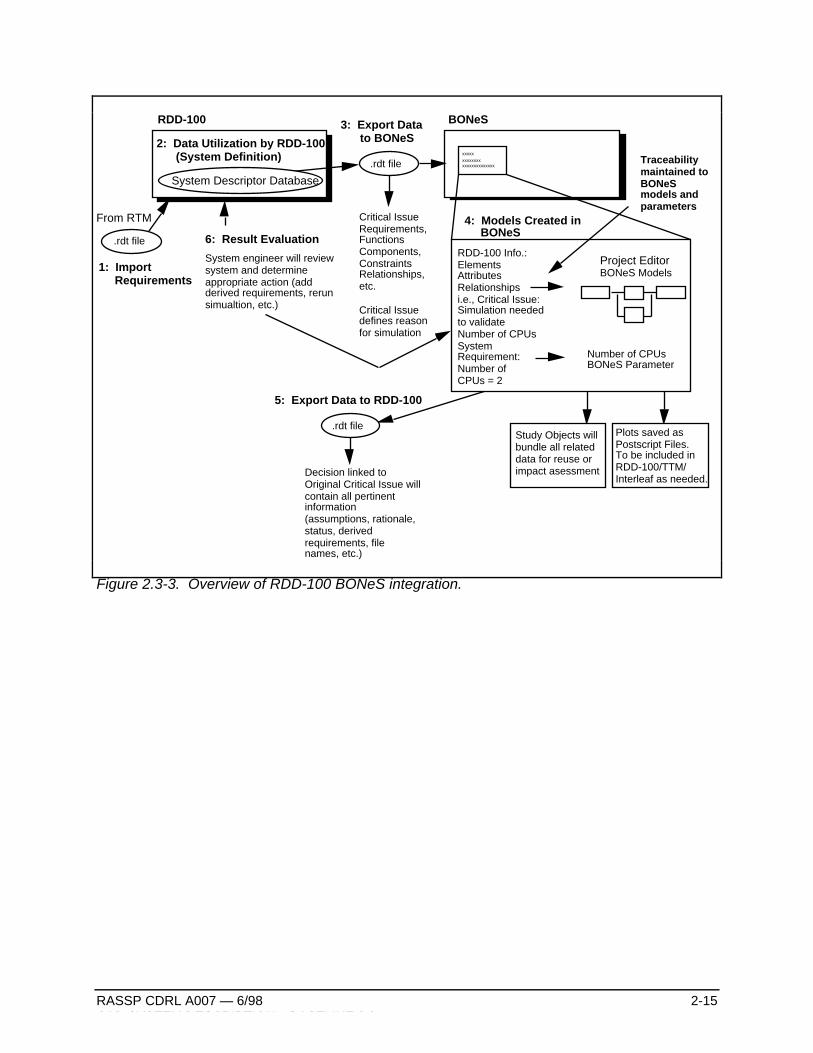
2: Data Utilization by RDD-100 (System Definition)
3: Export Data to BONeS
From RTM
.rdt file
1: Import Requirements
6: Result Evaluation
System engineer will review system and determine appropriate action (add derived requirements, rerun simualtion, etc.)
Critical Issue Requirements, Functions Components, Constraints Relationships, etc.
Critical Issue defines reason for simulation
5: Export Data to RDD-100
Decision linked to Original Critical Issue will contain all pertinent information (assumptions, rationale, status, derived requirements, file names, etc.)
.rdt file
BONeS
.rdt file
xxxxxxxxxxxxxxxxxxxxxxxxxxx
4: Models Created in BONeS
RDD-100 Info.:Elements AttributesRelationshipsi.e., Critical Issue: Simulation needed to validate Number of CPUsSystem Requirement: Number of CPUs = 2
Study Objects will bundle all related data for reuse or impact asessment
Plots saved as Postscript Files. To be included in RDD-100/TTM/ Interleaf as needed.
Project EditorBONeS Models
Number of CPUsBONeS Parameter
Traceability maintained to BONeS models and parameters
System Descriptor Database
Figure 2.3-3. Overview of RDD-100 BONeS integration.
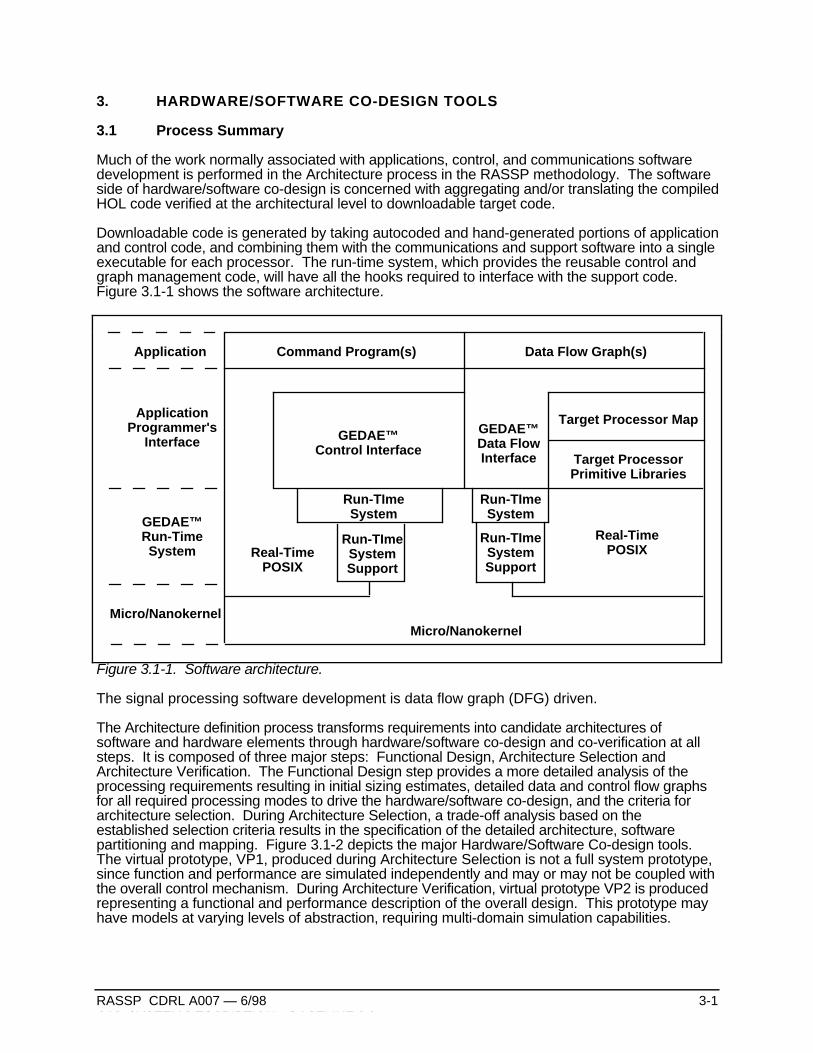
Much of the work normally associated with applications, control, and communications softwaredevelopment is performed in the Architecture process in the RASSP methodology. The softwareside of hardware/software co-design is concerned with aggregating and/or translating the compiledHOL code verified at the architectural level to downloadable target code.
Downloadable code is generated by taking autocoded and hand-generated portions of applicationand control code, and combining them with the communications and support software into a singleexecutable for each processor. The run-time system, which provides the reusable control andgraph management code, will have all the hooks required to interface with the support code.Figure 3.1-1 shows the software architecture.
Application
Application Programmer's
Interface
GEDAE™Run-Time System
Micro/Nanokernel
Command Program(s)
GEDAE™Control Interface
Run-TImeSystem
Real-Time POSIX
GEDAE™Data FlowInterface
Micro/Nanokernel
Data Flow Graph(s)
Target ProcessorPrimitive Libraries
Run-TImeSystem
Real-Time POSIX
Target Processor Map
Run-TImeSystem Support
Run-TImeSystem Support
Figure 3.1-1. Software architecture.
The signal processing software development is data flow graph (DFG) driven.
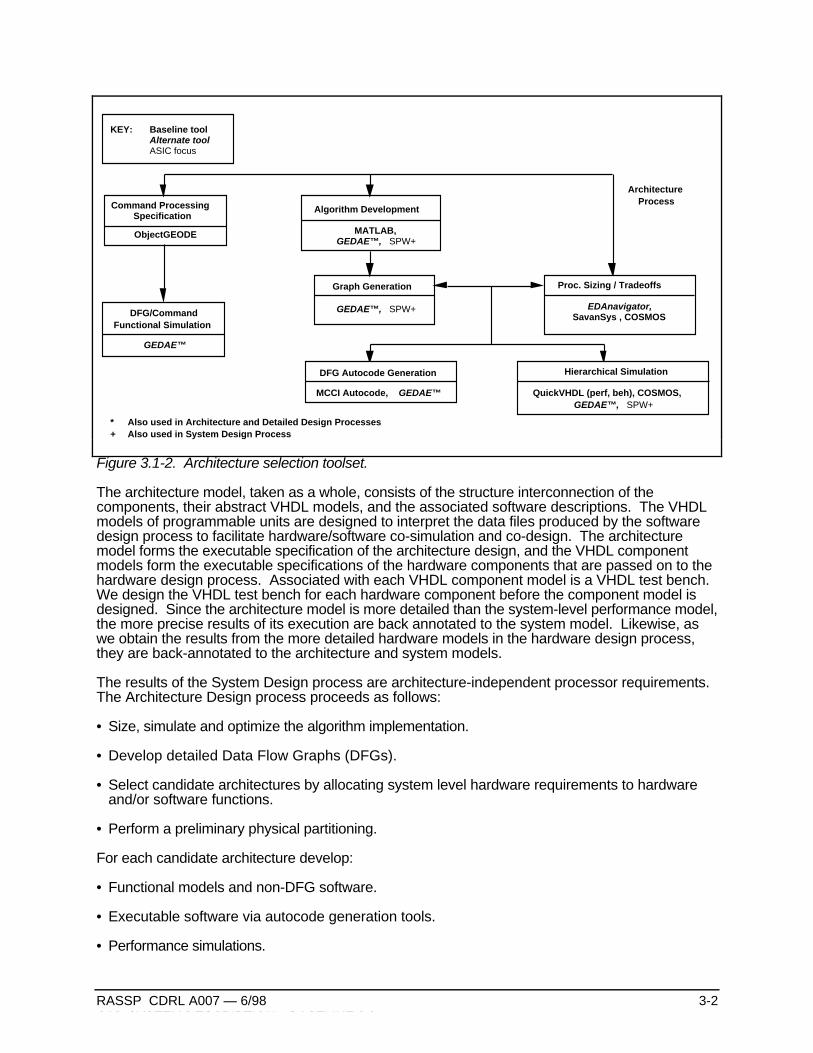
The Architecture definition process transforms requirements into candidate architectures ofsoftware and hardware elements through hardware/software co-design and co-verification at allsteps. It is composed of three major steps: Functional Design, Architecture Selection andArchitecture Verification. The Functional Design step provides a more detailed analysis of theprocessing requirements resulting in initial sizing estimates, detailed data and control flow graphsfor all required processing modes to drive the hardware/software co-design, and the criteria forarchitecture selection. During Architecture Selection, a trade-off analysis based on theestablished selection criteria results in the specification of the detailed architecture, softwarepartitioning and mapping. Figure 3.1-2 depicts the major Hardware/Software Co-design tools.The virtual prototype, VP1, produced during Architecture Selection is not a full system prototype,since function and performance are simulated independently and may or may not be coupled withthe overall control mechanism. During Architecture Verification, virtual prototype VP2 is producedrepresenting a functional and performance description of the overall design. This prototype mayhave models at varying levels of abstraction, requiring multi-domain simulation capabilities.
* Also used in Architecture and Detailed Design Processes+ Also used in System Design Process
Architecture Process
KEY: Baseline toolAlternate toolASIC focus
Figure 3.1-2. Architecture selection toolset.
The architecture model, taken as a whole, consists of the structure interconnection of thecomponents, their abstract VHDL models, and the associated software descriptions. The VHDLmodels of programmable units are designed to interpret the data files produced by the softwaredesign process to facilitate hardware/software co-simulation and co-design. The architecturemodel forms the executable specification of the architecture design, and the VHDL componentmodels form the executable specifications of the hardware components that are passed on to thehardware design process. Associated with each VHDL component model is a VHDL test bench.We design the VHDL test bench for each hardware component before the component model isdesigned. Since the architecture model is more detailed than the system-level performance model,the more precise results of its execution are back annotated to the system model. Likewise, aswe obtain the results from the more detailed hardware models in the hardware design process,they are back-annotated to the architecture and system models.
The results of the System Design process are architecture-independent processor requirements.The Architecture Design process proceeds as follows:
• Size, simulate and optimize the algorithm implementation.
• Develop detailed Data Flow Graphs (DFGs).
• Select candidate architectures by allocating system level hardware requirements to hardwareand/or software functions.
• Perform a preliminary physical partitioning.
For each candidate architecture develop:
• Functional models and non-DFG software.
• Executable software via autocode generation tools.
• Preliminary partitioning across boards, technology trade-offs, packaging (FPGA/MCM/Discrete)trade-offs.
• Implement the appropriate DFT design steps.
3.2 Hardware/Software Co-Design CAE Tools
The RASSP Architecture design toolset for Hardware/Software Co-Design includes:
• JRS Research Laboratories, Inc. NetSyn enables architecture selection via a design advisor.
• SavanSys from Savantage, Inc. is a tradeoff analysis tool focused on packaging andinterconnection of high-performance electronic systems.
• Lockheed Martin ATL’s GEDAE™ provides a workstation environment to develop applications,tools to support multiprocessor scheduling and mapping, and a run-time environment toefficiently execute on scaleable embedded processors.
• RAM/ILS enables feedback on reliability, availability, maintainability, and integrated logistics.
• RDD-100 (Requirements Driven Development) from Ascent Logic is used to capture systemrequirements, perform functional decomposition, model system behavior, allocate requirementsto components, and generate systems engineering documentation.
• RTM (Requirements and Traceability Management) from Marconi Systems is used as therequirements traceability tool throughout a program’s engineering life cycle.
• Alta Group's Signal Processor Worksystem (SPW) enables interactive design, simulation, andimplementation of digital signal processing and communication systems.
• BDTI/UC Berkeley's Ptolemy supports multi-domain analysis of complex systems.
• PRICE is used for computer-aided parametric cost estimating.
• SimMatrix from Precedence provides a mixed domain co-simulation environment.
• Mentor QuickVHDL provides a VHDL compilation and simulation capability.
• MATLAB is used for algorithm development and numerical analysis.
• Harris EDAnavigator from Harris Electronic Design Automation, Inc. is an alternative tool toSavantage’s SavanSys.
• COSMOS from Omniview and Honeywell Technology Center allows a designer to rapidlycreate alternative hardware/software architectures and simulate them to validate systemperformance.
• ObjectGEODE from VERILOG enables the generation, verification and validation of target codefor the command program.
• Lucent’s SPEAR supports a customizable debugging environment for multiprocessors.
• University of Oregon’s PIE is an application and design evaluation environment.
• GEDAE™ from Lockheed Martin ATL is a graphical programming and autocoding environment.
• Interleaf is the documentation production tool described in Section 2.2.8.
3.2.1 JRS Research Laboratories
3.2.1.1 NetSyn
NetSyn is used to perform application specific network definition and synthesis and analysis.The primary objective is to provide a smart designer with the tools that will enable him to mostlyautomatically synthesize and analyze a network. The system provides facilities for synthesizingand evaluating numerous alternatives. It enables the automated synthesis of network solutionsbased totally on the requirements and constraints imposed by the designer. By derivingsolutions from requirements and constraints, the system ensures that solutions meetspecifications and enables the quantification of the impact of specification changes.
The NetSyn synthesizes a heterogeneous multiprocessor network consisting of processors,memories, input/output, and communication entities to execute an application represented in graphform. NetSyn co-designs the hardware and software at a very early stage of the design. Itautomatically generates proof-of-concept and pre-production prototype designs and automaticallyassigns the software elements to processors in the network. NetSyn enables the user to rapidlyevaluate alternative network designs by trading off hardware against software to synthesize themost efficient network architecture that meets the requirements.
3.2.2 Savantage, Inc.
3.2.2.1 SavanSys
SavanSys is a tradeoff analysis tool focused on packaging and interconnection of high-performance electronic systems. Given physical descriptions of the components to beinterconnected and packaging technology selections, it will produce performance metrics includingsystem size, routing, thermal, electrical, reliability and cost analysis for multichip and multipleboard systems. Technologies treated by SavanSys include: traditional and fine-line printedcircuit boards, low temperature co-fired ceramic and thin-film. Component assembly approachesinclude wirebonding, TAB, flip chip and single chip packages. Materials are also available forbare die attach, encapsulation, heat exchanger attach, and for defining the bonding andinterconnect technologies.
The tool begins by capturing design and performance budgets and constraints. Next, thecomponents (active and passive) to be packaged are described. Component descriptionsinclude the entry of physical (dimensions), material, I/O (number of signal, power, ground,unused), electrical (bias level, logic swing), thermal and manufacturing (cost, tested yield, etc.).All of this information is included in the “chip" class. In addition to these properties, thecharacteristics of heat spreader and thermal vias are captured as properties of each componentrather than the module or board so that they can be easily manipulated on a per componentbasis.
After the components are described to the tool, they are placed into “partitions." Partitions consistof any subset of the defined components grouped into a few chip package, MCM or printed circuitboard. It is through the creation of partitions that complex systems can be built using the tool.
Designers use the Partition Manager to create new parts or import existing parts from externalcomponent libraries, distribute components and modules throughout the hierarchy, definesubstrate and interconnect technologies, and run concurrent analysis on various levels of thehierarchy. SavanSys allows engineers to change design concepts between different
components and connectors, packaged or unpackaged ICs, or interconnect and assemblytechnologies.
The Placement Editor enables engineers to quickly explore the impact of component placement(single or double-sided) on cost, weight, size, thermal, and critical net electrical performances.SavanSys can import and export system packaging specifications, including placements, andcomponent and technology descriptions in formats compatible with PCB and multichip module(MCM) layout tools from Mentor Graphics.
3.2.3 BDTI/UC Berkeley
3.2.3.1 Ptolemy
Ptolemy is an environment for simulation and prototyping of heterogeneous systems. It usesmodern object-oriented software technology to model each subsystem in a natural and efficientmanner, and to integrate these subsystems into a whole. The objectives of Ptolemy encompasspractically all aspects of designing signal processing and communications systems ranging fromalgorithms and communication strategies, through simulation, hardware and software design,parallel computing, and generating real-time prototypes. To accommodate this breadth, Ptolemymust support a plethora of widely differing design styles. The core of Ptolemy is a set of object-oriented class definitions that makes few assumptions about the system to be modeled; rather,standard interfaces are provided for generic objects and more specialized, application-specificobjects are derived from these.
A basic abstraction in Ptolemy is the Domain, which realizes a computational model appropriatefor a particular type of subsystem. Current examples of domains include synchronous anddynamic dataflow, discrete-event, and domains appropriate for control software and embeddedmicrocontrollers. Domains can be mixed as appropriate to realize an overall system simulation.Some current applications of Ptolemy include networking and transport, call-processing andsignaling software, embedded microcontrollers, and signal processing, including implementation inreal-time on programmable DSPs, scheduling of parallel DSPs, board-level hardware timingsimulation, and combinations of these.
3.2.4 Lockheed Martin ATL
3.2.4.1 GEDAE™
The Graphical Entry Distributed Application Environment (GEDAE™) is a graphical programmingtool that facilitates the development of parallel distributed data flow applications on aheterogeneous network of processors. GEDAE™ provides a simple Motif interface, allowing theuser to create, edit, control and monitor hierarchical data flow graphs. GEDAE™'s simpleprogrammer interface makes it possible to easily create primitive function boxes by encapsulatingexisting software in a C language shell. GEDAE™ maintains much of the efficiency of specialpurpose code while hiding the details of network interconnection and data flow. GEDAE™'s dataflow control software takes advantage of any data parallelism or pipelining inherent in theconstructed data flow graph. Data flow is efficient because objects cast or transfer themselvesdifferently, depending on the type of data transfer, to optimize communications efficiency. Anautocode generation capability provides the ability to automatically generate source code formultiprocessors and to efficiently support fine-grained data flow graphs. Currently, GEDAE™ isbeing enhanced to allow applications developed in a workstation environment to be mapped toembedded processors for efficient execution.
The GEDAE™ software structure, as discussed above, allows an application programmer todevelop modules independently of how they are connected. It allows a user to connect modulesindependently of how they are implemented and where they are executed. Data transfers acrossthe network, data casting (translation) between different data types, and data transfers betweenhost and remote processors are all transparent to the user. Function-box applicationprogrammers can develop a module without knowing how it will be used in the system because
they do not need to specify how data is transferred. This knowledge is embedded in the inputand output data objects themselves. Many standard data types are provided by GEDAE™ andtools for creating new data types are available. The object-oriented nature of the environmentcleanly separates function box design, data type design, and user interface design.
GEDAE™ runs on Sun Solaris, HP, NT, and SGI workstations. GEDAE™ is built using readilyavailable network and graphic standards. The only requirements for porting GEDAE™ to aplatform is that the TCP/IP protocol and the X windows graphics standard be supported.GEDAE™ uses the Sun standard XDR protocol to provide data translation between variousmachine types.
3.2.4.2 Application Interface Builder (AIB)
An Application Interface Builder (AIB) has been developed by ATL under the RASSP program togenerate the application specific Command Program Interface (CPI) instantiation that fills the gapbetween the CPI and the Data Flow Interface (DFI). Figure 3.2-1 illustrates this gap.
The control software developer issues a mode change request via the CPI and the interfacesoftware constructed by the AIB will provide the detailed sequence of commands via the DFI toimplement the request. The CPI instantiation consists of calls to the DFI based on the specific setof modes/submodes for the application, the set of graphics developed to perform the application,and the correlation between the two sets. The capability of the AIB will be commercialized aspart of the GEDAE™ product.
Autocoding Tool
ObjectGEODE
AIB Extension to GEDAE™
GEDAE™
Autocoded Application
Command Program (CP)
Command Program Interface (CPI)
Views SPS as Modes
Presents SPS as Graphs
Data Flow Interface (DFI)
Signal Processing System (SPS)
Figure 3.2-1. Application Interface Builder bridges gap between data flow and control flow.
3.2.4.3 PRICE
PRICE is used in conjunction with SavanSys to provide cost estimates for the candidatearchitectural configurations. The characteristic information derived from SavanSys is used byPrice to develop data for the cost/performance trade-off matrix.
PMW, Performance Modeling Workbench, is a GUI front-end and set of postprocessing tools forthe HTC (Honeywell Technology Center) PML (Performance Model Library). The PML is a set ofabstract VHDL models representing the various network architecture components that comprise amulti-processor DSP system. Such components include generic processor nodes, buses, andnetwork switches. PML resolves the components at the so-called "performance modeling" level,where time related issues such as latency, throughput, and resource utilization are concerned.Application data values are not evaluated by the PML models.
PMW provides a convenient graphical way to configure the purely textual PML models of ahardware system. PMW also provides a graphical method to capture application software in adata-flow-graph that in turn drives the hardware models during simulation. PMW provides amechanism for building and launching the VHDL simulation and collecting the results. Thesimulation results are analyzed through PMW's time-line displayer utility.
3.2.6 Management Sciences Inc.
3.2.6.1 RAM-ILS
The Reliability, Availability, Maintainability and Integrated Logistics Support (RAM-ILS) tools areintegrated in a UNIX graphics user interface. A second interface has been generated that isembedded in the RASSP design framework. Both graphic user interfaces use connectivitydrawings to represent simulation models. The RASSP RAM-ILS toolset consists of tools for pre-design architecture simulation, during design verification and assessment, and componentselection for final detailed design. There are tools for success analysis, decision analysis, faulttree analysis, failure modes and effects analysis, availability analysis, reliability analysis,maintainability, and life cycle support costs.
3.2.7 Marconi Systems
3.2.7.1 RTM
RTM provides a requirements engineering toolset designed to ensure that all project work isperformed against a customer stated requirement and that requirements traceability, compliancyand quality auditability are maintained throughout a project lifecycle. The RTM project databaseholds information pertaining to all phases of the project, but focuses primarily upon the systemrequirements and the tracking of these requirements through the product lifecycle. During thearchitecture definition process, hardware/software co-design tradeoffs are conducted to determinethe architectural entities of the signal processor. The requirements for each of these architecturalentities are established during this process and these requirements are traced to the signalprocessor requirements through the use of RTM.
3.2.8 Alta Group
3.2.8.1 SPW
SPW will be used to explore algorithms and function partitioning issues including assessing thecomplexity of the required processing. The SPW tool (or the JRS graphing tools with NetSyn)will provide the dataflow graph which drives the multiprocessor design.
The MATLAB functions developed in the System design effort will be used to verify thecorrectness of the architectural implementation.
3.2.10 Precedence
3.2.10.1 SimMatrix
The mixed domain simulation backplane is used when high-risk design elements spawnprototyping activities resulting in more detailed designs running on any one of a number of lowerlevel simulators. The detailed design can then be co-simulated with the higher level architecturesimulations for verification.
3.2.11 Mentor Graphics
3.2.11.1 QuickVHDL
The QuickVHDL family of products consists of a VHDL compiler, an interactive simulator, and aVHDL source language debugger. Multiple interactive windows allow a designer tosimultaneously view the design hierarchy and VHDL source code, display variable and signalvalues, control the simulator, schedule processes, and display simulation results in both list andwaveform outputs. The simulator, developed by Model Technology, combines the best featuresof previous interpreted and C-compile methods, resulting in faster throughput (as a function ofcompile and simulation times). Benchmarks show that the QuickVHDL “direct compile"technology, in which VHDL code is directly compiled to the instructions of the host RISCsimulation engine, is between 2-10x faster than other methods.
The current level of integration of QuickVHDL allows a designer to enter VHDL code, compile, anddebug compile errors within Design Architect. Graphically-entered structures in Design Architectmay also be passed to QuickVHDL and schematic cross probing is supported.
3.2.12 MCCI
3.2.12.1 Autocoding Toolset
The Autocoding Toolset is designed for the development of large, complex parallel signalprocessing applications that require significant processing power. The toolset contains a set ofintegrated tools that translate an application specified as a set of PGM graphs into a set of ‘C’source code files which are target specific. Applications are specified as data flow graphs using aformal graphical language (PGM) and a target independent library of signal processing routines.The graphs are partitioned into independent execution units which are then assigned to specificprocessors. Through partitioning, the user can eliminate many execution bottlenecks such asdata transfer contention. Processor specific support for target independent signal processingroutines is incorporated in the Autocoding Toolset as optimized, target specific implementations ofthese routines utilizing high performance math libraries from board vendor or third parties.
3.2.13 VERILOG
3.2.13.1 ObjectGEODE
ObjectGEODE from VERILOG enables the generation, verification and validation of target codefor the command program
ObjectGEODE can be used to generate a graphical representation of the command program,verify and validate it in a standalone simulation and then automatically generate target code.
The design flow using ObjectGEODE begins with requirements analysis and development of anextended finite state machine model of the system. This model includes objects of the system aswell as a representation of external actors. Use-Scenarios are described by means of MSCs(Message Passing Charts). The architecture of the system is then designed using the SDL(Specification and Description Language) concepts of system, block and processes to create anSDL Hierarchical Diagram and a set of SDL Interconnection Diagrams. Test design is performed inparallel with the architecture and detailed design using the Use-Scenarios. The detailed designstep consists of specifying states and state transitions at the process and procedure level.The developer rapidly prototypes the application and verifies and validates it using theObjectGEODE simulator. The code translated from the logical architecture of the system asrepresented by SDL is partitioned to run either on the system hardware. Actual “C” code isgenerated which is supported by numerous RTOS including Microtec Research Inc., VRTX, WindRiver Inc. VXWORKS, etc. In addition, the ‘C’ code can also be tailored run using a differentRTOS. The tool supports software reuse by easy incorporation of heritage software librariesinto both the graphic model and generated source code.
3.2.14 Applied Dynamics International (ADI)
3.2.14.1 BEACON
BEACON converts user specified block diagrams into a variety of software languages, includingFORTRAN, Ada and C. It also generates documentation and test vectors for unit tests. Thegenerated software includes on-board diagnostics, performance monitoring, I/O services, startupand shutdown procedures.
3.2.15 Harris Electronic Design Automation
3.2.15.1 Harris EDAnavigator
Harris EDAnavigator is an alternative tool to Savantage’s SavanSys. With Harris EDAnavigator,the designer can explore various system-level hierarchical partitioning, packaging design,placement, and interconnect choices with respect to user-selected physical metrics such aselectrical and thermal performance and routability without waiting until after layout.
The Harris EDA tool has an advanced partitioning/packing algorithm and will automatically definehardware partitions based on grouping components with maximum interconnect. HarrisEDAnavigator does parametric placement based on simulated evolution, minimizing totalinterconnect, adhering to net-timing and providing congestion avoidance.
3.2.16 Lucent
3.2.16.1 SPEAR
SPEAR will provide a generalized but customizable multiprocessor debugging environment. Thetool provides a common user interface to multiple target-dependable debuggers and supports thesimultaneous interactions with distributed processing elements for monitoring, controlling,sampling, and instrumenting the multiple processes executing in the target system for thepurposes of detecting and localizing errors. SPEAR does not replace the many excellentdebuggers targeted to specific commercially available processors and boards, but rather providesa framework within which uniprocessor debuggers may be integrated to support multiprocessing.
3.2.17 University Of Oregon
3.2.17.1 PIE (Performance Instrumentation Environment)
In RASSP there is a need for trace information document the behavior of the system’scomponents. This information is useful for debugging, verification, and testing of both thecorrectness of the software, as well as its performance characteristics.
The PIE/RASSP system is designed to address the trace generation and visualization needs ofthe RASSP community. The project consists of two major tools, the PIE/RASSP Event Browserand the PIE/RASSP Development System, that are directed at making the testing and verificationprocess as easy and painless as possible.
The first tool is the PIE Event Browser. This tool is intended to provide much neededvisualization capabilities to existing trace generation tools. Many systems rely on developersexamining ASCII trace output files or writing custom tools for specific trace formats. The PIEEvent Browser provides the developer with a way to quickly visualize any trace output.
The second toolset being developed as part of the PIE/RASSP project is the PIE/RASSPDevelopment System. This toolset represents many man years of development that has beenfocused on providing the RASSP effort with a DSP application instrumentation, testing andevaluation capability.
The major CAD tools for the RASSP Baseline 2 system are shown in Figure 4.1-1.
Mechanical CAE 3D Solid Modeling
FEM Analysis, Drafting(I-DEAS)
SDRC
Thermal Analysis(AutoTherm)
MGC
Simulation to ModuleTester Interface
(TDS Tools)Summit
Part Models(Smart Models, Hardware
Modeler, Hardware Emulator)LMC, Quickturn
Code Coverage Analysis(VHDL Cover)
VEDA Design Automation
Digital Analysis & Sim.(QuickVHDL, Matrix
QuickPath, Sim)MGC, Precedence
Producibility Analysis, Physical Partitioning
(Mfg. Interface, SavanSys)SCRA, Savantage
PLD/FPGA Design(PLD Synthesis II/FPGA
Foundry)MGC/NeoCAD
Module Layout &Packaging
(Board Design Stn.,MCM Stn.)
MGC
Hardware Design
Mentor Falcon Framework
VHDL Synthesis &Simulation
(QuickVHDL/Des. Comp.)Mentor/Synopsys
Schematic Capture(Design Architect)
MGC
Library Management System(LMS)MGC
VHDL Entry(Visual VHDL)
Summit
Figure 4.1-1. RASSP hardware design tools.
The major inputs to the hardware design process are:
• Abstract behavioral descriptions of new hardware developments.
• Preliminary parts selection.
• Application or test software that can be used to verify hardware elementsunder development.
Architecture design defines the top-level hardware architecture and the major elements that go intothe detailed design process. The main objective of the detailed design process is to transform thearchitectural description of the design into the detailed hardware and software components thatwill be developed, manufactured, and integrated into a prototype processor. As with the priorprocesses, both hardware and software are verified via a set of detailed functional andperformance simulations. When that process is completed, a fully verified virtual prototype of thesystem exists. The design is first partitioned from the behavioral-level to the appropriate level forall necessary components. Partitioning is driven by component requirements from the Architectureprocess, with a heavy predisposition toward using library-based components and synthesis of
chip and board-level components from the component libraries. Where at all possible, off-the-shelf modules, MCMs, ASICs, chassis and backplanes will be used. The detailed hardwaredesign process may be invoked at any time during the architectural verification process in order toprovide more accurate simulation models for high-risk portions of the design. At the end of thearchitecture selection process (VP2), some portions of the design may already exist as detaileddesigns. The overall hardware design process is divided into several distinct, yet interrelatedsubprocesses:
• Chassis/Backplane design.
• Module Design.
• ASIC/FPGA design (when at all possible, FPGA’s should be used for quicker design cycle).
• Subsystem Integration and Test.
• Mechanical design.
These subprocesses proceed in parallel, each providing information to the others. The stepsused to develop detailed hardware implementations are as follows:
• Hardware Design Capture using Mentor Graphics Design Architect - The functional elementsthat are inputs to the process are captured as structural elements from the RASSP componentlibrary. New elements are entered at this point as well. The captured schematics are used todrive subsequent pieces of the hardware design process.
• Hardware Partitioning using Mentor Graphics Design Architect and SavanSys - The structuralequivalents of the behavioral and component-based designs are partitioned onto boards,MCMs, and chips. These partitions are then combined to form overall signal processingsubsystem (boards, chassis, etc.).
• Design Synthesis - Designs can be directly synthesized from RTL or logic level descriptions.Chip synthesis for new ASICs/FPGAs is supported by the Synopsys tool set (Designware,Design Compiler, and FPGA Compiler).
• FPGA Layout - supported by NeoCAD.
• Hardware Design Verification - More detailed simulations to verify the hardware design areperformed, including RTL, logic, and analog simulation. These simulators, and links to thebehavioral simulation capability are provided by the Precedence “simulation backplane”.Hardware emulation capability to speed the simulation process is also supported at this level(Quickturn). Simulations will be performed using VHDL, with simulations using equivalentRASSP library components. Models for new parts at this level will be generated using the busfunctional model generator by LMC and by using the graphical VHDL entry tool (Visual VHDL)by Summit.
• Timing Analysis and Test Vector Coverage - Functionally verified logic designs are evaluatedfor performance using critical path and timing analyses. More robust test vector generation isperformed to ensure full node (toggle) coverage. Vectors to provide maximum coverage for thedesign are generated and verified by VHDLCover by VEDA Design Automation, Inc.
• Layout/Verification - The detailed component and connectivity schematics (board, MCM, and/orchip) are used to generate layouts for the designs. For board and MCM level designs, Mentor'sBoard Station and MCM Station are used, respectively. FPGA layouts are performed usingNeoCAD. Layouts are performed using strict design rules to ensure producibility. Thesedesigns are verified using Electrical and Design Rule Checking programs.
• Mechanical/Thermal Analysis - Mentor's Autotherm tool is used to analyze board and MCMthermal characteristics. Mechanical designs are analyzed using the SDRC tool set. Thermalanalysis of board frames is also performed by the SDRC tools.
• Fabrication Links/Conversion - Prior to fabrication release, the completed design and layout datais transformed into specific formats required by the selected vendors. Board, chip, and MCMdata packages are converted to export appropriate layout, drill hole, and pick and place formats.Test vectors are converted providing tester-specific test patterns by using TDS tools fromSummit. The designs are then transitioned to fabrication and test.
The hardware design process transforms the architecture component VHDL models into detailedhardware designs. Abstract, non-evaluated architecture component models are decomposed intofull-functional VHDL models of their constituent entities. In addition to the full-functional models,bus-functional models are created where needed to efficiently test interface designs. VHDLstructural models are created for the VHDL behavioral models that were developed during thearchitecture design process. These structural models show the partitioning and interconnection ofarchitecture component modules. Each module is, in turn, further decomposed and partitioned intoother modules, macro-cells, MCMs, ASICs, or COTS components. The hierarchical modelingprocedure is applied until an entity's constituent units can be either automatically synthesized,obtained from a library either from a previous design, or obtained from a Commercial-Off-The-Shelf library. During the partitioning process, some of the modules, MCMs, and ASICs can beidentified as custom parts, while others are selected from COTS parts. For custom-developedparts, VHDL models are developed down to the RTL level, with a fully functional behavior andbus-functional model describing each ASIC. For COTS parts, only VHDL behavioral models aredeveloped or obtained. The VHDL behavioral models describe the timing and functionality of themodule, macro-cell, MCM, and/or ASIC.
The test benches developed during the Architecture design process provide the test procedures,stimuli, and expected results to verify that the design meets system requirements. The testbenches are executed with the behavioral models of the hardware designs during simulation. Thefull-functional behavioral model forms the executable specification for a hardware design. Weback-annotate the simulation results of the detailed hardware models to the higher levelarchitecture models. A gate-level VHDL description of the design can also be generated andsimulated with the test bench. The results of this simulation can be compared with the results ofthe pre-synthesis simulation to verify that the implementation is correct.
4.2 Hardware Design CAE Tools
The RASSP Hardware Design toolset includes:
• Mentor's FALCON Framework is used to provide a common user interface and data interchangeand management capabilities. This framework is used to integrate Mentor tools and third-partyapplications into a single environment. The Mentor Graphics tools Design Architect,QuickVHDL, QuickPath, and QuickSim II provide design capture, VHDL simulation, critical pathanalysis, functional simulation, statistical fault grading, and fault simulation, respectively.Physical design of modules is provided by the Board Station, Hybrid Station, and AutoThermtools from Mentor Graphics.
• SimMatrix from Precedence provides a simulation backplane to support co-simulation usingdifferent simulators.
• The System Realizer Family of Modular Emulation Systems from Quickturn Design Systemsprovides the capability for hardware emulations.
• VHDL is generated using the graphical tool, Visual HDL, from Summit Design.
• Synopsys tools provide an environment for compiling, simulating, and synthesizing designdescriptions written in VHDL.
• Programmable Logic Device and FPGA design are supported by MGC's PLD Synthesis II andNeoCAD.
• Hardware modeling capability is provided by the LM Family from the Synopsys Logic ModelingGroup.
• SavanSys from Savantage, Inc. is a tradeoff analysis tool focused on packaging andinterconnection of high-performance electronic systems.
• Testability analysis and test database translation is accomplished through VICTORY fromTeradyne and TDS from Summit, respectively.
• Managing part libraries for electrical design is accomplished through Mentor's LibraryManagement System (LMS) software.
• Mechanical design is supported primarily by software supplied by SDRC. Their I-DEASMaster Series software provides a complete complement of mechanical design capabilities,including thermal analysis, 2D (2-dimensional) and 3D design and modeling, and finite elementanalysis.
• VHDLCover from VEDA Design Automation, Inc. analyzes VHDL code and determines howthoroughly the design has been tested.
• RDD-100 (Requirements Driven Development) from Ascent Logic is used to capture systemrequirements, perform functional decomposition, model system behavior, allocate requirementsto components, and generate systems engineering documentation.
• Interleaf is the documentation production tool.
• Lucent’s SPEAR supports a customizable debugging environment for multiprocessors.
• University of Oregon’s PIE is an application and design evaluation environment.
• ObjectGEODE from VERILOG enables the generation, verification and validation of target codefor the command program.
• BEACON from Applied Dynamics International (ADI) is an alternative tool to ObjectGEODE. Itcan be used to generate code for the command program, test vectors for unit tests as well asproduct documentation.
4.2.1 Mentor Graphics
4.2.1.1 Design Architect
Design Architect is a comprehensive and integrated system for specifying and creating electronicdesigns at the abstract architectural, detailed logic and circuit levels. As Figure 4.2-1 indicates,Design Architect is the center of activity for most hardware design processes. It lets you createand edit logical designs that are used by downstream processes such as digital simulation andPCB layout. These applications return design information to Design Architect in the form of backannotation values.
Design Architect is a multi-level design environment that includes: a Schematic Editor, a SymbolEditor, and a VHDL Editor. In a multi-level design environment you can:
• Implement top-down and bottom-up design methodology.
• Specify a design at different levels of abstraction, from high-level specifications to gate-levelimplementation.
QuickVHDL allows you to quickly model and test a system at a high level of abstraction. Thisability means that you can limit the amount t of information that is analyzed at one time to amanageable level. You can also identify and correct many problems before they propagate tothe lower gate-level implementations or the breadboard stage. QuickVHDL has the followingfeatures:
• Full-featured VHDL simulator supporting IEEE-1076-87, VITAL 2.2b and VITAL ‘95, enables theindustry’s widest support from ASIC, FPGA and semiconductor foundries.
• Optimized Direct Compile architecture results in the industry’s fastest compile times andsimulation performance.
• Optimized Direct Compile uniquely offers design and library portability with machine-independent object code.
• Model support for “C” models, LMG SWIFT-based SmartModel® and Hardware Modeler (LM).
• Source, Structure, Process, DataFlow, Wave, List, Signals, and Variables windows for designanalysis and debugging.
Mentor Graphics component libraries contain a variety of model types, used to describe thebehavior of a circuit. The behavioral description of a circuit is necessary to simulate and analyzethe circuit's functionality. The behavioral description of a circuit is defined with a functional model.Some examples of functional models are: schematic models, hardware models, BehavioralLanguage Models, and VHDL models. The designer selects component models from a widevariety of component libraries, and then places and connects these components together to formschematics and simulation models.
In order to capture designs and prepare them for layout in the LMS environment, the followingtools and utilities are used:
• Library User – Library User is used by the designer to open new and existing designs, placeand connect parts, add or alter properties, update parts, replace parts, check design rules, andsave designs. Library User is based on the Mentor Graphics Design Architect (See Section4.1.1.1) application. Consequently, most of the interface characteristics are identical. However,Library User incorporates several features that facilitate design creation in LMS:
• A Part Selector for finding and placing parts from libraries created and maintained by thelibrarians.
• A palette and matching popup menu that adds part selection shortcuts to the Part Selector.
• Schematic editor menu items that adapt Design Architect's part placement, part updatingprocedures, and part replacement features to support and maintain LMS part structure. Thiseditor also supports catalog entry viewing, pin number setting, and other operations. The PartSelector lets you navigate the hierarchy of parts menus to locate parts you want to place in adesign. One feature the Parts Selector offers is the “shopping list”. Through use of PartSelector palette icons or popup menu items, you can create lists of parts that can either beimmediately placed or retained as parts lists from which you can select and place parts at a latertime during the Library User session. The “shopping list” feature is ideal when you needseveral parts that come from various areas of a menu's hierarchical structure.
• Design Manager - Manages designs and design data. This application allows a designer toinvoke design creation tools, design analysis tools, board PCB design tools, and managedesign data. (See Section 4.3.1.2 for more details).
• design_replace - A utility that replaces existing parts in a design with parts from a general“replace list”.
• to_layout - A utility that prepares a design for layout through an automated packaging process.
• design_update - A utility that updates parts in a design on a design-wide basis.
4.2.1.4 PLD Synthesis II
PLD Synthesis II is a complete, universal programmable logic device development tool. Itsupports the following:
• Describing a design using the most suitable method for your application--high-level behaviorallanguage (state machine, truth table, or equations) or schematic.
• Optimizes and reduces a design to the smallest set of gates using industry-standard methods.
• Simulates functionality of a design while it is still in the design phase, before committing tohardware.
• Automatically selects devices based on design criteria. It maps a design into various devicearchitectures and presents the best solutions to choose from.
• Allows choice of automatic or manual placement of input and output signals in the selectedprogrammable devices including fitting the design across as many as 20 devices.
• Supports programming of devices using automatic fusemap generation and device programmercommunications.
• Gives ability to test programmable devices by generating test vectors from the functionalsimulator's results and downloading them to the programmer with the fusemap file.
Integration with the Mentor environment provides the ability to export schematics to PLDSynthesis II, to provide automatic simulation modeling that can be exported to QuickSim II formodule simulation, and support hierarchical design integration where elements at the top level of adesign can be schematic, VHDL, behavioral language, or netlist.
4.2.1.5 QuickPath
QuickPath is a static timing analysis tool which verifies circuit timing by adding up propagationdelays along paths between clocked elements in a circuit. This method checks the sums againstthe specified timing constraints for each circuit path and reports any existing timing violations.QuickPath is a graphical timing analysis tool that reports timing violations on all circuit paths.QuickPath prevents false error reporting by allowing the user to remove “uninteresting” pathsfrom an analysis. In QuickPath, a designer can strategically disable the component pins thatthese paths pass through and cause the paths to be ignored during an analysis session. Inaddition, a designer can limit the analysis on several parameters and block uninteresting or invalidpaths to reduce analysis time and thus avoid unwanted analysis results. QuickPath does notrequire stimulus vectors or models that describe the functional behavior of a component butperforms an analysis by using pin-to-pin timing information. Timing information can be assignedto any component in the design, or it can be assigned hierarchically to a logical block of the designto reduce the level of analysis QuickPath performs and therefore speed the analysis process. Asshown in Figure 4.2-1, QuickPath is integrated with other IDEA Series tools that are used in thedesign creation and analysis process.
QuickPath is used to perform worst-case static minimum/maximum (min/max) timing analysis on adesign. Input signal arrival times and clock information can be specified for the circuit. The clockinformation includes the clock period, number of clock phases, the clock edge times, and any clockskews. QuickPath uses this information to correctly identify the worst-case clock and signalrelationships for accurate verification of circuit timing. In addition, QuickPath determines worst-case paths by using the correct combination of fast and slow components in clock and data pathsand considers special circuit conditions (such as the occurrence of common ambiguity) during theanalysis process.
Graphics windows display views of schematic sheets and specific paths within the circuit. Theselection of an item highlights it within all windows in which it appears, in order to easily locateand view problematic circuit elements within a path or schematic sheet.
4.2.1.6 Board Designer
Board Designer provides full design, documentation, and manufacturing capabilities for printedcircuit board (PCB) designs. Figure 4.2-3 shows the workflow through the PCB products. Thereare five main PCB tools and libraries:
• Librarian is a general purpose graphics editor for defining and modifying geometries in the PCBGeometry Libraries. After identification and completion of all the geometries required by adesign, these geometries are compiled for input into layout.
• Geometry Libraries contain the physical descriptions of the component packages to be placedon the PCB. Graphic descriptions include DIPs, resistors, capacitors, connectors, memoryparts, and other component packages.
• Package provides interactive and automatic mapping of schematic symbols to the appropriatephysical components. With the use of data in catalog directories, Package generates thecomponents, gates, nets, and pins design objects that drive the rest of the design process. Itcan also create this design data with a text editor or with translation programs to drive a designthrough the layout process.
• Layout provides placement and routing of the PCB. Interactive and automatic placementfeatures help place components on the board according to designer specifications and optimizethe placement for routing. Likewise, interactive routing features allow routing and protectingcritical connections, and automatic routing features can be used to route the rest of theconnections. Layout includes the Dynamic Editor used for trace editing. The Dynamic Editoremploys interactive features to help you in the last stages of board routing.
• Fablink is used to generate manufacturing data and documentation for a PCB design. Themanufacturing data includes files containing instructions to drive photoplotting, drill, and millingmachines. The documentation includes fabrication and assembly drawings, and bills ofmaterials.
AutoTherm is an interactive, finite-element based software tool that performs thermal analysis ofprinted circuit board assemblies. AutoTherm operates within the Mentor Graphics Common UserInterface (CUI) environment. The CUI brings a common look and feel to Mentor Graphicsapplications. AutoTherm uses a single view display. AutoTherm features and capabilitiesprovide ways to improve a printed circuit board design. Within a PCB, AutoTherm modelssteady-state and transient heat transfer in the following modes:
• Conduction
• Convection
• Radiation
AutoTherm also allows you to model non-viscous fluid flow, which can be used for analyzing flowvelocities for forced convection problems. In a few easy steps, you can accurately:
• Simulate heat transfer in a PCB assembly.
• Derive useful graphical results.
• Gain insight into the thermal behavior of a particular PCB Junction-to-case and junction-to-board. Thermal resistances of individual parts can also be modeled within AutoTherm.
4.2.1.8 MCM Station
MCM Station supports multichip module design with integrated high-speed layout tools andadvanced packaging techniques and crosstalk analysis.
4.2.2 Synopsys
The Synopsys tools provide an environment for compiling and simulating descriptions written inVHDL. They provide capabilities for source-level debugging, displaying the results ofsimulations, and performing analysis on these simulation results. It also provides interfaces to C-language models, the LMG SmartModels Library, DesignWare Libraries and Zycad XPAccelerators.
4.2.2.1 VHDL Compiler
The VHDL Compiler converts VHDL source code to an internal format used by the SynopsysDesign Compiler. VHDL Compiler performs two functions: translating VHDL to an internal format,and optimizing the block level representation through various optimization methods.
4.2.2.2 Design Compiler
The Design Compiler reads the design from VHDL Compiler, then optimizes and maps thedesign's logical structure for a specific ASIC technology library. The user determines how muchof the design will be restructured by Design Compiler. The design hierarchy can be left intact,modules can be combined, or the entire design can be compressed into one module. In DesignCompiler, the design can be written out in a variety of formats, including VHDL. Existing gate-level netlists, sets of logic equations, or technology-specific circuits can be automaticallyconverted to a VHDL description. The new VHDL description can serve as documentation of theoriginal design. Furthermore, it can be used as a starting point for reimplementation into a newtechnology. In addition, the VHDL description can be input to a VHDL simulator to provide circuittiming information.
DesignWare Developer, part of the DesignWare product family, lets you create DesignWarecomponents from your own design data. The DesignWare family of products includes tools for adesign reuse strategy that leverages the capabilities of Synopsys synthesis, simulation, andtest and supports the Model Year Architecture methodology of the RASSP program. DesignWarecomponents are verified design units that have been provided with hooks for integration into theSynopsys synthesis environment.
A DesignWare component consists of verified, synthesizable design description(s). The style ofdescription can vary from a technology-specific netlist or hard macro that will not be altered bysynthesis, up to a full hierarchical HDL description of a parametrizable, optimizable design. Oneof the main advantages of DesignWare is that many different design descriptions (differentimplementations) can be created for a given function; the designers can let the synthesis toolschoose which implementation to use in any given context. Modeling directives applied to thedesign descriptions control how Design Compiler models the designs during implementationselection. To characterize the implementations for comparison, the synthesis tool creates apreoptimized model for each implementation in the target technology. The timing and areacharacteristics of the models serve as the basis for implementation selection. The chosenimplementation is inserted, by default, as a level of hierarchy in the user's design, which is thenmapped to the target technology and optimized. Compilation directives control how (andwhether) Design Compiler optimizes the DesignWare component during the optimization ofcircuits that contain the component. Licensing directives protect the designs from unauthorizeduse.
When a designer includes an instance of a DesignWare component in a circuit, the componentundergoes a chain of transformations when the circuit is synthesized. The process starts with asimple HDL construct--an operator or a component instantiation--supplied by the designer. Thefinal result depends on the nature of implementation the tools select as the best: forsynthesizable HDL, the result is an optimized netlist in a particular technology; for a macro, theresult is simply an instance of the macro. Design Compiler includes FPGA compiler whichprovides features intended for high-performance FPGA implementation. The FPGA Compilersupports FPGA-specific optimizations. For Xilinx 4000 series designs, FPGA Compiler supportsCLB and IOB cell optimization. The Design Compiler family of products read in and optimizedesigns in a variety of design formats. These designs can be hierarchical or flat, combinational orsequential. After a design is read in, Design Compiler can optimize it for timing, area, and power(for ECL designs), then mapped it to a target (cell) library. The ECL Compiler supports ECL-specific optimizations, such as creating wired logic. The FPGA Compiler supports FPGA-specificoptimizations. For Xilinx 4000 series designs, FPGA Compiler supports CLB and IOB celloptimization. The optimized design can be written out in a variety of design formats. DesignCompiler also provides links to CAE/CAD tools (such as place-and-route) and post-layoutresynthesis techniques (such as in-place optimization). CAE/CAD tool links provide amechanism for information such as forward-directed constraints and delays to be read betweenDesign Compiler and external tools.
4.2.2.4 SmartModel Library (Logic Modeling Group)
The SmartModel Library is a collection of behavioral models that offer the advantages of fastsimulation and minimum memory requirements. Built into each model are many checks designed todetect specific usage errors that are likely to occur when designing with a particular part. Inaddition to the basic logic simulation features of the library, it also supports Mentor Graphics faultsimulation and timing analysis (QuickPath). The library provides thousands of models includingpopular microprocessors, FPGAs, PLDs, DSPs and complex VLSI components.
4.2.2.5 LM Family Hardware Modeler
Once an integrated circuit or MCM has been obtained from the manufacturer, it can quickly beused as a hardware model. A simple “Speed-Model” of the device can typically be created within
a few hours. A more elaborate Logic Model, including timing information, can be created within aday. Functional verification can then be performed on the ASIC prototype to verify the ASICdesign and fabrication. See Figure 4.2-4 showing the LM Family applications in the design cycle.
ModelingStandardComponents System Level
Simulation
Software/HardwareIntegration
Simulate ASIC& Board
Tool/LibraryDevelopmennt
Design
ModelingASICs
ASICFunctionalVerification
ASIC TimingMeasurement
PrototypeASIC
Verify ASIC
VerifyASIC
System LevelVerificationUsing PrototypeASIC
CreatingProductionTest Vectors
Generate TestVectors
Mfg.Release
LM FamilyApplications
PrototypeBoard
Figure 4.2-4. LM Family usage in the design cycle.
The LM Family modelers can be used to perform software/hardware integration by executingsoftware on a simulated design before investing in prototype hardware. Sections of code can becompiled and stored in simulated memory. This storage allows the use of diagnostics, test, orapplication software as input to the simulation to verify the hardware design. The accuracy of theLogic Model ensures that if the tests complete successfully, the hardware will work.
The accuracy of Logic Models improves the overall accuracy of the simulation, and it improves theperformance of the modeler during simulation. Since the modeler is controlled by the simulator, thedesigner needs to learn only the simulator's user interface. System-level simulation using the LMFamily modelers is of particular benefit when designing ASICs. Before ASIC fabrication, system-level simulation (using Logic Models for standard components and for existing ASICs) verifiesASIC performance in the system. While chip-level simulation (the simulation of the device on itsown) verifies the internal functions of the ASIC, only system-level simulation can verify thefunctionality of an entire system, including multiple devices or even multiple boards.
Using the modeler, a designer can functionally verify prototypes without any specializedknowledge of tester formats, using the familiar simulator interface or the “Play Vectors” utility toapply test inputs and compare results. In addition, the LM Family's timing measurement
capability allows the designer to measure the actual delays on device pins identified as outputsand I/Os, to an accuracy of +/- 2 ns or +/- 2% of the measured delay.
The LM hardware modeler supports System-level verification with a prototype ASIC. Once aLogic Model of the ASIC has been created, it can then be used in performing a complete systemsimulation prior to creating the system prototype. The Logic Model in the simulation verifies thebehavior of the ASIC in the system, speeds the simulation (since the hardware model is used inplace of a gate-level representation), and helps to create additional ASIC test vectors. Worst-case simulation with minimum/maximum delay values can be performed using the Logic Model ofthe prototype; final silicon is not required, because delays may be read from a user-providedtiming file.
The modeler hardware consists of the following elements:
• CPU with system memory - Executes the runtime modeler software and provides Ethernetsupport.
• Timing Generator - Generates the precision timing signals for the system.
• Pattern Controller - Controls the high-speed presentation of pattern history.
• Fast Pattern Memory - Stores the pattern history to be presented to a device.
• Pin Electronics Module - Contains the pin drivers and sampling circuitry for the Logic Model.Each Pin Electronics Module supports 80 device pins.
• Device Adapter - Contains the device being modeled and interfaces it to the Pin ElectronicsModule.
• Diagnostic Adapter - A special Device Adapter used to verify the correct operation of thehardware modeler.
LM Family Software - The LM Family modelers software is composed of the Runtime ModelerSoftware and the Host Computer Software. The LM Family's Runtime Modeler Software is thesoftware that controls modeler operations and provides the main modeler functionality. TheRuntime Modeler Software is downloaded from the host system and executes on the modeler. Itincludes the network support software for the modeler as well as the modeler control software.The Host Computer Software executes on the host system and includes the following:
• Simulator Function Interface (SFI) - The SFI module is linked with the simulator and allows thesimulator to communicate with the modeler.
• Utilities for modeler management and special applications - The Utilities execute on the host andhandle modeler booting, diagnostics, model syntax verification, and modeler configuration andusage reports.
Logic Models are complete and ready-to-use hardware models for use with the LM Familymodelers. Each Logic Model consists of the following:
• Model Hardware - The physical device mounted on a Device Adapter.
• Shell Software - The set of text files that provide information about the device, such as thepinout and timing. Test vectors are also included for use.
4.2.2.6 VHDL Models (SourceModels)
This library contains SSI, MSI and memory components, including a VHDL Test Bench with eachmodel.
NeoCAD's FPGA Foundry is a device-independent toolset for the implementation of FieldProgrammable Gate Arrays (FPGAs). Design entry can be via an HDL program or the MentorGraphics Design Architect schematic capture package with one of the supported libraries(NeoCAD, Xilinx, Actel, or any Viewlogic library). NeoCAD will accept a number of industry-standard netlist formats. FPGA Foundry translates the design into the NeoCAD device-independent database, maps the logic into a target architecture. FPGA Foundry PAR implementsthe design using an advanced, timing-driven place and route tool. With the timing-drivencapability the user is able to specify timing preferences (clock frequency, net delay, path delay,skew) which are used during the place and route process to give the user the desired solutionwith fewer iterations. NeoCAD EPIC (Editor for Programmable ICs) is an advanced device-independent graphical editor which allows the user to view and alter the implemented design.FPGA Evaluator lets the user assess the viability of many different FPGA device alternatives in asingle, consistent design environment. Assisted Device Selection performs a physical mappingof the design to each selected architecture. This determines whether the design will physically fitinto the selected devices. Assisted Speed Grade Selection performs a static timing analysis ofthe design in each family and speed grade to determine which speed grades are most appropriatefor the design. The analysis is performed based on the user's timing constraints. Finally, thetiming-driven place and route can be performed on each candidate device.
4.2.4 Summit
4.2.4.1 TDS (Test Development Series)
The TDS software system is designed to provide all the tools needed to manage the behavioraldata associated with an electronic product development cycle. With TDS, data is generated,reformatted, stored, analyzed, modified, and transformed into test programs to support all phasesof design and production.
Data can be used from many sources. Data from most simulators can be processed and existingtest programs can be used as a data source. Data can be viewed with the TDS tools and thenquickly analyzed for completeness and adherence to specifications. In addition, the capability tocheck data compatibility with the intended tester.
Modifications of the waveforms including adding or adjusting timing information, aligning signaledges, eliminating unnecessary pulses, and eliminating hazardous test conditions can beaccomplished. Output can be generated for resimulation or for production of high quality testprograms for the tester of choice.
The TDS software system consists of many modules. The components of the TDS softwaresystem are:
• ASCII I/O Interface - inputs and outputs waveform data in a standard format for the user'sproprietary tools.
• Conditioners - modify SEF (Standard Event Format - one of Summit's internal databases) tosolve tester compatibility problems or to add device specification information.
• In Converters - accept simulation data and reformat it into waveforms in the SEF database.
• Out Converters - output waveform data as simulation force files for resimulation.
• Test Program Emulators - generate waveform data from existing test programs.
• Test Program Generators (WaveBridge) - output test programs generated from timing andwaveform data from separate sources.
• Simulation Rules Checker - analyzes waveform data for compliance to user-specified rules.
• Utilities - permit the display, printing and analysis of waveform data from the SEF.
• SEF Database - holds the behavior information as unstructured events (wave data withouttiming).
• Waveform Database - holds the behavior information as structured events (wave and timingdata).
• WaveMaker - provides graphical editors to modify WDBs (another Summit data format) andallows creation of graphical job flow scenarios that use other TDS modules.
4.2.4.2 Visual HDL
Visual HDL provides a complete design environment for system designer, ASIC designers, FPGAdesigner, and simulation model developers. Designs are entered graphically and verified thoughsimulation and debugging. Designs may be entered using block diagrams, state diagrams,flowcharts, and truth tables. The output is synthesizable VHDL code.
4.2.5 Precedence
4.2.5.1 SimMatrix
The SimMatrix co-simulation products from Precedence allow the designer to perform system levelsimulations in a heterogeneous design verification environment such as the one required for theArchitecture Verification and Detailed Design portions of the RASSP design cycle. System levelsimulations frequently need models represented at different levels of the design abstractionhierarchy. The SimMatrix technology allows simulations combining gate-level, accelerated gates,emulated gates and VHDL all in a common design environment.
Designs utilizing two or more simulators, such as the QuickVHDL simulator from Mentor and theQuickturn emulator, are hierarchically partitioned within the original design environment. During co-simulation, the backplane transparently manages the flow of information and orchestratessynchronization between the simulation algorithms, ensuring high performance as well asflexibility. The graphical and textual user interface and debugging environment of each simulatoris preserved and available to the designer.
4.2.6 SDRC
The I-DEAS Master Series suite of mechanical CAE/CAD/CAM tools includes (but is not limitedto) the following:
4.2.6.1 Master Modeler
The Master Modeler is a high performance 3D design system and the multi-purpose geometricmodeling foundation of I-DEAS. The solids-based approach aids design productivity by easingconstruction of complex geometry, facilitating design changes, automatically removing hiddenlines, directly calculating mass properties, and providing an accurate part definition for NC(numerical control) machining. The SDRC data management system maintains associativitybetween the master model, drawings, finite element models, and NC (numerically controlled) data.
Utilizing the variational solid modeling capabilities of Master Modeler, Sheet Metal Designsoftware automatically incorporates user-definable bend tables, stress reliefs, and shrinkageallowance into solid models to facilitate rapid design and evaluation of sheet metal parts. Acatalog of sheet metal features including punches, tabs, and other features allows the designer toadd final detail to the part to capture true design intent. The solid sheet metal model can beunfolded and used to create fully associative flat pattern production drawings, and numericalcontrol tool paths for manufacturing.
4.2.6.3 Drafting
I-DEAS Drafting is used to create detailed production mechanical drawings. It can be implementedas a tool for documenting solid models created in Master Modeling or as a standalone 2-D draftingsystem. It is seamlessly integrated with the other I-DEAS modules and utilizes the DynamicNavigator style of user interaction. Orthographic, section, detail, and auxiliary views are easilycreated from the master model.
4.2.6.4 Tolerance Analysis
I-DEAS Tolerance Analysis software provides the capability to evaluate the tolerancespecifications of a design to reduce the chance of assembly interference problems. It usesvariational geometry techniques to determine worst case and statistical tolerance stack upbetween mating parts in a complex assembly. A user can measure the sensitivity of a criticaldimension in an assembly to changes in individual constraints. Tolerance models are created byrelating fully constrained 2D variational sections or wireframes.
4.2.6.5 Mechanism Design
I-DEAS Mechanism Design software is an integrated capability for simulating complex motion ofarticulated mechanisms. Using assemblies created using Master Assembly, joint constraints andconnectivity information are created, and motion and loading inputs are applied. I-DEAS thencalculates resultant forces, motions, and velocities.
4.2.6.6 View and Markup
View and markup is used by checkers to check the final drawings from I-DEAS Drafting, or bydesign review teams to evaluate designs from I-DEAS Master Modeler. An integrated GeometricDimensioning and Tolerancing syntax checker simplifies the drawing checking task. It provides fordrawings to be marked with notes, new geometry added, wrong geometry crossed-out, anddimensions highlighted.
4.2.6.7 Finite Element Modeling
I-DEAS Finite Element Modeling (FEM) software provides comprehensive capabilities for buildingfinite element models and reviewing analysis results. It uses the Master Modeler geometrydirectly, and includes the fundamental modeling functions of automatic mesh generation,application of loads and boundary conditions, and model checking. Post-processing functionsallow the recovery of analysis results and provide extensive graphical and numerical tools forgaining an understanding of results. A rules-based Simulation Advisor is available to guide theuser through the analysis process.
4.2.6.8 Optimization
The Optimization software assists the user in the use of analysis results to directly drive designimprovements. Structural optimization can help weed-out poor design concepts as well asidentify and improve promising ones. It can also be used for fine-tuning designs by minimizing
weight or cost, while insuring they will meet all structural performance requirements. Optimizationuses the finite element analysis approach to simulate structural performance.
4.2.6.9 System Dynamics Analysis
I-DEAS System Dynamics Analysis software provides an interactive, graphics orientedcapability for simulating the dynamic performance of mechanical systems. The user can model amechanical system, analyze its modal parameters, and evaluate its response to applied forcesand enforced motions. System models may be assembled from components defined from FEAanalysis, solid modeling, as well as experimental modal analysis.
4.2.7 Quickturn
4.2.7.1 System Realizer Family
Quickturn's System Realizer Family of Modular Emulation Systems and the Logic Animator rapidprototyping system are used to generate a reprogrammable physical prototype, or "virtual silicon"representation, of their electronic circuit designs. This representation is then available forconcurrent verification of the entire target system, including system software and applications, anditerative design changes, all prior to silicon fabrication.
4.2.8 VEDA Design Automation, Inc.
4.2.8.1 VHDLCover
VHDLCover provides code coverage analysis for VHDL code. Simulation verifies that the portionof code being tested works correctly. VHDLCover analyzes the code and indicates howthoroughly the design has been tested and what portions have not been tested. It providesinsurance that every line of VHDL code has been tested and redundant code is eliminated.
4.2.9 Teradyne
4.2.9.1 VICTORY
Teradyne's VICTORY software fully automates test generation for boundary-scan devices inboards or modules using full or partial scan technology. For individual boundary-scan parts,VICTORY automatically generates in-circuit test patterns. For boards or modules with fullnetworks of boundary-scan parts, VICTORY generates interconnect test patterns that provide100% pin-level fault coverage. VICTORY also supplies tools for testing the internal logic ofboundary-scan devices and for testing conventional devices or device clusters, using the scancells connected to their inputs and outputs as virtual channels.
VICTORY generates four kinds of scan tests: boundary in-circuit tests, virtual interconnect tests,virtual component/cluster tests, and boundary functional tests. VICTORY diagnostic softwarehelps resolve boundary-scan faults during test. VICTORY also provides Access Analyzersoftware to help engineers optimize boards for testability, cost, and performance before layoutbegins.
The boundary in-circuit tests provide automatic generation of boundary in-circuit test (BICT)patterns using information from a BSDL (Boundary Scan Description Language) model, correctanalysis of device constraints like pins tied to power or ground, pins tied together, or pins withoutphysical access, automatic detection of stuck-at pins and interconnect opens without manualprobing, and automatic disabling of the boundary-scan chain during in-circuit testing.
Virtual Interconnect tests (VIT) provide automatic generation of test patterns for 100% pin-levelfault coverage, automatic detection and diagnosis of stuck-at pin faults and shorts and opensbetween boundary-scan parts without manual probing, automatic detection of shorts betweenboundary-scan nets and conventional logic nets that have bed-of-nails access, and automatic
conversion of parallel patterns into serial, tester-compatible format with comments for simplifieddebugging.
Virtual component/cluster tests (VCCT) provide virtual bed-of-nails controllability andobservability for testing non-scan circuitry without physical access, automatic serialization ofparallel test patterns for testing individual non-scan devices or clusters of non-scan devices viathe boundary-scan path, automatic organization of bit-level data for synchronous application viaa combination of real and virtual channels, and simplified circuit initialization by direct forcing ofinputs to desired states.
Boundary functional tests (BFT) provide thorough testing of the test access port (TAP) and1149.1 registers, automatic testing of core device logic through the TAP using the new SerialVector Format (SVF) interchange standard, compatibility with test techniques such as INTEST,BIST, and internal scan, made available by the device designer, and dynamic testing of deviceperformance by applying built-in-self-test (BIST) instructions via the scan chain where thesystem clock is used.
4.2.10 Ascent Logic
4.2.10.1 RDD-100 - Refer to 2.2.2.1.
4.2.11 Savantage
4.2.11.1 SavanSys - Refer to 3.2.2.1.
4.3 Hardware Design Tool Integration
4.3.1 Framework (Mentor's FALCON)
The FALCON Framework is a common environment in which all Mentor Graphics and OpenDoorapplications run. These applications use the FALCON Framework to provide a common userinterface, text editor, and decision support system. See Figure 4.3-1 for a diagram of theFALCON components. The FALCON Framework consists of the following.
The user interface that is used in all Mentor Graphics applications; it supports Open SoftwareFoundation (OSF)/Motif standards to maintain a similar look and feel to all aspects of the userinterface.
4.3.1.2 Design Manager
Design Manager is an application that allows you to view and navigate your design data; move,copy, and manage your data; and invoke applications. The Design Manager manages designobjects. Design objects are related sets of files and directories that describe different aspects ofthe design. Each design object includes a set of object attributes, including identity, type,version, and properties.
4.3.1.3 BOLD Browser
BOLD Browser is an application that displays on-line documentation and help information.
4.3.1.4 Notepad
Notepad provides a text editor that operates in a window of any application. Notepad is a texteditor that includes easy-to-select font sizes and styles, search-and-replace capabilities, auto-wrap, auto-deletion, and file manipulation. Notepad is programmable and has a large set of user-callable functions.
4.3.1.5 Decision Support System (DSS)
DSS is an application, and a tool on which you can build your own applications, that can beused to access and analyze design data, and to manage design processes. The DSSarchitecture has three main features:
• Spreadsheet-like interface.
• Visual gadgets for creating prototypes or data-monitoring control panels.
• Interfaces to external design data.
4.3.1.6 AMPLE
AMPLE is a powerful extension language that supports customization and integration throughoutthe FALCON Framework and all FALCON-based applications. The FALCON Framework is anopen framework. This means that you can add your own applications and data to the frameworkand have them share many of the features of the FALCON Framework environment. Many third-party developers also have versions of their applications designed to run in the FALCONFramework. AMPLE supports structured, procedural programming with a rich set of data types,operators, control structures, and procedural interfaces. Using AMPLE, the Common UserInterface can be customized and extended. Support for concurrent engineering and rapidapplication prototyping are available through AMPLE and DSS. Design applications integratedwithin the FALCON Framework can also be customized and extended with AMPLE. Newcommands and functions can be written in AMPLE. Routine operations can be automated byrecording user actions as replayable AMPLE transcripts. AMPLE supports dynamic linking withlibraries and functions written in the C programming language. Existing in-house and third-partysolutions can be integrated into the FALCON Framework and access to these solutions can beprovided from within AMPLE.
A DFT tool database was developed in MS Excel. Based upon the database, Table 5-1 wasgenerated which illustrates the gaps in currently available DFT tools in up-front test requirementsand strategy management across all packaging levels (chip to system) and the holes in systemand board BIT development and synthesis. Based on this gap, new tools will be developed forinsertion into Baseline 2 and the final deliverable RASSP Design Environment.
Table 5-1. DFT Tool Gap.Tool Function System Board/MCM ICTestRequirementsand MetricsManagement
RDD-100 with RASSPTemplate,ConsolidatedRequirements Template
RDD-100 with RASSPTemplate
RDD-100 with RASSPTemplate
Test StrategyManagement
EXCEL TSDDevelopment and TA*Definition Investigation
TSD Development -Test MeansAllocation Driven byTSD
Fault Simulation Tool Gap IKOS Voyager/FS Multiple tools availablefor SSF**, Delay FaultModels underdevelopment for COTS
Test ProgramDevelopment
Tool Gap ASSET, SCANease,Alternative to ASSETTeradyne Lasar
Summit TDS
*TA - Test Architecture**SSF - Single Stuck-at Faults
5.1 Process Description
The methodology begins with a tangible management commitment. This tangible commitmentprovides the budget and resources to proceed with the methodology.
The second step, System Definition, involves test requirements specification. The testrequirements come from an integration of customer and derived requirements for the three phasesof testing—design, manufacturing, and field support. Specification involves a preliminary, life-cycle cost of test analysis, a test technology assessment, and a design impact analysis todetermine the reasonableness, consistency, and validity of the requirements. Subsequently,during the same step, the three sets of requirements are consolidated into a consolidatedrequirements specification. These activities are supported by dependency modeling using toolssuch as STAT and WSTA.
The Architecture Definition phase consists of three steps: functional design, architecture selection,and architecture verification. In the functional design step, the consolidated test requirements areused to develop the top level test strategy for the design, manufacturing, and field test phases.
In the architecture selection step, the top level test strategy is used to develop and evaluatevarious candidate, top level test architectures. The impact of each test architecture on thecandidate functional architectures is assessed and incorporated into the tradeoff and selectionprocess for them. The test requirements, test strategy, and test architecture are then allocated toBIST/DFT hardware and software for one or more of the selected architectures. The TestStrategy Diagram (TSD) is used as the primary analysis/tradeoff tool. In addition, candidate DFTand BIST techniques are identified for later implementation, based on the specified requirements.Also in this step, any top level BIST supervisory software development will begin, as will on-lineBIST code, since it may have an impact on performance and throughput. Prediction andverification processes begin in this stage as appropriate for compliance tracking.
In this area, TSTB WAVEs will be used to evaluate the capabilities of candidate test equipmentin measurement of required system parameters.
In the Architecture Verification step, the next level of detail of the selected test architecture(s) aregenerated and additional details are provided regarding the test architecture impact on the selectedfunctional architecture(s). For example, behavioral and performance simulations will includeeffects of DFT/BIST techniques, such as the estimated performance degradation due to hardwareconcurrent fault detection circuits or due to periodic execution of on-line BIST software diagnostics.Prediction and verification processes continue during this stage for compliance tracking.
In the Detailed Design phase, test strategies, architecture, and requirements are flowed down tothe detailed design of BIST/DFT hardware and software. The detailed design of the BIST/DFThardware is performed concurrently with functional design using automatic or manual insertion andthen is reflected into behavioral and structural simulation models, whenever possible. BISTinsertion tools from the tool suite from Logic Vision are used to implement board level BIST. Anyremaining BIST software (e.g., for power-up or other off-line BIST functions) is implemented.Test vector sets are developed and verified for each packaging level for physical prototype test,production test, and field test. All test vector sets are documented using WAVEs. Prediction,verification, and measurement processes are used in this stage for requirements compliancetracking. These properties are processed and reported by the TSD hierarchy for the project.
In the Manufacturing phase, functional and performance testing of the overall prototype isperformed, with DFT and BIST hardware and software included. Tools such as ASSETimplement boundary scan testing for boards which rely on JTAG test bus-based testing.VICTORY and VTM:TOP tools support this activity. Production test is performed. Verificationand measurement processes are used in this stage for compliance tracking. BIST and tester-based test cost and performance data are captured and encapsulated for the reuse library.In the field phase, BIST and DFT capabilities are in use. BIST and DFT functions are also usedfor lower level (e.g., organizational and depot level) testing. Verification and measurementprocesses are used in this stage for compliance tracking. BIST and tester-based test cost andperformance data are captured and encapsulated for the reuse library.
Throughout the entire DFT methodology, interfacing is done to the RASSP reuse library to accessexisting candidates and to add to the library when appropriate. In addition, feedback is beingprovided continuously from the compliance tracking process back to the responsible persons toassure corrective action is taken. Finally, it is recognized that iterations may be necessarybecause of the inherent nature of the RASSP methodology.
• TSTB WAVEs Test Vector generation packages from Rome Laboratory and integrated into theMentor QuickVHDL environment are used to develop test benches in WAVEs Level II format.
• WSTA by NUWC develops functional dependency models and diagnostic strategies.
• STAT by Detex Systems, Inc. develops functional dependency models and diagnosticstrategies from Mentor Design Architect netlists. A translator to the Personal Atlas WorkstationSoftware (PAWS) by TYX Corporation facilitates the incorporation of the data into TechnicalRequirement Documents.
• The Test Strategy Diagram (TSD) is a graphical construct which describes how flaws andfaults associated with the life cycle phases of a project are handled by a set of assignedmeans. It is refined throughout all phases of the design cycle.
Architecture Definition Process Tools
• TSTB WAVEs packages and STAT are used during the architecture definition (selection andverification) process similar to the system process as described above.
• During Architecture Selection and Verification, BIT and fault tolerant modes/functions arecaptured as algorithms and flowgraphs using the normal functional design tools such as SPWby Comdisco.
• During Architecture Verification BIST insertion, testability analysis and statistical fault gradingtools are used as the preliminary designs are developed. TSTB WAVEs is used to evaluatethe capabilities of test equipment in measurement of required system parameters.
• ASIC Test Tool Suite by Logic Vision SW is used to perform preliminary test structure insertion(BIST and Boundary Scan) and to capture boundary scan descriptions of new ASICs for usein board level testability analysis tools such as VTM:TOP.
Detailed Design
• TSTB WAVEs Test Vector generation packages from Rome Laboratory and integrated into theMentor QuickVHDL environment are used to develop test benches in WAVEs Level I format.
• STAT by Detex Systems, Inc. develops functional dependency models and diagnosticstrategies from Mentor Design Architect netlists. A translator to the Personal Atlas WorkstationSoftware (PAWS) by TYX Corporation facilitates the incorporation of the data into TechnicalRequirement Documents.
• ASICTest Tool Suite by Logic Vision SW is used to perform test structure insertion (BIST andBoundary Scan), test pattern generation, fault grading and to capture boundary scandescriptions of new ASICs for use in board level testability analysis tools such as VTM:TOP.
• VTM:TOP by Mentor Graphics is used to assess the board/MCM testability based uponboundary scan and testpoint insertion.
• VICTORY by Teradyne is used to generate boundary scan test vectors for device oriented(BICT, VCT and BFT), network-oriented test (VIT and VCCT) for virtual interconnect test ofcomponents and clusters.
• LASAR will be used in conjunction with other tools to aid in developing appropriate test vectorsfor functional, toggle and fault tests. Its min-max simulation capability will minimize the amount oftime spent debugging test programs on testers or in target systems.
• TDS by Summit is used for conversion and enhancement of simulation test vectors into testerspecific formats.
• ASSET Diagnostic System is used to develop boundary scan test programs and diagnostics.During integration and test phases, ASSET is used to control, debug and isolate problems.ASSET's Scan Function Library and ScanEngine are used to generate test programs forembedded T&M controllers which control 1149.1 resources.
• Synopsys Test Compiler combines test synthesis, ATPG, fault simulation, and testmanagement to augomate DFT.
• Mentor FASTSCAN, QuickGrade, and PTM:SITE are used for scan insertion, fault grading, andtest point insertion, respectively.
• SCANease is an alternative to ASSET Diagnostic Sustem Tools.
• STARS (formerly DARTS) from MSI Systems generates a model base for a system whichprovides diagnostic analysis capability and repair recommendations.
• Economic Modeling Tools from Test Economic Services present a comparison of board/ASICcosts based upon entry of board/ASIC/design details with special emphasis on ATE andBSCAN DFT.
• IKOS Voyager is proposed to be used for fault simulation.
• The Fault FS Simulation Accelerator from ZYCAD may be used.
5.2.1 Teradyne
5.2.1.1 VICTORY
Teradyne's VICTORY software fully automates test generation for boundary-scan devices inboards or modules using full or partial scan technology. For individual boundary-scan parts,VICTORY automatically generates in-circuit test patterns. For boards or modules with fullnetworks of boundary-scan parts, VICTORY generates interconnect test patterns that provide100% pin-level fault coverage. VICTORY also supplies tools for testing the internal logic ofboundary-scan devices and for testing conventional devices or device clusters, using the scancells connected to their inputs and outputs as virtual channels.
VICTORY generates four kinds of scan tests: boundary in-circuit tests, virtual interconnect tests,virtual component/cluster tests, and boundary functional tests. VICTORY diagnostic softwarehelps resolve boundary-scan faults during test. VICTORY also provides Access Analyzersoftware to help engineers optimize boards for testability, cost, and performance before layoutbegins.
The boundary in-circuit tests provide automatic generation of boundary in-circuit test (BICT)patterns using information from a BSDL (Boundary Scan Description Language) model, correctanalysis of device constraints like pins tied to power or ground, pins tied together, or pins withoutphysical access, automatic detection of stuck-at pins and interconnect opens without manualprobing, and automatic disabling of the boundary-scan chain during in-circuit testing.
Virtual Interconnect tests (VIT) provide automatic generation of test patterns for 100% pin-levelfault coverage, automatic detection and diagnosis of stuck-at pin faults and shorts and opensbetween boundary-scan parts without manual probing, automatic detection of shorts between
boundary-scan nets and conventional logic nets that have bed-of-nails access, and automaticconversion of parallel patterns into serial, tester-compatible format with comments for simplifieddebugging.
Virtual component/cluster tests (VCCT) provide virtual bed-of-nails controllability andobservability for testing non-scan circuitry without physical access, automatic serialization ofparallel test patterns for testing individual non-scan devices or clusters of non-scan devices viathe boundary-scan path, automatic organization of bit-level data for synchronous application viaa combination of real and virtual channels, and simplified circuit initialization by direct forcing ofinputs to desired states.
Boundary functional tests (BFT) provide thorough testing of the test access port (TAP) and1149.1 registers, automatic testing of core device logic through the TAP using the new SerialVector Format (SVF) interchange standard, compatibility with test techniques such as INTEST,BIST, and internal scan, made available by the device designer, and dynamic testing of deviceperformance by applying built-in-self-test (BIST) instructions via the scan chain where thesystem clock is used.
5.2.1.2 LASAR
LASAR by Teradyne is used to perform min-max simulation to uncover timing problems with testvectors and to develop test programs and diagnostics for board and MCM tests on ATE such asthe Teradyne L300 series. LASAR is the only tool within the Design Environment whichsupports min-max simulation to perform accurate simulation of circuit logic, signal timing includingrace conditions and performance faults. Due to this accurate simulation, LASAR can be used topredict how the Unit Under Test (UUT, i.e., board/MCM) behaves during test. Time spentdeveloping and debugging test programs on expensive testers is reduced significantly oreliminated.
5.2.2 Naval Undersea Warfare Center
5.2.2.1 WSTA (Weapon System Testability Analyzer)
As a generic element of the IDSS (Integrated Diagnostic Support System) the WSTA provides acomprehensive engineering design and maintenance support tool for improving the effectivenessand testability of new and existing systems, both electronic and non-electronic. The WSTA canbe used to interact with a system throughout each phase of design, development, anddeployment to ensure an optimal design for testability. Figure 5.2-1 depicts the WSTA within theIDSS process.
The WSTA makes use of a Standard System Model (SSM) representation of the system underconsideration. A valid SSM will accurately reflect the failure mode dependencies/dependencymodel (DM) of the system components. The WSTA user must perform the proper systemanalysis to derive a DM which is reflective of the defined failure modes for the particular systemunder consideration. Once the user has an acceptable DM he can proceed to input the model intoWSTA. This can be done manually via keyboard entry.
In order to save manual entry time, the user may choose to import circuit descriptive data viaComputer-Aided Engineering (CAE)/Computer-Aided Design (CAD) and Logistics SupportAnalysis (LSA) files. The model generated will contain structural, relational and statisticalinformation about the system design., The CAE/CAD approach will allow WSTA to generate aworking SSM to which the dependency model data can be applied using the WSTA Model Editor.The structural portion of the CAE/CAD model may be derived automatically from the Very HighSpeed Integrated Circuit (VHSIC) Hardware Description Language (VHDL) representation of thesystem. Statistical/parametric information (i.e., test costs, component replacement costs, MeanTime Between Failure (MTBF), etc.) in the form of a LSA data file is merged with the CAE datainto a WSTA Input Data Base (WIDB). Figure 5.2-2 illustrates the WSTA functions and processflow with the CAE/CAD derived data base (WIDB) shown as an optional starting block.
ETC. FAULT ISOLATION LEVELSMEAN TIME TO ISOLATEMEAN COST TO ISOLATE
ETC.
TEST POINT ALLOCATIONFEEDBACK LOOP BREAKING
Figure 5.2-2. WSTA functional flow diagram.
Dependency modeling as used by the WSTA, by its very nature, is a general technique forrepresenting any type or level of the system design including electrical, mechanical, hydraulic, orany combination thereof.
Using the SSM as the foundation, the WSTA performs four classes or types of analyses:1) static analysis, 2) test strategy generation, 3) dynamic analysis, and 4) DFT advisement.
Using information about the system design contained within the dependency model, the WSTAStatic Analyzer generates Testability Figure of Merits (TFOMs), which are measures of theinherent fault isolation characteristics of the design. The static TFOMs include information asfollows:
Ambiguity Group Distribution Data - This information is a tabulation of ambiguity groupcomposition, sizes, and aggregate failure probability.
Inherent Fault Isolation Levels - This is the traditional “scoring” factor commonly expressed asisolation to “X” number of components “Y” percent of the time.
Component Involvement Ratios - This data is a measure of the relative frequency with whicheach component appears in any ambiguity group.
Feedback Loop Data - This is a tabulation of feedback loop compositions, sizes, and aggregatefailure probability.
Alternate Control/Observation Point Data - This information is a tabulation of alternate places interms of input and output tests (upstream/downstream) where a given test result may becontrolled or observed.
Test Strategy Generation
To determine the testability of the Item Under Test (IUT) based upon real world conditions, theWSTA Test Strategy Generator creates a diagnostic fault tree (i.e., a test strategy). The teststrategy is an optimal (in terms of minimization of the expected value, averaged over all possiblefailures, of a linear combination of test time, test cost, risk, a user definable test related parameter,and number of tests) or near-optimal sequence of diagnostic tests for isolating each and everyfailure mode (aspect) of each and every component in the SSM. The test strategy is based onthe assumption that a single aspect of a component described by the SSM is faulty. The teststrategy fault tree represents a “dynamic model” of an on-line fault isolation scenario. The teststrategy fault trees are ultimately stored within the Diagnostic Data Base (DDB) and may be laterused by the IDSS Adaptive Diagnostic Subsystem (ADS), or similar diagnostic aid to assist inthe fault isolation process.
The test strategy takes the form of a pass-fail decision tree. That is, at each node in the tree a listof suspect failure modes (or aspects) exists, and a test is identified to be performed that will bestsplit the suspect failure modes depending on the test pass or failure criteria. Two new failuremode lists are generated; one list of suspect failure modes for the pass leg and one list of suspectfailure modes for the fail leg. Processing continues to build the test strategy by determining the“next best test” recommendation for the failure modes listed until the lowest levels of the tree arereached. The lowest levels are the leaf nodes representing identification of the failure mode(single fault component) or the lowest level ambiguity group. The technique of selecting the “nextbest test” defines how the test strategy is optimized. An artificial intelligence heuristic state spacesearch technique is employed that generates an optimal or near-optimal fault isolation teststrategy. The heuristic employed is the “INFO-GAIN” heuristic.
Dynamic Analysis
The WSTA Dynamic Analyzer uses the “Dynamic Model” (test strategy) to compute and predictadditional TFOMs indicative of the model of the system, and thus, if the model is accurate, thesystem design. These indicators represent the testability performance that may be expectedduring an actual, on-line fault diagnosis session and include the following:
Isolation Penalties - Mean Time to Repair (MTTR) based on individual isolation times calculatedautomatically from the logistics data stored in the Common Diagnostic Data Base (CDDB),
coupled with individual component replacement times, and similarly, Mean Cost to Repair(MCTR).
Replacement/Isolation Tradeoff Data - Provides the user with visibility into the overall testingpicture for the IUT. For example, sometimes it may be cheaper to stop testing with a somewhatlarger than ideal ambiguity group than to incur the increased expense of additional testing. Thisdata is computed for each node in the Test Strategy Fault Tree and will help the user make thatdetermination.
Test Point Utilization Data - Provides a measure of how often each ambiguity group appears in agiven test strategy. This information is also useful for making recommendations to improve theoverall testability of the IUT when selecting test points and incorporating Built-In-Test (BIT).
Test Point Criticality - Provides a measure of the criticality of a test point by providing theaggregate criticality of the components associated with a given test point in the context of the teststrategy. That is, the test point criticality is the number of critical components the given test pointmay be used to isolate and is a relative figure of merit as to the importance of the point. Testpoints with low criticalities that are removed have less impact on mission success since theirremoval results in a lower rate of growth of ambiguity group size than removal of high criticalitytest points would yield.
Design for Testability Advisement
Once the testability of the IUT has been assessed, the user is presented with at least twooptions to follow. The first, and ideal case, is that the IUT meets each and every one of thetestability requirements that have been imposed on it. In this ideal case no further analysis isrequired, and the job of the user is complete. In the more common case, however, the user ispresented with a different situation. The IUT has failed to meet its testability requirements, andthe user is responsible for making changes or recommendations for improving the IUT’s testabilityperformance. The DFT Advisor analyzes the static and dynamic testability indicators andprovides the user with a set of recommendations for improving the testability of the IUT. Therecommendations provided are the following:
Loop-Breaking Recommendations - The optimal point to break each feedback loop, including anordered list of alternatives, is provided for each feedback loop in the model.
Test/Test Point Built-In Test (BIT) Recommendations - Based upon the test strategy, the WSTAwill recommend a set of BIT tests/test points required to certify an IUT as being operational.
Test/Test Point Deletion Recommendations - Based upon tests in the test strategy, (i.e., teststhat provide no additional information) coupled with structural information from the model, theWSTA will provide a list of tests/test points which are redundant (i.e., tests that provide noadditional information in the fault isolation process) in the current design.
Test/Test Point Addition Recommendations - Using information provided by the user concerningwhich nodes in the IUT should be considered as test points and which ones have not beenselected, the WSTA provides a list of those nodes that, if made into test points allowing forcorresponding new tests, will provide the overall testability of the IUT.
To support the above functions, the WSTA contains utility functions to provide access to thedata stored in the DDB, interface services for ease of selecting available functions from menus, acomprehensive model editor for the modification or creation of system and model data, and reportgeneration facilities to enable the user to obtain displays for hard copies of the data andrecommendations.
STAT is a Functional Dependency Modeling computer software which allows the automaticdevelopment of consistent and correct diagnostic information from either a top-down or bottom-upsystems approach describing “How the design Works”. STAT may be used to maximize thediagnostic benefit with existing designs, or with contemporaneously with the concept andproposal phases of new designs for concurrent engineering implementation. When applied tohardware data bases it:
1. Determines Ambiguity (Fault) Group sizes and the percentage of time one can expect toexperience a fault in each Group.
2. Suggests BIT/BITE placement.
3. Defines feedback loops and recommends the most efficient control (break) points.
4. Develops a Diagnostic Flow Diagram and Table with backup detailing the controllabilityand observability associated with each isolated malfunction.
5. Develops an accurate and concise list of hardware associated with the failure of anyparticular test or combination of tests.
There are many kinds of equipment, and many types of malfunctions. And, in hybrid designsthere are even more combinations of events which may cause a malfunction. The sense ofcoverage which STAT reports on is absolute in that it assumes that ANYTHING can be thecause of a malfunction and goes about deriving the smallest non-ambiguous grouping of parts towhich the test technician can isolate. STAT concentrates on the operational aspects of a piece ofhardware and whether ALL operational aspects have been covered (how else will anyone knowthat he has a malfunction but that one of the operational characteristics was not present).
Some of the quantitative measures that STAT reports on are:
Mean Time to Isolate Malfunctions - Using available incremental test times, the STAT Softwarewill generate this measure in accordance with paragraph 1.3.2 of MIL-STD-472 (MaintainabilityPrediction).
BIT/BITE Recommendations - On the basis of the proven diagnostic strategy contained withinSTAT these recommendations will represent the most required test nodes for fault isolation.
Feedback Loop Disclosure - Control of Feedback Loops can play an important part in theminimization of Ambiguity Group sizes. Therefore, it is important that specific information aboutthese loops be disclosed.
Recommended Soft and Hard Break Points - A unique algorithm in STAT provides the most logicalbreak point(s) along with comparative ambiguity group results if other break points are chosen.
Controllability and Observability Points - These points are made on the basis of allinterdependent functional and hardware knowledge possessed by STAT.
Fault Detection Determination - Here STAT suggests what the Output Testing Order should be toprovide 100% detection of Malfunctions with as few tests as possible. STAT also allows theUser to determine his own Output Ordering Sequence to obtain the percentage of Detection thatcan be achieved, within a specific number of tests. This is not a calculation, but rather REALinformation that can be enforced in the maintenance shop TODAY.
Diagnostic Flow Table and Diagram - This information is displayed in a WYSIWYG Viewingwindow with special “Hot Scrolling” Features. In instances where schematic detail is input to theSTAT Software, this information is directly usable at the user’s facility to isolate actualmalfunctions in any maintenance document like a T.O., TRD, or TPS.
STAT is a mature method of creating, structuring, and organizing a complete database (model) ofany design to formulate and expose proven objective, consistent, and accurate testability anddiagnostic information. STAT is directly related to the Dependency Modeling required by MIL-M-24100 (as a referenced specification to MIL-STD-1388). Its Functional Dependency Modeldatabase can be used to produce either inherent or dynamic diagnostic data for the instantaneouscreation and implementation of a powerful, customized “Diagnostic Strategy Engine”. It canobjectively and consistently produce Testability Reports (which categorize both Test andTestability parameters), Diagnostics directly applicable to Portable Maintenance Aids, ProductionTesting, and Automatic Test Program Sets (Development/Modification). It can also be used toinfluence and enhance LSA and FMEA information.
The STAT database is uniquely capable of exposing any logical errors through the use ofancillary functional block diagram creation and test prompting tools (DIAGRAF and DIAVIEW). Itcan be automatically and concurrently created with the design (via CAD import capabilities) andprovide an accurate and objective feedback and assessment of the design to all ConcurrentEngineering (or Integrated Product Development) disciplines (including Design, Support,Production, Value Engineering, Contracts, etc.). Thus, by definition, DYNAMIC INTEGRATEDDIAGNOSTICS is an easily accomplished process.
STAT, uniquely and instantaneously determines i-th order dependency relationships of all designelements and therefore, can determine simultaneous multiple malfunctions and can provide anindefinite number of diagnostic scenarios based on many differing maintenance concepts. SinceSTAT is System oriented, it allows the collection of Libraries of information to be easily linked.Because of the System aspects of STAT, it is able to easily be manipulated as desired by theCustomer. Therefore, STAT is able to retain the integrity of the design at a macro-perspective ofthe system, while retaining the refinement of the design to its smallest component part or signalrelated thereto. Likewise, detectability and fault isolation can be performed at an level, whilehaving the flexibility to adjust in accordance with any restrictions or conditions that may beassessed on the diagnostic process.
The direct outputs of STAT can be used to satisfy the requirements of MIL-STD-2165(Testability), MIL-STD-1345 (Test Requirements Documents), and MIL-STD-1814 (IntegratedDiagnostics).
5.2.4 Logic Vision Software
5.2.4.1 ASIC Test Tool Suite
ASICTEST
ASICTEST is a family of test automation products that reduce time-to-market while implementing ahigh quality and low cost test strategy. It couples front-end generation of synthesizable RTLcode for memory BIST and 1149.1 TAP/boundary scan, with back-end tools for scan insertionand combinational ATPG. ASICTEST features three products: ICRAMBIST, JTAGSYN,ICSCANTEST. Together, they provide a complete test strategy for complex, structured customASICs.
Figure 5.2-3 shows the interrelationships among these tools in the context of design stage. Front-end phase corresponds to logic generation. Back-end refers to test of logic which has beengenerated during the front end processing.
ICRAMBIST is a front-end test automation tool that is run early in the design flow to generate acomplete design implementing BIST of embedded static RAMs. The tool generatessynthesizable RTL code (plus constrains) for a BIST controller and any memory interfacesneeded to implement an efficient, deterministic BIST scheme for the memories. To validate thedesign, a stimulus file is generated for use with simulation.
ICRAMBIST implements a patented memory BIST strategy that offers at-speed, deterministictesting of the memory, with low area overhead and low routing complexity. The BIST controllergenerated by ICRAMBIST contains a finite state machine that implements standard memorytesting algorithms. Unlike a random pattern scheme, the ICRAMBIST scheme gives know faultcoverage. A BIST collar is generated for each embedded memory permitting the BIST controller toapply the test patterns through a serial data path. The collar loads and unloads the memory datain parallel and at-speed. The scheme also allows multiple memories, of variable size, to share thesame controller.
The use of a serial data path and the ability to share a controller among multiple memories makesthe overhead extremely low. The area of a BIST controller or a collar is only about 400 gateseach for a MARCH test and varies little with memory size. The collar introduces a single muxdelay on the memory signals, but in many technologies this mux is now included in the memory.
The overhead introduced by using the BIST scheme is more than offset by the savings in testpattern development effort. Using BIST eliminates the need to develop any memory testpatterns. The test pattern simply turns on the controller and monitors the BIST status bit.
JTAGSYN
JTAGSYN is a front-end test automation solution that is run early in the design flow to generate acomplete set of design files to implement 1149.1 Test Access Port and Boundary Scan. The toolgenerates synthesizable RTL code for the Test Access Port (TAP) and Boundary Scan cells. Italso provides a complete top-level module instantiating and connecting the TAP and BSCANcells together with the I/O pins and the core modules. To validate the design, a stimulus file isgenerated for use with simulation. In addition, JTAGSYN produces a Boundary Scan Design
Language (BSDL) file that can be used to describe the ASIC to board-level test tools. A vendorpinout file for the ASIC is also generated.
JTAGSYN works from a technology independent, pin description file. Describe the pins neededfor the ASIC, and the desired options, and JTAGSYN is ready to run. Changes to the top-levelmodule can be made quickly, simply by altering the I/O description and regenerating.
The TAP and Boundary Scan cells generated by JTAGSYN are based on a customizable libraryallowing different 1149.1 implementations. The product comes with a library featuring a flexibleTAP, with optional device ID register, and a complete set of Boundary S cells. The TAP offers anextended instruction/status register for supporting internal scan, BIST and other user test modes.The Boundary Scan cells in the library include input, output, bi-directional, enable and sample-only capabilities.
JTAGSYN does not require the designer to be an expert in the 1149.1 specification or create andedit a BSDL file. The input is a text file in which the designer only specifies design information,such as the pin list, special core nets (clocks, reset, scan, and status), and any options.JTAGSYN accepts these inputs and performs processing necessary for boundary scan logicgeneration.
ICSCANTEST
ICSCANTEST is a full suite of tools (ICSCAN™, ICCHECK™, ICATPG™, andICREORDER™) for scan chain insertion, scan rule checking, combinational ATPG and faultsimulation, and test pattern ordering/formatting/verification for gate level netlists. Flexibility is inthe form of user options and support for scan models. The scan models permit the tools totransparently handle memories and test mode logic (like the 1149.1 Test Access Port), as well assome nonscannable circuitry.
ICSCAN offers flexible scan chain insertion to enhance the testability of the gate level netlist.The tool automatically replaces regular flip-flops wit scannable equivalents and ten routes thescan chains between them. The designer can specify which flip-flops or modules should be scaninserted, the number of scan chains and the preferred routing order. Existing scan chains can bespecified and connected. The modified gate level netlist can be fed back to logic synthesis for re-optimization.
ICCHECK verifies that the circuit meets standard scan design rules and extracts thecombinational portion of the circuit while taking into account the scan models. The rules areapplied in test mode only, thus clocking strategies in normal system mode can be more flexible.
ICATPG automatically generates test patterns for the combinational portion using bothdeterministic and pseudo-random approaches. It has very high performance and is capable ofhandling circuits with hundreds of thousands of gates using both stuck-at faults and transitionfaults. It also supports incremental fault simulation and pattern generation for target fault lists.
ICREORDER sequences the test patterns for application to the scan chains from the externalpins. It understands 1149.1 and generates the test set taking it into account. The final test setmay be targeted to a number of different simulation, tester and vendor formats.
5.2.5 Lockheed Martin ATL/Self Test Services
5.2.5.1 Test Strategy Diagram
TSD Concept
The Test Strategy Diagram is a graphical construct which describes how flaws and faultsassociated with the life cycle phases of a project are handled by a set of assigned means. Thefault coverage effectiveness of each means in terms of detection, isolation, and correction and the
order in which the means are applied are specified. Figure 5.2-4 shows the elements of a TSD.The processes of detection, isolation, and correction b each of the assigned test means aredescribed in three rows of elements containing transfer functions and attributes. The transferfunction represents the effectiveness of a test means at either detection, isolation, or correction.Each successful detection, for example, is passed on to the same test means for isolation. Ifpossible, isolation is accomplished and is passed to that test means for correction. Anunsuccessful attempt at detection, isolation or correction is immediately passed on to the next testmeans for possible resolution. Successful operations are indicated by the paths labeled Os,which represents the number of events successfully processed by the test means at thatparticular stage. Unsuccessful operations are indicated by Ou, which is the number of misseddetections, isolations, or corrections. Effectiveness of a test means at any operation isquantifiable as the ratio of the Os value to the number of incoming faults. This ratio is called thetransfer function for a specific test means for a specific operation. These are indicated as TFDi inFigure 5.2-4. Other entries a TSD are the test attributes labeled ATTR in the boxes. Thesetypically are cost and time for each particular test for each operation. Other significant quantitiescan be added to reflect a specific test environment.
…
TOTAL POPULATION IN UUT OF ITEMS BEING DETECTED, ISOLATED, AND CORRECTED
TFD1
ATTR
Os
Os
DETECTION
ISOLATION
CORRECTION
TotalPopulation
Ou
TEST MEANS1
TEST MEANS2
TEST MEANSN
TEST MEANS
DEFINITIONS
ATTR Attributes being evaluated (e.g., cost, time, quality, etc.)
Os Output successful (e.g., detected quantity)
Ou Output unsuccessful (e.g., undetected quantity)
TEST Means of performing test MEANS (e.g., types of BIST, types of
test equipment, manual procedures, etc.)
TF Transfer function (e.g., fault coverage percent)
For example, design flaws, manufacturing defects, or field failures
TESTFUNCTION
TFI1 ATTR
TFC1
ATTR
Os
Ou
Ou
TFD2
ATTR
Os
Os
Ou
TFI2 ATTR
TFC2
ATTR
Os
Ou
Ou
…
…
…
TFDN
ATTR
Os
Os
TFIN ATTR
TFCNATTR
Os
JSE 13
Figure 5.2-4. Test strategy diagram concept.
The TSD is constructed from the test means information specified in the ConsolidatedRequirements document. It summarizes the results of the process of converting projectrequirements to test means sequences with assigned flaw/fault coverage performance. Morespecifically, it displays the singular test philosophy and any supplemental test means added to aparticular project phase. It becomes the vehicle for quantitative measurement of conformance torequirements based upon application of the selected test means. The TSD explicitly shows theeffects of application of each of the test means selected for each phase of the project life cycle. ATSD for a project phase such as manufacturing is made by creating a three row by N columnmatrix containing detection, isolation, and correction entries in the rows and N test means in the Ncolumns. The test means are ordered as specified in the final version of the consolidatedrequirements template sheets for the manufacturing phase.
There is one TSD for each of the identified flaws/faults associated with the design, manufacturing,and field support phases of a project.
The complete collection of TSDs consists of a hierarchy of matrices which spans project phaseand packaging levels as shown in Figure 5.2-5.
Four classes of TSDs exist:
1. Requirements TSDs which specify the requirements allocation to the available testmeans, i.e., what is expected from each test means toward satisfaction of a given testrequirement.
2. Prediction TSDs which specify expected test performance during system planing andearly design phases based on historical engineering experience.
3. Verification TSDs which are populated with the results of simulations of tests.
4. Measurement TSDs which are populated wit the results of actual measurements of testeffectiveness.
The classes are represented by the labels R, P, V, and M in Figure 5.2-5.
Figure 5.2-5. Hierarchy of test strategy diagrams.
All TSDs related to a particular flaw or fault have the same form regardless of class. The purposeof multiple classes is to allow for comparison among the classes. This enables constantcomparison of test means performance at any phase and packaging level of a project withrequirements assigned to that test means. A secondary purpose of multiple TSD classes isvalidation of assumptions made at system design and verification times.
The TSD sets for BM3 were constructed as EXCEL workbooks. A workbook is essentially athree dimensional “spreadsheet”, a collection of related two dimensional spreadsheets designedto efficiently implement data sharing among all the two dimensional spreadsheets in the set.These worksheets will be referred to as Sheets in the following discussion.
Each workbook consists of a set of worksheets which details the four classes of TSDs for oneparticular flaw or fault. Three worksheets form a set capable of controlling/monitoring handling of aspecific flaw/fault. A separate workbook is assigned to each flaw and fault for which requirementshave been established. Individual worksheets are assigned to requirements, predictions,verification, and measurement related to the flaw/fault. For any one complete workbook, thenumber of worksheets will be up to 12. At system design levels, fewer Sheets will be neededsince verifications and/or measurements may not apply. Twelve sheets will be required at thefield support project phase and at the manufacturing phase for handling acceptance/qualificationtesting.
During the system concept and design development phases of a project, the requirements andprediction worksheets are populated. The verification and measurement worksheets will bepopulated as the project proceeds into the actual design and fabrication phases.
Figure 5.2-6 shows a typical EXCEL TSD describing requirement allocations to selected testmeans for bridging, open, and stuck-at faults which characteristically occur during a projectmanufacturing phase.
BRIDGING, OPEN, STUCK-AT FAULTS HANDLED DURING MANUFACTURING TESTEnter Requirements, Flow Down or Budgeted Values Here
Flaw Pop. i.e. BRIDGING, OPEN, STUCK-AT FAULTS FMECA Weight 1
1000.00
Detection - 65.00% 350.0 10.00% - 315.0 40.00% - 189.00 50.00% - 94.5 50.00% - 47.3 95.28%Test Time 225.0s Test Time 0.3s Test Time 180.0s Test Time 450.0s Test Time 336.0s Test Time 1191.3sTest Cost $9 Test Cost $21 Test Cost $78 Test Cost $900 Test Cost $39 Test Cost $1047
650.0 35.00 126.00 94.50 47.25
Isolation - 95.00% 32.5 20.00% 20.00% 54.00 40.00% 40.00% 108.00 50.00% 50.00% 101.3 50.00% 50.00% 74.3 99.40%Test Time 225.0s Test Time 0.3s Test Time 180.0s Test Time 450.0s Test Time 336.0s Test Time 1191.3sTest Cost $18 Test Cost $13 Test Cost $51 Test Cost $207 Test Cost $42 Test Cost $331
617.5 13.50 72.00 101.25 74.25
Correction - 0.00% 618 0.00% 0.00% 631 0.00% 0.00% 703 0.00% 0.00% 804 100.00% 100.00% - 100.00%Test Time 0.0s Test Time 0.0s Test Time 0.0s Test Time 0.0s Test Time 1350.0s Test Time 1350.0sTest Cost $0 Test Cost $0 Test Cost $0 Test Cost $0 Test Cost $114 Test Cost $114
- - - - 878.5
INSPECTION BIST BS-ATE ATE MAN TOTALTest Time 450.0s Test Time 0.6s Test Time 360.0s Test Time 900.0s Test Time 2022.0s Test Time 3732.6sTest Cost $27 Test Cost $34 Test Cost $129 Test Cost $1107 Test Cost $195 Test Cost $1492
Figure 5.2-6. Typical requirements TSD.
This TSD describes details of the allocations to the detection, isolation, and correction levelswhich are required to be achieved by each of the test means assigned to the testing for theflaw/fault. On this sheet, the user will enter the transfer functions, cost, and time allocationsappropriate to the flaw/fault being processed.
5.2.6 ASSET, Inc.
5.2.6.1 ASSET Diagnostic System
The ASSET Diagnostic System supports interactive debug and test of IEEE 1149.1-componentdesigns. This bus supports controllability and observability of components and interconnectionson a printed circuit board (PCB) via a 4 wire connection to the PCB. Components are seriallylinked in a scan chain. Serial test vectors can be applied to components to drive them asrequired. Also, the state of the output pins on components can be obtained via serial readprocess. The Diagnostic System allows a user to interactively control and observe scannablesignals at the register, bus, or pin level. The Diagnostic System also provides the capability to
locate faults found on a device, board, or system. These faults can be detected throughinteractive access and control and scan vector analysis.
The ASSET Diagnostic System uses standard JTAG instructions such as EXTEST to debugdesigns interactively. The Diagnostic System has features similar to logic analyzers to aid thehardware engineer doing prototype design verification in an R&D lab.
The ASSET Diagnostic System includes all capabilities found in the ASSET Test VectorDevelopment System. These include:
• ASSET data base creation and maintenance.
• Serial vector input, output, and analysis.
• Parallel vector serialization.
• Automatic assembly diagnostics.
• Easy vector development through the ASSET macro language.
• Scan path integrity checking with Scan Path ATPG.
• ASSET scan hardware for interaction with your unit under test (UUT).
In addition, the Diagnostic System includes the ASSET Scan Analyzer™ and Debugger forinteractive access, control, and observation of a UUT.
Scan analyzer is used to view vectors and analyze response of hardware by comparingexpected and actual values.
The ASSET Debugger provides controllability and observability of the IEEE 1149.1 architecturewit the following features:
• Graphical view of the design hierarchy.
• Ability to edit scan data at the register and pin level.
• Data manipulation via user-defined symbolics or via binary, decimal, or hexadecimal data input.
• Register grouping based on a design’s functionality.
• One-button interface to apply changes made to instructions and data values.
• Single-step application of pre-existing macros or serial vectors.
The ASSET system installs on a PC and interfaces to a board under test via a standard JTAGtest bus link.
5.2.7 Mentor/Teradyne
5.2.7.1 Virtual Test Manager: Testpoint Optimizer Software (VTM:TOP)
VTM:TOP is a VICTORY™ software developed by both Mentor and Teradyne. It enablesdesign and test engineers to take maximum advantage of the observability and controllabilityprovided by boundary-scan devices on electronic assemblies that have a mix of boundary-scanand conventional technologies.
VTM:TOP provides the engineer with a link between design and test. It provides optimized test-pad selection for PCBs and MCMs that contain boundary-scan (IEEE 1149.1) devices.VTM:TOP is used after design entry and before CAD layout, to generate reports that helpselection of the optimum number of test pads for both in-circuit and functional cluster testing.
When VTM:TOP is used along with Mentor’s Physical Test Manager, testpoint analysis andplacement is fully automated. To allow performance of testpoint analysis as part of the designtrade-offs, VTM:TOP is integrated with DSS, Design Viewpoint Editor, and Board Station.
Testpoint analysis includes:
• Pre-layout analysis of board-level testability issues.
• Automatic review of scan and non-scan networks for controllability and observability.
• Automatic identification of full boundary-scan networks providing 100% controllability andobservability without bed-of-nails access.
• Automatic ranking of non-scan devices based on where a minimum amount of test points can beadded to achieve the maximum amount of testable devices.
VTM:TOP can specify the networks that do not require access when using the VIT technique.Conversely, it can recommend networks that should have access to minimize complexity whenusing the VCCT technique.
5.2.8 Rome Laboratory
5.2.8.1 TSTB WAVEs
TSTB is one of the prototype WAVEs tools developed by Rome Laboratory. The WAVEsobjectives are to capture logic signal histories during simulation or UUT test patterns duringhardware test and easily exchange data between them. When TSTB is run on a VHDL design,the WAVEs model specific packages generated are the UUT_pins package, the waveformgenerator procedure template, and the header file template and the test bench. The waveformgenerator file is then modified to describe the input/output waveforms and the clock period. Thetest bench generated by the tool wires the WAVEs waveform data set and the VHDL modeltogether for design verification. A user developed vector file to stimulate the testbench is neededto stimulate the program. This vector file is very similar to the one which will ultimately be used forhardware test.
5.2.9 Summit
5.2.9.1 TDS (Test Development Series)
The TDS software system is designed to provide all the tools needed to manage the behavioraldata associated with an electronic product development cycle. With TDS, data is generated,reformatted, stored, analyzed, modified, and transformed into test programs to support all phasesof design and production.
Data can be used from many sources. Data from most simulators can be processed and existingtest programs can be used as a data source. Data can be viewed with the TDS tools and thenquickly analyzed for completeness and adherence to specifications. In addition, the capability tocheck data compatibility with the intended tester.
Modifications of the waveforms including adding or adjusting timing information, aligning signaledges, eliminating unnecessary pulses, and eliminating hazardous test conditions can beaccomplished. Output can be generated for resimulation or for production of high quality testprograms for the tester of choice.
The TDS software system consists of many modules. The components of the TDS softwaresystem are:
• ASCII I/O Interface - inputs and outputs waveform data in a standard format for the user'sproprietary tools.
• Conditioners - modify SEF (Standard Event Format - one of Summit's internal databases) tosolve tester compatibility problems or to add device specification information.
• In Converters - accept simulation data and reformat it into waveforms in the SEF database.
• Out Converters - output waveform data as simulation force files for resimulation.
• Test Program Emulators - generate waveform data from existing test programs.
• Test Program Generators (WaveBridge) - output test programs generated from timing andwaveform data from separate sources.
• Simulation Rules Checker - analyzes waveform data for compliance to user-specified rules.
• Utilities - permit the display, printing and analysis of waveform data from the SEF.
• SEF Database - holds the behavior information as unstructured events (wave data withouttiming).
• Waveform Database - holds the behavior information as structured events (wave and timingdata).
• WaveMaker - provides graphical editors to modify WDBs (another Summit data format) andallows creation of graphical job flow scenarios that use other TDS modules.
5.2.10 Mentor
5.2.10.1 FASTSCAN
FASTSCAN replaces flip-flops in the design with scan flip-flops and generates test vectors.
5.2.10.2 QuickGrade
QuickGrade is used for fault grading.
5.2.10.3 PTM:SITE
PTM:SITE inserts test points on MCM Station using results from VICTORY.
5.2.11 National Semiconductor
5.2.11.1 SCANease
SCANease is an alternative to ASSET Diagnostic System tools.
5.2.12 Synopsys
5.2.12.1 Test Compiler
Test Compiler combines test synthesis, ATPG, fault simulation, and test management toautomate DFT. Test Compiler products are used throughout the design process to analyze andimprove the testability of designs. Test Compiler family products can be used to synthesize and
insert test structures into the design and generate high fault coverage test patterns for scan-based designs.
5.2.13 MSI Systems
5.2.13.1 STARS (Formerly DARTS)
STARS produces a design model-base directly from Computer-Aided Design (CAD) output datafiles. The STARS architecture includes automatic translation of CAD output in either EDIF orVHDL format. Most popular CAD systems today output EDIF format. In the future, VHDL designrepresentation will become the standard for DoD design efforts. In cases where no CAD dataexists, the STARS has been supplemented with a commercially available, off-the-shelf, low-costschematic design tool, OrCAD, which can be used to graphically enter schematic data and thenoutput into the appropriate EDIF format.
As the design of a system evolves, it is necessary to generate a series of diagnostic designcandidates in order to support the trade-off and optimization process. Without the ability to havemultiple candidates, the systems engineering team does not have the detailed insight required tomake informed decisions. A diagnostic design candidate is a profile of the diagnostic capabilityand accuracy given a specific combination of tests: performance monitoring, built-in tests,operator observations, external tests and measurements, and probe points.
STARS has automatic utilities for incorporating design updates into the model-base. The utilitiesserve to “merge” the updated design into the old design, including all associated diagnostic designcandidates. The only manual part of the process is in defining the attributes of the updates.STARS assists the user in this task by pinpointing where the design has changed. The use ofX-Windows under DESQview/X enables the testability interaction to occur directly on thedesigners CAD platform (PC or workstation).
STARS employs a dynamic reasoning capability called a Diagnostician. A Diagnostician is thecombination of the model-base, in matrix format, and a software routine which interacts wit the UTdesign representation (model-base) with a finite set of test and measurement data to diagnosefaults through interpretation of test results. The UUT design representation, generatedautomatically by the Diagnostic Analysis and Repair Tool Set, is in a Fault/Symptom Matrixformat. The Fault/Symptom Matrix is a mapping of all possible failure locations to the information,or test data, that imply each specific fault. The software routine makes use of set coveringalgorithms and cones of evidence to relate the test information to the mapping provided by thematrix.
The Diagnostician is useful for a multitude of mission essential functions including: faultmanagement, reconfiguration, and virtual prototyping.
The Diagnostician can be embedded within prime system hardware to provide self-sustaineddiagnostic capability and/or can be embedded within a piece of automatic test equipment to act asthe diagnostic test program set.
In the Test Program Set application, the need to develop extensive, lengthy diagnostic testprograms is minimized. The reduction in the number of diagnostic test programs is accomplishedby utilizing the Diagnostician tied to the functional, or end-to-end programs, which are normallydeveloped for factory testing or acceptance testing. The functional test program includes a seriesof tests and measurements which determine if the unit is operating within specified performancelevels. By logging the results of these individual tests and measurements, the Diagnostician caninterpret the results into diagnostic information. In many cases, no additional tests will be requiredto achieve fault isolation. In cases where, based upon the results of the functional test, anambiguity group exists, the Diagnostician will make calls to the test program set to execute thosetests, and only those tests, which will provide diagnostic resolution.
In the embedded application, the Diagnostician can be hosted on any embedded computer ormicroprocessor. It can interact with any performance monitoring and sensor data, including datadirectly off a 1553 or 1149.1 bus.
5.2.14 Test Economic Services
5.2.14.1 Economic Modeling Tools
The Economic Modeling Tools are EXCEL spreadsheets that allow the user to enter details of aboard or ASIC design and observe the effects on the cost of production quantities of the product.The board design analyzer includes a comparison of two alternative approaches to testimplementation, ATE and BScan, and allows the user to determine the cost effectiveness ofBScan DFT insertion. Test strategies for each case are defined by the user. The tools are veryinteractive and perform a “real time” “what if” capability which gives instant reaction to userselected changes to design factors. The tools present many parametric cost charts as part of thespreadsheet output.
5.2.15 IKOS
5.2.15.1 Voyager FS
IKOS Voyager FS provides concurrent fault processing in software comparable in performance tospecial purpose hardware fault accelerators. It uses the same sign-off and certified IKOS ASIClibraries as used by Voyager CSX and Gemini CSX. It provides mixed-level fault simulation withVHDL test bench methodology, in addition to traditional vector-based fault simulation. The WGL,EDIF and VERILOG(TM) formats are supported for import for classical design flows. There is fulltiming fault simulation for multi-phase clocks, multiple strobe points, and feedback loops
5.2.16 ZYCAD
5.2.16.1 Fault Simulation Accelerator
The Fault Simulation Accelerator from ZYCAD may be used.
An enterprise system provides the tools and facilities for managing and providing access to theenterprise information and integrating the automated processes of an enterprise. The enterprisesystem for RASSP is defined as the integrated set of tools and facilities required to support thedevelopment of a signal processor prototype - design, manufacturing, test, management,procurement, etc. The RASSP enterprise system enables the integration of the tools used in thevarious stages of the development of a signal processor, using a workflow management tool andan enterprise-wide product data manager. It supports integrated product development byproviding an infrastructure to support concurrent engineering in a distributed environment. Usersare supported by a desktop environment that provides services to support interaction with eitherindividual tools or groups of related tools coupled with specific frameworks. The enterprisesystem provides support services enabling users to interact with other users on common internalnetworks. In addition, the enterprise system supports interaction with external system users,such as team member organizations, manufacturing centers, and external suppliers who aremembers of the concurrent engineering development team.
The RASSP enterprise system implementation is based on commercially available tools,database systems, product data management systems, workflow management systems, networktechnologies, and related applications. The enterprise system provides a highly productivedevelopment environment that enables designers to focus their development tasks on the targetdesigns-providing a degree of isolation of the designers from the detailed translations andinformation management functions required to support design processes.
6.2 Enterprise System Tools
The enterprise system toolset includes the following:
• DMM (Design Methodology Manager) from Intergraph is used to execute workflows(methodology) defined for a project or a high level task such as detailed design.
• AIM (Asset and Information Management) a Metaphase based PDM from Intergraph is used tomanage product information across the enterprise.
• Explore (CLMS) from Aspect classifies, manages and cross-references all component, supplierand design data and automates the processes associated with this information, as well as theVIP Family of Component Reference Databases.
• IIB from Sandpiper Software, Inc.
• TriTeal Enterprise Desktop (TED) from TriTeal is a graphical desktop environment that providesindependence from the underlying operating system and hardware.
• MI (Manufacturing Interface) from SCRA is a standards based capability to perform design-for-manufacturing analysis and perform data translations between design and manufacturing tools.
• Communiqué and Cooltalk by Insoft support a wide variety of information exchangemechanisms to support collaborative work.
• Netscape Enterprise Server from Netscape provides secure communication and browsingcapabilities over the Internet.
• PGP from Viacrypt allows users to ensure that their messages are read only by intendedrecipients by using public key encryption.
• WorkExpert from Mentor is used to execute workflows to automate tasks.
• ProSim from KBSI is a process modeling tool used to capture processes and tasks relatedinformation. ProSim generates models that can be simulated by simulation tools such asWitness.
• Witness from AT&T is a discrete event simulation engine that provides capabilities to performwhat-if analysis and evaluate alternatives based on simulation results.
• MS Project from Microsoft is used to perform project planning, scheduling, and tracking.
6.2.1 Intergraph
6.2.1.1 Design Methodology Manager
Design Methodology Manager (DMM) guides you through your design process while managingthe relationships between the various tasks in the process. This reduces error propagation andtrims design cycles. Included within DMM is a workflow builder for defining the process model,and an Application Procedural Interface (API) for custom integration of external applications. DMMcomes with a collection of software utilities and a graphical user interface that allows you to easilyencapsulate your own applications.
Process workflows reduce the learning curve and increase productivity.
Allows designers to focus on the creative side of design rather than on the mechanics of usingdesign automation tools. This dramatically increases designer throughput.
• Intuitive, workflow-based user interface jump-starts the user.
• Reduces relearning of design tools as engineers move from project to project.
Easy Application Encapsulation
With DMM, you don’t have to be a software engineer to encapsulate applications. DMM’sgraphical user interface allows anyone to encapsulate most common applications.
Control and Track Design Processes
Some design processes span two or more companies or multiple groups in the same company.In this case, your design processes may have to be enforced to ensure that required designpractices are followed for projects to be completed successfully.
• Ensures correct design process.
• Maintains a history and audit trail.
Lowers Your Cost of Ownership
Interoperability across UNIX and Microsoft Windows platforms enables you to leverage yourexisting hardware and software investments.
• Databases are binary compatible across platforms and operating systems.
• Consistent look and feel across platforms and operating systems.
• Supports any combination of serial, branching, concurrent, or looping processes.
• Supports multiple branching operators.
• Links to project management tools such as those supplied by Microsoft.
• Scaleable, single-user or enterprisewide process workflows.
Intuitive Design Workflows
• Supports workflows that are process, project, or design-specific, or that apply to a companyglobally.
• Graphical view of task sequencing provides information for scheduling purposes as well asprocess tracking.
Advanced Capabilities
• Administrative capabilities allow selected users to reset workflows.
• Application Programming Interface (API), which consists of “C” function calls, allows VBDMA tobe integrated into third-party applications.
• Supports export of history information to third-party spreadsheet packages and projectmanagement tools.
Data In
• Any data in industry-standard comma-separated value (CSV) file format.
Data Out
• CSV file format.
• State information and compiled workflow data for use by Design Methodology Manager and theAdministrator.
6.2.1.2 Asset and Information Management (AIM)
The Intergraph Asset and Information Management (AIM) is a Product Data Management (PDM)system that is based on the Metaphase PDM system from Metaphase Technologies. Keycomponents of AIM are AIM/Server, AIM/Manager.
AIM/Server is the server-based component for AIM, Intergraph's enterprisewide Asset andInformation Management solution. AIM/Server provides an object-oriented framework thatincludes architectural components for data indexing storage, query, security, and usage control.Full-text retrieval indexing (AIM/FTR) is also available for AIM/Server. This architecturalframework creates a graphical work environment to help users quickly locate and use documents.Not only will AIM/Server manage information, but it will also ensure that access to information iscontrolled and information integrity is preserved throughout the life cycle of a document.
AIM/Server performs many object management functionalities including administration of users,groups, and hosts; a generic set of object classes and relationships; object creation, storage,vaults, and queries; and a rule-driven security mechanism. AIM/Server uses a relationaldatabase for maximum efficiency and security.
• Data model represented as predefined objects and classes.
• Management of CAD files and their reference files, such as Intergraph's Solid EdgeÔ andImagineerÔ Technical.
• Automatic support of file relationships for EMS, .DWG, .dgn, HTML, and CGM file types.
• Rules engine to enforce business processes.
• Graphical desktop paradigm and browsers.
• Logically centralized repository resident on one or many physical systems on mixed platforms.
• Bulk load utilities.
• Nested message groups.
• Generic set of object classes and relationships with associated rules and methods.
• Default processes for working with documents.
• Manipulation of frozen items.
• User-defined schedules for process execution.
• Rules-driven security mechanism.
• Multiple platforms support.
• Enhanced file sharing.
• Print without view capability.
Additional AIM/Server features include an object-storage mechanism for managed objects,database independence, and support for distributed databases and distributed metadata.
AIM/Server provides a dynamic data exchange (DDE) interface that enables external DDE-enabled applications, such as SAP, to communicate with the AIM system. The communicationbetween AIM and external applications is performed through AIM/Manager, the client module ofthe AIM system.
AIM/Manager features a configurable graphical user interface that gives both technical and non-technical users a comprehensive solution for managing documents at their desktop. By providingan interface into the object data vault managed by AIM/Server, AIM/Manager allows easymanagement of multiformat files distributed across a mixed network of hardware, software, anddatabases.
AIM/Manager provides a wealth of functionality, including the ability to:
• Store, organize, and track documents, drawings, and other data.
• Associate data files with documents, document groups, drawings, or folders.
• Conduct user-defined document searches.
• Check in, check out, copy, and delete documents and associated files based on security rules.
• Query for documents by full-text or keyword searches.
• Use proximity searching to perform queries for documents in the AIM system.
• Use a thesaurus to perform full-text retrieval queries for documents in the AIM system.
• Approve and sign off documents electronically.
• Participate in a workflow.
• Launch AIM/View and AIM/Redline for view and redline operations.
• Manage redlines created with AIM/Redline.
• Launch third-party editing packages.
AIM/Manager is a comprehensive solution for any organization's document management needs.The product will manage any type of document or drawing, including raster, spreadsheet, wordprocessing, ASCII, and CAD files such as MicroStation and AutoCAD. The product alsoprovides an open-system environment for document storage. Supported RDBMSs includeOracle and Informix.
Configurable Interface
AIM/Manager look-and-feel simplifies the process of managing documents. In conjunction withAIM/API, the user interface is configurable to suite the needs of a user, user group, user functionor department, or company standard. The AIM/Manager window displays documents in one ofthree modes - tree view, icon view, and browse list view. The tree view provides a graphicalrepresentation of the documents and their relationships to other documents; the icon viewdisplays a different icon for each type of document; and the browse list provides a scrolling list ofattributes for each document. With simple pull-down menus and key-ins, new documents can becreated and placed in the object vault. User-defined attribute information - such as documentname, revision, and a description - is associated with the document and automatically maintainedand managed by AIM/Server. Additional information is stored automatically when the document isplaced in storage, including file size, date and time of check-in, and name of the user who checkedin the document.
Through AIM/Manager, the user can create object-to-object associations to allow real-liferepresentation of document relationships. AIM/Manager allows document access with little or noknowledge of physical storage locations, hardware platforms, or database systems. To retrievea document, users can query the database by document name or any desired attribute.
To reduce the number of documents in a browse list, search filters can be specified. Filters caninclude the name of documents (including wild-card characters), descriptions, file type, check-in/check-out status (including documents checked out by a specific user), and other parameters.
As well as performing attribute searches, the user can search the contents of documents using atechnology called full-text retrieval (FTR). With this technology, the user simply specifies a wordor list of words that would be contained in the document and AIM/Manager will provide a list ofdocuments that contain that word. Intergraph's full-text retrieval engine, AIM/FTR, is required onthe server.
AIM/Manager increases the productivity of information by allowing simultaneous access ofdocuments by multiple users. However, access to information is controlled according to user-defined security rules. AIM/Manager allows only one user at a time to check out a document forediting and markup purposes, but multiple users may simultaneously copy documents for viewonly. AIM/Manager automatically copies and retrieves files attached to drawings - such asMicroStation reference files - when the drawings are checked out.
Workflow Capabilities
AIM/Manager provides the ability to transition documents, drawings, document groups, or foldersthrough user-defined workflows. With AIM/Workflow installed at the server, each document canbe assigned its own workflow and transitioned independently of associated files.
The system is rules-based and can easily be configured to require user signoff before adocument or drawing can be transitioned from its current state to the next state. AIM/Managermaintains a list of signoffs and a sign-off history for each document.
Scaleability
AIM/Manager provides a comprehensive system that can grow with customers' needs. It notonly provides an interface into Intergraph's document management system, but can be combinedwith other AIM products and third-party editing software to provide a wide variety of documentmanagement and manipulation functions. AIM/Manager openness allows it to incorporate existinghardware and software to meet the diverse needs of individual workgroups or entire enterprises.Yet AIM/Manager is flexible enough to fit the specific needs of each user.
6.2.2 Aspect
6.2.2.1 Explore (CLMS)
The RASSP Reuse Data Manager (RRDM) is used to catalog and search for reusable designobjects. Reusable design objects are also known as Reusable Elements (REs). Over onemillion design objects are currently managed in the RRDM. The RRDM is built on AspectDevelopment’s Explore (CLMS) family of commercial off-the-shelf (COTS) products. WithinRASSP, Explore (CLMS) has been integrated with Mentor Graphics’ Library ManagementSystem (LMS) and Intergraph’s Product Data Management (PDM) system.
Explore (CLMS) is primarily used in two phases:
• In early design, to look up and reuse fragments of existing designs, such as VHDL models.
• In detailed design, to choose the actual components that will be used within a design.
Explore (CLMS) supports RASSP-defined classification hierarchies of reusable elements thatresulted from RASSP-funded research.
Aspect’s CSM solution includes Explore (CLMS) client-server software which classifies,manages and cross-references all component, supplier and design data and automates theprocesses associated with this information, as well as the VIP Family of Component ReferenceDatabases containing up-to-date information on over one million standard electronic andmechanical parts from over 600 suppliers.
Explore’s (CLMS) 3rd generation object-relational architecture combines the flexibility of anobject-oriented application with the power and security of an underlying commercial relationaldatabase engine (Oracle). Explore’s (CLMS) flexible architecture allows customers to rapidlyconfigure the system to integrate and leverage both internal business and technical data cross-
referenced with manufacturer reference data. Explore (CLMS) provides desktop access to aunified repository of consistent and current preferred parts, supplier information, and design datato significantly reduce product costs and time-to-market. Aspect also provides a complete set oflegacy data migration and enterprise consulting services to accelerate the setup and deploymentof enterprise solutions.
Aspect Development’s Explore (CLMS) is used to:
• Hierarchically classify, categorize and retrieve part, supplier, and design information.
• Integrate and leverage internal business and technical legacy data in a unified repository cross-referenced with manufacturer reference data.
• Provides decision support to promote the reuse of existing internal preferred parts, suppliersand designs.
• Facilitate part and vendor volume consolidation, by identifying and eliminating duplicate andfunctionally equivalent parts.
• Identify single-sourced and multiple-sourced parts to drive supply chain management, strategicsourcing and commodity management.
• Automate and enforce the processes associated with requesting, approving, managing,obsoleting, sharing and reusing parts, suppliers and designs.
Classification of Parts, Suppliers and Reusable Designs
Explore (CLMS) makes searching for electrical and mechanical parts, suppliers, hardware andsoftware design elements, CAD libraries, datasheets and other related information easy throughthe use of a hierarchical classification methodology. Objects are organized in a class hierarchy ofclasses and subclasses presented as a series of hierarchical folders. All classes have searchparameters which define functional or business characteristics about the object. With Explore(CLMS) users can easily find and select parts, suppliers or designs by browsing the classhierarchy and entering search parameter values without knowing part numbers, commodity codes,coded text descriptions, spellings, and so on.
Aspect’s ‘Standard Classification Scheme’ (SCS) is a pre-defined classification scheme thatclassifies standard electrical, mechanical and electromechanical parts as well as material,subsystems and accessories into classes and subclasses for easy search and retrieval. Thestandard parameter dictionary defines for each class, naming conventions (e.g., Microprocessor),parameters (e.g., technology = CMOS, vendor = Siemens) and legal values (e.g., power = 1 to10 watts). Aspect’s VIP family of component reference databases uses SCS to classify overone million parts. Customers also use SCS as the organizational framework for managing internalstandard and custom parts with technical and business parameters and to cross-reference internalstandard parts to one or more commercially available manufacturer parts contained within the VIPfamily of component reference databases. The SCS is based on IEC, ISO, EIA, JEDEC andother standards.
Explore (CLMS) supports any number and levels of classes, subclasses and searchparameters. Customers can create new classes, subclasses and search parameters or modifythe classes, subclasses and search parameters provided with SCS. Classification is achievedvia an object-oriented model, while the information is stored in a commercial relational database(Oracle). Class and search parameter data modeling is accomplished dynamically through thegraphical user interface while the system is on-line and doesn’t require a database administrator orprogrammer with SQL or programming experience. Once the model is defined, Aspect’s SoftModel technology will automatically create the underlying relational tables and build theapplication on-the-fly without recompiling. No software programming is required.
Viewing the class hierarchy is achieved through the Class Browser. Explore (CLMS) supportsmultiple class browsing modes to provide an easy to use, intuitive interface for a range of usersfrom the infrequent user to the power user. In Hierarchical Class Browsing mode the ClassBrowser shows the class hierarchy as a series of nested folders. Folders can be expanded orcollapsed by simply pointing and clicking on the folder icons to navigate through the classhierarchy. In Power User Mode, users simply type in the class name or a fragment of the classname, instead of clicking through multiple folder levels, the class browser automatically jumps todisplay and highlight the typed-in class. In Flat Class Browsing mode, classes are organizedand displayed alphabetically, users can then scroll through the list or use the power user mode tojump directly to the desired class.
Explore (CLMS) provides a simple yet powerful parametric search engine. Simply select thedesired item class in the browser and press the quick search button to display a list of thoseitems. Furthermore, you can qualify the list of items retrieved by entering search parametervalues. The customer can search on parameters provided with SCS or on customer definetechnical and business parameters. Example search parameters include part number, genericpart number, manufacturer, supplier, description, technology, package style, cost, lead time,status and dozens of other technical and business search parameters and any combination of theabove. Search shortcuts include wildcards, ranges, logical and numerical operators, pick lists andunit-of-measure conversion. Explore’s (CLMS) object-oriented architecture supports fullparameter inheritance, search parameters declared at top-level classes are inherited down to thebottom-level leaf classes, allowing users to do parametric searches at any class level in the classhierarchy. Search results are viewed in horizontal or vertical tables as shown in Figure 6.2-1.
Display a list of all Metric Hex Head Bolts with a thread designation of M10, a nominal length between 50and 60 millimeters, a 1.5 millimeter thread pitch, and a 10 millimeter diameter.
Figure 6.2-1. Search results screen.
Third-Party Integrations
Explore (CLMS) is integrated to the following software:
• Future integrations are planned with leading ECAD, MCAD, PDM, and ERP/MRP tools.
6.2.3 Sandpiper Software, Inc.
6.2.3.1 RASSP Reuse Data Manager (RRDM)
The RASSP Reuse Data Manager (RRDM) consists of a client browser, a "perspectives"application server (including the search and vocabulary mapping engines), and multiple sourcedata repositories. A designer looking for reusable design knowledge browses the hierarchy andidentifies a potential source for designs of interest. Then, through a custom view of the commonvocabulary, the user may specify attributes of the candidate design(s) he or she is interested in.Queries may include arithmetic expressions, logical expressions, attributes of related classes,and constraints on any of the attributes, as appropriate. Mapping algorithms that account for avariety of data inconsistencies, differences in precision, translation of units of measure, and otherdistinctions among terms across repositories are resolved to the user's customized vocabularyand display requirements. The search of available (and optionally selected) source repositoriesis performed in parallel, with meta-data for all results displayed through the client browser.Depending on the number and nature of the results returned, he or she may further refine thesearch by specifying additional attributes and/or more restrictive criteria. Objects of interest maybe selected and the corresponding designs (e.g., schematics, drawings, models) displayed intheir native tool environments given that appropriate resources are available to the user.
The key capabilities are:
• Data Modeling
• Search and Retrieval
• Heterogeneous Integration
• Distributed, Object-Oriented Architecture
The underlying knowledge engine that manages the common vocabulary, maps that vocabularyto the various distributed sources of reusable engineering design data in the environment, andprovides a common user interface/single entry point from which users can search for, view andaccess candidate designs and related information is known as the Sandpiper Software IntelligentInformation Broker (IIB).
The environment in which the RRDM operates consists of the following components:
• One or more sites, where users and/or source databases, applications, file systems, or othersource information resides, connected by local and/or wide area networks.
• Multiple client systems and one or more back-end database servers which contain hardwareand software from a variety of vendors.
• Back-end databases of varying content, organizations (i.e., schemas) and underlying DBMSengines (relational, object-relational, object), related to one another in both tightly-coupled (i.e.,with similar schemas) and loosely-coupled (potentially having little or no similarity among them)federations.
End users include, among others, designers who interact with the system directly or throughintegrated applications such as product data management (PDM) systems, workflow managers,CAD tools, or other systems in their environment.
The intelligent information broker (IIB) provides the capability for users to search for and retrievedesign knowledge (or other related engineering and business information) stored in theirdistributed environment through the common vocabulary. This vocabulary is implemented as agroup of internal repositories of descriptive information that describe the terms defined for thedomain, the locations, and characteristics of source repositories, characteristics of the mappingfrom source repositories to the common vocabulary, user authentication information, and so forth.The IIB provides the capability to search stored meta-data for design knowledge, regardless ofwhether the objects themselves are managed by the broker or externally.
The information broker (shown as an "application server") acts as middleware, integrating endusers (or "clients") with the various sources of design knowledge in their virtual environment. IIBfunctionality has been partitioned between the application server, Java™ applets integrated withthe user's Web Browser, and the source database servers that comprise the cooperatingenvironment. Integration of external applications is enabled through Common Object RequestBroker Architecture (CORBA) application programming interfaces (APIs).
Figure 6.2-2 highlights the prototype IIB architecture as implemented in the RASSP environment.As mentioned above, users interact with the system either directly through a Java™-enabledweb browser or through other applications that have been integrated with the IIB throughCORBA-compliant APIs.
At the heart of the IIB is the Perspective Server, which provides the intelligent search andinformation brokering function in support of user requests. From these user requests, it generatesqueries to the associated source repositories. The Perspectives Server maps the user's queryfrom either the common vocabulary or a customized, user-specific vocabulary to the physicalback-end repository implementation notation (e.g., SQL, C++), returning the requested data to theuser in a user-specified format.
Figure 6.2-2. Sandpiper Software Intelligent Information Broker Context.
The IIB provides native support for sets of tightly-coupled back-end database servers. Thesetightly-coupled federations have similar schemas and may be mapped to one another and thecommon domain vocabulary through a single source vocabulary. For source repositories that aresufficiently dissimilar, separate (distinct) source vocabularies will be integrated with the IIB. Asingle federation of source repositories may be represented by multiple vocabularies, eachproviding different views (e.g., by a standard by taxonomy, function, by product) of theunderlying data. User selection between these views enables access to the data in a mannermost appropriate to the task at hand.
The Perspectives Server also describes the mapping between the user's preferred view and thecommon vocabulary for a domain. The user's custom view may include attributes from multipleclasses, constraints on display characteristics, such as preferred currency or units of measure,and so forth. These views are also encoded as ontologies based on Ontolingua and KIF.
Planned Enhancements
A number of additional capabilities are planned for the commercial product and subsequentreleases by Sandpiper Software, Inc. These include:
• Function-Based Search and Retrieval.
• Content-Based Search and Retrieval.
• Configuration Management for all ontology components and meta-data with optional releasemanagement for design knowledge.
• Fine-Grained Authorization Control.
• Enhanced User Authentication.
• Extensive User Customization Capabilities, including user and role-specific views of the virtualrepository as well as support for custom forms, templates, and reports.
• Standards-based application integration for third-party tools through CORBA-compliant APIs,including automated data synchronization where required.
• Multi-vendor DBMS support (relational, object-relational, and object databases).
• Intelligent agent integration for data mining and decision support, subscription, notification, andother extensions to the baseline technology.
6.2.4 TriTeal
6.2.4.1 TriTeal Enterprise Desktop (TED)
The TriTeal Enterprise Desktop (TED) is a graphical desktop environment that providesindependence from the underlying operating system and hardware. It provides a OSF/Motifcompliant window manager and libraries to enable the execution and development of OSF/Motifapplications. Common desktop activities have been encapsulated into an icon-based graphicalinterface that employs intuitive drag and drop techniques.
TED provides a tightly integrated suite of applications for common activities. TED provides acustomizable "front panel", a file manager, an application manager, a style manager, an e-mailinterface, a calendar manager, a WWW browser, FAX manager, and an extensive help system.All of these work together to provide a seamlessly integrated interface. The front panel is thelaunch point for most applications and many desktop controls. It is fully customizable to facilitateeasy access to most commonly used applications. The application manager allows access andcontrol of every application in one convenient location, including applications that reside on the
network. The file manager allows easy access and quick navigation of the filesystem. Files canbe associated with applications via several different paradigms so that access to a particular fileis as simple as double clicking. The calendar manager allows scheduling of group events andhas multiple notification methods. All of these applications, along with the WWW browser and faxmanager, are drag and drop compatible with each other which makes for a very intuitive interface.TED also includes an integrated virtual desktop environment that allows a user to have more thanone desktop environment sharing the save physical screen. This allows a user to tailor eachvirtual desktop to the specific needs of a particular application or activity. It reduces desktopclutter by hiding the windows and icons of other applications that are present on other virtualdesktops.
6.2.5 SCRA
6.2.5.1 Manufacturing Interface
The overall mission of the RASSP Manufacturing Interface is to enable first-pass manufacturingsuccess of application-specific signal processors. To achieve this goal, concurrent engineeringtechniques must be used between design and manufacturing to ensure that manufacturability isbuilt into designs from the beginning. This level of communication and cooperation can beachieved most effectively in the context of a “virtual enterprise”. The information sharinginfrastructure that forms the backbone of a virtual enterprise can only be achieved through thedevelopment, acceptance and adherence to information sharing standards such as VHDL, EDIF,and STEP.
The Manufacturing Interface being developed by the SCRA Team provides seamless integrationof design and manufacturing as well as supporting Integrated Product/Process Development(IPPD). By providing an IPPD capability, the Manufacturing Interface allows design prototypesto be produced more quickly. By using a standards based interface, the RASSP ManufacturingInterface supports virtual partnering between design and manufacturing organizations.
At the heart of the Manufacturing Interface is a novel concurrent engineering capability. Theprinciple focus of this capability is to enable an effective DFx capability by creating an IPPDenvironment. This Concurrent Engineering (CE) environment is distinguished from other CEenvironments in two respects. First, it utilizes a standards-based methodology to create theinformation sharing infrastructure necessary for IPPD. Second, it provides a unique, knowledge-centered approach to concurrent engineering. This is accomplished by integrating an inferenceengine into the standards-based information sharing environment. The result is an automatedconcurrent engineering capability. This capability allows engineers from different disciplines tocapture their experience in an executable form. This executable knowledge may then be used todetect potential producibility, testability, and other “ility” issues early in the product developmentprocess.
The Manufacturing Interface is composed of several distinct tools. The Manufacturing ResourceEditor (MRE) is used to capture the capabilities of a manufacturing facility in standard form. TheMentor-to-STEP Data Converter tool is used to convert Mentor design files into standard STEPfiles. The STEP product data is used by a Producibility Advisor in conjunction with manufacturingcapability information captured by the MRE to determine any issues against the design based onthe manufacturing production line chosen. The product data and manufacturing capabilities arealso used by the Process Planner to create a manufacturing process plan. Manufacturing anddesign issues are resolved via the Web-based Access Mechanism and collaboration tools. Asecure Internet connection will be used to transfer data between design sites and the Ocalamanufacturing site.
In Build 2, support for EDIF 4 0 0 is being added to the standards-based interface. Also, Mitron’sCIMBridge manufacturing support system is being integrated into the Manufacturing Interface,providing more robust DFx analysis capabilities and commercially supported Numeric Control(NC) program generators. The architecture of the Manufacturing Interface is shown inFigure 6.2-3.
Ultimately, the capabilities embodied in the Manufacturing Interface will enable concurrentengineering in the context of the electronic commerce paradigm. Figure 6.2-4 illustrates how thiswill be accomplished. The initial design customer contact with the manufacturer takes place via apublic World Wide Web (WWW) connection. If further contact is desired the customer registerswith the manufacturer and is given access to a secure WWW server. The customer may thentransfer design data via secure Internet to the manufacturing site and use a web browser to runthe design data against the manufacturer’s capabilities. Manufacturing issues and relative pricingare returned to the customer via the secure WWW connection. If additional manufacturingknowledge is required, the customer may request assistance from a manufacturing engineer.Additional iterations of this scenario may be required before a satisfactory design is obtained.When the design is complete, the customer contacts the manufacturing engineer for detailed costand scheduling information and data verification.
6.2.6 Insoft
6.2.6.1 Communiqué and Cooltalk
Collaboration is a term which is used to describe the interaction between participants in theRASSP design and development process. Specific tools are sought which improve the efficiencyand quality of information exchange between individuals, while at the same time providing acommunications platform used in conjunction with other on-going RASSP initiatives.
Two collaboration tools have been identified and implemented. These can be used with otherRASSP Enterprise capabilities, e.g., the Manufacturing Interface function. The collaboration toolsused, Communiqué and Cooltalk by Insoft, support a variety of exchange mechanisms. Included
are a series of “tools”. The tools are: Chat Tool, Audio Tool, Whiteboard Tool, TV Tool,Information Exchange Tool, and Image Tool. The only substantive difference betweenCommuniqué and Cooltalk is that Communiqué includes the TV Tool and Cooltalk does not. Inaddition, Communiqué is a standalone product whereas Cooltalk has been bundled with the newversion of the Netscape Navigator web browser. Any subset of these “tools” can be used in aspecific application. In some cases the tools employed may not include the complete suite due tonetwork firewall limitations. In particular, both the Audio and TV Tools are User Datagram Protocol(UDP) based, which are normally screened by corporate firewall implementations. The remainingtools are Transmission Control Protocol/Internet Protocol (TCP/IP) based and more likely to besupported. Nonetheless, any one of the aforementioned tools provides a significantenhancement of the information exchange capabilities between participants in the RASSPworkflow process. A brief description of these tools follows.
A Communiqué Conference is first established by one individual. Other individuals are in turninvited to join the conference. Some initial coordination must first be established to ensure thateach user has his or her Communiqué software executing, as this is a pre-requisite. Theconference initiator issues invitations to others who in turn accept these invitations. In thismanner the conference is established where any or all participants can then invoke specific tools.Each tool invoked is accessible or visible to each conference attendee. For example, if a chatsession is initiated, each participant has an opportunity to view the chat exchange and join in, ifdesired.
The chat tool generates a viewable window which displays typed text by each participant, witha user name preceding each entry. The audio tool provides the ability to conduct an audioteleconference and requires the use of microphones and speakers at each participatingworkstation. The whiteboard tool enables the use and display of a shared whiteboardapplication where each participant can generate graphic symbols, text, freehand sketchings, andimport graphics. This tool is extremely valuable when used in the context of evaluating detaileddesign material. The TV Tool is the video equivalent of the audio tool and requires that the
workstation(s) is equipped with a camera. Setup parameters can be adjusted to configure thedegree of audio/video synchronization. When this function is working properly overcommunications links possessing sufficient bandwidth it is as if the individuals are collaborating inphysical proximity. The information exchange tool allows users to exchange and view datacontained on floppy disks or CDs.
6.2.7 Netscape
6.2.7.1 Netscape Enterprise Server
Another network initiative being undertaken is the establishment of secure networkcommunications. It is the goal of RASSP Enterprise infrastructure to implement tools whichexpand other associated capabilities of RASSP without compromising data and by protectingprivacy of communications. This takes several forms. It includes the addition of a securecommunications layer on top of World Wide Web transactions. This function provides forencrypted client/server sessions. Thus, using the WWW HyperText Transfer Protocol (http) asa transfer medium, RASSP related information may be hosted on a secure server. By combiningwith already existing http authentication schemes, confidential design information can be madeavailable to selected users which is protected against unauthorized access.
The specific tool used to implement secure WWW sessions is Netscape’s Commerce/EnterpriseServer. This server uses Secure Sockets Layer (SSL) protocol to encrypt client/serversessions. It uses Public Key encryption technology. Encryption keys are exchanged by serverand client when a session is initiated. A one-time session key is also used to ensure uniquenessduring an individual session. The encryption session is performed transparently by client andserver with no overt action required by the user of the client browser. Thus, in order for thesessions to be “private”, authentication is built on top by means of tailored HypterText MarkupLanguage (HTML) coding. This involves the use of user names and passwords, whoseexchange is automatically encrypted.
6.2.8 Viacrypt
6.2.8.1 Pretty Good Privacy (PGP)
Another component of secure communications is the use of Pretty Good Privacy (PGP) email anddata encryption schemes. This function uses Public Key encryption technology along with asimple graphical user interface (GUI) to allow users to ensure that their messages can only beread by intended recipients. For data, it can be used to encrypt data files prior to their staging ona network server. This ensures that confidential data is protected from unauthorized access.
Note that PGP comes in two varieties: freeware version and commercial version. The freewareversion is available to individuals and the commercial version is for use by businesses. Theseversions are fully interoperable with one another.
6.2.9 Mentor
6.2.9.1 WorkExpert
The WorkXpert Tool Suite offers a complete work flow design environment for engineering designteams, and project managers.
FlowXpert™
• Manages process execution.
• Monitors and controls process dependencies.
• Provides point and click access to tools and utilities.
• Graphical views of your processes for easy understanding of project status, tracking of taskand data conditions, and highlighting potential process.
• Flexibility to execute processes without any constraints or controls. As the "end game"approaches, appropriate task and data dependencies can be applied.
• Productivity features such as a report builder, shared white board, and attachment ofannotations anywhere, anytime.
XpertBuilder™
• Efficiently captures your processes.
• Open architecture that supports any tool.
• Test mode for the easy debugging of your workflows.
• Translate documented processes into executable workflows to deploy best practicesthroughout an organization.
• Graphical drag-and-drop editing environment provides intuitive, easy-to-use features to captureworkflows.
• Cut and paste to reuse flow templates across multiple projects.
• Create hierarchical process flows with unlimited nesting of task and subflow hierarchy.
• Graphical interface provides easy access to complex task and data dependencies, easing theproblems of process development.
• Create custom or company-specific look-and-feel standards for processes.
ProjectXpert™
• Track key project deliverables.
• Whole project status at a glance.
• Automatic capture of process metrics.
• Import/export of project schedules.
Managing Your Work Process
The growing complexity of the design process increases the need for better processmanagement. As the number of design tasks and the relationships between them increases,more and more time is required to move the design through the process. A way to quickly identifythe appropriate tools, data, and people for any given phase of the work becomes critical. TheWorkXpert family of products allow engineers, designers, project and program managers to meetthe latest design challenge in a fast-paced market. The WorkXpert family of products from MentorGraphics offers the ability to capture, manage, and track best design processes.
ProSim is a process modeling product that enable users to capture, document, and analyzeprocesses. Because both ProSim and ProCap are based on IDEF3, a government-endorsed,standard process modeling method, you can be sure that the process models you create will meetthe documentation guidelines required by such programs as ISO 9000 and TQM.
ProSim adds the ability to record simulation goals, process time, resource utilization, costing, laborrequirements, and setup time in a simulation model that’s read by WITNESS, AT&T ISTEL’ssimulation engine, for automatic simulation generation. ProSim validates models with options thatare customized by the user. Errors are reported by the system allowing users to edit processes,re-allocate resources, and update decision logic before simulation is run.
ProSim has three windows in which models may be developed, edited, and analyzed. TheMatrix Window is a spreadsheet-like interface that allows the user to quickly define the interactionbetween processes and objects. Details on different objects are easily captured and seamlesslyincorporated into your simulation models. The Indented Nodelist is an expandable outline formatthat displays the hierarchical arrangement of higher-level and lower-level processes. This greatlysimplifies both model construction and documentation, since you may view your model at varyinglevels of detail and complexity. The Diagram Window is a graphical representation of processes,their sequences, and their associated decision points.
Object State Transition Networks (OSTNs) can be constructed in the Object Window. Thiswindow illustrates an object and how it changes over its lifetime, and allows users to easilydocument the processes which trigger those changes. The powerful combination of process andobject views, plus the ability to generate validated simulation models, gives you significantleverage in your knowledge capture, documentation, quality certification, and reengineering efforts.
ProSim version 2.1.5 was released May 1, 1996, and features:
• File Attachment Feature: attach files--such as documents, sound clips, or videos--to processes,junctions, objects, object states, project summaries, and diagrams.
• Export Capabilities: when exporting ProSim files, attachments to project elements will also beexported, allowing users with identical drive mappings to run the attached files.
• Time Saving Features: auto-routing/auto-placement for rapid model construction; multi-selectionfor streamlining and simplifying the modeling process; color coding in the Process/Object MatrixWindow for simple identification of objects and processes; filters for rapid identification of usedand unused elements in the project; specialized printing features; an upgraded toolbar; andautomatic element resizing in the Diagram and OSTN Windows.
Use ProSim to:
• Capture not only processes, but the decision and timing logic involved in performing each ofyour company’s processes.
• Create As-Is models for analysis of current processes, checking for areas of redundancy andopportunities for improvement.
• Create To-Be process models, based on your analysis.
• Automatically generate AT&T ISTEL WITNESS simulation code with your ProSim simulationmodels.
• Change your To-Be models, after running simulation in WITNESS and analyzing the results,before implementing change.
6.2.11 AT&T
6.2.11.1 WITNESS
WITNESS is a process simulation tool used to assist in the evaluation of alternatives, either insupport of major strategic initiatives or continuous improvement. A WITNESS model is a visualcomputer representation of a real life system. The model representation turns raw data intoproductive measures to support decision making. WITNESS provides the user with a broadscope of information on which to base decisions, predict outcomes, improve processes, analyzeproblems, and formulate solutions. It provides immediate feedback to various what-if scenarios,thereby shortening overall project time. Key WITNESS features are:
• Easy to use graphical interface.
• Ability to create sub-models.
• Supports physical, logical, and graphical model elements.
• Supports machine breakdowns and setups, labor, shifts, vehicles, and continuous processes.
• Supports file input/output, reports, plotting, and statistical analysis.
• Ability to create and conduct experiments.
6.2.12 Microsoft
6.2.12.1 MS Project
MS Project is a project planning and scheduling tool. It enables users to create a project workbreakdown structure (WBS) for the project tasks. Create project schedules by assigningtimelines to the tasks, typically, in the form of a Gantt chart. The task constraints can beincorporated to model task dependencies. The tool also allows assignment of resources to thetasks. A project manager can use this tool to create a project plan, create a schedule, and trackproject progress.
RDD-100 Ascent Logic Front end design tool that aids the process ofanalyzing requirements, system definition,functional analysis and describing systembehavior
RAM/ILS MSI Reliability, availability, and maintainabilityanalysis tool for lifecycle support
PRICE Lockheed Martin Parametric cost models for SW and HWdevelopment programs
MATLAB Mathworks Algorithm development and numerical analysis tool
SPW ALTA Signal processing algorithm behavioral simulatorBONeS Architectural simulation, trade-off analysis,
performance verification and evaluations, andresource modeling tool
Tech. Pub.Software
Interleaf Document generation and publishing tool forcreating text and graphics
Explore (CLMS) Aspect RASSP design component info system
Hardware/Software Co-Design
Tool Name Supplier DescriptionRTM Marconi Systems Lifecycle requirements traceability, impact
RAM/ILS MSI Reliability, availability, and maintainabilityanalysis tool for lifecycle support
SavanSys Savantage Trade-off analysis tool for packaging andinterconnection of high performance electronicsystems
NetSyn JRS Partitioning and scheduling tool for networksynthesis and integration of all architecture tools
PTOLEMY BDTI Supports multi-domain analysis of complexsystems
PRICE Lockheed Martin Parametric cost models for SW and HWdevelopment programs
GEDAE™ Lockheed MartinATL
Testbed environment for application development
AIB Application Interface BuilderMATLAB MathworksQuickVHDL Mentor Graphics VHDL simulatorEDAnavigator Harris EDA Trade-off analysis tools for packaging and
partitioning of high performance electronic systemsSPEAR AT&T Parallel processor debugger & autocode generatorPIE U. of Oregon Software performance analyzerSPW ALTA Signal processing algorithm behavioral simulator
Tool Name Supplier DescriptionBEACON Applied Dynamics
InternationalUsed to generate code for the command program,test vectors for unit tests as well as productdocumentation
SimMatrix Precedence Integration environment which allows multiplesimulation engines to run concurrently
Autocode Toolset MCCI Autocode generation and runtime system for graphexecution control
RDD-100 Ascent Logic Front end design tool that aids the process ofanalyzing requirements, system definition,functional analysis and describing systembehavior
COSMOS PMW Omniview/Honeywell
Performance Modeling Workbench (PMW) createsalternative hardware/software architectures andsimulates them to validate system performance
Object GEODE VERILOG Enables the generation, verification, and validationof target code for the command program
Hardware Design
Tool Name Supplier DescriptionFALCON Mentor Graphics Framework for Mentor and selected third-party
tools; includes Design Manager, BOLD Browser,Common User Interface, Decision SupportSystem, AMPLE, Notepad, Design ViewpointEditor, Design Dataport, Parts Reporter, FALCONlibraries, Quickparts Timing Editor, Sim View,EDDM to VHDL netlister ... and others
Design Architect Design capture environment for architectural, logic,and/or circuit levels
LibraryManager/LibraryUser (LMS)
Component Library manager for parts librariansand users that supports a structure for controllingthe development, maintenance, and use of models
PLD Synthesis II Optimization and synthesis tool for designingFPGAs, CPLDs, and PLDs
QuickPath Interactive static critical timing path analyzerQuickVHDL Direct-Compiled code interactive VHDL simulatorBoard Designer Place and route of PCBs, interface to
manufacturing toolsMCM Station/QuadTools
Supports multichip module design with integratedhigh-speed layout tools and advanced packagingtechniques and crosstalk analysis
AutoTherm Thermal analysis toolSimMatrix Precedence Integration environment which allows multiple
simulation engines to run concurrentlyTDS Summit Tools for simulator data translation to module
tester format and tester program generationVisual HDL VHDL entry via graphical meansIDEA-S SDRC Mechanical 3-D solid modeling and finite element
analysisRDD-100 Ascent Logic Front end design tool that aids the process of
analyzing requirements, system definition,functional analysis and describing systembehavior
Tool Name Supplier DescriptionVHDL Compiler Synopsys VHDL source compilationDesign Compiler Logic synthesisDesign Ware The Design Ware family of products includes tools
for a design reuse strategy which is highlyintegrated with the Synopsys synthesisenvironment
Group (LMG)Standard component behavioral models from SSIto VLSI complexity
SourceModels Complete VHDL libraries of SSI, MSI, andmemory components, including VHDL Test Benchwith each model
Hardware Models Models for LMC's LM family of hardware modelersSystem RealizerFamily
Quickturn Quickturn's hardware emulation system providesASIC “Computer Aided Prototyping" by readingany design netlist, automatically partitioning,placing and routing an array of FPGAs free of anytiming violation
VICTORY Teradyne Fully automates test generation for boundary-scan devices in boards or modules using full orpartial scan technology
VHDLCover VEDA DesignAutomation, Inc.
Analyzes VHDL code; can be used for test vectorcoverage analysis
FPGA Foundry NeoCAD A device-independent toolset for theimplementation of Field Programmable Gate Arrays(FPGAs)
SavanSys Savantage Trade-off analysis tool for packaging andinterconnection of high performance electronicsystems
Design-For-Test
Tool Name Supplier DescriptionTDS Summit Tools for simulator data translation to module
tester format and tester program generationTest Compiler Synopsys Combines test synthesis, ATPG, fault simulation,
and test management to automate DFTVICTORY Teradyne Fully automates test generation for boundary-
scan devices in boards or modules using full orpartial scan technology
LASAR LASAR will be used in conjunction with other toolsto aid in developing appropriate test vectors forfunctional, toggle and fault tests. Its min-maxsimulation capability will minimize the amount oftime spent debugging test programs on testers orin target systems
TSTB WAVEs Rome Laboratory Automates the generation of a complete VHDL-WAVEs Testbench for VHDL designs using theWAVEs standard
WSTA Naval UnderseaWarfare Center
Comprehensive engineering design andmaintenance support for improving effectivenessand testability of new and existing designs
Tool Name Supplier DescriptionVTM:TOP Mentor Graphics Enables design and test engineers to take
maximum advantage of the observability andcontrollability provided by boundary-scandevices on electronic assemblies that have a mixof boundary-scan and conventional technologies
PTM:SITE Inserts test points on MCM Station using resultsfrom VICTORY
FASTSCAN Inserts scan chains at the IC level and generatestest vectors
QuickGrade Fault gradingASSET DiagnosticSystem
ASSET, Inc. Supports the interactive debug and test of IEEE1149.1-component designs
ASIC Test ToolSuite
LV Software Provides a complete test strategy for complexstructured custom ASICs
STAT Detex Systems Function Dependency Modeling software whichallows automatic development of consistent andcorrect diagnostic information
Test StrategyDiagram
Lockheed MartinATL
Graphical construct which describes how flawsand faults are handled by a set of assignedmeans
SCANease NationalSemiconductor
Alternative to ASSET Diagnostic System Tools
STARS MSI Systems STARS generates a model base for a systemwhich provides diagnostic analysis capability andrepair recommendations
Economic ModelingTools
Test EconomicServices
Presents a comparison of board/ASIC costsbased upon entry of board/ASIC/design detailswith special emphasis on ATE and BScan DFT
ZYCAD Hardware accelerated fault simulator with interfaceto QuickSim II simulator
Enterprise System
Tool Name Supplier DescriptionAIM Intergraph Product Data ManagerDMM Design Methodology ManagerMS Project Microsoft Project planning and scheduling toolNetscapeEnterprise Server
Netscape Provides secure communication and browsingcapabilities over the Internet
PGP Viacrypt Allows users to ensure that their messages areread only by intended recipients by using publickey encryption
Work Expert Mentor Graphics Used to execute workflows to automate tasksCommuniqué andCooltalk
Insoft Supports a wide variety of information exchangemechanisms to support collaborative work
Explore (CLMS) Aspect RASSP design component info systemManufacturingInterface (MI)
SCRA A standards based capability to perform design-for-manufacturing analysis and perform datatranslations between design and manufacturingtools
ProSim KBSI Process modeling product that enable users tocapture, document, and analyze processes