Table of Contents UNITED STATES SECURITIES AND EXCHANGE COMMISSION Washington, D.C. 20549 FORM 10-Q ☒ QUARTERLY REPORT PURSUANT TO SECTION 13 OR 15(d) OF THE SECURITIES EXCHANGE ACT OF 1934 For the quarterly period ended November 30, 2016 or ☐ TRANSITION REPORT PURSUANT TO SECTION 13 OR 15(d) OF THE SECURITIES EXCHANGE ACT OF 1934 For the transition period from to Commission File Number: 001-35992 Oracle Corporation (Exact name of registrant as specified in its charter) Delaware 54-2185193 (State or other jurisdiction of incorporation or organization) (I.R.S. Employer Identification No.) 500 Oracle Parkway Redwood City, California 94065 (Address of principal executive offices) (Zip Code) (650) 506-7000 (Registrant’s telephone number, including area code) Indicate by check mark whether the registrant (1) has filed all reports required to be filed by Section 13 or 15(d) of the Securities Exchange Act of 1934 during the preceding 12 months (or for such shorter period that the registrant was required to file such reports), and (2) has been subject to such filing requirements for the past 90 days. Yes ☒ No ☐ Indicate by check mark whether the registrant has submitted electronically and posted on its corporate Web site, if any, every Interactive Data File required to be submitted and posted pursuant to Rule 405 of Regulation S-T (§232.405 of this chapter) during the preceding 12 months (or for such shorter period that the registrant was required to submit and post such files). Yes ☒ No ☐ Indicate by check mark whether the registrant is a large accelerated filer, an accelerated filer, a non-accelerated filer, or a smaller reporting company. See the definitions of “large accelerated filer,” “accelerated filer” and “smaller reporting company” in Rule 12b-2 of the Exchange Act. Large accelerated filer ☒ Accelerated filer ☐ Non-accelerated filer ☐ Smaller reporting company ☐ (Do not check if a smaller reporting company) Indicate by check mark whether the registrant is a shell company (as defined in Rule 12b-2 of the Exchange Act). Yes ☐ No ☒ The number of shares of registrant’s common stock outstanding as of December 12, 2016 was: 4,102,353,000.
Transcript
Table of Contents
UNITED STATES
SECURITIES AND EXCHANGE COMMISSIONWashington, D.C. 20549
FORM 10-Q
☒
QUARTERLY REPORT PURSUANT TO SECTION 13 OR 15(d) OF THE SECURITIESEXCHANGE ACT OF 1934
For the quarterly period ended November 30, 2016
or
☐
TRANSITION REPORT PURSUANT TO SECTION 13 OR 15(d) OF THE SECURITIESEXCHANGE ACT OF 1934
For the transition period from to
Commission File Number: 001-35992
Oracle Corporation(Exact name of registrant as specified in its charter)
Delaware 54-2185193(State or other jurisdiction of
incorporation or organization) (I.R.S. Employer
Identification No.)
500 Oracle ParkwayRedwood City, California 94065
(Address of principal executive offices) (Zip Code)
(650) 506-7000(Registrant’s telephone number, including area code)
Indicate by check mark whether the registrant (1) has filed all reports required to be filed by Section 13 or 15(d) of the Securities Exchange Act of 1934 during thepreceding 12 months (or for such shorter period that the registrant was required to file such reports), and (2) has been subject to such filing requirements for thepast 90 days. Yes ☒ No ☐
Indicate by check mark whether the registrant has submitted electronically and posted on its corporate Web site, if any, every Interactive Data File required to besubmitted and posted pursuant to Rule 405 of Regulation S-T (§232.405 of this chapter) during the preceding 12 months (or for such shorter period that theregistrant was required to submit and post such files). Yes ☒ No ☐
Indicate by check mark whether the registrant is a large accelerated filer, an accelerated filer, a non-accelerated filer, or a smaller reporting company. See thedefinitions of “large accelerated filer,” “accelerated filer” and “smaller reporting company” in Rule 12b-2 of the Exchange Act.
Large accelerated filer ☒ Accelerated filer ☐
Non-accelerated filer ☐ Smaller reporting company ☐(Do not check if a smaller reporting company)
Indicate by check mark whether the registrant is a shell company (as defined in Rule 12b-2 of the Exchange Act). Yes ☐ No ☒
The number of shares of registrant’s common stock outstanding as of December 12, 2016 was: 4,102,353,000.
Table of Contents
ORACLE CORPORATIONFORM 10-Q QUARTERLY REPORT
TABLE OF CONTENTS Page PART I. FINANCIAL INFORMATION
Item 1. Financial Statements (Unaudited) 3
Condensed Consolidated Balance Sheets as of November 30, 2016 and May 31, 2016 3
Condensed Consolidated Statements of Operations for the Three and Six Months Ended November 30, 2016 and 2015 4
Condensed Consolidated Statements of Comprehensive Income for the Three and Six Months Ended November 30, 2016 and 2015 5
Condensed Consolidated Statements of Cash Flows for the Six Months Ended November 30, 2016 and 2015 6
Notes to Condensed Consolidated Financial Statements 7
Item 2. Management’s Discussion and Analysis of Financial Condition and Results of Operations 27
Item 3. Quantitative and Qualitative Disclosures About Market Risk 50
Item 4. Controls and Procedures 50
PART II. OTHER INFORMATION
Item 1. Legal Proceedings 51
Item 1A. Risk Factors 51
Item 2. Unregistered Sales of Equity Securities and Use of Proceeds 51
Item 6. Exhibits 52
Signatures 53
Table of Contents
Cautionary Note on Forward-Looking Statements
For purposes of this Quarterly Report, the terms “Oracle,” “we,” “us” and “our” refer to Oracle Corporation and its consolidated subsidiaries. This Quarterly Reporton Form 10-Q contains statements that are not historical in nature, are predictive in nature, or that depend upon or refer to future events or conditions or otherwisecontain forward-looking statements within the meaning of Section 21 of the Securities Exchange Act of 1934, as amended, and the Private Securities LitigationReform Act of 1995. These include, among other things, statements regarding:
• our expectation that we will continue to acquire companies, products, services and technologies to further our corporate strategy;
• our belief that our acquisitions should allow us to grow and continue to make investments in research and development;
• our expectation that the total revenues of our cloud and on-premise software business on a constant currency basis generally will continue to increase due
to demand for our on-premise software products and software license updates and product support offerings, expected growth from our cloud software asa service (SaaS), platform as a service (PaaS) and infrastructure as a service (IaaS) offerings, and contributions from acquisitions;
• our belief that the introduction of additional Oracle Cloud IaaS offerings will complement our cloud SaaS and PaaS offerings and allow us to offer
customers additional opportunities to access Oracle technologies through the Oracle Cloud;
• our expectation that we will continue to place significant strategic emphasis on growing our SaaS, PaaS and IaaS offerings, which will affect the growth
of our cloud SaaS, PaaS and IaaS revenues and our new software license revenues and the related expenses;
• our intention that we will renew our cloud SaaS, PaaS and IaaS contracts when they are eligible for renewal;
• our belief that software license updates and product support revenues and margins will grow;
• our expectation that our hardware business will have lower operating margins as a percentage of revenues than our cloud and on-premise software
business;
• our expectation that we will continue to make significant investments in research and development and related product opportunities, including those
related to hardware products and services, and our belief that research and development efforts are essential to maintaining our competitive position;
• our international operations providing a significant portion of our total revenues and expenses;
• the sufficiency of our sources of funding for working capital, capital expenditures, contractual obligations, acquisitions, dividends, stock repurchases, debt
repayments and other matters;
• our belief that we have adequately provided under U.S. generally accepted accounting principles for outcomes related to our tax audits and that the final
outcome of our tax related examinations, agreements or judicial proceedings will not have a material effect on our results of operations, and our belief thatour net deferred tax assets will be realized in the foreseeable future;
• our belief that the outcome of certain legal proceedings and claims to which we are a party will not, individually or in the aggregate, result in losses that
are materially in excess of amounts already recognized, if any;
• the possibility that certain legal proceedings to which we are a party could have a material impact to our future cash flows and results of operations;
1
Table of Contents
• our expectations regarding the timing and amount of expenses relating to the Fiscal 2017 Oracle Restructuring Plan and the improved efficiencies in our
operations that such plan will create;
• the timing and amount of our stock repurchases;
• our expectations regarding the impact of recent accounting pronouncements on our consolidated financial statements;
• our expectation that to the extent customers renew support contracts or cloud SaaS, PaaS and IaaS contracts from companies that we have acquired, we
will recognize revenues for the full contracts’ values over the respective renewal periods;
• our ability to predict quarterly hardware revenues;
• the timing of customer orders and delays in our ability to manufacture or deliver a few large transactions substantially affecting the amount of hardware
products revenues, expenses and operating margins that we will report;
as well as other statements regarding our future operations, financial condition and prospects, and business strategies. Forward-looking statements may be precededby, followed by or include the words “expects,” “anticipates,” “intends,” “plans,” “believes,” “seeks,” “strives,” “estimates,” “will,” “should,” “is designed to” andsimilar expressions. We claim the protection of the safe harbor for forward-looking statements contained in the Private Securities Litigation Reform Act of 1995 forall forward-looking statements. We have based these forward-looking statements on our current expectations and projections about future events. These forward-looking statements are subject to risks, uncertainties and assumptions about our business that could affect our future results and could cause those results or otheroutcomes to differ materially from those expressed or implied in the forward-looking statements. Factors that might cause or contribute to such differences include,but are not limited to, those discussed in “Risk Factors” included in documents we file from time to time with the U.S. Securities and Exchange Commission (theSEC), including our Annual Report on Form 10-K for our fiscal year ended May 31, 2016 and our other Quarterly Reports on Form 10-Q to be filed by us in ourfiscal year 2017, which runs from June 1, 2016 to May 31, 2017.
We have no obligation to publicly update or revise any forward-looking statements, whether as a result of new information, future events or risks, except to theextent required by applicable securities laws. If we do update one or more forward-looking statements, no inference should be drawn that we will make additionalupdates with respect to those or other forward-looking statements. New information, future events or risks could cause the forward-looking events we discuss inthis Quarterly Report not to occur. You should not place undue reliance on these forward-looking statements, which reflect our expectations only as of the date ofthis Quarterly Report.
As of November 30, 2016 and May 31, 2016(Unaudited)
(in millions, except per share data) November 30, 2016
May 31, 2016
ASSETS Current assets:
Cash and cash equivalents $ 18,592 $ 20,152 Marketable securities 39,614 35,973 Trade receivables, net of allowances for doubtful accounts of $317 and $327 as of November 30, 2016 and
May 31, 2016, respectively 3,690 5,385 Inventories 327 212 Prepaid expenses and other current assets 2,511 2,591
Total current assets 64,734 64,313
Non-current assets: Property, plant and equipment, net 4,882 4,000 Intangible assets, net 7,968 4,943 Goodwill, net 42,083 34,590 Deferred tax assets 895 1,291 Other assets 3,038 3,043
Total non-current assets 58,866 47,867
Total assets $ 123,600 $ 112,180
LIABILITIES AND EQUITY Current liabilities:
Notes payable and other borrowings, current $ 3,838 $ 3,750 Accounts payable 615 504 Accrued compensation and related benefits 1,486 1,966 Deferred revenues 7,411 7,655 Other current liabilities 2,997 3,333
Total current liabilities 16,347 17,208
Non-current liabilities: Notes payable and other borrowings, non-current 50,489 40,105 Income taxes payable 5,099 4,908 Other non-current liabilities 2,820 2,169
Total non-current liabilities 58,408 47,182
Commitments and contingencies Oracle Corporation stockholders’ equity:
Preferred stock, $0.01 par value—authorized: 1.0 shares; outstanding: none — — Common stock, $0.01 par value and additional paid in capital—authorized: 11,000 shares; outstanding: 4,103
shares and 4,131 shares as of November 30, 2016 and May 31, 2016, respectively 25,159 24,217 Retained earnings 24,375 23,888 Accumulated other comprehensive loss (1,072) (816)
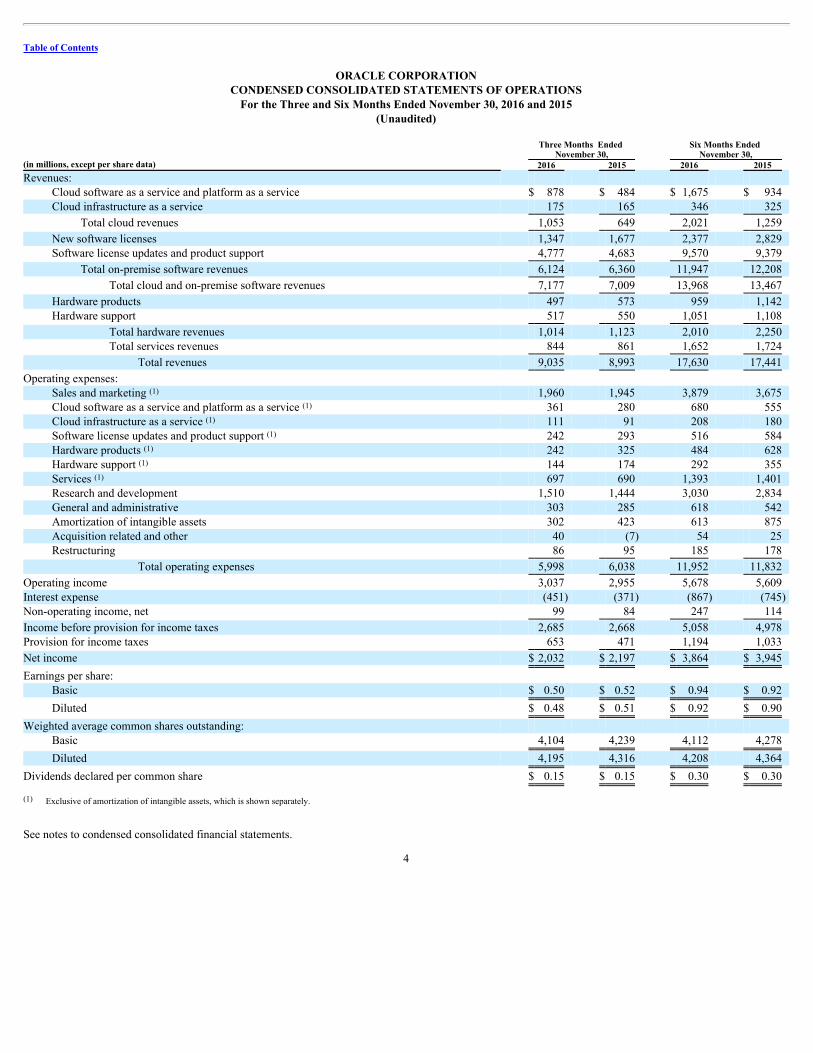
Total hardware revenues 1,014 1,123 2,010 2,250 Total services revenues 844 861 1,652 1,724
Total revenues 9,035 8,993 17,630 17,441
Operating expenses: Sales and marketing 1,960 1,945 3,879 3,675 Cloud software as a service and platform as a service 361 280 680 555 Cloud infrastructure as a service 111 91 208 180 Software license updates and product support 242 293 516 584 Hardware products 242 325 484 628 Hardware support 144 174 292 355 Services 697 690 1,393 1,401 Research and development 1,510 1,444 3,030 2,834 General and administrative 303 285 618 542 Amortization of intangible assets 302 423 613 875 Acquisition related and other 40 (7) 54 25 Restructuring 86 95 185 178
Total operating expenses 5,998 6,038 11,952 11,832
Operating income 3,037 2,955 5,678 5,609 Interest expense (451) (371) (867) (745) Non-operating income, net 99 84 247 114
Income before provision for income taxes 2,685 2,668 5,058 4,978 Provision for income taxes 653 471 1,194 1,033
Weighted average common shares outstanding: Basic 4,104 4,239 4,112 4,278
Diluted 4,195 4,316 4,208 4,364
Dividends declared per common share $ 0.15 $ 0.15 $ 0.30 $ 0.30
Exclusive of amortization of intangible assets, which is shown separately.
See notes to condensed consolidated financial statements.
4
(1)
(1)
(1)
(1)
(1)
(1)
(1)
(1)
Table of Contents
ORACLE CORPORATIONCONDENSED CONSOLIDATED STATEMENTS OF COMPREHENSIVE INCOME
For the Three and Six Months Ended November 30, 2016 and 2015(Unaudited)
Three Months Ended
November 30, Six Months Ended
November 30, (in millions) 2016 2015 2016 2015 Net income $ 2,032 $ 2,197 $ 3,864 $ 3,945 Other comprehensive loss, net of tax:
Net foreign currency translation losses (204) (132) (71) (133) Net unrealized gains on defined benefit plans 2 7 7 20 Net unrealized (losses) gains on marketable securities (356) 10 (213) (116) Net unrealized gains (losses) on cash flow hedges 19 15 21 (14)
Total other comprehensive loss, net (539) (100) (256) (243)
Comprehensive income $ 1,493 $ 2,097 $ 3,608 $ 3,702
See notes to condensed consolidated financial statements.
5
Table of Contents
ORACLE CORPORATIONCONDENSED CONSOLIDATED STATEMENTS OF CASH FLOWS
For the Six Months Ended November 30, 2016 and 2015(Unaudited)
Six Months Ended
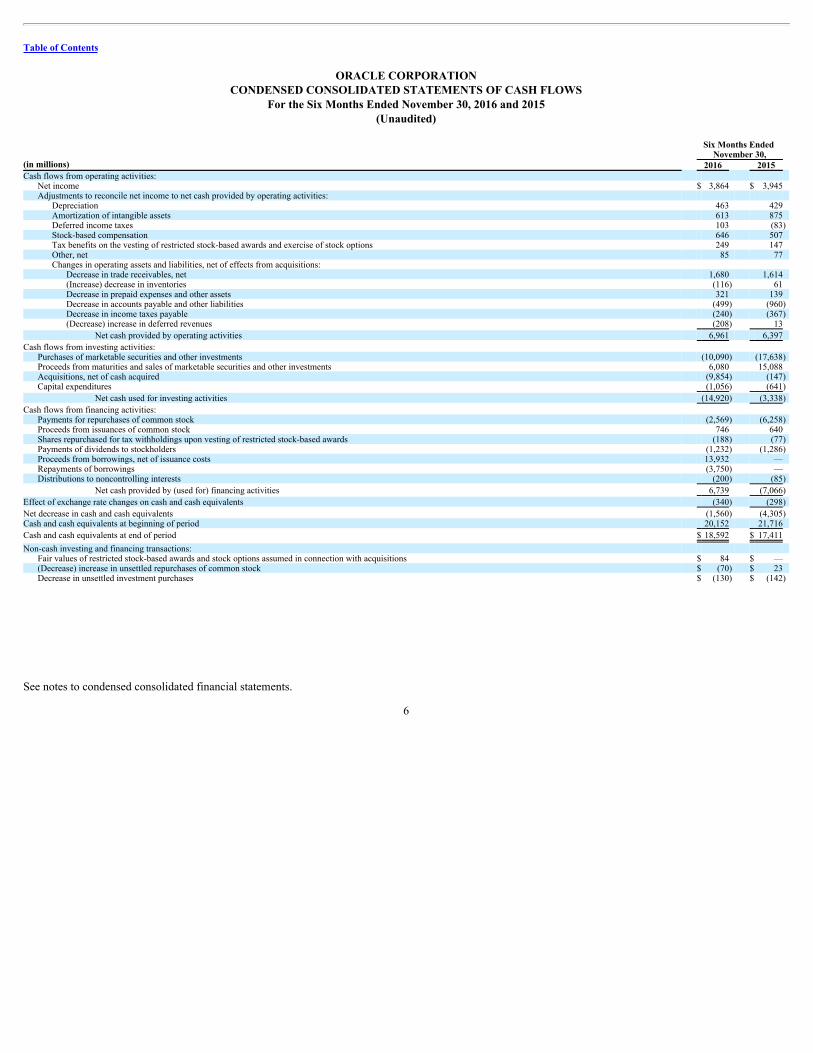
November 30, (in millions) 2016 2015 Cash flows from operating activities:
Net income $ 3,864 $ 3,945 Adjustments to reconcile net income to net cash provided by operating activities:
Depreciation 463 429 Amortization of intangible assets 613 875 Deferred income taxes 103 (83) Stock-based compensation 646 507 Tax benefits on the vesting of restricted stock-based awards and exercise of stock options 249 147 Other, net 85 77 Changes in operating assets and liabilities, net of effects from acquisitions:
Decrease in trade receivables, net 1,680 1,614 (Increase) decrease in inventories (116) 61 Decrease in prepaid expenses and other assets 321 139 Decrease in accounts payable and other liabilities (499) (960) Decrease in income taxes payable (240) (367) (Decrease) increase in deferred revenues (208) 13
Net cash provided by operating activities 6,961 6,397
Cash flows from investing activities: Purchases of marketable securities and other investments (10,090) (17,638) Proceeds from maturities and sales of marketable securities and other investments 6,080 15,088 Acquisitions, net of cash acquired (9,854) (147) Capital expenditures (1,056) (641)
Net cash used for investing activities (14,920) (3,338)
Cash flows from financing activities: Payments for repurchases of common stock (2,569) (6,258) Proceeds from issuances of common stock 746 640 Shares repurchased for tax withholdings upon vesting of restricted stock-based awards (188) (77) Payments of dividends to stockholders (1,232) (1,286) Proceeds from borrowings, net of issuance costs 13,932 — Repayments of borrowings (3,750) — Distributions to noncontrolling interests (200) (85)
Net cash provided by (used for) financing activities 6,739 (7,066)
Effect of exchange rate changes on cash and cash equivalents (340) (298)
Net decrease in cash and cash equivalents (1,560) (4,305) Cash and cash equivalents at beginning of period 20,152 21,716
Cash and cash equivalents at end of period $ 18,592 $ 17,411
Non-cash investing and financing transactions: Fair values of restricted stock-based awards and stock options assumed in connection with acquisitions $ 84 $ — (Decrease) increase in unsettled repurchases of common stock $ (70) $ 23 Decrease in unsettled investment purchases $ (130) $ (142)
See notes to condensed consolidated financial statements.
6
Table of Contents
ORACLE CORPORATIONNOTES TO CONDENSED CONSOLIDATED FINANCIAL STATEMENTS
November 30, 2016(Unaudited)
1. BASIS OF PRESENTATION AND RECENT ACCOUNTING PRONOUNCEMENTS
Basis of Presentation
We have prepared the condensed consolidated financial statements included herein pursuant to the rules and regulations of the U.S. Securities and ExchangeCommission (SEC). Certain information and footnote disclosures normally included in financial statements prepared in accordance with U.S. generally acceptedaccounting principles (GAAP) have been condensed or omitted pursuant to such rules and regulations. However, we believe that the disclosures herein are adequateto ensure the information presented is not misleading. These unaudited condensed consolidated financial statements should be read in conjunction with the auditedfinancial statements and the notes thereto included in our Annual Report on Form 10-K for the fiscal year ended May 31, 2016.
We believe that all necessary adjustments, which consisted only of normal recurring items, have been included in the accompanying financial statements to presentfairly the results of the interim periods. The results of operations for the interim periods presented are not necessarily indicative of the operating results to beexpected for any subsequent interim period or for our fiscal year ending May 31, 2017. Certain prior year balances have been reclassified to conform to the currentyear presentation. Such reclassifications did not affect total revenues, operating income or net income.
During the first half of fiscal 2017, we adopted Accounting Standards Update (ASU) 2016-09, Compensation—StockCompensation(Topic718):ImprovementstoEmployeeShare-BasedPaymentAccounting(ASU 2016-09). As required by ASU 2016-09, excess tax benefits recognized on stock-based compensation expenseare reflected in the condensed consolidated statements of operations as a component of the provision for income taxes on a prospective basis. As required by ASU2016-09, excess tax benefits recognized on stock-based compensation expense are classified as an operating activity in our condensed consolidated statements ofcash flows and we have applied this provision on a retrospective basis. For the six months ended November 30, 2015, net cash provided by operating activitiesincreased by $40 million with a corresponding offset to net cash used for financing activities. Finally, ASU 2016-09 allows for the option to account for forfeituresas they occur, rather than estimating expected forfeitures over the course of a vesting period. We have elected to account for forfeitures as they occur and the netcumulative effect of this change was recognized as a $9 million increase to additional paid in capital, a $3 million increase to deferred tax assets and a $6 millionreduction to retained earnings as of June 1, 2016.
In addition, in fiscal 2017, we also adopted ASU 2016-17, Consolidation(Topic810):InterestsHeldthroughRelatedPartiesThatAreunderCommonControlwhich did not result in a material impact to our reported financial position or results of operations and cash flows.
There have been no other significant changes in our reported financial position or results of operations and cash flows as a result of our adoption of new accountingpronouncements or changes to our significant accounting policies that were disclosed in our Annual Report on Form 10-K for the fiscal year ended May 31, 2016.
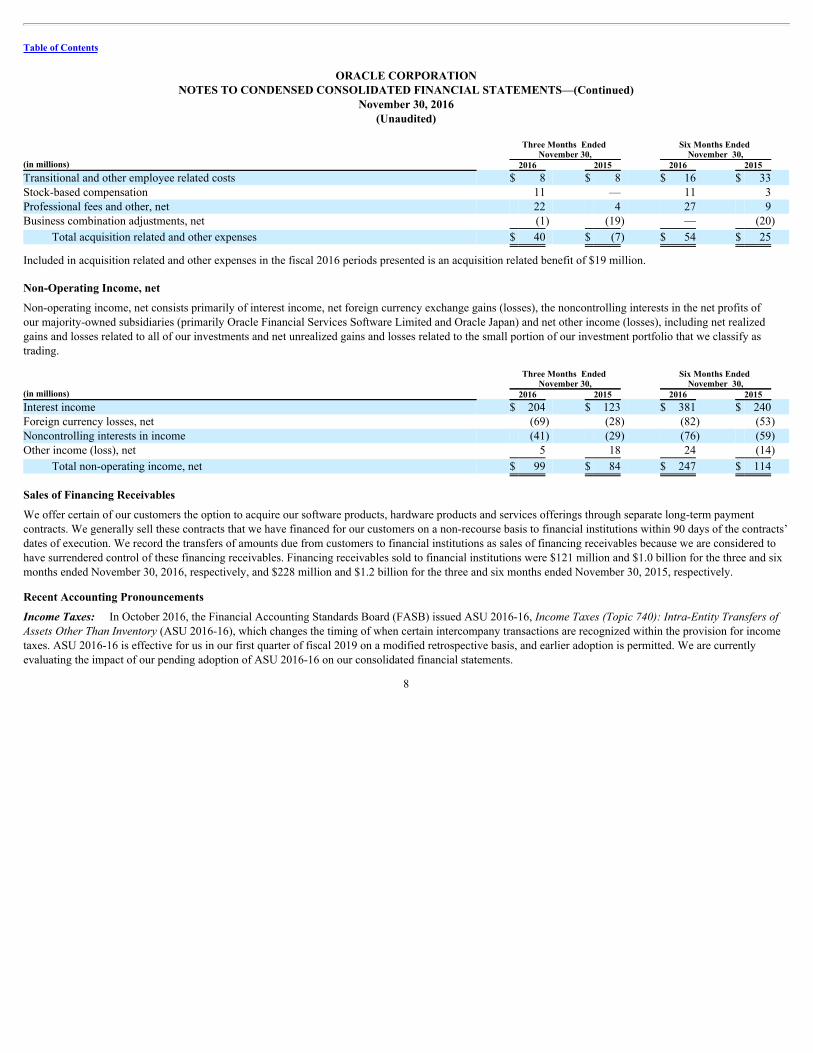
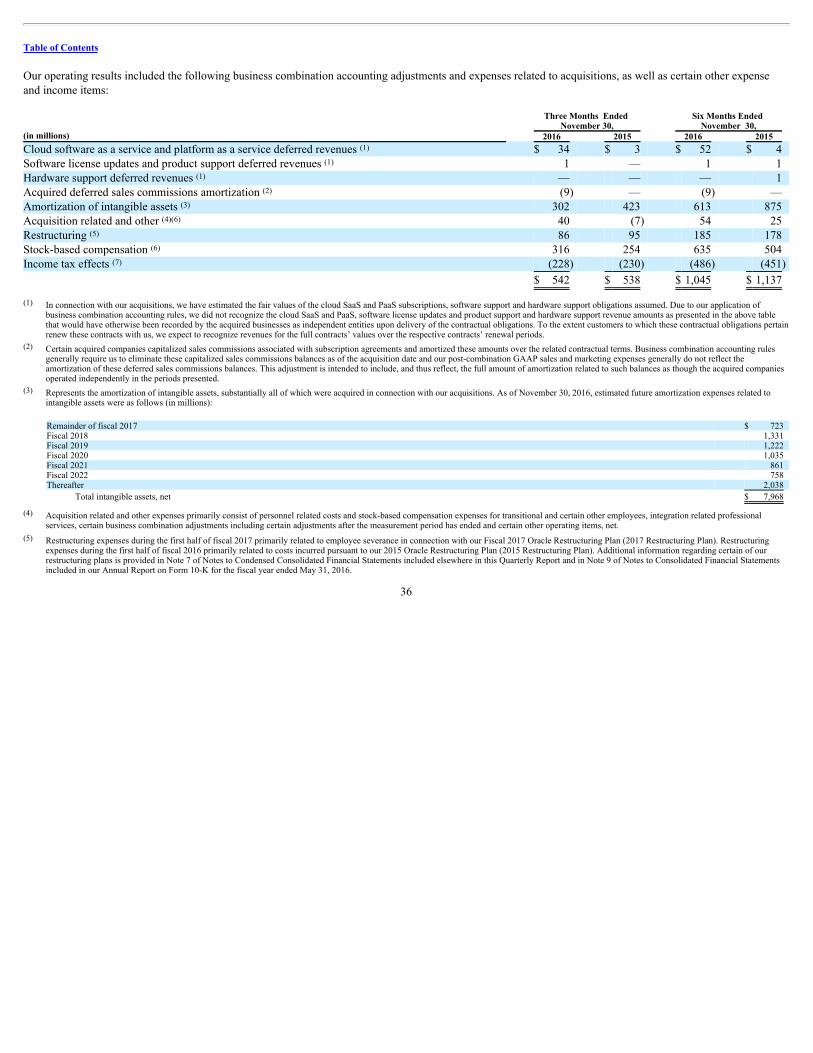
Acquisition Related and Other Expenses
Acquisition related and other expenses consist of personnel related costs and stock-based compensation for transitional and certain other employees, integrationrelated professional services, certain business combination adjustments including certain adjustments after the measurement period has ended and certain otheroperating items, net.
7
Table of Contents
ORACLE CORPORATIONNOTES TO CONDENSED CONSOLIDATED FINANCIAL STATEMENTS—(Continued)
November 30, 2016(Unaudited)
Three Months Ended
November 30, Six Months Ended
November 30, (in millions) 2016 2015 2016 2015 Transitional and other employee related costs $ 8 $ 8 $ 16 $ 33 Stock-based compensation 11 — 11 3 Professional fees and other, net 22 4 27 9 Business combination adjustments, net (1) (19) — (20)
Total acquisition related and other expenses $ 40 $ (7) $ 54 $ 25
Included in acquisition related and other expenses in the fiscal 2016 periods presented is an acquisition related benefit of $19 million. Non-Operating Income, net
Non-operating income, net consists primarily of interest income, net foreign currency exchange gains (losses), the noncontrolling interests in the net profits ofour majority-owned subsidiaries (primarily Oracle Financial Services Software Limited and Oracle Japan) and net other income (losses), including net realizedgains and losses related to all of our investments and net unrealized gains and losses related to the small portion of our investment portfolio that we classify astrading.
Three Months Ended
November 30, Six Months Ended
November 30, (in millions) 2016 2015 2016 2015 Interest income $ 204 $ 123 $ 381 $ 240 Foreign currency losses, net (69) (28) (82) (53) Noncontrolling interests in income (41) (29) (76) (59) Other income (loss), net 5 18 24 (14)
Total non-operating income, net $ 99 $ 84 $ 247 $ 114
Sales of Financing Receivables
We offer certain of our customers the option to acquire our software products, hardware products and services offerings through separate long-term paymentcontracts. We generally sell these contracts that we have financed for our customers on a non-recourse basis to financial institutions within 90 days of the contracts’dates of execution. We record the transfers of amounts due from customers to financial institutions as sales of financing receivables because we are considered tohave surrendered control of these financing receivables. Financing receivables sold to financial institutions were $121 million and $1.0 billion for the three and sixmonths ended November 30, 2016, respectively, and $228 million and $1.2 billion for the three and six months ended November 30, 2015, respectively.
Recent Accounting Pronouncements
IncomeTaxes: In October 2016, the Financial Accounting Standards Board (FASB) issued ASU 2016-16, IncomeTaxes(Topic740):Intra-EntityTransfersofAssetsOtherThanInventory(ASU 2016-16), which changes the timing of when certain intercompany transactions are recognized within the provision for incometaxes. ASU 2016-16 is effective for us in our first quarter of fiscal 2019 on a modified retrospective basis, and earlier adoption is permitted. We are currentlyevaluating the impact of our pending adoption of ASU 2016-16 on our consolidated financial statements.
8
Table of Contents
ORACLE CORPORATIONNOTES TO CONDENSED CONSOLIDATED FINANCIAL STATEMENTS—(Continued)
November 30, 2016(Unaudited)
StatementofCashFlows: In November 2016, the FASB issued ASU 2016-18, StatementofCashFlows(Topic230):RestrictedCash(ASU 2016-18), whichprovides amendments to current guidance to address the classification and presentation of changes in restricted cash in the statement of cash flows.
In August 2016, the FASB issued ASU 2016-15, StatementofCashFlows(Topic230):ClassificationofCertainCashReceiptsandCashPayments(ASU 2016-15), which clarifies how companies present and classify certain cash receipts and cash payments in the statement of cash flows.
Both ASU 2016-18 and ASU 2016-15 are effective for us in our first quarter of fiscal 2019 and earlier adoption is permitted. We are currently evaluating theimpact of our pending adoption of these standards on our consolidated financial statements.
FinancialInstruments: In June 2016, the FASB issued ASU 2016-13, FinancialInstruments—CreditLosses(Topic326):MeasurementofCreditLossesonFinancialInstruments(ASU 2016-13), which requires measurement and recognition of expected credit losses for financial assets held. ASU 2016-13 is effectivefor us in our first quarter of fiscal 2021, and earlier adoption is permitted beginning in the first quarter of fiscal 2020. We are currently evaluating the impact of ourpending adoption of ASU 2016-13 on our consolidated financial statements.
In January 2016, the FASB issued ASU 2016-01, FinancialInstruments—Overall(Subtopic825-10):RecognitionandMeasurementofFinancialAssetsandFinancialLiabilities(ASU 2016-01), which addresses certain aspects of recognition, measurement, presentation, and disclosure of financial instruments. ASU2016-01 is effective for us in our first quarter of fiscal 2019, and earlier adoption is not permitted except for certain provisions. We currently do not expect that ourpending adoption of ASU 2016-01 will have a material effect on our consolidated financial statements.
Leases: In February 2016, the FASB issued ASU 2016-02, Leases(Topic842)(ASU 2016-02). ASU 2016-02 requires companies to generally recognize on thebalance sheet operating and financing lease liabilities and corresponding right-of-use assets. ASU 2016-02 is effective for us in our first quarter of fiscal 2020 on amodified retrospective basis, and earlier adoption is permitted. We are currently evaluating the impact of our pending adoption of ASU 2016-02 on ourconsolidated financial statements, and we currently expect that most of our operating lease commitments will be subject to the new standard and recognized asoperating lease liabilities and right-of-use assets upon our adoption of ASU 2016-02, which will increase our total assets and total liabilities that we report relativeto such amounts prior to adoption.
RevenueRecognition: In May 2014, the FASB issued ASU 2014-09, RevenuefromContractswithCustomers:Topic606and issued subsequent amendments tothe initial guidance in August 2015, March 2016, April 2016 and May 2016 within ASU 2015-14, ASU 2016-08, ASU 2016-10 and ASU 2016-12, respectively(ASU 2014-09, ASU 2015-14, ASU 2016-08, ASU 2016-10 and ASU 2016-12 collectively, Topic 606). Topic 606 supersedes nearly all existing revenuerecognition guidance under GAAP. The core principle of Topic 606 is to recognize revenues when promised goods or services are transferred to customers in anamount that reflects the consideration that is expected to be received for those goods or services. Topic 606 defines a five-step process to achieve this core principleand, in doing so, it is possible more judgment and estimates may be required within the revenue recognition process than are required under existing GAAP,including identifying performance obligations in the contract, estimating the amount of variable consideration to include in the transaction price and allocating thetransaction price to each separate performance obligation, among others. Topic 606 also provides guidance on the recognition of costs related to obtaining customercontracts. Topic 606 is effective for us as of either our first quarter of fiscal 2018 or our first quarter of fiscal 2019 using either of two methods: (1) retrospectiveapplication of Topic 606 to each prior reporting period presented with the option to elect certain practical expedients as defined within Topic 606 or(2) retrospective application of Topic 606 with the cumulative effect of initially applying Topic 606 recognized at the date of initial application and providing
9
Table of Contents
ORACLE CORPORATIONNOTES TO CONDENSED CONSOLIDATED FINANCIAL STATEMENTS—(Continued)
November 30, 2016(Unaudited)
certain additional disclosures as defined per Topic 606. Preliminarily, we plan to adopt Topic 606 in the first quarter of fiscal 2019 pursuant to the aforementionedadoption method (1) and we do not believe there will be a material impact to our revenues upon adoption. We are continuing to evaluate the impact to our revenuesrelated to our pending adoption of Topic 606 and our preliminary assessments are subject to change. We are also continuing to evaluate the impact adoption ofTopic 606 will have on our recognition of costs related to obtaining customer contracts. 2. ACQUISITIONS
Acquisition of NetSuite Inc., a Related Party
On July 28, 2016, we entered into an Agreement and Plan of Merger (Merger Agreement) with NetSuite Inc. (NetSuite), a provider of cloud-based enterpriseresource planning (ERP) software and related applications and, as described further below, a related party to Oracle.
Pursuant to the Merger Agreement, we commenced a tender offer on August 18, 2016 to purchase all of the issued and outstanding shares of NetSuite commonstock (NetSuite Shares) at a purchase price of $109.00 per share, net to the seller in cash, without interest thereon, based upon the terms and subject to theconditions set forth in the Offer to Purchase dated August 18, 2016, and in the related Letter of Transmittal. On November 7, 2016, pursuant to the terms of thetender offer and applicable Delaware law, we accepted and paid for the substantial majority of outstanding NetSuite Shares and effectuated the merger of NetSuitewith and into a wholly-owned subsidiary of Oracle and NetSuite became an indirect, wholly-owned subsidiary of Oracle. Pursuant to the Merger Agreement,NetSuite Shares that remained outstanding and were not acquired by us were converted into, and cancelled in exchange for, the right to receive $109.00 per share incash. The unvested equity awards to acquire NetSuite Shares that were outstanding immediately prior to the conclusion of the merger were converted into equityawards denominated in shares of Oracle common stock based on formulas contained in the Merger Agreement. We acquired NetSuite to, among other things,expand our cloud software as a service offerings with a complementary set of cloud ERP and related cloud software applications for customers. We have includedthe financial results of NetSuite in our consolidated financial statements from the date of acquisition.
Lawrence J. Ellison, Oracle’s Chairman of the Board and Chief Technology Officer and Oracle’s largest stockholder, is an affiliate of NetSuite’s largeststockholder, NetSuite Restricted Holdings LLC (a single member LLC investment entity whose interests are beneficially owned by a trust controlled byMr. Ellison), which owned approximately 40% of the issued and outstanding NetSuite Shares immediately prior to the conclusion of the merger. Oracle’s Board ofDirectors appointed a Special Committee (comprised solely of directors who are independent of the management of Oracle, Mr. Ellison, his family members andany affiliated entities, and NetSuite) to which it delegated the full and exclusive power, authority and discretion of the Board to evaluate, assess, and approve theNetSuite transaction on its behalf. The Special Committee engaged its own independent legal counsel and its own independent financial advisor to advise it on thetransaction. The financial advisor provided the Special Committee with a fairness opinion in connection with the transaction. After extensive deliberations, theSpecial Committee concluded that the transaction terms were fair to Oracle and the transaction was in the best interests of Oracle and its stockholders. The SpecialCommittee unanimously approved the transaction on behalf of Oracle and the Board.
The total preliminary purchase price for NetSuite was approximately $9.1 billion, which consisted of approximately $9.0 billion in cash and $74 million for the fairvalues of restricted stock-based awards and stock options assumed. Pursuant to our business combinations accounting policy, we estimated the preliminary fairvalues of net tangible and intangible assets acquired, and the excess of the consideration transferred over the
10
Table of Contents
ORACLE CORPORATIONNOTES TO CONDENSED CONSOLIDATED FINANCIAL STATEMENTS—(Continued)
November 30, 2016(Unaudited)
aggregate of such fair values was recorded as goodwill. The preliminary fair values of net tangible assets and intangible assets acquired were based on preliminaryvaluations, and our estimates and assumptions are subject to change within the measurement period (up to one year from the acquisition date). The primary areasthat remain preliminary relate to the fair values of intangible assets acquired, certain tangible assets and liabilities acquired, certain legal matters, income and non-income based taxes and residual goodwill. We expect to continue to obtain information to assist us in determining the fair values of the net assets acquired duringthe measurement period. The following table summarizes the estimated preliminary fair values of net tangible liabilities and intangible assets acquired fromNetSuite: (in millions) Cash and cash equivalents $ 481 Trade receivables, net 32 Other assets 121 Intangible assets 3,157 Goodwill 6,696 Accounts payable and other liabilities (134) Deferred revenues (153) Debt (342) Deferred tax liabilities, net (782)
Total $ 9,076
We do not expect the goodwill recognized as a part of the NetSuite acquisition to be deductible for income tax purposes.
Other Fiscal 2017 and Fiscal 2016 Acquisitions
During the first half of fiscal 2017, we acquired certain companies and purchased certain technology and development assets primarily to expand our products andservices offerings. These acquisitions were not individually or in the aggregate significant. We have included the financial results of the acquired companies in ourconsolidated financial statements from their respective acquisition dates, and the results from each of these companies were not individually material to ourconsolidated financial statements. In the aggregate, the total preliminary purchase price for these acquisitions was approximately $1.5 billion, which consisted ofapproximately $1.5 billion in cash and $10 million for the fair values of restricted stock-based awards and stock options assumed. We preliminarily recorded $250million of net tangible assets and $481 million of identifiable intangible assets, based on their estimated fair values, and $816 million of residual goodwill.
The preliminary fair value estimates for the assets acquired and liabilities assumed for our acquisitions completed during the first half of fiscal 2017 were basedupon preliminary calculations and valuations, and our estimates and assumptions for these acquisitions are subject to change as we obtain additional informationduring the respective measurement periods (up to one year from the respective acquisition dates). The primary areas of those preliminary estimates that are not yetfinalized relate to certain tangible assets and liabilities acquired, identifiable intangible assets, certain legal matters, income and non-income based taxes andresidual goodwill.
We also have entered into certain non-material agreements to acquire certain companies and expect these proposed acquisitions to close during the third quarter offiscal 2017.
During fiscal 2016, we acquired certain companies and purchased certain technology and development assets primarily to expand our products and servicesofferings. These acquisitions were not significant individually or in the aggregate.
11
Table of Contents
ORACLE CORPORATIONNOTES TO CONDENSED CONSOLIDATED FINANCIAL STATEMENTS—(Continued)
November 30, 2016(Unaudited)
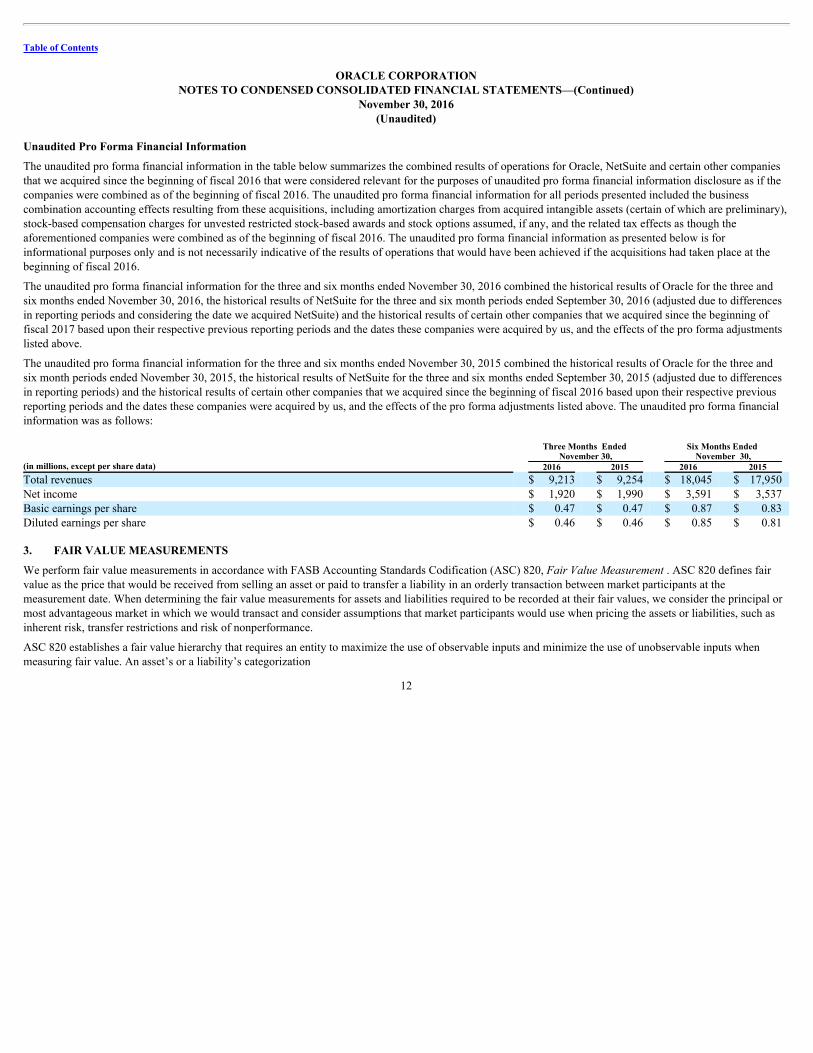
Unaudited Pro Forma Financial Information
The unaudited pro forma financial information in the table below summarizes the combined results of operations for Oracle, NetSuite and certain other companiesthat we acquired since the beginning of fiscal 2016 that were considered relevant for the purposes of unaudited pro forma financial information disclosure as if thecompanies were combined as of the beginning of fiscal 2016. The unaudited pro forma financial information for all periods presented included the businesscombination accounting effects resulting from these acquisitions, including amortization charges from acquired intangible assets (certain of which are preliminary),stock-based compensation charges for unvested restricted stock-based awards and stock options assumed, if any, and the related tax effects as though theaforementioned companies were combined as of the beginning of fiscal 2016. The unaudited pro forma financial information as presented below is forinformational purposes only and is not necessarily indicative of the results of operations that would have been achieved if the acquisitions had taken place at thebeginning of fiscal 2016.
The unaudited pro forma financial information for the three and six months ended November 30, 2016 combined the historical results of Oracle for the three andsix months ended November 30, 2016, the historical results of NetSuite for the three and six month periods ended September 30, 2016 (adjusted due to differencesin reporting periods and considering the date we acquired NetSuite) and the historical results of certain other companies that we acquired since the beginning offiscal 2017 based upon their respective previous reporting periods and the dates these companies were acquired by us, and the effects of the pro forma adjustmentslisted above.
The unaudited pro forma financial information for the three and six months ended November 30, 2015 combined the historical results of Oracle for the three andsix month periods ended November 30, 2015, the historical results of NetSuite for the three and six months ended September 30, 2015 (adjusted due to differencesin reporting periods) and the historical results of certain other companies that we acquired since the beginning of fiscal 2016 based upon their respective previousreporting periods and the dates these companies were acquired by us, and the effects of the pro forma adjustments listed above. The unaudited pro forma financialinformation was as follows:
Three Months Ended
November 30, Six Months Ended
November 30, (in millions, except per share data) 2016 2015 2016 2015 Total revenues $ 9,213 $ 9,254 $ 18,045 $ 17,950 Net income $ 1,920 $ 1,990 $ 3,591 $ 3,537 Basic earnings per share $ 0.47 $ 0.47 $ 0.87 $ 0.83 Diluted earnings per share $ 0.46 $ 0.46 $ 0.85 $ 0.81 3. FAIR VALUE MEASUREMENTS
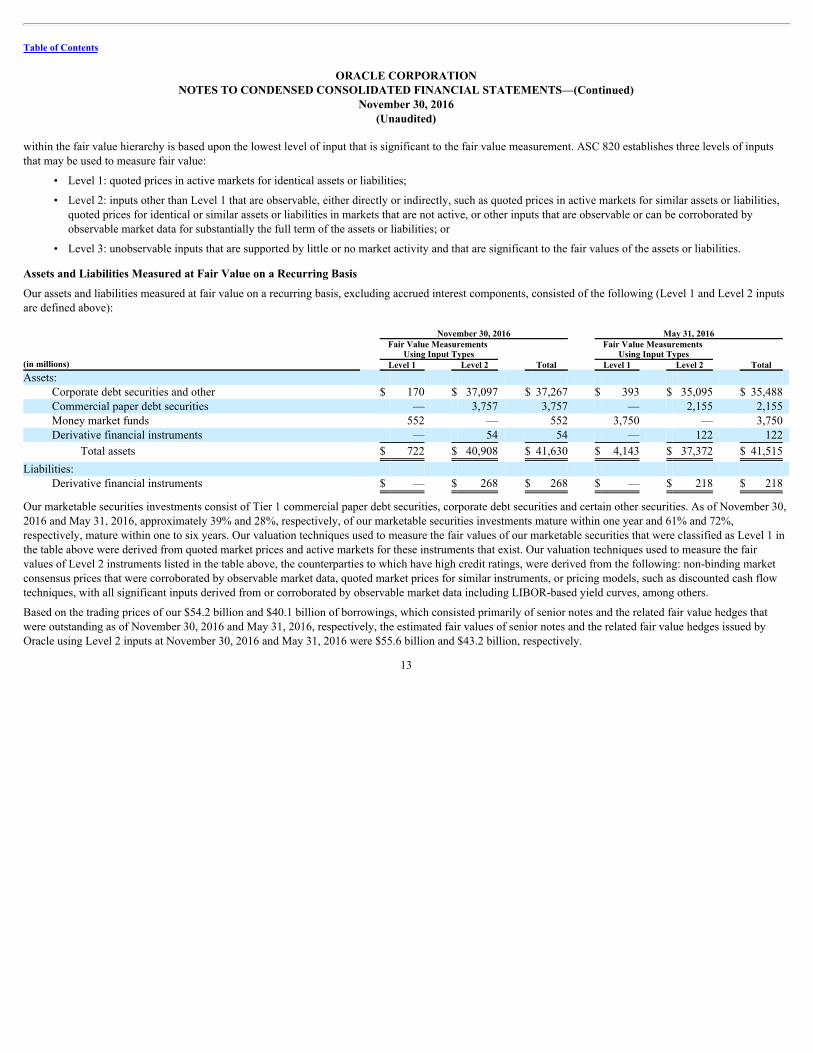
We perform fair value measurements in accordance with FASB Accounting Standards Codification (ASC) 820, FairValueMeasurement. ASC 820 defines fairvalue as the price that would be received from selling an asset or paid to transfer a liability in an orderly transaction between market participants at themeasurement date. When determining the fair value measurements for assets and liabilities required to be recorded at their fair values, we consider the principal ormost advantageous market in which we would transact and consider assumptions that market participants would use when pricing the assets or liabilities, such asinherent risk, transfer restrictions and risk of nonperformance.
ASC 820 establishes a fair value hierarchy that requires an entity to maximize the use of observable inputs and minimize the use of unobservable inputs whenmeasuring fair value. An asset’s or a liability’s categorization
12
Table of Contents
ORACLE CORPORATIONNOTES TO CONDENSED CONSOLIDATED FINANCIAL STATEMENTS—(Continued)
November 30, 2016(Unaudited)
within the fair value hierarchy is based upon the lowest level of input that is significant to the fair value measurement. ASC 820 establishes three levels of inputsthat may be used to measure fair value:
• Level 1: quoted prices in active markets for identical assets or liabilities;
• Level 2: inputs other than Level 1 that are observable, either directly or indirectly, such as quoted prices in active markets for similar assets or liabilities,
quoted prices for identical or similar assets or liabilities in markets that are not active, or other inputs that are observable or can be corroborated byobservable market data for substantially the full term of the assets or liabilities; or
• Level 3: unobservable inputs that are supported by little or no market activity and that are significant to the fair values of the assets or liabilities.
Assets and Liabilities Measured at Fair Value on a Recurring Basis
Our assets and liabilities measured at fair value on a recurring basis, excluding accrued interest components, consisted of the following (Level 1 and Level 2 inputsare defined above): November 30, 2016 May 31, 2016
Fair Value Measurements
Using Input Types Fair Value Measurements
Using Input Types (in millions) Level 1 Level 2 Total Level 1 Level 2 Total Assets:
Our marketable securities investments consist of Tier 1 commercial paper debt securities, corporate debt securities and certain other securities. As of November 30,2016 and May 31, 2016, approximately 39% and 28%, respectively, of our marketable securities investments mature within one year and 61% and 72%,respectively, mature within one to six years. Our valuation techniques used to measure the fair values of our marketable securities that were classified as Level 1 inthe table above were derived from quoted market prices and active markets for these instruments that exist. Our valuation techniques used to measure the fairvalues of Level 2 instruments listed in the table above, the counterparties to which have high credit ratings, were derived from the following: non-binding marketconsensus prices that were corroborated by observable market data, quoted market prices for similar instruments, or pricing models, such as discounted cash flowtechniques, with all significant inputs derived from or corroborated by observable market data including LIBOR-based yield curves, among others.
Based on the trading prices of our $54.2 billion and $40.1 billion of borrowings, which consisted primarily of senior notes and the related fair value hedges thatwere outstanding as of November 30, 2016 and May 31, 2016, respectively, the estimated fair values of senior notes and the related fair value hedges issued byOracle using Level 2 inputs at November 30, 2016 and May 31, 2016 were $55.6 billion and $43.2 billion, respectively.
13
Table of Contents
ORACLE CORPORATIONNOTES TO CONDENSED CONSOLIDATED FINANCIAL STATEMENTS—(Continued)
The changes in intangible assets for fiscal 2017 and the net book value of intangible assets as of November 30, 2016 and May 31, 2016 were as follows: Intangible Assets, Gross Accumulated Amortization Intangible Assets, Net Weighted
Average Useful Life (in millions)
May 31, 2016 Additions
November 30,2016
May 31, 2016 Expense
November 30,2016
May 31, 2016
November 30,2016
Developed technology $ 3,661 $ 1,515 $ 5,176 $ (1,876) $ (280) $ (2,156) $ 1,785 $ 3,020 8 years Software support agreements and related relationships 2,419 — 2,419 (1,287) (63) (1,350) 1,132 1,069 N.A. SaaS, PaaS and IaaS agreements and related relationships 2,034 2,005 4,039 (704) (148) (852) 1,330 3,187 10 years Customer relationships and contract backlog 1,399 — 1,399 (1,121) (36) (1,157) 278 242 N.A. Hardware support agreements and related relationships 1,010 — 1,010 (797) (38) (835) 213 175 N.A. Trademarks and other 1,043 118 1,161 (838) (48) (886) 205 275 9 years
Total intangible assets, net $ 11,566 $ 3,638 $ 15,204 $ (6,623) $ (613) $ (7,236) $ 4,943 $ 7,968 9 years
Represents weighted-average useful lives of intangible assets acquired during fiscal 2017.
Total amortization expense related to our intangible assets was $302 million and $613 million, respectively, for the three and six months ended November 30,2016, respectively, and $423 million and $875 million for the three and six months ended November 30, 2015, respectively. As of November 30, 2016, estimatedfuture amortization expenses related to intangible assets were as follows (in millions): Remainder of fiscal 2017 $ 723 Fiscal 2018 1,331 Fiscal 2019 1,222 Fiscal 2020 1,035 Fiscal 2021 861 Fiscal 2022 758 Thereafter 2,038
Total intangible assets, net $ 7,968
14
(1)
(1)
Table of Contents
ORACLE CORPORATIONNOTES TO CONDENSED CONSOLIDATED FINANCIAL STATEMENTS—(Continued)
November 30, 2016(Unaudited)
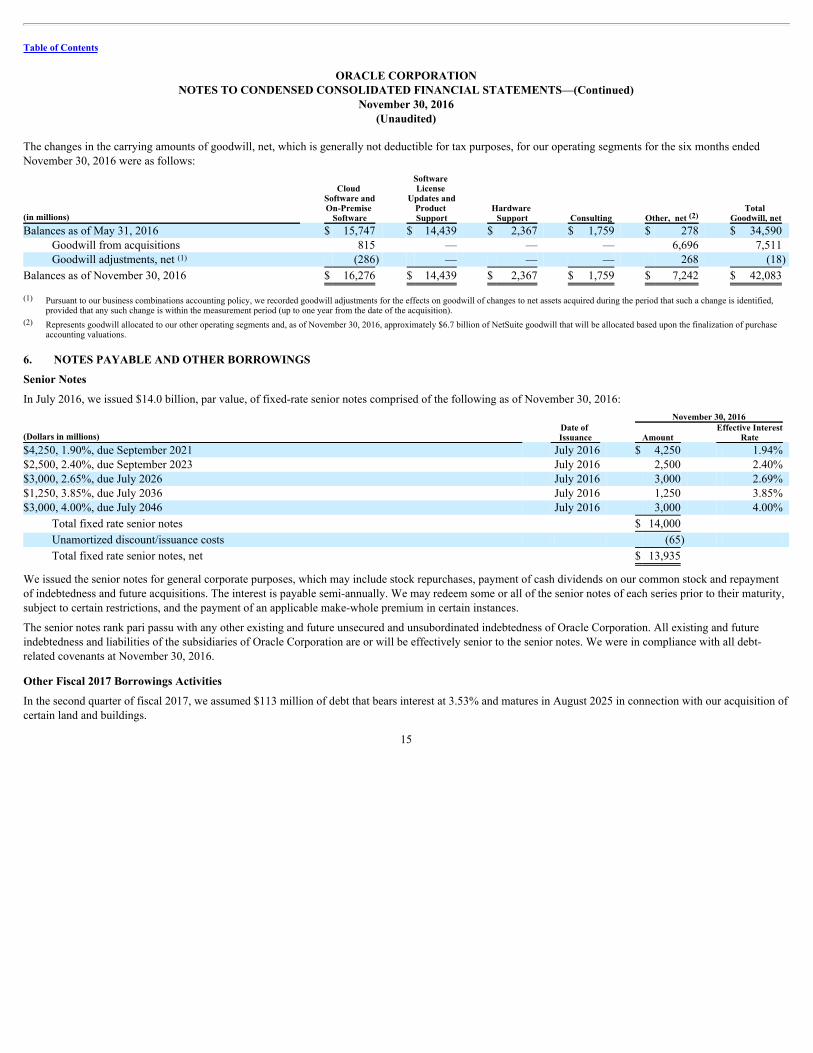
The changes in the carrying amounts of goodwill, net, which is generally not deductible for tax purposes, for our operating segments for the six months endedNovember 30, 2016 were as follows:
(in millions)
Cloud Software andOn-Premise
Software
Software License
Updates andProduct
Support Hardware
Support Consulting Other, net Total
Goodwill, net Balances as of May 31, 2016 $ 15,747 $ 14,439 $ 2,367 $ 1,759 $ 278 $ 34,590
Goodwill from acquisitions 815 — — — 6,696 7,511 Goodwill adjustments, net (286) — — — 268 (18)
Balances as of November 30, 2016 $ 16,276 $ 14,439 $ 2,367 $ 1,759 $ 7,242 $ 42,083
Pursuant to our business combinations accounting policy, we recorded goodwill adjustments for the effects on goodwill of changes to net assets acquired during the period that such a change is identified,
provided that any such change is within the measurement period (up to one year from the date of the acquisition).
Represents goodwill allocated to our other operating segments and, as of November 30, 2016, approximately $6.7 billion of NetSuite goodwill that will be allocated based upon the finalization of purchaseaccounting valuations.
6. NOTES PAYABLE AND OTHER BORROWINGS
Senior Notes
In July 2016, we issued $14.0 billion, par value, of fixed-rate senior notes comprised of the following as of November 30, 2016:
November 30, 2016
(Dollars in millions) Date of Issuance Amount
Effective InterestRate
$4,250, 1.90%, due September 2021 July 2016 $ 4,250 1.94% $2,500, 2.40%, due September 2023 July 2016 2,500 2.40% $3,000, 2.65%, due July 2026 July 2016 3,000 2.69% $1,250, 3.85%, due July 2036 July 2016 1,250 3.85% $3,000, 4.00%, due July 2046 July 2016 3,000 4.00%
Total fixed rate senior notes $ 14,000
Unamortized discount/issuance costs (65)
Total fixed rate senior notes, net $ 13,935
We issued the senior notes for general corporate purposes, which may include stock repurchases, payment of cash dividends on our common stock and repaymentof indebtedness and future acquisitions. The interest is payable semi-annually. We may redeem some or all of the senior notes of each series prior to their maturity,subject to certain restrictions, and the payment of an applicable make-whole premium in certain instances.
The senior notes rank pari passu with any other existing and future unsecured and unsubordinated indebtedness of Oracle Corporation. All existing and futureindebtedness and liabilities of the subsidiaries of Oracle Corporation are or will be effectively senior to the senior notes. We were in compliance with all debt-related covenants at November 30, 2016.
Other Fiscal 2017 Borrowings Activities
In the second quarter of fiscal 2017, we assumed $113 million of debt that bears interest at 3.53% and matures in August 2025 in connection with our acquisition ofcertain land and buildings.
15
(2)
(1)
(1)
(2)
Table of Contents
ORACLE CORPORATIONNOTES TO CONDENSED CONSOLIDATED FINANCIAL STATEMENTS—(Continued)
November 30, 2016(Unaudited)
In connection with our acquisition of NetSuite in the second quarter of fiscal 2017 (see Note 2 above), we assumed $310 million par value of legacy NetSuiteconvertible notes (NetSuite Debt) with a fair value of $342 million as of the acquisition date. The NetSuite Debt bears interest at 0.25% and matures in June 2018.Our acquisition of NetSuite triggered (a) the right of holders of the NetSuite Debt to convert their debt holdings into an amount payable in cash, at any time throughDecember 22, 2016, based upon conversion formulas that are contained within the NetSuite Debt indenture and (b) the obligation of NetSuite to offer to repurchasethe NetSuite Debt from each holder at a purchase price equal to par, plus accrued and unpaid interest, which offer will expire on December 21, 2016. As ofNovember 30, 2016, $342 million of the NetSuite Debt remained outstanding.
In May 2016, we borrowed $3.8 billion pursuant to three revolving credit agreements with JPMorgan Chase Bank, N.A., as initial lender and administrative agent(the 2016 Credit Agreements). In June 2016, we repaid the $3.8 billion and the 2016 Credit Agreements expired pursuant to their terms.
There have been no other significant changes in our notes payable or other borrowing arrangements that were disclosed in our Annual Report on Form 10-K for thefiscal year ended May 31, 2016. 7. RESTRUCTURING ACTIVITIES
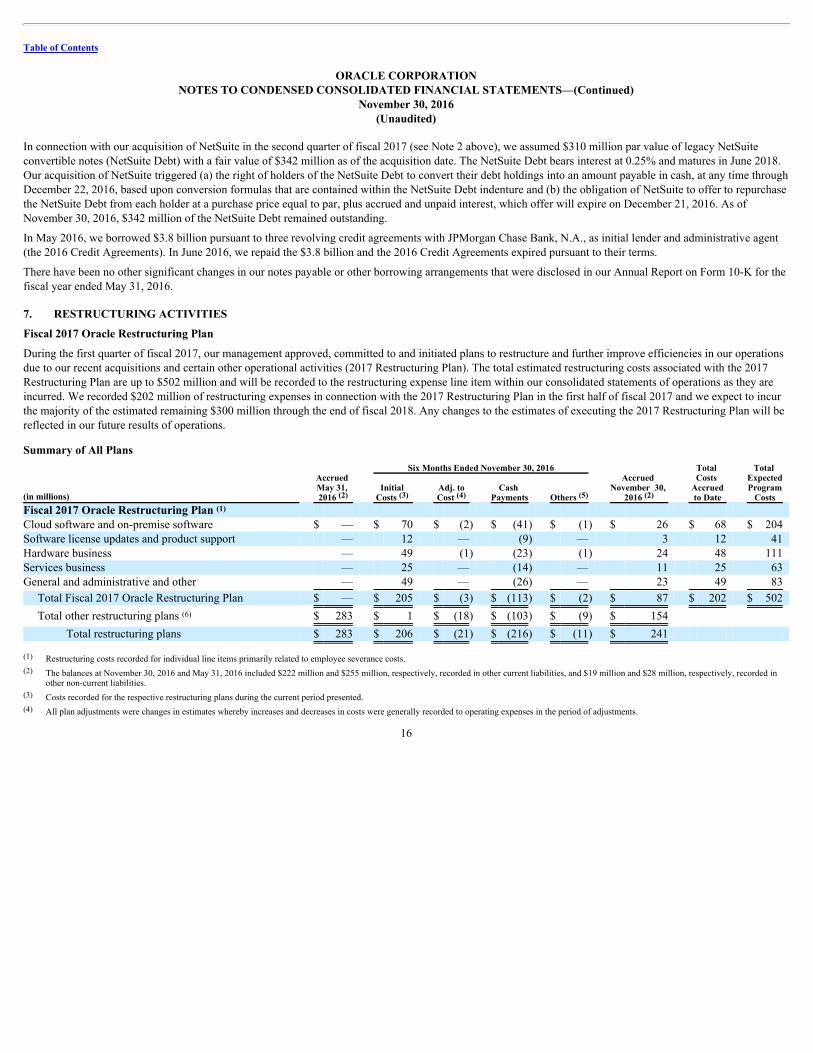
Fiscal 2017 Oracle Restructuring Plan
During the first quarter of fiscal 2017, our management approved, committed to and initiated plans to restructure and further improve efficiencies in our operationsdue to our recent acquisitions and certain other operational activities (2017 Restructuring Plan). The total estimated restructuring costs associated with the 2017Restructuring Plan are up to $502 million and will be recorded to the restructuring expense line item within our consolidated statements of operations as they areincurred. We recorded $202 million of restructuring expenses in connection with the 2017 Restructuring Plan in the first half of fiscal 2017 and we expect to incurthe majority of the estimated remaining $300 million through the end of fiscal 2018. Any changes to the estimates of executing the 2017 Restructuring Plan will bereflected in our future results of operations.
Summary of All Plans
Accrued May 31, 2016
Six Months Ended November 30, 2016 Accrued
November 30, 2016
Total Costs
Accrued to Date
Total ExpectedProgram
Costs (in millions) Initial
Costs Adj. to Cost
Cash Payments Others
Fiscal 2017 Oracle Restructuring Plan Cloud software and on-premise software $ — $ 70 $ (2) $ (41) $ (1) $ 26 $ 68 $ 204 Software license updates and product support — 12 — (9) — 3 12 41 Hardware business — 49 (1) (23) (1) 24 48 111 Services business — 25 — (14) — 11 25 63 General and administrative and other — 49 — (26) — 23 49 83
Restructuring costs recorded for individual line items primarily related to employee severance costs.
The balances at November 30, 2016 and May 31, 2016 included $222 million and $255 million, respectively, recorded in other current liabilities, and $19 million and $28 million, respectively, recorded inother non-current liabilities.
Costs recorded for the respective restructuring plans during the current period presented.
All plan adjustments were changes in estimates whereby increases and decreases in costs were generally recorded to operating expenses in the period of adjustments.
16
(2) (2)(3) (4) (5)
(1)
(6)
(1)
(2)
(3)
(4)
Table of Contents
ORACLE CORPORATIONNOTES TO CONDENSED CONSOLIDATED FINANCIAL STATEMENTS—(Continued)
November 30, 2016(Unaudited)
Represents foreign currency translation and certain other adjustments.
Other restructuring plans presented in the table above included condensed information for other Oracle based plans (primarily the Fiscal 2015 Oracle Restructuring Plan) and other plans associated withcertain of our acquisitions whereby we continued to make cash outlays to settle obligations under these plans during the period presented but for which the periodic impact to our condensed consolidatedstatements of operations was not significant.
8. DEFERRED REVENUES
Deferred revenues consisted of the following:
(in millions) November 30, 2016
May 31, 2016
Software license updates and product support $ 5,446 $ 5,864 Cloud SaaS, PaaS and IaaS 954 705 Hardware support and other 605 675 Services 350 339 New software licenses 56 72
Deferred revenues, current 7,411 7,655 Deferred revenues, non-current (in other non-current liabilities) 519 536
Total deferred revenues $ 7,930 $ 8,191
Deferred software license updates and product support revenues and deferred hardware support revenues represent customer payments made in advance for supportcontracts that are typically billed on a per annum basis in advance with corresponding revenues being recognized ratably over the support periods. Deferred cloudsoftware as a service (SaaS), platform as a service (PaaS) and infrastructure as a service (IaaS) revenues generally resulted from customer payments made inadvance for our cloud-based offerings that are recognized over the corresponding contractual term. Deferred services revenues include prepayments for our servicesbusiness and revenues for these services are generally recognized as the services are performed. Deferred new software licenses revenues typically resulted fromundelivered products or specified enhancements, customer specific acceptance provisions, customer payments made in advance for time-based licensearrangements and software license transactions that cannot be separated from undelivered consulting or other services.
In connection with our acquisitions, we have estimated the fair values of the cloud SaaS and PaaS, software license updates and product support, and hardwaresupport obligations, among others, assumed from our acquired companies. We generally have estimated the fair values of these obligations assumed using a costbuild-up approach. The cost build-up approach determines fair value by estimating the costs related to fulfilling the obligations plus a normal profit margin. Thesum of the costs and operating profit approximates, in theory, the amount that we would be required to pay a third party to assume these acquired obligations.These aforementioned fair value adjustments recorded for obligations assumed from our acquisitions reduced the cloud SaaS and PaaS, software license updatesand product support and hardware support deferred revenues balances that we recorded as liabilities from these acquisitions and also reduced the resulting revenuesthat we recognized or will recognize over the terms of the acquired obligations during the post-combination periods. 9. DERIVATIVE FINANCIAL INSTRUMENTS
Fair Value Hedges—Interest Rate Swap Agreements
In July 2014, we entered into certain interest rate swap agreements that have the economic effect of modifying the fixed-interest obligations associated with our$2.0 billion of 2.25% senior notes due October 2019 (October 2019 Notes) and our $1.5 billion of 2.80% senior notes due July 2021 (July 2021 Notes) so that theinterest
17
(5)
(6)
Table of Contents
ORACLE CORPORATIONNOTES TO CONDENSED CONSOLIDATED FINANCIAL STATEMENTS—(Continued)
November 30, 2016(Unaudited)
payable on these senior notes effectively became variable based on LIBOR. In July 2013, we entered into certain interest rate swap agreements that have theeconomic effect of modifying the fixed-interest obligations associated with our $1.5 billion of 2.375% senior notes due January 2019 (January 2019 Notes) so thatthe interest payable on these senior notes effectively became variable based on LIBOR. The critical terms of the interest rate swap agreements match the criticalterms of the October 2019 Notes, July 2021 Notes and the January 2019 Notes that the interest rate swap agreements pertain to, including the notional amounts andmaturity dates.
We have designated the aforementioned interest rate swap agreements as qualifying hedging instruments and are accounting for them as fair value hedges pursuantto ASC 815, DerivativesandHedging(ASC 815). These transactions are characterized as fair value hedges for financial accounting purposes because they protectus against changes in the fair values of certain of our fixed-rate borrowings due to benchmark interest rate movements. The changes in fair values of these interestrate swap agreements are recognized as interest expense in our consolidated statements of operations with the corresponding amounts included in other assets orother non-current liabilities in our consolidated balance sheets. The amount of net gain (loss) attributable to the risk being hedged is recognized as interest expensein our consolidated statements of operations with the corresponding amount included in notes payable, non-current. The periodic interest settlements for the interestrate swap agreements for the October 2019 Notes, July 2021 Notes and the January 2019 Notes are recorded as interest expense and are included as a part of cashflows from operating activities.
We do not use any interest rate swap agreements for trading purposes.
Cash Flow Hedges—Cross-Currency Swap Agreements
In connection with the issuance of our €1.25 billion of 2.25% senior notes due January 2021 (January 2021 Notes), we entered into certain cross-currency swapagreements to manage the related foreign currency exchange risk by effectively converting the fixed-rate, Euro-denominated January 2021 Notes, including theannual interest payments and the payment of principal at maturity, to fixed-rate, U.S. Dollar-denominated debt. The economic effect of the swap agreements was toeliminate the uncertainty of the cash flows in U.S. Dollars associated with the January 2021 Notes by fixing the principal amount of the January 2021 Notes at $1.6billion with a fixed annual interest rate of 3.53%. We have designated these cross-currency swap agreements as qualifying hedging instruments and are accountingfor these as cash flow hedges pursuant to ASC 815. The critical terms of the cross-currency swap agreements correspond to the January 2021 Notes, including theannual interest payments being hedged, and the cross-currency swap agreements mature at the same time as the January 2021 Notes.
We used the hypothetical derivative method to measure the effectiveness of our cross-currency swap agreements. The fair values of these cross-currency swapagreements are recognized as other assets or other non-current liabilities in our consolidated balance sheets. The effective portions of the changes in fair values ofthese cross-currency swap agreements are reported in accumulated other comprehensive loss in our consolidated balance sheets and an amount is reclassified out ofaccumulated other comprehensive loss into non-operating income, net in the same period that the carrying value of the Euro-denominated January 2021 Notes isremeasured and the interest expense is recognized. The ineffective portion of the unrealized gains and losses on these cross-currency swaps, if any, is recordedimmediately to non-operating income, net. We evaluate the effectiveness of our cross-currency swap agreements on a quarterly basis. We did not record anyineffectiveness for the six months ended November 30, 2016 or 2015. The cash flows related to the cross-currency swap agreements that pertain to the periodicinterest settlements are classified as operating activities and the cash flows that pertain to the principal balance are classified as financing activities.
We do not use any cross-currency swap agreements for trading purposes.
18
Table of Contents
ORACLE CORPORATIONNOTES TO CONDENSED CONSOLIDATED FINANCIAL STATEMENTS—(Continued)
November 30, 2016(Unaudited)
Net Investment Hedge—Foreign Currency Borrowings
In July 2013, we designated our €750 million of 3.125% senior notes due July 2025 (July 2025 Notes) as a net investment hedge of our investments in certain ofour international subsidiaries that use the Euro as their functional currency in order to reduce the volatility in stockholders’ equity caused by the changes in foreigncurrency exchange rates of the Euro with respect to the U.S. Dollar.
We used the spot method to measure the effectiveness of our net investment hedge. Under this method, for each reporting period, the change in the carrying valueof the Euro-denominated July 2025 Notes due to remeasurement of the effective portion is reported in accumulated other comprehensive loss in our consolidatedbalance sheet and the remaining change in the carrying value of the ineffective portion, if any, is recognized in non-operating income, net in our consolidatedstatements of operations. We evaluate the effectiveness of our net investment hedge at the beginning of every quarter. We did not record any ineffectiveness for thesix months ended November 30, 2016 or 2015.
Foreign Currency Forward Contracts Not Designated as Hedges
We transact business in various foreign currencies and have established a program that primarily utilizes foreign currency forward contracts to offset the risksassociated with the effects of certain foreign currency exposures. We neither use these foreign currency forward contracts for trading purposes nor do we designatethese forward contracts as hedging instruments pursuant to ASC 815 (refer to Note 11 of Notes to Consolidated Financial Statements included in our Annual Reporton Form 10-K for the fiscal year ended May 31, 2016 for additional information regarding these contracts). As of November 30, 2016 and May 31, 2016, thenotional amounts of the forward contracts we held to purchase U.S. Dollars in exchange for other major international currencies were $2.3 billion and $2.7 billion,respectively and the notional amount of forward contracts we held to sell U.S. Dollars in exchange for other major international currencies were $925 million and$2.0 billion, respectively. The fair values of our outstanding foreign currency forward contracts were nominal as of November 30, 2016 and May 31, 2016.Included in our non-operating income, net were $15 million and $21 million of net gains related to these forward contracts for the three and six months endedNovember 30, 2016, respectively and $27 million of net losses and $70 million of net gains for the three and six months ended November 30, 2015. The cash flowsrelated to these foreign currency contracts are classified as operating activities.
The effects of derivative and non-derivative instruments designated as hedges on certain of our consolidated financial statements were as follows as of or for eachof the respective periods presented below (amounts presented exclude any income tax effects):
Fair Values of Derivative and Non-Derivative Instruments Designated as Hedges in Condensed Consolidated Balance Sheets Fair Value
(in millions) Balance Sheet Location November 30, 2016
May 31, 2016
Interest rate swap agreements designated as fair value hedges Other assets $ 54 $ 122
Cross-currency swap agreements designated as cash flow hedges Other non-current liabilities $ (268) $ (218)
Foreign currency borrowings designated as net investment hedge Notes payable, non-current $ (938) $ (991)
19
Table of Contents
ORACLE CORPORATIONNOTES TO CONDENSED CONSOLIDATED FINANCIAL STATEMENTS—(Continued)
November 30, 2016(Unaudited)
Effects of Derivative and Non-Derivative Instruments Designated as Hedges on Income and Other Comprehensive Income (OCI) or Loss (OCL)
Amount of Gain (Loss) Recognized in Accumulated
OCI or OCL (Effective Portion) Location and Amount of Gain (Loss) Reclassified from
Accumulated OCI or OCL into Income (Effective Portion)
Three Months Ended
November 30, Six Months Ended
November 30,
Three Months Ended
November 30, Six Months Ended
November 30, (in millions) 2016 2015 2016 2015 2016 2015 2016 2015 Cross-currency swap agreements designated as cash flow hedges $ (54) $ (67) $ (51) $ (45) Non-operating income, net $ (73) $ (82) $ (72) $ (31)
Foreign currency borrowings designated as net investment hedge $ 44 $ 49 $ 43 $ 18 Not applicable $ — $ — $ — $ —
Location and Amount of Gain
(Loss) Recognized in Income on Derivative Location and Amount of Gain (Loss) on Hedged Item
Recognized in Income Attributable to Risk Being Hedged
Our Board of Directors has approved a program for us to repurchase shares of our common stock. As of November 30, 2016, approximately $6.3 billion remainedavailable for stock repurchases pursuant to our stock repurchase program. We repurchased 62.0 million shares for $2.5 billion during the six months endedNovember 30, 2016 (including 0.6 million shares for $24 million that were repurchased but not settled) and 162.1 million shares for $6.2 billion during the sixmonths ended November 30, 2015 under the stock repurchase program.
Our stock repurchase authorization does not have an expiration date and the pace of our repurchase activity will depend on factors such as our working capitalneeds, our cash requirements for acquisitions and dividend payments, our debt repayment obligations or repurchases of our debt, our stock price, and economic andmarket conditions. Our stock repurchases may be effected from time to time through open market purchases or pursuant to a Rule 10b5-1 plan. Our stockrepurchase program may be accelerated, suspended, delayed or discontinued at any time.
Dividends on Common Stock
During the six months ended November 30, 2016, our Board of Directors declared cash dividends of $0.30 per share of our outstanding common stock, which wepaid during the same period.
In December 2016, our Board of Directors declared a quarterly cash dividend of $0.15 per share of our outstanding common stock. The dividend is payable onJanuary 26, 2017 to stockholders of record as of the close of business on January 5, 2017. Future declarations of dividends and the establishment of future recordand payment dates are subject to the final determination of our Board of Directors.
Stock-Based Compensation Expense and Valuations of Stock Awards
During the first half of fiscal 2017, we issued 49 million restricted stock-based awards (consisting of 47 million service-based restricted stock units (RSUs) and2 million performance-based restricted stock units (PSUs)) and 21 million stock options. Substantially all of the awards were issued as a part of our annual stock-based award process
20
Table of Contents
ORACLE CORPORATIONNOTES TO CONDENSED CONSOLIDATED FINANCIAL STATEMENTS—(Continued)
November 30, 2016(Unaudited)
or in connection with our acquisitions and are subject to service-based vesting restrictions, with the PSUs also having performance-based vesting restrictions, thatare of a similar nature to those described in Note 14 of Notes to Consolidated Financial Statements included in our Annual Report on Form 10-K for the fiscal yearended May 31, 2016. Approximately 7 million of the 21 million stock options granted during the first half of fiscal 2017 were to our Chief Executive Officers andChief Technology Officer and had contractual lives of five years versus the ten year contractual lives for most of the other stock options granted. Our fiscal 2017stock-based award issuances were partially offset by forfeitures and cancellations of 6 million shares during the first half of fiscal 2017.
Stock-based compensation expense is included in the following operating expense line items in our condensed consolidated statements of operations:
Three Months Ended
November 30, Six Months Ended
November 30, (in millions) 2016 2015 2016 2015 Sales and marketing $ 68 $ 55 $ 133 $ 107 Cloud software as a service and platform as a service 6 4 11 8 Cloud infrastructure as a service 1 1 2 2 Software license updates and product support 6 6 12 12 Hardware products 2 2 4 3 Hardware support 1 1 2 3 Services 9 7 17 14 Research and development 188 151 382 298 General and administrative 35 27 72 57 Acquisition related and other 11 — 11 3
The effective tax rate for the periods presented is the result of the mix of income earned in various tax jurisdictions that apply a broad range of income tax rates.Our provision for income taxes differs from the tax computed at the U.S. federal statutory income tax rate due primarily to certain earnings considered asindefinitely reinvested in foreign operations, state taxes, the U.S. research and development tax credit, settlements with tax authorities and the U.S. domesticproduction activity deduction. In addition, beginning in fiscal 2017, the provision for income taxes also differs from the tax computed at the U.S. federal statutorytax rate due to the tax effects of stock-based compensation. Our effective tax rate was 24.3% and 23.6% for the three and six months ended November 30, 2016,respectively, and 17.6% and 20.8% for the three and six months ended November 30, 2015, respectively.
Our net deferred tax assets were $183 million and $1.1 billion as of November 30, 2016 and May 31, 2016, respectively. We believe that it is more likely than notthat the net deferred tax assets will be realized in the foreseeable future. Realization of our net deferred tax assets is dependent upon our generation of sufficienttaxable income in future years in appropriate tax jurisdictions to obtain benefit from the reversal of temporary differences, net operating loss carryforwards and taxcredit carryforwards. The amount of net deferred tax assets considered realizable is subject to adjustment in future periods if estimates of future taxable incomechange.
Domestically, U.S. federal and state taxing authorities are currently examining income tax returns of Oracle and various acquired entities for years through fiscal2015. Our U.S. federal income tax returns have been examined for all years prior to fiscal 2007, and we are no longer subject to audit for those periods. Our U.S.state income
21
Table of Contents
ORACLE CORPORATIONNOTES TO CONDENSED CONSOLIDATED FINANCIAL STATEMENTS—(Continued)
November 30, 2016(Unaudited)
tax returns, with some exceptions, have been examined for all years prior to fiscal 2004, and we are no longer subject to audit for those periods.
Internationally, tax authorities for numerous non-U.S. jurisdictions are also examining returns affecting our unrecognized tax benefits. With some exceptions, weare generally no longer subject to tax examinations in non-U.S. jurisdictions for years prior to fiscal 1997.
We believe that we have adequately provided under GAAP for outcomes related to our tax audits. However, there can be no assurances as to the possible outcomesor any related financial statement effect thereof. On July 27, 2015, in AlteraCorp.v.Commissioner, the U.S. Tax Court issued an opinion related to the treatmentof stock-based compensation expense in an intercompany cost-sharing arrangement. A final decision has yet to be issued by the Tax Court due to other outstandingissues related to the case. At this time, the U.S. Department of the Treasury has not withdrawn the requirement to include stock-based compensation from itsregulations. We have reviewed this case and its impact on Oracle and concluded that no adjustment to the consolidated financial statements is appropriate at thistime. We will continue to monitor ongoing developments and potential impacts to our consolidated financial statements.
We are under audit by the IRS and various other domestic and foreign tax authorities with regards to income tax and indirect tax matters and are involved invarious challenges and litigation in a number of countries, including, in particular, India, Brazil, and Korea, where the amounts under controversy are significant. Insome, although not all, cases, we have reserved for potential adjustments to our provision for income taxes and accrual of indirect taxes that may result fromexaminations by, or any negotiated agreements with, these tax authorities or final outcomes in judicial proceedings, and we believe that the final outcome of theseexaminations, agreements or judicial proceedings will not have a material effect on our results of operations. If events occur which indicate payment of theseamounts is unnecessary, the reversal of the liabilities would result in the recognition of benefits in the period we determine the liabilities are no longer necessary. Ifour estimates of the federal, state, and foreign income tax liabilities and indirect tax liabilities are less than the ultimate assessment, it could result in a furthercharge to expense. 12. SEGMENT INFORMATION
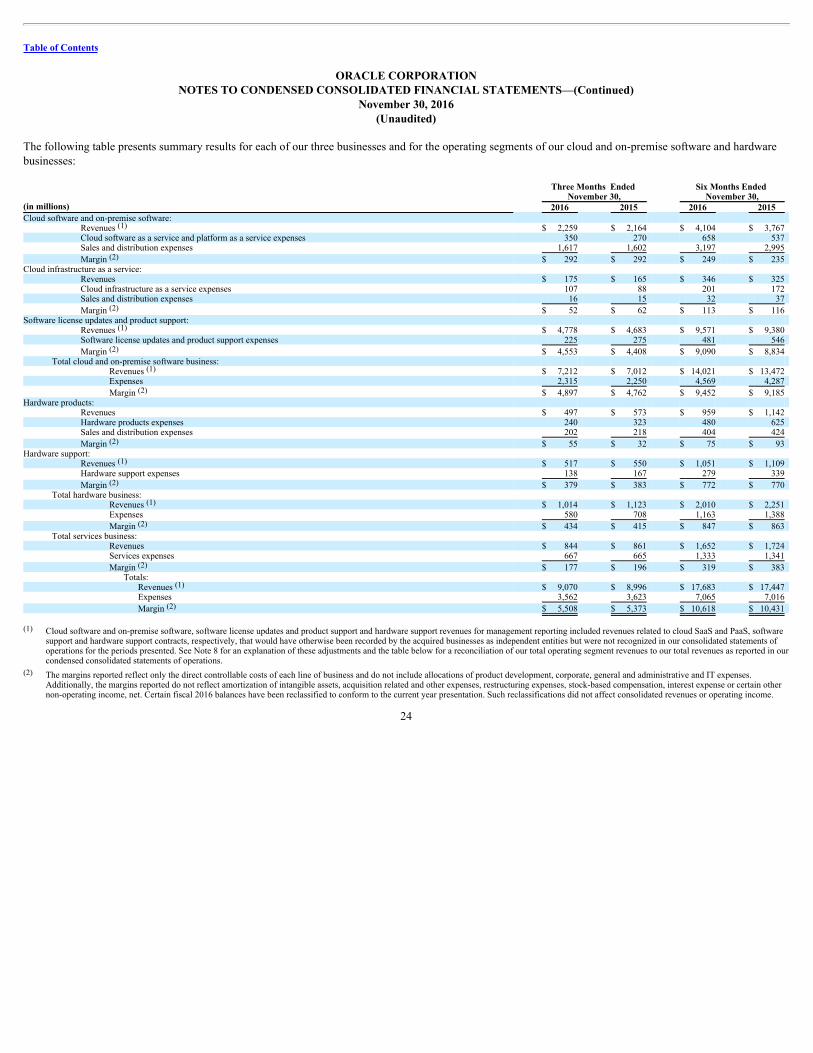
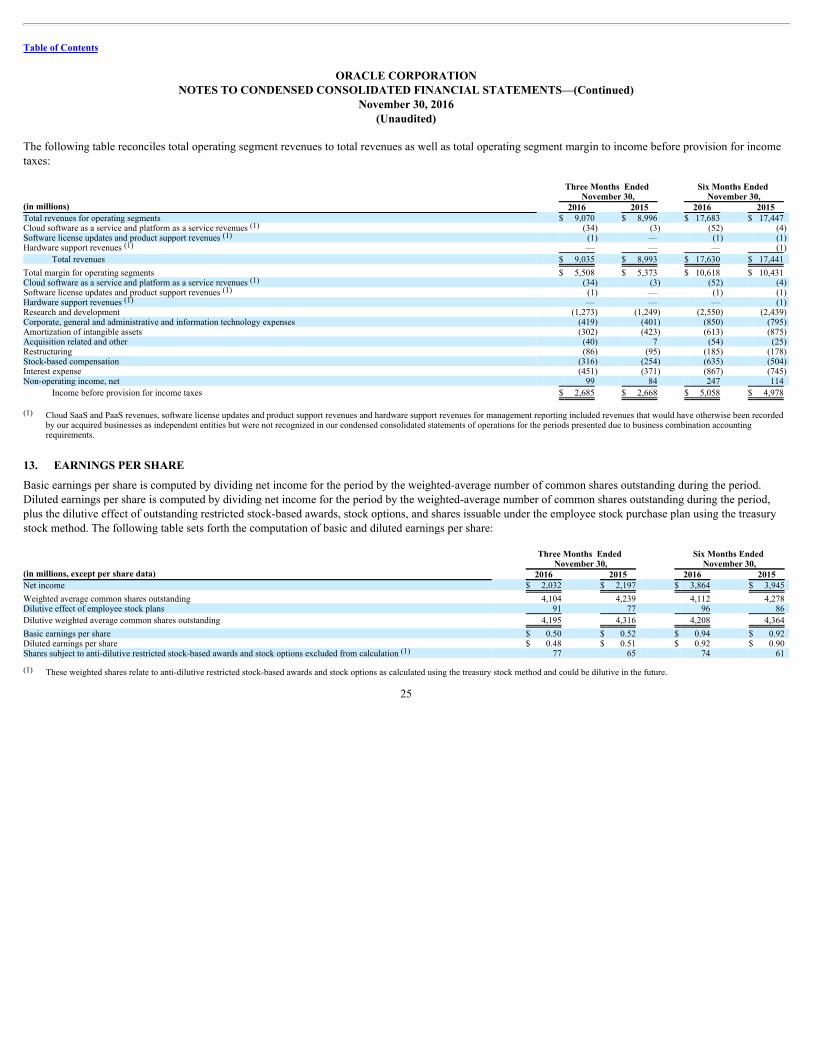
ASC 280, SegmentReporting, establishes standards for reporting information about operating segments. Operating segments are defined as components of anenterprise about which separate financial information is available that is evaluated regularly by the chief operating decision maker, or decision making group, indeciding how to allocate resources and in assessing performance. Our chief operating decision makers are our Chief Executive Officers. We are organizedgeographically and by line of business. While our Chief Executive Officers evaluate results in a number of different ways, the line of business managementstructure is the primary basis for which the allocation of resources and financial results are assessed.
We have three businesses—cloud and on-premise software, hardware and services—which are further divided into certain operating segments. Our cloud and on-premise software business is comprised of three operating segments: (1) cloud software and on-premise software, which includes our cloud SaaS and PaaSofferings, (2) cloud infrastructure as a service and (3) software license updates and product support. Our hardware business is comprised of two operatingsegments: (1) hardware products and (2) hardware support. All other operating segments are combined under our services business.
Our cloud software and on-premise software line of business markets, sells and delivers a broad spectrum of application and platform technologies through ourSaaS and PaaS offerings, which are certain of our applications and platforms software delivered via a cloud-based information technology (IT) environment that wehost, manage and support, and through the licensing of our software products including Oracle Applications, Oracle Database, Oracle Fusion Middleware and Java,among others.
22
Table of Contents
ORACLE CORPORATIONNOTES TO CONDENSED CONSOLIDATED FINANCIAL STATEMENTS—(Continued)
November 30, 2016(Unaudited)
The cloud IaaS line of business includes Oracle Cloud IaaS offerings, which provide infrastructure cloud services that are enterprise-grade, hosted and supportedwithin the Oracle Cloud to perform elastic compute, storage and networking services on a subscription basis; and Oracle Managed Cloud Services, which arecomprehensive software and hardware management and maintenance services for customer IT infrastructure for a fee for a stated term that are hosted at our Oracledata center facilities, select partner data centers or physically on-premise at customer facilities.
The software license updates and product support line of business generates revenues through the sale of software support contracts related to new software licensespurchased by our customers. The software license updates and product support line of business provides our on-premise software customers with rights to softwareproduct upgrades and maintenance releases, patches released, internet access to technical content, as well as internet and telephone access to technical supportpersonnel during the support period.
The hardware products line of business provides Oracle Engineered Systems, servers, storage, networking, industry-specific hardware, virtualization software,operating systems including the Oracle Solaris Operating System and management software to support diverse IT environments, including cloud computingenvironments.
Our hardware support line of business provides customers with software updates for the software components that are essential to the functionality of our hardwareproducts, such as Oracle Solaris and certain other software, and can include product repairs, maintenance services and technical support services.
Our services business is comprised of the remainder of our operating segments and offers consulting, advanced customer support services and education services.Our consulting line of business primarily provides services to customers in business and IT strategy alignment, enterprise architecture planning and design, initialproduct implementation and integration and ongoing product enhancements and upgrades. Advanced customer support services provides on-premise and remotesupport services to our customers to enable increased performance and higher availability of their Oracle products and services and also include certain otherservices. Education services provide training to customers, partners and employees as a part of our mission of accelerating the adoption and use of our cloud, on-premise software and hardware offerings.
We do not track our assets by operating segments. Consequently, it is not practical to show assets by operating segment.
23
Table of Contents
ORACLE CORPORATIONNOTES TO CONDENSED CONSOLIDATED FINANCIAL STATEMENTS—(Continued)
November 30, 2016(Unaudited)
The following table presents summary results for each of our three businesses and for the operating segments of our cloud and on-premise software and hardwarebusinesses:
Three Months Ended
November 30, Six Months Ended
November 30, (in millions) 2016 2015 2016 2015 Cloud software and on-premise software:
Revenues $ 2,259 $ 2,164 $ 4,104 $ 3,767 Cloud software as a service and platform as a service expenses 350 270 658 537 Sales and distribution expenses 1,617 1,602 3,197 2,995
Margin $ 292 $ 292 $ 249 $ 235 Cloud infrastructure as a service:
Revenues $ 175 $ 165 $ 346 $ 325 Cloud infrastructure as a service expenses 107 88 201 172 Sales and distribution expenses 16 15 32 37
Cloud software and on-premise software, software license updates and product support and hardware support revenues for management reporting included revenues related to cloud SaaS and PaaS, software
support and hardware support contracts, respectively, that would have otherwise been recorded by the acquired businesses as independent entities but were not recognized in our consolidated statements ofoperations for the periods presented. See Note 8 for an explanation of these adjustments and the table below for a reconciliation of our total operating segment revenues to our total revenues as reported in ourcondensed consolidated statements of operations.
The margins reported reflect only the direct controllable costs of each line of business and do not include allocations of product development, corporate, general and administrative and IT expenses.Additionally, the margins reported do not reflect amortization of intangible assets, acquisition related and other expenses, restructuring expenses, stock-based compensation, interest expense or certain othernon-operating income, net. Certain fiscal 2016 balances have been reclassified to conform to the current year presentation. Such reclassifications did not affect consolidated revenues or operating income.
24
(1)
(2)
(2)
(1)
(2)
(1)
(2)
(2)
(1)
(2)
(1)
(2)
(2)
(1)
(2)
(1)
(2)
Table of Contents
ORACLE CORPORATIONNOTES TO CONDENSED CONSOLIDATED FINANCIAL STATEMENTS—(Continued)
November 30, 2016(Unaudited)
The following table reconciles total operating segment revenues to total revenues as well as total operating segment margin to income before provision for incometaxes:
Three Months Ended
November 30, Six Months Ended
November 30, (in millions) 2016 2015 2016 2015 Total revenues for operating segments $ 9,070 $ 8,996 $ 17,683 $ 17,447 Cloud software as a service and platform as a service revenues (34) (3) (52) (4) Software license updates and product support revenues (1) — (1) (1) Hardware support revenues — — — (1)
Total revenues $ 9,035 $ 8,993 $ 17,630 $ 17,441
Total margin for operating segments $ 5,508 $ 5,373 $ 10,618 $ 10,431 Cloud software as a service and platform as a service revenues (34) (3) (52) (4) Software license updates and product support revenues (1) — (1) (1) Hardware support revenues — — — (1) Research and development (1,273) (1,249) (2,550) (2,439) Corporate, general and administrative and information technology expenses (419) (401) (850) (795) Amortization of intangible assets (302) (423) (613) (875) Acquisition related and other (40) 7 (54) (25) Restructuring (86) (95) (185) (178) Stock-based compensation (316) (254) (635) (504) Interest expense (451) (371) (867) (745) Non-operating income, net 99 84 247 114
Income before provision for income taxes $ 2,685 $ 2,668 $ 5,058 $ 4,978
Cloud SaaS and PaaS revenues, software license updates and product support revenues and hardware support revenues for management reporting included revenues that would have otherwise been recorded
by our acquired businesses as independent entities but were not recognized in our condensed consolidated statements of operations for the periods presented due to business combination accountingrequirements.
13. EARNINGS PER SHARE
Basic earnings per share is computed by dividing net income for the period by the weighted-average number of common shares outstanding during the period.Diluted earnings per share is computed by dividing net income for the period by the weighted-average number of common shares outstanding during the period,plus the dilutive effect of outstanding restricted stock-based awards, stock options, and shares issuable under the employee stock purchase plan using the treasurystock method. The following table sets forth the computation of basic and diluted earnings per share:
Three Months Ended
November 30, Six Months Ended
November 30, (in millions, except per share data) 2016 2015 2016 2015 Net income $ 2,032 $ 2,197 $ 3,864 $ 3,945
Weighted average common shares outstanding 4,104 4,239 4,112 4,278 Dilutive effect of employee stock plans 91 77 96 86
Dilutive weighted average common shares outstanding 4,195 4,316 4,208 4,364
Basic earnings per share $ 0.50 $ 0.52 $ 0.94 $ 0.92 Diluted earnings per share $ 0.48 $ 0.51 $ 0.92 $ 0.90 Shares subject to anti-dilutive restricted stock-based awards and stock options excluded from calculation 77 65 74 61
These weighted shares relate to anti-dilutive restricted stock-based awards and stock options as calculated using the treasury stock method and could be dilutive in the future.
25
(1)(1)
(1)
(1)(1)
(1)
(1)
(1)
(1)
Table of Contents
ORACLE CORPORATIONNOTES TO CONDENSED CONSOLIDATED FINANCIAL STATEMENTS—(Continued)
November 30, 2016(Unaudited)
14. LEGAL PROCEEDINGS
Hewlett-Packard Company Litigation
On June 15, 2011, Hewlett-Packard Company, now Hewlett Packard Enterprise Company (HP), filed a complaint in the California Superior Court, County of SantaClara against Oracle Corporation alleging numerous causes of action including breach of contract, breach of the covenant of good faith and fair dealing,defamation, intentional interference with prospective economic advantage, and violation of the California Unfair Business Practices Act. The complaint alleged thatwhen Oracle announced on March 22 and 23, 2011 that it would no longer develop future versions of its software to run on HP’s Itanium-based servers, it breacheda settlement agreement signed on September 20, 2010 between HP and Mark Hurd (the Hurd Settlement Agreement), who is our Chief Executive Officer and wasboth HP’s former chief executive officer and chairman of HP’s board of directors. HP sought a judicial declaration of the parties’ rights and obligations under theHurd Settlement Agreement and other equitable and monetary relief.
Oracle answered the complaint and filed a cross-complaint, which was amended on December 2, 2011. The amended cross-complaint alleged claims includingviolation of the Lanham Act. Oracle alleged that HP had secretly agreed to pay Intel to continue to develop and manufacture the Itanium microprocessor, and hadmisrepresented to customers that the Itanium microprocessor had a long roadmap, among other claims. Oracle sought equitable rescission of the Hurd SettlementAgreement, and other equitable and monetary relief.
The court bifurcated the trial and tried HP’s causes of action for declaratory relief and promissory estoppel without a jury in June 2012. The court issued a finalstatement of decision on August 28, 2012, finding that the Hurd Settlement Agreement required Oracle to continue to develop certain of its software products foruse on HP’s Itanium-based servers and to port such products at no cost to HP for as long as HP sells those servers (the Phase One Ruling). A jury trial began onMay 23, 2016. On June 30, 2016, the jury returned a verdict in favor of HP on its claims for breach of contract and breach of the implied covenant of good faith andfair dealing and against Oracle on its claim for violation of the Lanham Act (the Phase Two Jury Verdict). The jury awarded HP damages in the amount of $3.0billion, and HP is entitled to post-judgment interest on this award. On August 30, 2016, the court denied HP’s motion for pre-judgment interest. Judgment wasentered on October 20, 2016. Oracle filed a motion for a new trial on November 14, 2016.
If Oracle’s motion for a new trial is denied, Oracle plans to appeal the trial court’s Phase One Ruling and Phase Two Jury Verdict. No amounts have been paid orrecorded to our results of operations either prior to or subsequent to the Phase One Ruling or Phase Two Jury Verdict. We continue to believe that we havemeritorious defenses against HP’s claims, and we intend to present these defenses to the appellate court. Among the arguments we expect to make on appeal are thefollowing: the trial court misapplied fundamental principles of contract law and misinterpreted the Hurd Settlement Agreement, including by disregarding thecontext of the Hurd Settlement Agreement and the evidence of the parties’ mutual intentions; that HP’s breach of contract claim should fail as a matter of lawbecause HP does not claim and did not prove that Oracle failed to deliver any software under the trial court’s interpretation of the contract; that awarding HP bothdamages for breach of the Hurd Settlement Agreement and specific performance of that agreement constitutes an improper double recovery; and that the damagesaward is excessive, unsupported by the evidence, and contrary to law. We cannot currently estimate a reasonably possible range of loss for this action due to thecomplexities and uncertainty surrounding the appeal process and the nature of the claims. Litigation is inherently unpredictable, and the outcome of the appealprocess related to this action is uncertain. It is possible that the resolution of this action could have a material impact to our future cash flows and results ofoperations.
Other Litigation
We are party to various other legal proceedings and claims, either asserted or unasserted, which arise in the ordinary course of business, including proceedings andclaims that relate to acquisitions we have completed or to companies we have acquired or are attempting to acquire. While the outcome of these matters cannot bepredicted with certainty, we do not believe that the outcome of any of these matters, individually or in the aggregate, will result in losses that are materially inexcess of amounts already recognized, if any.
26
Table of Contents
Item 2. Management’s Discussion and Analysis of Financial Condition and Results of Operations
We begin Management’s Discussion and Analysis of Financial Condition and Results of Operations with an overview of our businesses, key operating segmentsand significant trends. This overview is followed by a summary of our critical accounting policies and estimates that we believe are important to understanding theassumptions and judgments incorporated in our reported financial results. We then provide a more detailed analysis of our results of operations and financialcondition.
Business Overview
Oracle Corporation provides products and services that address all aspects of corporate information technology (IT) environments—application, platform andinfrastructure. Our Oracle Cloud offerings provide a comprehensive and fully integrated stack of application, platform, compute, storage, and networking servicesin all three primary layers of the cloud: Software as a Service (SaaS), Platform as a Service (PaaS) and Infrastructure as a Service (IaaS). Our on-premise offeringsinclude Oracle database and middleware software, application software, hardware (Oracle Engineered Systems, servers, storage, networking and industry-specificproducts), and related support and services. We provide our cloud and on-premise offerings to over 400,000 worldwide customers via deployment models that bestsuit their needs.
Our comprehensive and fully integrated stack of SaaS, PaaS and IaaS offerings integrate the software, hardware and services on the customers’ behalf in ITenvironments that we deploy, support and manage for the customer. Our integrated Oracle Cloud offerings are designed to be rapidly deployable to enablecustomers shorter time to innovation; easily maintainable to reduce integration and testing work; connectable among differing deployment models to enableinterchangeability and extendibility between cloud and on-premise IT environments; compatible to easily move workloads between on-premise IT environmentsand the Oracle Cloud; cost-effective by requiring lower upfront customer investment; and secure, standards-based and reliable. We are a leader in the coretechnologies of cloud IT environments, including database and middleware software as well as enterprise applications, virtualization, clustering, large-scalesystems management and related infrastructure. Our products and services are the building blocks of our Oracle Cloud services, our partners’ cloud services andour customers’ cloud IT environments.
In addition to providing a broad spectrum of cloud offerings, we develop and sell our products and services to our customers worldwide for use in their global datacenters and on-premise IT environments. An important element of our corporate strategy is to continue our investments in, and innovation with respect to, ourproducts and services that we offer through our cloud and on-premise software, hardware and services businesses. We have a deep understanding as to how allcomponents within IT environments—application, platform and infrastructure—interact and function with one another. We focus our development efforts onimproving the performance, security, operation and integration of these differing technologies to make them more cost-effective and easier to deploy, manage andmaintain for our customers and to improve their computing performance relative to our competitors. After the initial purchase of Oracle products and services, ourcustomers can continue to take advantage of our research and development investments and deep IT expertise by purchasing and renewing Oracle supportofferings, which may include product enhancements that we periodically deliver to our Oracle E-Business Suite, Siebel, PeopleSoft and JD Edwards applicationsoftware products, among others, and by renewing their SaaS, PaaS and IaaS contracts with us.
As customers deploy with the Oracle Cloud, many are adopting a hybrid IT model whereby certain of their IT resources are deployed and managed through theOracle Cloud, while other of their IT resources are deployed and managed on-premise, and both sets of resources can be managed as one. We focus the engineeringof our products and services to best connect these different deployment models to enable flexibility, ease, agility, compatibility, extensibility and seamlessness.
A selective and active acquisition program is another important element of our corporate strategy. We believe that our acquisitions enhance the products andservices that we can offer to customers, expand our customer base, provide greater scale to accelerate innovation, grow our revenues and earnings, and increasestockholder value. In recent years, we have invested billions of dollars to acquire a number of companies, products, services and technologies that add to, arecomplementary to, or have otherwise enhanced our existing offerings. On
27
Table of Contents
November 7, 2016, we acquired NetSuite Inc. (NetSuite), which contributed to the growth in our cloud SaaS and PaaS revenues, among others, from the date ofacquisition. Note 2 of Notes to Condensed Consolidated Financial Statements, included elsewhere in this Quarterly Report, provides additional information relatedto our acquisition of NetSuite. We expect to continue to acquire companies, products, services and technologies to further our corporate strategy.
We have three businesses that deliver our application, platform and infrastructure technologies: cloud and on-premise software, hardware and services. Thesebusinesses can be further divided into certain operating segments (Note 12 of Notes to Condensed Consolidated Financial Statements, included elsewhere in thisQuarterly Report, provides additional information related to our operating segments). Each of our businesses and operating segments has unique characteristics andfaces different opportunities and challenges. An overview of our three businesses and related operating segments follows.
CloudandOn-PremiseSoftwareBusiness
Our cloud and on-premise software business, which represented 79% of our total revenues on a trailing 4-quarter basis, is comprised of three operating segments:(1) cloud software and on-premise software, (2) cloud IaaS and (3) software license updates and product support. On a constant currency basis, we expect that ourcloud and on-premise software business’ total revenues generally will continue to increase due to demand for our on-premise software products and softwarelicense updates and product support offerings, including the high percentage of customers that renew their software license updates and product support contracts,expected growth from our cloud SaaS, PaaS and IaaS offerings, and contributions from our acquisitions, which should allow us to grow and continue to makeinvestments in research and development.
CloudSoftwareandOn-PremiseSoftware: Our cloud software and on-premise software line of business markets, sells and delivers a broad spectrum ofapplication and platform technologies through our SaaS and PaaS offerings, which are certain of our software applications and platforms that are delivered via acloud-based IT environment that we host, manage and support. Our cloud software and on-premise software line of business also licenses our software productsincluding Oracle Applications, Oracle Database, Oracle Fusion Middleware and Java, among others, for on-premise IT environments.
We believe that the comprehensiveness and breadth of our SaaS, PaaS and on-premise software offerings provides greater benefit to our customers anddifferentiates us from many of our competitors that offer more limited or specialized software offerings. Our SaaS and PaaS offerings are designed to beinteroperable with one another, thereby limiting the integration and tuning of multiple cloud applications from multiple vendors. Our SaaS and PaaS offerings aredesigned to deliver secure data isolation and flexible upgrades, self-service access controls for users, a Service-Oriented Architecture (SOA) for integration withon-premise systems, and a high performance, high availability infrastructure based on our infrastructure technologies including our Oracle Engineered Systems.Our on-premise software offerings are substantially designed to operate on both single server and clustered server configurations for cloud or on-premise ITenvironments, and to support a choice of operating systems including Oracle Solaris, Oracle Linux, Microsoft Windows and third party UNIX products, amongothers. Our commitment to industry standards results in software offerings that work in customer environments with Oracle or non-Oracle hardware or softwarecomponents and that can be adapted to meet specific industry or business needs. We focus the engineering of our products and services to best connect cloud andon-premise deployment models to enable flexibility, ease, agility, compatibility, extensibility and seamlessness. All of these approaches are designed to supportcustomer choice and reduce customer risk. Our customers include businesses of many sizes, government agencies, educational institutions and resellers. We marketand sell our cloud software and on-premise software offerings to these customers with a sales force positioned to offer the combinations that best fit customerneeds. We enable customers to evolve and transform to substantially any IT environment at whatever pace is most appropriate for them.
Our SaaS and PaaS revenues and new software licenses revenues are affected by the strength of general economic and business conditions, governmental budgetaryconstraints, the strategy for and competitive position of our software offerings, our acquisitions, our ability to deliver and renew our SaaS and PaaS contracts withour existing customers and foreign currency rate fluctuations. In recent periods, we have placed significant strategic
28
Table of Contents
emphasis on growing our cloud SaaS and PaaS revenues, which has affected the growth of our cloud SaaS and PaaS revenues and our new software licensesrevenues and the related expenses. We expect these trends will continue. Our SaaS and PaaS arrangements are generally one to three years in duration and we striveto renew these contracts when they are eligible for renewal. The substantial majority of our new software license transactions are characterized by long sales cyclesand the timing of a few large software license transactions can substantially affect our quarterly new software licenses revenues.
Cloud software and on-premise software revenues represented 26% of our total revenues on a trailing 4-quarter basis. Our cloud software and on-premise softwaresegment’s margin has historically trended upward over the course of the four quarters within a particular fiscal year due to the historical upward trend of our newsoftware licenses revenues over those quarterly periods and because the majority of our costs for this segment are predominantly fixed in the short term. Asdiscussed further below under “Supplemental Disclosure Related to Certain Charges,” our cloud software and on-premise software segment’s margin has been andwill continue to be affected by the fair value adjustments relating to the cloud SaaS and PaaS obligations that we assumed in our business combinations and by theamortization of intangible assets associated with companies and technologies that we have acquired.
CloudInfrastructureasaService: Our cloud IaaS segment, which represented 2% of our total revenues on a trailing 4-quarter basis, provides Oracle Cloud IaaSofferings, which are infrastructure cloud services that are enterprise-grade, hosted and supported within the Oracle Cloud to perform elastic compute, storage andnetworking services on a subscription basis. Our cloud IaaS segment also offers Oracle Managed Cloud Services, which are comprehensive software and hardwaremanagement and maintenance services for customer IT infrastructure for a fee for a stated term that are hosted at our Oracle data center facilities, select partnerdata centers or physically on-premise at customer facilities. We believe that the introduction of additional Oracle Cloud IaaS offerings complements our SaaS andPaaS offerings and allows us to offer customers additional opportunities to access Oracle technologies through the Oracle Cloud to meet their IT needs.
SoftwareLicenseUpdatesandProductSupport: Software license updates and product support revenues are generated through the sale of software supportcontracts relating to on-premise new software licenses purchased by our customers. Customers that purchase software license updates and product support aregranted rights to unspecified product upgrades and maintenance releases and patches released during the term of the support period, as well as technical supportassistance. Our software license updates and product support contracts are generally one year in duration. Substantially all of our on-premise software licensecustomers renew their software license updates and product support contracts annually. The growth of software license updates and product support revenues isprimarily influenced by four factors: (1) the percentage of our software support contract customer base that renews its software support contracts, (2) the amount ofnew software license revenues sold, (3) the amount of new software support contracts sold in connection with the sale of new software licenses and (4) the amountof software support contracts assumed from companies we have acquired.
Our software license updates and product support segment, which represented 51% of our total revenues on a trailing 4-quarter basis, is our highest margin businessunit. Our software support margins over the trailing 4-quarters were 93% and accounted for 87% of our total margins over the same period. Over the longer term,we believe that software license updates and product support revenues and margins will grow for the following reasons:
• substantially all of our on-premise new software license customers, including customers from acquired companies, renew their software support contracts
when eligible for renewal;
• substantially all of our customers purchase software license updates and product support contracts when they buy new software licenses, resulting in afurther increase in our software support contract base. Even if new software licenses revenues growth was flat, software license updates and productsupport revenues would continue to grow in comparison to the corresponding prior year periods assuming contract renewal and cancellation rates andforeign currency rates remained relatively constant, since substantially all new software licenses transactions result in the sale of software license updatesand product support contracts, which add to our software support contract base; and
• our acquisitions have increased our software support contract base, as well as the portfolio of products available to be licensed and supported.
29
Table of Contents
HardwareBusiness
Our hardware business is comprised of two operating segments: (1) hardware products and (2) hardware support. Our hardware business represented 12% of ourtotal revenues on a trailing 4-quarter basis. We expect our hardware business to have lower operating margins as a percentage of revenues than our cloud and on-premise software business due to the incremental costs we incur to produce and distribute these products and to provide support services, including direct materialsand labor costs. We expect to make investments in research and development to improve existing hardware products and services and to develop new hardwareproducts and services.
HardwareProducts: We provide a broad selection of hardware and related services, including Oracle Engineered Systems, servers, storage, networking,workstations and related devices, industry-specific hardware, virtualization software, operating systems, and management software to support diverse ITenvironments, including cloud computing environments. We engineer our hardware products with virtualization and management capabilities to enable the rapiddeployment and efficient management of cloud and on-premise IT infrastructures. Our hardware products support many of the world’s largest cloud infrastructures,including the Oracle Cloud.
Our hardware products are designed to be easier to deploy, manage and maintain for our customers and to improve computing performance relative to ourcompetitors’ offerings. We design our hardware products to seamlessly connect cloud and on-premise IT environments to further enable interoperability,interchangeability and extendibility and to work in customer environments that may include other Oracle or non-Oracle hardware or software components. Ourflexible and open approach provides Oracle customers with a broad range of choices in how they deploy our hardware products, which we believe is a priority forour customers.
Oracle Engineered Systems are core to our hardware offerings and are important elements of our data center and cloud computing offerings including the OracleCloud. These pre-integrated products are designed to integrate multiple Oracle technology components to work together to deliver improved performance,availability, security and operational efficiency relative to our competitors’ products; to be upgraded effectively and efficiently; and to simplify maintenance cyclesby providing a single solution for software patching. Oracle Engineered Systems are tested before they are shipped to customers and delivered ready-to-run,enabling customers to shorten deployment time to production. We offer certain of our Oracle Engineered Systems technologies through flexible deploymentoptions including as a cloud service and for on-premise IT environments.
We offer a wide range of server products using our SPARC microprocessor. Our SPARC servers run the Oracle Solaris operating system and are designed to bedifferentiated by their reliability, security and scalability. Our mid-size and large servers are designed to offer better performance and lower total cost of ownershipthan competitive UNIX systems for business critical applications, for customers having more computationally intensive needs, and as platforms for building cloudcomputing IT environments. Our SPARC servers are also a core component of the Oracle SuperCluster, one of our Oracle Engineered Systems.
We also offer enterprise x86 servers. These x86 servers are based on microprocessors from Intel Corporation and are compatible with Oracle Solaris, Oracle Linux,Microsoft Windows and other operating systems. Our x86 servers are also a core component of many of our Oracle Engineered Systems including the OracleExadata Database Machine, Oracle Exalogic Elastic Cloud, Oracle Exalytics In-Memory Machine and the Oracle Big Data Appliance.
Our storage products are engineered for the cloud and designed to securely store, manage, protect, archive, backup and recover customers’ mission critical dataassets. Our storage products consist of disk, flash, tape, virtual tape and hardware-related software including file systems software, back-up and archive software,hierarchical storage management software and networking for mainframe and heterogeneous systems environments. We also offer certain of our storage offeringsas a cloud service.
Our networking and data center fabric products, including Oracle Virtual Networking, and Oracle InfiniBand and Ethernet technologies, are used with our serverand storage products and are integrated into our management tools to help enterprise customers improve infrastructure performance, reduce cost and complexityand simplify storage and server connectivity.
30
Table of Contents
We offer hardware products and services designed for certain specific industries. Our point-of-sale hardware offerings include point-of-sale terminals and relatedhardware that are designed for managing businesses within the food and beverage, hotel and retail industries, among others. Our hardware products and services forcommunications networks include network signaling, policy control and subscriber data management solutions, and session border control technology, amongothers.
The majority of our hardware products are sold through indirect channels, including independent distributors and value-added resellers.
To produce our hardware products, we rely on both our internal manufacturing operations as well as third party manufacturing partners. Our internal manufacturingoperations consist primarily of materials procurement, assembly, testing and quality control of our Oracle Engineered Systems and certain of our enterprise anddata center servers and storage products. For all other manufacturing, we generally rely on third party manufacturing partners to produce our hardware-relatedcomponents and hardware products and we may involve our internal manufacturing operations in the final assembly, testing and quality control processes for thesecomponents and products. We distribute most of our hardware products either from our facilities or partner facilities. We strive to reduce costs by simplifying ourmanufacturing processes through increased standardization of components across product types and a “build-to-order” manufacturing process in which productsgenerally are built only after customers have placed firm orders.
Our hardware products revenues, cost of hardware products and hardware operating margins that we report are affected by our strategy for and the competitiveposition of our hardware products, the strength of general economic and business conditions, governmental budgetary constraints, certain of our acquisitions andforeign currency rate fluctuations.
Our quarterly hardware products revenues are difficult to predict. The timing of customer orders and delays in our ability to timely manufacture or deliver a fewlarge hardware transactions, among other factors, could substantially affect the amount of hardware products revenues, expenses and operating margins that wereport.
HardwareSupport: Our hardware support offerings provide customers with software updates for software components that are essential to the functionality ofour hardware products, such as Oracle Solaris and certain other software products, and can include product repairs, maintenance services and technical supportservices. Typically, our hardware support contract arrangements are priced as a percentage of the net hardware products fees, are invoiced to the customer at thebeginning of the support period and are one year in duration. We continue to evolve hardware support processes that are intended to proactively identify and solvequality issues and to increase the amount of new and renewed hardware support contracts sold in connection with the sales of our hardware products. Our hardwaresupport revenues that we report are influenced by a number of factors, including the volume of purchases of hardware products, the pricing and mix of hardwareproducts purchased, whether customers decide to purchase hardware support contracts at or in close proximity to the time of hardware product sale, the percentageof our hardware support contract customer base that renews its support contracts and our acquisitions. Substantially all of these factors are heavily influenced byour customers’ decisions to either maintain or upgrade their existing hardware infrastructure to newly developed technologies that are available.
ServicesBusiness
Our services business, which represented 9% of our total revenues on a trailing 4-quarter basis, is comprised of the remainder of our operating segments. Ourservices business has lower margins than our cloud and on-premise software and hardware businesses. Our services revenues are impacted by our strategy for andthe competitive position of our services, certain of our acquisitions, general economic conditions, governmental budgetary constraints, personnel reductions in ourcustomers’ IT departments, tighter controls over discretionary spending, our strategic emphasis on growing our cloud revenues and the growth in our software andhardware offerings. Our services business’ offerings include:
• consulting services that are designed to help our customers and global system integrator partners more successfully architect and deploy our offerings,
including IT strategy alignment, enterprise architecture planning and design, initial cloud and software implementation and integration, and ongoingsoftware
31
Table of Contents
enhancements and upgrades. We utilize a global, blended delivery model to optimize value for our customers and partners, consisting of on-premiseconsultants from local geographies, industry specialists and consultants from our global delivery and solution centers;
• advanced customer support services, which are provided on-premise and remotely to our customers to enable increased performance and higher
availability of their Oracle products and services and also include certain other services; and
• education services for Oracle products and services, including training and certification programs that are offered to customers, partners and employees
through a variety of formats, including instructor-led classes at our education centers, live virtual training, self-paced online training, private events andcustom training.
Acquisitions
A selective and active acquisition program is another important element of our corporate strategy. In recent years, we have invested billions of dollars to acquire anumber of complementary companies, products, services and technologies.
We have acquired certain companies and technologies during the fiscal 2017 and 2016 periods presented in this Quarterly Report, including NetSuite. Note 2 ofNotes to Condensed Consolidated Financial Statements included elsewhere in this Quarterly Report provides additional information related to our recentacquisitions.
We believe that our acquisition program strengthens our competitive position, enhances the products and services that we can offer to customers, expands ourcustomer base, provides greater scale to accelerate innovation, grows our revenues and earnings and increases stockholder value. We expect to continue to acquirecompanies, products, services and technologies in furtherance of our corporate strategy.
We believe that we can fund our pending and future acquisitions with our internally available cash, cash equivalents and marketable securities, cash generated fromoperations, additional borrowings or from the issuance of additional securities. We estimate the financial impact of any potential acquisition with regard toearnings, operating margin, cash flow and return on invested capital targets before deciding to move forward with an acquisition.
Critical Accounting Policies and Estimates
Our consolidated financial statements are prepared in accordance with U.S. generally accepted accounting principles (GAAP) as set forth in the FinancialAccounting Standards Board’s (FASB) Accounting Standards Codification (ASC), and we consider the various staff accounting bulletins and other applicableguidance issued by the U.S. Securities and Exchange Commission. GAAP, as set forth within the ASC, requires us to make certain estimates, judgments andassumptions. We believe that the estimates, judgments and assumptions upon which we rely are reasonable based upon information available to us at the time thatthese estimates, judgments and assumptions are made. These estimates, judgments and assumptions can affect the reported amounts of assets and liabilities as ofthe date of the financial statements as well as the reported amounts of revenues and expenses during the periods presented. To the extent that there are differencesbetween these estimates, judgments or assumptions and actual results, our financial statements will be affected. The accounting policies that reflect our moresignificant estimates, judgments and assumptions and which we believe are the most critical to aid in fully understanding and evaluating our reported financialresults include:
• Revenue Recognition;
• Business Combinations;
• Goodwill and Intangible Assets—Impairment Assessments;
• Accounting for Income Taxes; and
• Legal and Other Contingencies.
32
Table of Contents
In many cases, the accounting treatment of a particular transaction is specifically dictated by GAAP and does not require management’s judgment in its application.There are also areas in which management’s judgment in selecting among available alternatives would not produce a materially different result. Our seniormanagement has reviewed our critical accounting policies and related disclosures with the Finance and Audit Committee of the Board of Directors.
During the first half of fiscal 2017, there were no significant changes to our critical accounting policies and estimates. Management’s Discussion and Analysis ofFinancial Condition and Results of Operations contained in Part II, Item 7 of our Annual Report on Form 10-K for our fiscal year ended May 31, 2016 provides amore complete discussion of our critical accounting policies and estimates.
Results of Operations
ImpactofAcquisitions
The comparability of our operating results in the second quarter and first half of fiscal 2017 compared to the same periods of fiscal 2016 was impacted by ourrecent acquisitions. In our discussion of changes in our results of operations from the second quarter and first half of fiscal 2017 compared to the same periods offiscal 2016, we may qualitatively disclose the impact of our acquired products and services for the one-year period subsequent to the acquisition date to the growthin certain of our operating segments’ revenues where such qualitative discussions would be meaningful for an understanding of the factors that influenced thechanges in our results of operations. When material, we may also provide quantitative disclosures related to such acquired products and services. Expensecontributions from our recent acquisitions for each of the respective period comparisons generally were not separately identifiable due to the integration of thesebusinesses and operating segments into our existing operations, and/or were insignificant to our results of operations during the periods presented.
We caution readers that, while pre- and post-acquisition comparisons, as well as any quantified amounts themselves, may provide indications of general trends, anyacquisition information that we provide has inherent limitations for the following reasons:
• any qualitative and quantitative disclosures cannot specifically address or quantify the substantial effects attributable to changes in business strategies,
including our sales force integration efforts. We believe that if our acquired companies had operated independently and sales forces had not beenintegrated, the relative mix of products and services sold would have been different; and
• although substantially all of our on-premise software license customers, including customers from acquired companies, renew their software licenseupdates and product support contracts when the contracts are eligible for renewal, and we strive to renew cloud SaaS and PaaS contracts and hardwaresupport contracts, the amounts shown as cloud SaaS and PaaS deferred revenues, software license updates and product support deferred revenues, andhardware support deferred revenues in our “Supplemental Disclosure Related to Certain Charges” (presented below) are not necessarily indicative ofrevenue improvements we will achieve upon contract renewals to the extent customers do not renew.
For purposes of presentation of amortization of intangible assets within our condensed consolidated statements of operations included elsewhere in this QuarterlyReport, we present a single line item within operating expenses and provide appropriate supplemental footnote disclosure. With respect to the presentation anddiscussion of our segments’ results for the periods presented, we have assigned the amortization of our intangible assets to the lines of business to which suchamortization pertains and also have provided a discussion and presentation of comparative movements for such amortization amounts in totality.
Seasonality
Our quarterly revenues have historically been affected by a variety of seasonal factors, including the structure of our sales force incentive compensation plans,which are common in the technology industry. In each fiscal year, our total revenues and operating margins are typically highest in our fourth fiscal quarter andlowest in our first
33
Table of Contents
fiscal quarter. The operating margins of our businesses, in particular, our cloud software and on-premise software segment, are generally affected by seasonalfactors in a similar manner as our revenues as certain expenses within our cost structure are relatively fixed in the short term.
ConstantCurrencyPresentation
Our international operations have provided and are expected to continue to provide a significant portion of each of our segments’ revenues and expenses. As aresult, each segment’s revenues and expenses and our total revenues and expenses will continue to be affected by changes in the U.S. Dollar against majorinternational currencies. In order to provide a framework for assessing how our underlying businesses performed excluding the effects of foreign currency ratefluctuations, we compare the percent change in the results from one period to another period in this Quarterly Report using constant currency disclosure. To presentthis information, current and comparative prior period results for entities reporting in currencies other than U.S. Dollars are converted into U.S. Dollars at constantexchange rates (i.e., the rates in effect on May 31, 2016, which was the last day of our prior fiscal year) rather than the actual exchange rates in effect during therespective periods. For example, if an entity reporting in Euros had revenues of 1.0 million Euros from products sold on November 30, 2016 and 2015, ourfinancial statements would reflect reported revenues of $1.05 million in the first half of fiscal 2017 (using 1.05 as the month-end average exchange rate for theperiod) and $1.06 million in the first half of fiscal 2016 (using 1.06 as the month-end average exchange rate for the period). The constant currency presentation,however, would translate the results for the three and six months ended November 30, 2016 and 2015 using the May 31, 2016 exchange rate and indicate, in thisexample, no change in revenues during the period. In each of the tables below, we present the percent change based on actual, unrounded results in reportedcurrency and in constant currency.
TotalRevenuesandOperatingExpenses Three Months Ended November 30, Six Months Ended November 30, Percent Change Percent Change (Dollars in millions) 2016 Actual Constant 2015 2016 Actual Constant 2015 TotalRevenuesbyGeography: Americas $ 4,936 0% 0% $ 4,960 $ 9,752 1% 1% $ 9,677 EMEA 2,557 -3% 1% 2,645 4,971 -3% 2% 5,101 Asia Pacific 1,542 11% 7% 1,388 2,907 9% 5% 2,663
FiscalSecondQuarter2017ComparedtoFiscalSecondQuarter2016: Excluding the effects of foreign currency rate variations, our total revenues increased inthe second quarter of fiscal 2017 due to growth in our cloud and on-premise software revenues, which was attributable to growth in our SaaS, PaaS and IaaSrevenues, growth in our software license updates and product support revenues, and revenue contributions from our recent acquisitions and was partially offset bydecreases in our new software licenses revenues. The increase in our cloud and on-premise software business’ revenues was partially offset by a constant currencydecrease in our hardware business’ revenues. Excluding the effects of currency rate fluctuations, the EMEA and Asia Pacific regions contributed to the growth inour total revenues during the second quarter of fiscal 2017, while the Americas region was flat.
Excluding the effects of foreign currency rate variations, our total operating expenses were flat during the second quarter of fiscal 2017 relative to the prior yearperiod. We incurred certain expense increases during the second quarter of fiscal 2017 including higher sales and marketing and research and developmentexpenses due primarily to increased headcount, increased cloud SaaS, PaaS and IaaS expenses resulting primarily from increased headcount and infrastructureexpenses to support the increase in our cloud SaaS, PaaS and IaaS revenues, and higher general and administrative expenses due primarily to higher third partylegal fees. These constant currency expense increases in the second quarter of fiscal 2017 were offset by decreased hardware products expenses due to lowerhardware products revenues, decreased software support and hardware support costs due primarily to lower headcount and decreased expenses associated withcertain of our intangible assets that became fully amortized.
In constant currency, our total operating margin and total operating margin as a percentage of revenues increased during the second quarter of fiscal 2017 due to theincrease in our total revenues.
FirstHalfFiscal2017ComparedtoFirstHalfFiscal2016: Excluding the effects of unfavorable currency rate variations, our total revenues increased in thefirst half of fiscal 2017 due to growth in our cloud and on-premise software revenues, which was attributable to similar reasons as those noted above, and waspartially offset by decreases in our hardware business’ and services business’ revenues. In constant currency, the Americas region contributed 30%, the EMEAregion contributed 32% and the Asia Pacific region contributed 38% to the growth in our total revenues during the first half of fiscal 2017.
Excluding the effects of favorable currency rate variations, our total operating expenses increased during the first half of fiscal 2017. Our constant currency salesand marketing, research and development, cloud SaaS, PaaS and IaaS, and general and administrative expenses increased during the first half of fiscal 2017, allgenerally for similar reasons as noted above, and were partially offset by lower hardware products expenses, software support expenses, hardware support expensesand intangible asset amortization, which were also generally attributable to the reasons noted above.
In constant currency, our total operating margin and total operating margin as a percentage of revenues increased during the first half of fiscal 2017 due to theincrease in our total revenues.
Supplemental Disclosure Related to Certain Charges
To supplement our consolidated financial information, we believe that the following information is helpful to an overall understanding of our past financialperformance and prospects for the future. You should review the introduction under “Impact of Acquisitions” (above) for a discussion of the inherent limitations incomparing pre- and post-acquisition information.
35
Table of Contents
Our operating results included the following business combination accounting adjustments and expenses related to acquisitions, as well as certain other expenseand income items:
Three Months Ended
November 30, Six Months Ended
November 30, (in millions) 2016 2015 2016 2015 Cloud software as a service and platform as a service deferred revenues $ 34 $ 3 $ 52 $ 4 Software license updates and product support deferred revenues 1 — 1 1 Hardware support deferred revenues — — — 1 Acquired deferred sales commissions amortization (9) — (9) — Amortization of intangible assets 302 423 613 875 Acquisition related and other 40 (7) 54 25 Restructuring 86 95 185 178 Stock-based compensation 316 254 635 504 Income tax effects (228) (230) (486) (451)
$ 542 $ 538 $ 1,045 $ 1,137
In connection with our acquisitions, we have estimated the fair values of the cloud SaaS and PaaS subscriptions, software support and hardware support obligations assumed. Due to our application of
business combination accounting rules, we did not recognize the cloud SaaS and PaaS, software license updates and product support and hardware support revenue amounts as presented in the above tablethat would have otherwise been recorded by the acquired businesses as independent entities upon delivery of the contractual obligations. To the extent customers to which these contractual obligations pertainrenew these contracts with us, we expect to recognize revenues for the full contracts’ values over the respective contracts’ renewal periods.
Certain acquired companies capitalized sales commissions associated with subscription agreements and amortized these amounts over the related contractual terms. Business combination accounting rulesgenerally require us to eliminate these capitalized sales commissions balances as of the acquisition date and our post-combination GAAP sales and marketing expenses generally do not reflect theamortization of these deferred sales commissions balances. This adjustment is intended to include, and thus reflect, the full amount of amortization related to such balances as though the acquired companiesoperated independently in the periods presented.
Represents the amortization of intangible assets, substantially all of which were acquired in connection with our acquisitions. As of November 30, 2016, estimated future amortization expenses related tointangible assets were as follows (in millions):
Acquisition related and other expenses primarily consist of personnel related costs and stock-based compensation expenses for transitional and certain other employees, integration related professionalservices, certain business combination adjustments including certain adjustments after the measurement period has ended and certain other operating items, net.
Restructuring expenses during the first half of fiscal 2017 primarily related to employee severance in connection with our Fiscal 2017 Oracle Restructuring Plan (2017 Restructuring Plan). Restructuringexpenses during the first half of fiscal 2016 primarily related to costs incurred pursuant to our 2015 Oracle Restructuring Plan (2015 Restructuring Plan). Additional information regarding certain of ourrestructuring plans is provided in Note 7 of Notes to Condensed Consolidated Financial Statements included elsewhere in this Quarterly Report and in Note 9 of Notes to Consolidated Financial Statementsincluded in our Annual Report on Form 10-K for the fiscal year ended May 31, 2016.
36
(1)
(1)
(1)
(2)
(3)
(4)(6)
(5)
(6)
(7)
(1)
(2)
(3)
(4)
(5)
Table of Contents
Stock-based compensation was included in the following operating expense line items of our condensed consolidated statements of operations (in millions):
Three Months Ended
November 30, Six Months Ended
November 30, 2016 2015 2016 2015 Sales and marketing $ 68 $ 55 $ 133 $ 107 Cloud software as a service and platform as a service 6 4 11 8 Cloud infrastructure as a service 1 1 2 2 Software license updates and product support 6 6 12 12 Hardware products 2 2 4 3 Hardware support 1 1 2 3 Services 9 7 17 14 Research and development 188 151 382 298 General and administrative 35 27 72 57
Subtotal 316 254 635 504 Acquisition related and other 11 — 11 3
The income tax effects presented were calculated as if the above described charges were not included in our results of operations for each of the respective periods presented. Income tax effects for thesecond quarter and first half of fiscal 2017 were calculated based on the applicable jurisdictional tax rates applied to the items within the table above and resulted in effective tax rates of 25.5% and 25.5%,respectively, instead of 24.3% and 23.6%, respectively, which represented our effective tax rates as derived per our condensed consolidated statements of operations, primarily due to the net tax effects ofacquisition related items, including the tax effects of amortization of intangible assets and the net tax effects of stock-based compensation. Income tax effects for the second quarter and first half of fiscal2016 were calculated reflecting effective tax rates of 20.4% and 22.6%, respectively, instead of 17.6% and 20.8%, respectively, which represented our effective tax rates as derived per our condensedconsolidated statements of operations, primarily due to the net tax effects of acquisition related items, including the tax effects of amortization of intangible assets.
Cloud and On-Premise Software Business
Our cloud and on-premise software business consists of our cloud software and on-premise software segment, our cloud IaaS segment and our software licenseupdates and product support segment.
CloudSoftwareandOn-PremiseSoftware: Our cloud software and on-premise software segment engages in the sale, marketing and delivery of our cloudsoftware offerings, including our cloud SaaS and PaaS offerings, and the licensing of our software for on-premise IT environments. Our cloud SaaS and PaaSofferings grant customers access to a broad range of our application and platform software technologies on a subscription basis in a secure, standards-based, cloudcomputing environment that generally includes access, hosting, infrastructure management, the use of software updates, and support. New software licensesrevenues represent fees earned from granting customers licenses to use our database and middleware and our application software products within on-premise ITenvironments. We continue to place significant emphasis, both domestically and internationally, on direct sales through our own sales force. We also continue tomarket our products through indirect channels. Costs associated with our cloud software and on-premise software segment are included in sales and marketingexpenses, cloud SaaS and PaaS expenses and amortization of intangible assets. These costs are largely personnel related and include commissions earned by oursales force for the sale of our software offerings, marketing program costs, the cost of providing our cloud SaaS and PaaS offerings and the amortization ofintangible assets including developed technology, customer contracts and customer relationship intangibles.
37
(6)
(7)
Table of Contents
Three Months Ended November 30, Six Months Ended November 30, Percent Change Percent Change (Dollars in millions) 2016 Actual Constant 2015 2016 Actual Constant 2015 CloudSoftwareandOn-PremiseSoftwareRevenues: Americas $ 1,175 2% 2% $ 1,157 $ 2,223 7% 8% $ 2,072 EMEA 572 -6% -1% 605 1,031 2% 7% 1,006 Asia Pacific 478 20% 17% 399 798 17% 13% 685
Total revenues 2,225 3% 4% 2,161 4,052 8% 8% 3,763 Expenses: Cloud software as a service and platform as a service 355 29% 31% 276 669 22% 24% 547 Sales and marketing 1,666 1% 2% 1,648 3,295 7% 8% 3,092 Stock-based compensation 69 22% 22% 56 133 22% 22% 108 Amortization of intangible assets 221 6% 6% 209 423 -2% -2% 430
Total expenses 2,311 6% 6% 2,189 4,520 8% 9% 4,177
TotalMargin% -4% -1% -12% -11% %RevenuesbyGeography: Americas 53% 54% 55% 55% EMEA 26% 28% 25% 27% Asia Pacific 21% 18% 20% 18% RevenuesbySoftwareOfferings: Cloud software as a service and platform as a service $ 878 81% 83% $ 484 $ 1,675 79% 81% $ 934 New software licenses 1,347 -20% -19% 1,677 2,377 -16% -15% 2,829
Total cloud software and on-premise software revenues $ 2,225 3% 4% $ 2,161 $ 4,052 8% 8% $ 3,763
%RevenuesbySoftwareOfferings: Cloud software as a service and platform as a service 39% 22% 41% 25% New software licenses 61% 78% 59% 75%
Excluding stock-based compensation
Included as a component of ‘Amortization of Intangible Assets’ in our condensed consolidated statements of operations
Excluding the effects of currency rate fluctuations, total revenues from our cloud software and on-premise software segment increased by 4 and 8 percentage pointsin the second quarter and first half of fiscal 2017, respectively, relative to the corresponding prior year periods due to growth in our cloud SaaS and PaaS revenuesand revenue contributions from our recent acquisitions, and were partially offset by decreases in our new software licenses revenues. The increases in our cloudSaaS and PaaS revenues and decreases in our new software licenses revenues during the fiscal 2017 periods presented were primarily due to the continued strategicemphasis placed on selling, marketing and growing our cloud software offerings and we expect these revenue trends will continue. For the second quarter of fiscal2017, the Americas and Asia Pacific regions contributed to the constant currency growth in our total revenues for this segment and were partially offset by a slightdecline in revenues in the EMEA region. For the first half of fiscal 2017, the Americas, EMEA and Asia Pacific regions contributed 49%, 23%, and 28%,respectively, to the constant currency growth in our total revenues for this segment.
In reported currency, new software licenses revenues earned from transactions of $3 million or greater decreased by 17% and 11% in the second quarter and firsthalf of fiscal 2017, respectively, and represented 26% and 24% of our new software licenses revenues in the second quarter and first half of fiscal 2017,respectively, in comparison to 25% and 23% in the second quarter and first half of fiscal 2016, respectively.
In constant currency, total cloud software and on-premise software expenses increased in the fiscal 2017 periods presented primarily due to higher employee relatedexpenses from increased headcount and higher cloud SaaS and PaaS expenses incurred to support the related revenues increases.
Excluding the effects of currency rate fluctuations, our cloud software and on-premise software segment’s total margin and total margin as a percentage of revenuesdecreased in the fiscal 2017 periods presented as our total expenses grew at a faster rate than our total revenues for this segment.
38
(1)(1)
(2)
(1)
(2)
Table of Contents
CloudInfrastructureasaService: Our cloud IaaS segment includes Oracle Cloud IaaS and Oracle Managed Cloud Services offerings. Oracle Cloud IaaSprovides infrastructure cloud services that are enterprise-grade, hosted and supported within the Oracle Cloud to perform elastic compute, storage and networkingservices on a subscription basis. Oracle Managed Cloud Services are comprehensive software and hardware management and maintenance services for customer ITinfrastructure for a fee for a stated term that are hosted at our Oracle data center facilities, select partner data centers or physically on-premise at customer facilities.Our cloud IaaS segment’s expenses consist primarily of personnel related expenditures, technology infrastructure expenditures and facilities costs. Operatingexpenses associated with our IaaS offerings also include sales and marketing expenses, which are largely personnel related, and amortization of intangible assets.For the fiscal 2016 periods presented, our cloud IaaS segment’s revenues and expenses were substantially attributable to our Oracle Managed Cloud Servicesofferings.
Three Months Ended November 30, Six Months Ended November 30,
Included as a component of ‘Amortization of Intangible Assets’ in our condensed consolidated statements of operations
Excluding the effects of unfavorable currency rate fluctuations, our total cloud IaaS segment revenues increased in the fiscal 2017 periods presented due to growthin our Oracle Cloud IaaS offerings. Excluding the effects of currency rate fluctuations, the Americas region contributed 31% and 55%, respectively, the EMEAregion contributed 41% and 23%, respectively, and the Asia Pacific region contributed 28% and 22%, respectively, to the increases in our total cloud IaaS segmentrevenues during the second quarter and first half of fiscal 2017, respectively.
On a constant currency basis, our cloud IaaS segment’s total expenses increased during the fiscal 2017 periods presented primarily due to higher technologyinfrastructure expenses to support the increase in our cloud IaaS revenues.
Excluding the effects of currency rate fluctuations, total margin and total margin as a percentage of total revenues decreased during the fiscal 2017 periodspresented as total expenses increased at a faster rate than our total revenues for this segment.
SoftwareLicenseUpdatesandProductSupport: Software license updates and product support revenues are typically generated through the sale of softwaresupport contracts related to on-premise new software licenses purchased by our customers. Our software license updates and product support offerings includesoftware license updates, which grant on-premise software customers rights to unspecified product upgrades and maintenance releases and patches released duringthe support period, and product support including internet access to
39
(1)
(1)
(2)
(1)
(2)
Table of Contents
technical content as well as internet and telephone access to technical support personnel in our global support centers. Expenses associated with our softwarelicense updates and product support line of business include the cost of providing the support services, largely personnel related expenses, and the amortization ofour intangible assets associated with software support contracts and customer relationships obtained from acquisitions. Three Months Ended November 30, Six Months Ended November 30,
Included as a component of ‘Amortization of Intangible Assets’ in our condensed consolidated statements of operations
Excluding the effects of currency rate fluctuations, software license updates and product support revenues increased in the fiscal 2017 periods presented as a resultof substantially all customers electing to purchase software support contracts in conjunction with their new software licenses purchased during the trailing 4-quarterperiod, and due to the renewal of substantially all of the software support customer base eligible for renewal during the trailing 4-quarter period. Excluding theeffects of currency rate fluctuations, the Americas region contributed 40% and 41%, respectively, the EMEA region contributed 28% and 28%, respectively, andthe Asia Pacific region contributed 32% and 31%, respectively, to the increase in software license updates and product support revenues during the second quarterand first half of fiscal 2017, respectively.
In constant currency, total software license updates and product support expenses decreased during the fiscal 2017 periods presented due primarily to loweremployee related expenses resulting from lower headcount and a reduction in expenses associated with certain of our intangible assets that became fully amortized.
In constant currency, total margin and margin as a percentage of revenues increased during the fiscal 2017 periods presented due to the growth in total revenues andthe decrease in total expenses for this segment.
40
(1)
(2)
(1)
(2)
Table of Contents
Hardware Business
Our hardware business consists of our hardware products segment and hardware support segment.
HardwareProducts: Hardware products revenues are primarily generated from the sales of our Oracle Engineered Systems, computer server, storage,networking, workstations and related devices and industry-specific hardware products. We market and sell our hardware products through our direct sales force andindirect channels such as independent distributors and value-added resellers. Operating expenses associated with our hardware products include the cost ofhardware products, which consists of expenses for materials and labor used to produce these products by our internal manufacturing operations or by third partymanufacturers, warranty expenses and the impact of periodic changes in inventory valuation, including the impact of inventory determined to be excess andobsolete. Operating expenses associated with our hardware products also include sales and marketing expenses, which are largely personnel related and includevariable compensation earned by our sales force for the sales of our hardware products, and amortization of intangible assets. Three Months Ended November 30, Six Months Ended November 30, Percent Change Percent Change (Dollars in millions) 2016 Actual Constant 2015 2016 Actual Constant 2015 HardwareProductsRevenues: Americas $ 235 -23% -22% $ 304 $ 475 -21% -21% $ 602 EMEA 148 -2% 3% 151 271 -12% -8% 309 Asia Pacific 114 -3% -4% 118 213 -8% -9% 231
Included as a component of ‘Amortization of Intangible Assets’ in our condensed consolidated statements of operations
Excluding the effects of currency rate fluctuations, total hardware products revenues decreased in the fiscal 2017 periods presented primarily due to reductions insales volumes of certain of our product lines, including lower margin products, partially offset by growth in certain of our Oracle Engineered Systems. On aconstant currency basis, hardware products revenues generally declined across all regions during the fiscal 2017 periods presented with the exception of the EMEAregion during the second quarter of fiscal 2017, which grew modestly.
Excluding the effects of currency rate fluctuations, total hardware products expenses decreased in the fiscal 2017 periods presented due primarily to lower hardwareproducts costs associated with lower hardware products revenues, and due to a reduction in expenses associated with certain of our intangible assets that becamefully amortized.
For the second quarter of fiscal 2017, total margin and total margin as a percentage of revenues for this segment increased on a constant currency basis primarilydue to the total expense reductions for this segment. For the first half of fiscal 2017, total margin and total margin as a percentage of revenues for this segmentdecreased on a constant currency basis primarily due to the decrease in our total revenues for this segment.
41
(1)
(1)
(2)
(1)
(2)
Table of Contents
HardwareSupport: Our hardware support offerings provide customers with software updates for software components that are essential to the functionality ofour hardware products, such as Oracle Solaris and certain other software, and can include product repairs, maintenance services and technical support services.Expenses associated with our hardware support operating segment include the cost of materials used to repair customer products, the cost of providing supportservices, largely personnel related expenses, and the amortization of our intangible assets primarily associated with hardware support contracts and customerrelationships obtained from our acquisitions. Three Months Ended November 30, Six Months Ended November 30, Percent Change Percent Change (Dollars in millions) 2016 Actual Constant 2015 2016 Actual Constant 2015 HardwareSupportRevenues: Americas $ 275 -5% -5% $ 291 $ 561 -4% -3% $ 582 EMEA 147 -12% -7% 165 298 -12% -7% 337 Asia Pacific 95 2% -2% 94 192 1% -2% 189
Included as a component of ‘Amortization of Intangible Assets’ in our condensed consolidated statements of operations
Excluding the effects of currency rate fluctuations, hardware support revenues decreased in the fiscal 2017 periods presented primarily due to reductions in salesvolumes of certain of our hardware product lines for which we offer hardware support. On a constant currency basis, hardware support revenues declined across allregions during the fiscal 2017 periods presented.
Excluding the effects of currency rate fluctuations, total hardware support expenses decreased in the fiscal 2017 periods presented primarily due to lower employeerelated expenses resulting from lower headcount and a reduction in expenses associated with certain of our intangible assets that became fully amortized.
In constant currency, total hardware support margin and margin as a percentage of total revenues increased in the fiscal 2017 periods presented primarily due to thetotal expense reductions for this segment.
Services Business
Our services business consists of consulting, advanced customer support services and education services. Consulting revenues are earned by providing services tocustomers in business and IT strategy alignment, enterprise architecture planning and design, initial software implementation and integration, and ongoing softwareenhancements and upgrades. Advanced customer support services are provided on-premise and remotely to our customers to enable increased performance andhigher availability of their Oracle products and services and also include certain other services. Education revenues are earned by providing instructor-led, livevirtual training, self-paced online training, private events and custom training in the use of our cloud, on-premise software and hardware offerings. The cost ofproviding our services consists primarily of personnel related expenses, technology infrastructure expenditures, facilities expenses and external contractorexpenses.
42
(1)
(2)
(1)
(2)
Table of Contents
Three Months Ended November 30, Six Months Ended November 30, Percent Change Percent Change (Dollars in millions) 2016 Actual Constant 2015 2016 Actual Constant 2015 ServicesRevenues: Americas $ 426 -3% -2% $ 438 $ 839 -5% -4% $ 882 EMEA 254 -3% 3% 263 491 -5% 1% 515 Asia Pacific 164 2% -1% 160 322 -1% -5% 327
Included as a component of ‘Amortization of Intangible Assets’ in our condensed consolidated statements of operations
FiscalSecondQuarter2017ComparedtoFiscalSecondQuarter2016:Excluding the effects of currency rate fluctuations, our total services revenues were flatin the second quarter of fiscal 2017. Constant currency increases in our consulting and advanced customer services revenues during the second quarter of fiscal2017, which were primarily attributable to revenue contributions from our recent acquisitions were, offset by decreases in our education revenues. On a constantcurrency basis, services revenues growth in the EMEA region during the second quarter of fiscal 2017 was offset by services revenues declines in the Americas andAsia Pacific regions.
In constant currency, total services expenses increased during the second quarter of fiscal 2017 primarily due to a modest increase in expenses associated with ourconsulting segment, which were primarily attributable to expense contributions from our recent acquisitions.
In constant currency, total services margin and total margin as a percentage of total services revenues decreased in the second quarter of fiscal 2017 primarily dueto the increase in total expenses associated with this segment.
FirstHalfFiscal2017ComparedtoFirstHalfFiscal2016:Excluding the effects of currency rate fluctuations, our total services revenues declined in the firsthalf of fiscal 2017 primarily due to decreases in our consulting and education revenues, partially offset by increases in our advanced customer support revenues andrevenue contributions from our recent acquisitions. On a constant currency basis, services revenues growth in the EMEA region during the first half of fiscal 2017was offset by services revenue declines in the Americas and Asia Pacific regions.
In constant currency, our total services expenses increased in the first half of fiscal 2017 primarily due to a $30 million charge, which was recorded in the firstquarter of fiscal 2017 and not expected to recur.
In constant currency, total services margin and total margin as a percentage of total services revenues decreased during the first half of fiscal 2017 due to thedecrease in total revenues and due to the aforementioned increase in expenses attributable to a non-recurring charge.
As of our most recent annual goodwill impairment review date of March 1, 2016, our consulting reporting unit’s fair value was 11% in excess of its carrying value.As of March 1, 2016, we estimated that should our consulting reporting unit’s projected margins and related cash flows unfavorably deviate from our projectionsby 20% or
43
(1)
(2)
(1)
(2)
Table of Contents
more each year, our consulting reporting unit likely could incur a goodwill impairment loss. We continue to monitor the performance of and projections for all ofour reporting units. We did not record any goodwill impairment losses during any of the fiscal 2017 and 2016 periods presented.
ResearchandDevelopmentExpenses: Research and development expenses consist primarily of personnel related expenditures. We intend to continue to investsignificantly in our research and development efforts because, in our judgment, they are essential to maintaining our competitive position. Three Months Ended November 30, Six Months Ended November 30,
2016 Percent Change
2015
2016 Percent Change
2015 (Dollars in millions) Actual Constant Actual Constant Research and development $ 1,322 2% 3% $ 1,293 $ 2,648 4% 5% $ 2,536 Stock-based compensation 188 24% 24% 151 382 28% 28% 298
On a constant currency basis, total research and development expenses increased during the fiscal 2017 periods presented primarily due to increased employeerelated expenses resulting from increased headcount, including additional headcount from our recent acquisitions, and higher stock-based compensation.
GeneralandAdministrativeExpenses: General and administrative expenses primarily consist of personnel related expenditures for IT, finance, legal and humanresources support functions. Three Months Ended November 30, Six Months Ended November 30,
2016 Percent Change
2015
2016 Percent Change
2015 (Dollars in millions) Actual Constant Actual Constant General and administrative $ 268 4% 6% $ 258 $ 546 12% 15% $ 485 Stock-based compensation 35 27% 27% 27 72 28% 28% 57
On a constant currency basis, total general and administrative expenses during the fiscal 2017 periods presented increased due primarily to higher professionalservices expenses, primarily legal related expenses, and higher stock-based compensation.
AmortizationofIntangibleAssets: Substantially all of our intangible assets are acquired through our business combinations. We amortize our intangible assetsover, and monitor the appropriateness of, the estimated useful lives of these assets. We also periodically review these intangible assets for potential impairmentbased upon relevant facts and circumstances. Note 5 of Notes to Condensed Consolidated Financial Statements included elsewhere in this Quarterly Report hasadditional information regarding our intangible assets and related amortization.
Three Months Ended November 30, Six Months Ended November 30,
2016 Percent Change
2015
2016 Percent Change
2015 (Dollars in millions) Actual Constant Actual Constant Developed technology $ 144 6% 6% $ 136 $ 280 -4% -4% $ 293 Software support agreements and related relationships 31 -69% -69% 101 63 -69% -69% 204 SaaS, PaaS and IaaS agreements and related relationships 85 57% 57% 54 148 38% 38% 107 Customer relationships and contract backlog 9 -84% -84% 58 36 -71% -71% 123 Hardware support agreements and related relationships 12 -67% -67% 36 38 -47% -47% 72 Trademarks and other 21 -45% -45% 38 48 -37% -37% 76
Total amortization of intangible assets $ 302 -29% -29% $ 423 $ 613 -30% -30% $ 875
44
(1)
(1)
(1)
(1)
Table of Contents
Amortization of intangible assets decreased during the fiscal 2017 periods presented due to a reduction in expenses associated with certain of our intangible assetsthat became fully amortized, partially offset by additional amortization from intangible assets that we acquired in connection with our recent acquisitions.
AcquisitionRelatedandOtherExpenses: Acquisition related and other expenses consist of personnel related costs and stock-based compensation fortransitional and certain other employees, integration related professional services, certain business combination adjustments including certain adjustments after themeasurement period has ended and certain other operating items, net. Three Months Ended November 30, Six Months Ended November 30,
2016 Percent Change
2015
2016 Percent Change
2015 (Dollars in millions) Actual Constant Actual Constant Transitional and other employee related costs $ 8 -2% -2% $ 8 $ 16 -51% -49% $ 33 Stock-based compensation 11 * * — 11 266% 266% 3 Professional fees and other, net 22 418% 423% 4 27 219% 224% 9 Business combination adjustments, net (1) 92% 92% (19) — 99% 99% (20)
Total acquisition related and other expenses $ 40 713% 707% $ (7) $ 54 121% 130% $ 25
* Not meaningful
On a constant currency basis, the increase in acquisition related and other expenses during the fiscal 2017 periods presented was primarily due to higher stockcompensation expenses as a result of our acquisition of NetSuite and higher professional fees. In addition, in the second quarter of fiscal 2016, we recognized anacquisition related benefit of $19 million which decreased acquisition related and other expenses during the fiscal 2016 periods presented.
RestructuringExpenses: Restructuring expenses resulted from the execution of management approved restructuring plans that were generally developed toimprove our cost structure and/or operations, often in conjunction with our acquisition integration strategies. Restructuring expenses consist of employee severancecosts and may also include charges for duplicate facilities and other contract termination costs to improve our cost structure prospectively. For additionalinformation regarding our restructuring plans, see Note 7 of Notes to Condensed Consolidated Financial Statements included elsewhere in this Quarterly Reportand Note 9 of Notes to Consolidated Financial Statements included in our Annual Report on Form 10-K for the fiscal year ended May 31, 2016.
Three Months Ended November 30, Six Months Ended November 30,
2016 Percent Change
2015
2016 Percent Change
2015 (Dollars in millions) Actual Constant Actual Constant Restructuring expenses $ 86 -10% -5% $ 95 $ 185 4% 8% $ 178
Restructuring expenses in the fiscal 2017 periods presented primarily related to our 2017 Restructuring Plan. Restructuring expenses in the fiscal 2016 periodspresented primarily related to our 2015 Restructuring Plan, which is complete. Our management approved, committed to and initiated these plans in order torestructure and further improve efficiencies in our operations. The total estimated restructuring costs associated with the 2017 Restructuring Plan are up to $502million and will be recorded to the restructuring expense line item within our consolidated statements of operations as they are incurred. The total estimatedremaining restructuring costs associated with the 2017 Restructuring Plan were approximately $300 million as of November 30, 2016 and the majority of theremaining costs are expected to be incurred through the end of fiscal 2018. Our estimated costs are subject to change in future periods.
InterestExpense:
Three Months Ended November 30, Six Months Ended November 30,
2016 Percent Change
2015
2016 Percent Change
2015 (Dollars in millions) Actual Constant Actual Constant Interest expense $ 451 22% 22% $ 371 $ 867 16% 16% $ 745
45
Table of Contents
Interest expense increased in the fiscal 2017 periods presented primarily due to higher average borrowings resulting from our issuance of $14.0 billion of seniornotes in July 2016. This increase in interest expense during the fiscal 2017 periods presented was partially offset by reductions in interest expense resulting fromthe maturity and repayment of $2.0 billion of senior notes in January 2016. See Recent Financing Activities below and Note 6 of Notes to Condensed ConsolidatedFinancial Statements included elsewhere in this Quarterly Report for additional information regarding our fiscal 2017 borrowings.
Non-OperatingIncome,net: Non-operating income, net consists primarily of interest income, net foreign currency exchange gains (losses), the noncontrollinginterests in the net profits of our majority-owned subsidiaries (primarily Oracle Financial Services Software Limited and Oracle Japan) and net other income(losses), including net realized gains and losses related to all of our investments and net unrealized gains and losses related to the small portion of our investmentportfolio that we classify as trading. Three Months Ended November 30, Six Months Ended November 30,
2016 Percent Change
2015
2016 Percent Change
2015 (Dollars in millions) Actual Constant Actual Constant Interest income $ 204 66% 66% $ 123 $ 381 59% 60% $ 240 Foreign currency losses, net (69) 153% 200% (28) (82) 56% 73% (53) Noncontrolling interests in income (41) 40% 40% (29) (76) 28% 28% (59) Other income (loss), net 5 -70% -70% 18 24 267% 268% (14)
Total non-operating income, net $ 99 17% 2% $ 84 $ 247 118% 114% $ 114
On a constant currency basis, our non-operating income, net for the fiscal 2017 periods presented increased primarily due to higher interest income resulting fromhigher cash, cash equivalent and short-term investment balances and higher interest rates, partially offset by higher foreign currency losses, net.
ProvisionforIncomeTaxes: Our effective tax rate in all periods is the result of the mix of income earned in various tax jurisdictions that apply a broad range ofincome tax rates. The provision for income taxes differs from the tax computed at the U.S. federal statutory income tax rate due primarily to certain earningsconsidered as indefinitely reinvested in foreign operations, state taxes, the U.S. research and development tax credit, settlements with tax authorities and the U.S.domestic production activity deduction. In addition, beginning in fiscal 2017, the provision for income taxes also differs from the tax computed at the U.S. federalstatutory tax rate due to tax effects of stock-based compensation (refer to Note 1 of Notes to Condensed Consolidated Financial Statements included elsewhere inthis Quarterly Report for additional discussion). Future effective tax rates could be adversely affected if earnings are lower than anticipated in countries where wehave lower statutory tax rates, by unfavorable changes in tax laws and regulations or by adverse rulings in tax related litigation, among others. Three Months Ended November 30, Six Months Ended November 30,
2016 Percent Change
2015
2016 Percent Change
2015 (Dollars in millions) Actual Constant Actual Constant Provision for income taxes $ 653 39% 39% $ 471 $ 1,194 16% 15% $ 1,033
Effectivetaxrate 24.3% 17.6% 23.6% 20.8%
FiscalSecondQuarter2017ComparedtoFiscalSecondQuarter2016:Provision for income taxes in the second quarter of fiscal 2017 increased relative to thecorresponding prior year period due in substantial part to the effects of settlements with tax authorities in the second quarter of fiscal 2016, which was not presentin the second quarter of fiscal 2017, as well as an unfavorable jurisdictional mix of earnings in the second quarter of fiscal 2017 relative to fiscal 2016. Theseunfavorable impacts to our second quarter of fiscal 2017 provision for income taxes were partially offset by the permanent extension of the U.S. research anddevelopment credit in fiscal 2017, which was not available in fiscal 2016.
FirstHalfFiscal2017ComparedtoFirstHalfFiscal2016:Provision for income taxes in the first half of fiscal 2017 increased relative to the correspondingprior year period due in substantial part to effects of settlements with tax authorities in the second quarter of fiscal 2016, which was not present in the first half offiscal 2017, as well as an unfavorable jurisdictional mix of earnings in the first half of fiscal 2017 relative to the first half of fiscal 2016. In addition, the increase inour provision for income taxes during the first half of fiscal
46
Table of Contents
2017 was partially offset by the favorable impact of the permanent extension of the U.S. research and development credit and excess tax benefits recognized forstock-based compensation expense in fiscal 2017, which were not available in fiscal 2016.
Liquidity and Capital Resources
(Dollars in millions) November 30,
2016 Change May 31,
2016 Working capital $ 48,387 3% $ 47,105 Cash, cash equivalents and marketable securities $ 58,206 4% $ 56,125
Workingcapital: The increase in working capital as of November 30, 2016 in comparison to May 31, 2016 was primarily due to our issuance of $14.0 billion oflong-term senior notes in July 2016, the favorable impacts to our net current assets resulting from our net income during the first half of fiscal 2017 and cashproceeds from stock option exercises. These favorable working capital movements were partially offset by cash used for acquisitions, including our $9.1 billionacquisition of NetSuite in the second quarter of fiscal 2017, cash used for repurchases of our common stock, cash used to pay dividends to our stockholders andcash used for capital expenditures. Our working capital may be impacted by some or all of the aforementioned factors in future periods, the amounts and timing ofwhich are variable.
Cash,cashequivalentsandmarketablesecurities: Cash and cash equivalents primarily consist of deposits held at major banks, Tier-1 commercial paper andother securities with original maturities of 90 days or less. Marketable securities consist of Tier-1 commercial paper debt securities, corporate debt securities andcertain other securities. The increase in cash, cash equivalents and marketable securities at November 30, 2016 in comparison to May 31, 2016 was primarily due tocash inflows generated by our operations during the first half of fiscal 2017, $10.2 billion of cash inflows, net of repayments, from fiscal 2017 debt issuances, andcash inflows from stock option exercises. These cash inflows were partially offset by cash outflows for acquisitions, including our acquisition of NetSuite,repurchases of our common stock, payments of cash dividends to our stockholders and cash used for capital expenditures. Cash, cash equivalents and marketablesecurities included $51.1 billion held by our foreign subsidiaries as of November 30, 2016, a significant portion of which was generated from the earnings of theseforeign subsidiaries that we consider as indefinitely reinvested in our foreign operations outside the United States. These undistributed earnings that are consideredas indefinitely reinvested overseas would be subject to U.S. income tax if repatriated to the United States. The amount of cash, cash equivalents and marketablesecurities that we report in U.S. Dollars for a significant portion of the cash, cash equivalents and marketable securities balances held by our foreign subsidiaries issubject to translation adjustments caused by changes in foreign currency exchange rates as of the end of each respective reporting period (the offset to which issubstantially recorded to accumulated other comprehensive loss in our consolidated balance sheets and is also presented as a line item in our condensedconsolidated statements of comprehensive income included elsewhere in this Quarterly Report). As the U.S. Dollar strengthened against certain major internationalcurrencies during the first half of fiscal 2017, the amount of cash, cash equivalents and marketable securities that we reported in U.S. Dollars for these subsidiariesdecreased on a net basis as of November 30, 2016 relative to what we would have reported using constant currency rates from our May 31, 2016 balance sheet date.
Days sales outstanding, which we calculate by dividing period end accounts receivable by average daily sales for the quarter, was 37 days at November 30, 2016compared with 46 days at May 31, 2016. The days sales outstanding calculation excludes the impact of any revenue adjustments resulting from businesscombinations that reduced our acquired cloud SaaS and PaaS obligations, software license updates and product support obligations and hardware supportobligations to fair value. The decline in days sales outstanding was primarily due to strong collections in our first half of fiscal 2017 and seasonality resulting in alarge volume of software license, hardware products and software support balances outstanding as of May 31, 2016. Six Months Ended November 30, (Dollars in millions) 2016 Change 2015 Net cash provided by operating activities $ 6,961 9% $ 6,397 Net cash used for investing activities $ (14,920) 347% $ (3,338) Net cash provided by (used for) financing activities $ 6,739 195% $ (7,066)
47
Table of Contents
Cashflowsfromoperatingactivities: Our largest source of operating cash flows is cash collections from our customers following the purchase and renewal oftheir software license updates and product support agreements. Payments from customers for these support agreements are generally received near the beginning ofthe contracts’ terms, which are generally one year in length. Over the course of a fiscal year, we also have historically generated cash from the sales of newsoftware licenses, cloud SaaS, PaaS and IaaS offerings, hardware products, hardware support arrangements and services. Our primary uses of cash from operatingactivities are for employee related expenditures, material and manufacturing costs related to the production of our hardware products, taxes and leased facilities.
Net cash provided by operating activities increased during the first half of fiscal 2017 due primarily to favorable working capital movements during the first half offiscal 2017 including less cash used to settle accrued liabilities and income taxes, each in relation to the corresponding movements in the first half of fiscal 2016.
Cashflowsfrominvestingactivities: The changes in cash flows from investing activities primarily relate to our acquisitions, the timing of our purchases,maturities and sales of our investments in marketable debt securities and investments in capital and other assets, including certain intangible assets, to support ourgrowth.
Net cash used for investing activities increased in the first half of fiscal 2017 relative to the first half of fiscal 2016 primarily due to an increase in cash used foracquisitions, net of cash acquired, an increase in cash used to purchase marketable securities and other investments, net of proceeds received from sales andmaturities, and increased capital expenditures primarily related to real estate purchases.
Cashflowsfromfinancingactivities: The changes in cash flows from financing activities primarily relate to borrowings and repayments related to our debtinstruments as well as stock repurchases, dividend payments and net proceeds related to employee stock programs.
Net cash provided by financing activities in the first half of fiscal 2017 was $6.7 billion in comparison to net cash used for financing activities of $7.1 billion duringthe first half of fiscal 2016. The change in financing activities cash flows during the first half of fiscal 2017 in comparison to the corresponding prior year periodwas primarily related to borrowing activities, net of debt repayments, for which we received $10.2 billion of net cash proceeds during the first half of fiscal 2017(no debt issuances or repayments were made during the first half of fiscal 2016).
Freecashflow: To supplement our statements of cash flows presented on a GAAP basis, we use non-GAAP measures of cash flows on a trailing 4-quarter basisto analyze cash flows generated from our operations. We believe free cash flow is also useful as one of the bases for comparing our performance with ourcompetitors. The presentation of non-GAAP free cash flow is not meant to be considered in isolation or as an alternative to net income as an indicator of ourperformance, or as an alternative to cash flows from operating activities as a measure of liquidity. We calculate free cash flow as follows: Trailing 4-Quarters Ended November 30, (Dollars in millions) 2016 Change 2015 Net cash provided by operating activities $ 14,249 9% $ 13,113 Capital expenditures (1,604) 0% (1,606)
Free cash flow $ 12,645 10% $ 11,507
Net income $ 8,820 $ 9,198
Free cash flow as percent of net income 143% 125%
Long-TermCustomerFinancing: We offer certain of our customers the option to acquire our software products, hardware products and services offeringsthrough separate long-term payment contracts. We generally sell these contracts that we have financed for our customers on a non-recourse basis to financialinstitutions within 90 days of the contracts’ dates of execution. We generally record the transfers of amounts due from customers to financial institutions as sales offinancing receivables because we are considered to have surrendered control of these financing receivables. We financed $268 million and $299 million,respectively, or approximately 11% and 11%, respectively, of our new software licenses revenues in the first half of fiscal 2017 and 2016, and $43 million and $61million, respectively, or approximately 4% and 5%, respectively, of our hardware products revenues in the first half of fiscal 2017 and 2016.
48
Table of Contents
RecentFinancingActivities:
Senior Notes : In July 2016, we issued $14.0 billion of senior notes comprised of the following:
• $4.25 billion of 1.90% senior notes due September 2021;
• $2.5 billion of 2.40% senior notes due September 2023;
• $3.0 billion of 2.65% senior notes due July 2026;
• $1.25 billion of 3.85% senior notes due July 2036; and
• $3.0 billion of 4.00% senior notes due July 2046.
We issued the senior notes for general corporate purposes, which may include stock repurchases, payment of cash dividends on our common stock, repayment ofindebtedness and future acquisitions. Additional details regarding the senior notes are included in Note 6 of Notes to Condensed Consolidated Financial Statementsincluded elsewhere in this Quarterly Report.
Other Fiscal 2017 Borrowings Activities : In the second quarter of fiscal 2017, we assumed $310 million par value of legacy NetSuite convertible notes due June 1,2018 in connection with the acquisition of NetSuite (refer to Note 7 of Notes to Condensed Consolidated Financial Statements included in Item 1 of this QuarterlyReport for additional discussion).
In the second quarter of fiscal 2017, we assumed $113 million of debt due August 1, 2025 in connection with the acquisition of certain land and buildings.
In May 2016, we borrowed $3.8 billion pursuant to three revolving credit agreements with JPMorgan Chase Bank, N.A., as initial lender and administrative agent(the 2016 Credit Agreements). In June 2016, we repaid the $3.8 billion and the 2016 Credit Agreements expired pursuant to their terms.
ContractualObligations: During the first half of fiscal 2017, there were no significant changes to our estimates of future payments under our fixed contractualobligations and commitments as presented in Part II, Item 7. Management’s Discussion and Analysis of Financial Condition and Results of Operations included inour Annual Report on Form 10-K for our fiscal year ended May 31, 2016 other than our issuance of $14.0 billion of senior notes. Additional details regarding ourissuance of $14.0 billion of senior notes are included in Note 6 of Notes to Condensed Consolidated Financial Statements included elsewhere in this QuarterlyReport.
We believe that our current cash, cash equivalents and marketable securities and cash generated from operations will be sufficient to meet our working capital,capital expenditures and contractual obligation requirements. In addition, we believe that we could fund our pending and future acquisitions, dividend paymentsand repurchases of common stock or debt with our internally available cash, cash equivalents and marketable securities, cash generated from operations, additionalborrowings or from the issuance of additional securities.
Off-BalanceSheetArrangements: We do not have any off-balance sheet arrangements that have or are reasonably likely to have a current or future effect on ourfinancial condition, changes in financial condition, revenues or expenses, results of operations, liquidity, capital expenditures or capital resources that are materialto investors.
Restricted Stock-Based Awards and Stock Options
Our stock-based compensation program is a key component of the compensation package we provide to attract and retain certain of our talented employees andalign their interests with the interests of existing stockholders.
We recognize that restricted stock-based awards and stock options dilute existing stockholders and have sought to control the number of stock-based awardsgranted while providing competitive compensation packages. Consistent with these dual goals, our cumulative potential dilution since June 1, 2013 has been aweighted-average annualized rate of 1.5% per year. The potential dilution percentage is calculated as the average annualized new restricted stock-based awards orstock options granted and assumed, net of restricted stock-based awards and stock options forfeited by employees leaving the company, divided by the weighted-average outstanding shares during the calculation period. This maximum potential dilution will only result if all restricted stock-based awards vest and stockoptions are exercised. Of the outstanding stock options at November 30, 2016,
49
Table of Contents
which generally have a ten-year exercise period, 14.9% have exercise prices higher than the market price of our common stock on such date. In recent years, ourstock repurchase program has more than offset the dilutive effect of our stock-based compensation program; however, we may reduce the level of our stockrepurchases in the future, as we may use our available cash for acquisitions, to pay dividends, to repay or repurchase indebtedness or for other purposes. AtNovember 30, 2016, the maximum potential dilution from all outstanding restricted stock-based awards and unexercised stock options, regardless of when grantedand regardless of whether vested or unvested and including stock options where the strike price is higher than the market price as of such date, was 11.1%.
Recent Accounting Pronouncements
For information with respect to recent accounting pronouncements, if any, and the impact of these pronouncements on our consolidated financial statements, if any,see Note 1 of Notes to Condensed Consolidated Financial Statements included elsewhere in this Quarterly Report.
Item 3. Quantitative and Qualitative Disclosures About Market Risk
There were no significant changes to our quantitative and qualitative disclosures about market risk during the first half of fiscal 2017. Please refer to Part II,Item 7A. Quantitative and Qualitative Disclosures about Market Risk included in our Annual Report on Form 10-K for our fiscal year ended May 31, 2016 for amore complete discussion of the market risks we encounter.
Item 4. Controls and Procedures
EvaluationofDisclosureControlsandProcedures: Based on our management’s evaluation (with the participation of our Principal Executive Officers, one ofwhom is our Principal Financial Officer), as of the end of the period covered by this Quarterly Report, our Principal Executive Officers have concluded that our“disclosure controls and procedures” (as defined in Rules 13a-15(e) and 15d-15(e) under the Securities Exchange Act of 1934, as amended (the Exchange Act))were effective to provide reasonable assurance that the information required to be disclosed by us in our reports filed or submitted under the Exchange Act isrecorded, processed, summarized, and reported within the time periods specified in the SEC’s rules and forms and is accumulated and communicated to ourmanagement (including our Principal Executive Officers) as appropriate to allow timely decisions regarding required disclosure.
ChangesinInternalControloverFinancialReporting: There were no changes in our internal control over financial reporting that occurred during our lastfiscal quarter that have materially affected, or are reasonably likely to materially affect, our internal control over financial reporting.
InherentLimitationsonEffectivenessofControls: Our management, including our Principal Executive Officers (one of whom is our Principal FinancialOfficer), believes that our disclosure controls and procedures and internal control over financial reporting are designed to provide reasonable assurance ofachieving their objectives and are effective at the reasonable assurance level. However, our management does not expect that our disclosure controls andprocedures or our internal control over financial reporting will prevent all errors and all fraud. A control system, no matter how well-conceived and operated, canprovide only reasonable, not absolute, assurance that the objectives of the control system are met. Further, the design of a control system must reflect the fact thatthere are resource constraints and the benefits of controls must be considered relative to their costs. Because of the inherent limitations in all control systems, noevaluation of controls can provide absolute assurance that all control issues and instances of fraud, if any, have been detected. These inherent limitations include therealities that judgments in decision making can be faulty and that breakdowns can occur because of a simple error or mistake. Additionally, controls can becircumvented by the individual acts of some persons, by collusion of two or more people or by management override of the controls. The design of any system ofcontrols also is based in part upon certain assumptions about the likelihood of future events and there can be no assurance that any design will succeed in achievingits stated goals under all potential future conditions; over time, controls may become inadequate because of changes in conditions, or the degree of compliance withpolicies or procedures may deteriorate. Because of the inherent limitations in a cost-effective control system, misstatements due to error or fraud may occur and notbe detected.
50
Table of Contents
PART II. OTHER INFORMATION
Item 1. Legal Proceedings
The material set forth in Note 11 (pertaining to information regarding contingencies related to our income taxes) and Note 14 (pertaining to information regardinglegal contingencies) of Notes to Condensed Consolidated Financial Statements in Part I, Item 1 of this Quarterly Report on Form 10-Q is incorporated herein byreference.
Item 1A. Risk Factors
In addition to the other information set forth in this Quarterly Report, you should carefully consider the factors discussed in Part I, Item 1A. “Risk Factors” in ourAnnual Report on Form 10-K for our fiscal year ended May 31, 2016. The risks discussed in our Annual Report on Form 10-K could materially affect our business,financial condition and future results. The risks described in our Annual Report on Form 10-K are not the only risks facing us. Additional risks and uncertaintiesnot currently known to us or that we currently deem to be insignificant also may materially and adversely affect our business, financial condition or operatingresults in the future.
Item 2. Unregistered Sales of Equity Securities and Use of Proceeds
Our Board of Directors has approved a program for us to repurchase shares of our common stock. On March 15, 2016, we announced that our Board of Directorsapproved an expansion of our stock repurchase program by an additional $10.0 billion. As of November 30, 2016, approximately $6.3 billion remained availablefor stock repurchases pursuant to our stock repurchase program.
Our stock repurchase authorization does not have an expiration date and the pace of our repurchase activity will depend on factors such as our working capitalneeds, our cash requirements for acquisitions and dividend payments, our debt repayment obligations or repurchases of our debt, our stock price, and economic andmarket conditions. Our stock repurchases may be effected from time to time through open market purchases or pursuant to a Rule 10b5-1 plan. Our stockrepurchase program may be accelerated, suspended, delayed or discontinued at any time.
The following table summarizes the stock repurchase activity for the three months ended November 30, 2016 and the approximate dollar value of shares that mayyet be purchased pursuant to our stock repurchase program:
(in millions, except per share amounts)
Total Number of Shares Purchased
Average Price Paid
per Share
Total Number of Shares Purchased as Part of Publicly
Rule 13a-14(a)/15d-14(a) Certification of Principal ExecutiveOfficer
31.02‡
Rule 13a-14(a)/15d-14(a) Certification of Principal Executive andFinancial Officer
32.01†
Section 1350 Certification of Principal Executive Officers andPrincipal Financial Officer
101‡
Interactive Data Files Pursuant to Rule 405 of Regulation S-T: (i)Condensed Consolidated Balance Sheets as of November 30, 2016and May 31, 2016, (ii) Condensed Consolidated Statements ofOperations for the Three and Six Months ended November 30,2016 and 2015, (iii) Condensed Consolidated Statements ofComprehensive Income for the Three and Six Months endedNovember 30, 2016 and 2015, (iv) Condensed ConsolidatedStatements of Cash Flows for the Six Months endedNovember 30, 2016 and 2015 and (v) Notes to CondensedConsolidated Financial Statements
‡ Filed herewith.
† Furnished herewith.
52
Table of Contents
SIGNATURES
Pursuant to the requirements of the Securities Exchange Act of 1934, Oracle Corporation has duly caused this report to be signed on its behalf by the undersigned,thereunto duly authorized.
ORACLE CORPORATION
Date: December 19, 2016 By: /s/ S AFRA A. C ATZ
Safra A. Catz
Chief Executive Officer and Director(Principal Executive and Financial Officer)
Date: December 19, 2016 By: /s/ W ILLIAM C OREY W EST
CERTIFICATION OF PRINCIPAL EXECUTIVE OFFICER PURSUANT TOEXCHANGE ACT RULE 13a-14(a)/15d-14(a)
AS ADOPTED PURSUANT TO SECTION 302 OF THE SARBANES-OXLEY ACT OF 2002
I, Mark V. Hurd, certify that:
1. I have reviewed this quarterly report on Form 10-Q of Oracle Corporation;
2. Based on my knowledge, this report does not contain any untrue statement of a material fact or omit to state a material fact necessary to make the statementsmade, in light of the circumstances under which such statements were made, not misleading with respect to the period covered by this report;
3. Based on my knowledge, the financial statements, and other financial information included in this report, fairly present in all material respects the financialcondition, results of operations and cash flows of the registrant as of, and for, the periods presented in this report;
4. The registrant’s other certifying officer and I are responsible for establishing and maintaining disclosure controls and procedures (as defined in Exchange ActRules 13a-15(e) and 15d-15(e)) and internal control over financial reporting (as defined in Exchange Act Rules 13a-15(f) and 15d-15(f)) for the registrantand have:
a) designed such disclosure controls and procedures, or caused such disclosure controls and procedures to be designed under our supervision, to ensure
that material information relating to the registrant, including its consolidated subsidiaries, is made known to us by others within those entities,particularly during the period in which this report is being prepared;
b) designed such internal control over financial reporting, or caused such internal control over financial reporting to be designed under our supervision, to
provide reasonable assurance regarding the reliability of financial reporting and the preparation of financial statements for external purposes inaccordance with generally accepted accounting principles;
c) evaluated the effectiveness of the registrant’s disclosure controls and procedures and presented in this report our conclusions about the effectiveness of
the disclosure controls and procedures, as of the end of the period covered by this report based on such evaluation; and
d) disclosed in this report any change in the registrant’s internal control over financial reporting that occurred during the registrant’s most recent fiscal
quarter (the registrant’s fourth fiscal quarter in the case of an annual report) that has materially affected, or is reasonably likely to materially affect, theregistrant’s internal control over financial reporting; and
5. The registrant’s other certifying officer and I have disclosed, based on our most recent evaluation of internal control over financial reporting, to theregistrant’s auditors and the Finance and Audit Committee of the registrant’s board of directors (or persons performing the equivalent functions):
a) all significant deficiencies and material weaknesses in the design or operation of internal control over financial reporting which are reasonably likely
to adversely affect the registrant’s ability to record, process, summarize and report financial information; and
b) any fraud, whether or not material, that involves management or other employees who have a significant role in the registrant’s internal control over
financial reporting. Date: December 19, 2016 By: /s/ M ARK V. H URD
Mark V. HurdChief Executive Officer and Director(Principal Executive Officer)
Exhibit 31.02
CERTIFICATION OF PRINCIPAL EXECUTIVE AND FINANCIAL OFFICER PURSUANT TOEXCHANGE ACT RULE 13a-14(a)/15d-14(a)
AS ADOPTED PURSUANT TO SECTION 302 OF THE SARBANES-OXLEY ACT OF 2002
I, Safra A. Catz, certify that:
1. I have reviewed this quarterly report on Form 10-Q of Oracle Corporation;
2. Based on my knowledge, this report does not contain any untrue statement of a material fact or omit to state a material fact necessary to make the statementsmade, in light of the circumstances under which such statements were made, not misleading with respect to the period covered by this report;
3. Based on my knowledge, the financial statements, and other financial information included in this report, fairly present in all material respects the financialcondition, results of operations and cash flows of the registrant as of, and for, the periods presented in this report;
4. The registrant’s other certifying officer and I are responsible for establishing and maintaining disclosure controls and procedures (as defined in Exchange ActRules 13a-15(e) and 15d-15(e)) and internal control over financial reporting (as defined in Exchange Act Rules 13a-15(f) and 15d-15(f)) for the registrantand have:
a) designed such disclosure controls and procedures, or caused such disclosure controls and procedures to be designed under our supervision, to ensure
that material information relating to the registrant, including its consolidated subsidiaries, is made known to us by others within those entities,particularly during the period in which this report is being prepared;
b) designed such internal control over financial reporting, or caused such internal control over financial reporting to be designed under our supervision, to
provide reasonable assurance regarding the reliability of financial reporting and the preparation of financial statements for external purposes inaccordance with generally accepted accounting principles;
c) evaluated the effectiveness of the registrant’s disclosure controls and procedures and presented in this report our conclusions about the effectiveness of
the disclosure controls and procedures, as of the end of the period covered by this report based on such evaluation; and
d) disclosed in this report any change in the registrant’s internal control over financial reporting that occurred during the registrant’s most recent fiscal
quarter (the registrant’s fourth fiscal quarter in the case of an annual report) that has materially affected, or is reasonably likely to materially affect, theregistrant’s internal control over financial reporting; and
5. The registrant’s other certifying officer and I have disclosed, based on our most recent evaluation of internal control over financial reporting, to theregistrant’s auditors and the Finance and Audit Committee of the registrant’s board of directors (or persons performing the equivalent functions):
a) all significant deficiencies and material weaknesses in the design or operation of internal control over financial reporting which are reasonably likely
to adversely affect the registrant’s ability to record, process, summarize and report financial information; and
b) any fraud, whether or not material, that involves management or other employees who have a significant role in the registrant’s internal control over
financial reporting. Date: December 19, 2016 By: /s/ S AFRA A. C ATZ
Safra A. Catz
Chief Executive Officer and Director(Principal Executive and Financial Officer)
Exhibit 32.01
CERTIFICATION OF PRINCIPAL EXECUTIVE OFFICERS ANDPRINCIPAL FINANCIAL OFFICER PURSUANT TO 18 U.S.C. SECTION 1350
AS ADOPTED PURSUANT TO SECTION 906 OF THE SARBANES-OXLEY ACT OF 2002
The certification set forth below is being submitted in connection with the quarterly report on Form 10-Q of Oracle Corporation for the purpose of complying withRule 13a-14(b) or Rule 15d-14(b) of the Securities Exchange Act of 1934 and Section 1350 of Chapter 63 of Title 18 of the United States Code.
Safra A. Catz, the Chief Executive Officer (Principal Executive Officer and Principal Financial Officer) of Oracle Corporation, and Mark V. Hurd, the ChiefExecutive Officer (Principal Executive Officer) of Oracle Corporation, each certifies that, to the best of his or her knowledge:
1. the quarterly report fully complies with the requirements of Section 13(a) or 15(d) of the Securities Exchange Act of 1934; and
2. the information contained in the quarterly report fairly presents, in all material respects, the financial condition and results of operations of OracleCorporation.
Date: December 19, 2016 By: /s/ S AFRA A. C ATZ
Safra A. CatzChief Executive Officer and Director(Principal Executive and Financial Officer)
Date: December 19, 2016 By: /s/ M ARK V. H URD
Mark V. HurdChief Executive Officer and Director(Principal Executive Officer)
The foregoing certification is being furnished pursuant to 18 U.S.C. Section 1350. It is not being filed for purposes of Section 18 of the Securities Exchange Act of1934, as amended, and it is not to be incorporated by reference into any filing of Oracle Corporation, regardless of any general incorporation language in suchfiling.