RAPID EIA-EMP REPORT FOR AMGURI FIELD Prepared by En-Geo Consultancy & Research Centre, (ENGECORC) GUWAHATI, ASSAM 31 CHAPTER - V 5.0 Water Environment: Water is the most important component of the environment and basic natural resources. It is a life sustaining basic element on the earth. This natural resource also plays a crucial role in economic and social development process. While the total amount available in the world is constant and generally said to be adequate to meet all the demands of the mankind, its quality and distribution over different region of the world is uneven and causes problem of scarcity and suitability. Though, the defilement of water as a result of human activities is a phenomenon as old as hills, the increasing industrialization, urbanization and development activity and consequent pollution of water has brought a veritable water crisis. Today most of the water bodies of the world receive million liters of sewage, domestic wastes, industrial and agricultural effluents containing substances varying in characteristics from simple nutrients to highly toxic substances. Ground water is an integrated part of the hydrological cycle and exposed to man made disturbances out of various development activities. Therefore, ground water reserves and its quality are always a function to time and space. Not long back, ground water was considered as safe and clean source for human consumption. But it is now abandoned source of water in various places. With subsequent drying of surface reserves and fast growth of population and industries ground water also become a scarce commodity. Further more dependency on groundwater sources has increased in many folds in recent times and henceforth it became essential - it needs to be protected. Therefore, assessment of water environment is much more significant today. The water requirement forms an integral part of any project. However, in this particular project water requirement will be of very high order during drilling operation. Hence, the wastewater generation is also high. So baseline water quality study of surface and ground water is very much essential to formulate the management plan for treatment and disposal of wastewater arising from these activities. In order to establish the baseline water quality of the surface and sub-surface sources in various locations of the operation area are taken into consideration for analysis of water samples. 5.1 Objectives of Study: • To assess the present status of surface water i.e. river and stream water. • To assess the present status of ground water in operation area. • To evaluate the variation with prescribed standard limits. • To formulate the strategic plan for abatement of adverse impact on water quality. • To study the post impact of seismic operation on water quality in the area. 5.2 Water Quality Monitoring: To assess the quality of the surface water, the ultimate receiving end of wastewater, the river Jhanji have been identified, as the rivers are located in the proposed operational area. At present two sampling station have been selected in the river Jhanji and two sampling station has been selected in the Majnoi Jan for water quality assessment and sampling locations are shown in Fig. 5.1 Considering the significance of the project activities, 6(Six) groundwater sampling location has been identified in the operational area. The location of the sampling points is indicated in the Fig. 5.1.
Transcript
RAPID EIA-EMP REPORT FOR AMGURI FIELD
Prepared by En-Geo Consultancy & Research Centre, (ENGECORC) GUWAHATI, ASSAM 31
CHAPTER - V 5.0 Water Environment:
Water is the most important component of the environment and basic natural resources. It is a life sustaining basic element on the earth. This natural resource also plays a crucial role in economic and social development process. While the total amount available in the world is constant and generally said to be adequate to meet all the demands of the mankind, its quality and distribution over different region of the world is uneven and causes problem of scarcity and suitability. Though, the defilement of water as a result of human activities is a phenomenon as old as hills, the increasing industrialization, urbanization and development activity and consequent pollution of water has brought a veritable water crisis. Today most of the water bodies of the world receive million liters of sewage, domestic wastes, industrial and agricultural effluents containing substances varying in characteristics from simple nutrients to highly toxic substances. Ground water is an integrated part of the hydrological cycle and exposed to man made disturbances out of various development activities. Therefore, ground water reserves and its quality are always a function to time and space. Not long back, ground water was considered as safe and clean source for human consumption. But it is now abandoned source of water in various places. With subsequent drying of surface reserves and fast growth of population and industries ground water also become a scarce commodity. Further more dependency on groundwater sources has increased in many folds in recent times and henceforth it became essential - it needs to be protected. Therefore, assessment of water environment is much more significant today. The water requirement forms an integral part of any project. However, in this particular project water requirement will be of very high order during drilling operation. Hence, the wastewater generation is also high. So baseline water quality study of surface and ground water is very much essential to formulate the management plan for treatment and disposal of wastewater arising from these activities. In order to establish the baseline water quality of the surface and sub-surface sources in various locations of the operation area are taken into consideration for analysis of water samples. 5.1 Objectives of Study:
• To assess the present status of surface water i.e. river and stream water. • To assess the present status of ground water in operation area. • To evaluate the variation with prescribed standard limits. • To formulate the strategic plan for abatement of adverse impact on water quality. • To study the post impact of seismic operation on water quality in the area.
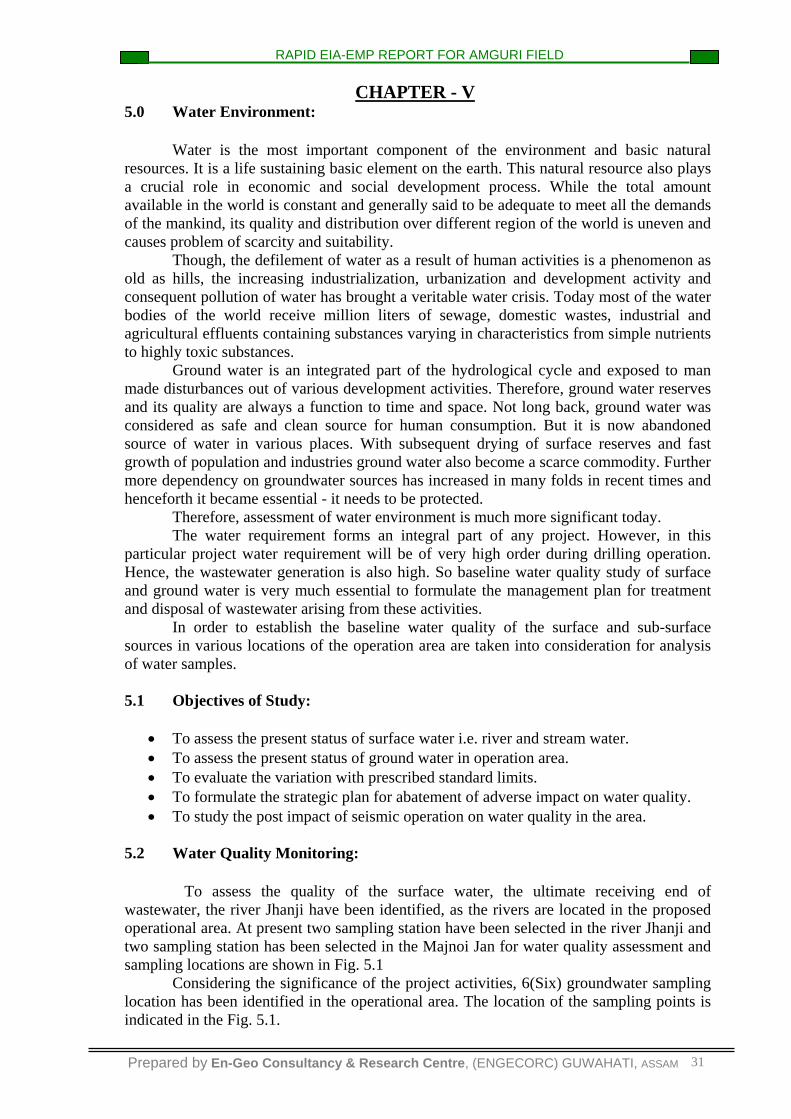
5.2 Water Quality Monitoring: To assess the quality of the surface water, the ultimate receiving end of wastewater, the river Jhanji have been identified, as the rivers are located in the proposed operational area. At present two sampling station have been selected in the river Jhanji and two sampling station has been selected in the Majnoi Jan for water quality assessment and sampling locations are shown in Fig. 5.1 Considering the significance of the project activities, 6(Six) groundwater sampling location has been identified in the operational area. The location of the sampling points is indicated in the Fig. 5.1.
RAPID EIA-EMP REPORT FOR AMGURI FIELD
Prepared by En-Geo Consultancy & Research Centre, (ENGECORC) GUWAHATI, ASSAM 32
Gulia Gaon
Chaodang Gaon Beltu
Padumani Chetia GaonHatimuria Gaon
Japihajia Gaon
Gali beel
PO
Seleng T G
Kathalbaria
Jengabari Gaon
Majnai
PitakhoaItakhoa
Amtalia
Dulia Gaon
Factory
Jhan
zi R.
Amguri TG
Kukurakhoa
Ratnakar Satra
Koa Senchoa
PTO
Boisahabi TG
Padumhat Khola
gharphalia
Dallim TG
Labours' line
TG
Taralbasti
Majnai TG
KaliapaniDeodhria Gaon
Longpuria
Dallim
SelenghatRS
Barangayan
Borangayan
chetia Gaon
Charingia
Bailung Gaon
Chetia
Senchoa
chetia Gaon
Dibrual
Changmai Gaon
Charai Mari Gaon
Churamani Gaon
PTOPuranimatia
churamani GaonJhanzi
Pachani Gaon
Bara Gaon
PODihingia Gaon
Barangayan
Teok TG
Disp.
NORTHEAST F
ROINTIE
R RAILW
AY MAIN
LINE
Khanikar TG
Lahing Taralbasti
Gakhirkhoa
Na Gohali Chuk
Abhayapuria
PO
Abhaypuria
Kaliapani Gaon
Gohain Gaon
Gohain Gaon
Chaodang
Abhayapuria
Chaodang
Dibrual
Kaithalguri
Labjan T.G.
Changmai Khankar
GELEKY RESERVE FOREST
Khanikargaon
Laojangaon
HospitalSimaluguri
Naharkatia
RS
Miri Chutiya
Raidangiagaon
Naobaichagaon
Arandharagaon
Jalukgaon
Chaodanggaon
Kamargaon
Baruakurigaon
Lephera Chaodang
Dhekial
Baruagaon
Duliagaon
Bhujangaon
PS
Sonoalgaon
Dibrualgaon
Hospital
Baghjan T G
Kuargaon
Japihajiagaon
Japihajlagaon
Gharphaliagaon
Gharphaliagaon
Haloagaon
Hatimuriagaon
Hatimuriagaon
Dhenuchuchagaon
Mourabazar
GharphaliagaonUttar
Jeheniagaon
AMGURI
JANJHI
AMGURITOWN
FIG:5.1 MAP SHOWING SURFACE & GROUND WATER SAMPLING STATIONS AT AMGURI FIELD
En-Geo Consultancy & Research CentreDigital Database Created By :
RAP GEOGHIC
TEM
Km
Gaon
Gaon
Gaon
(An ISO 9001:2000 Certified Company)4. TEA GARDEN............
5.SURFACE WATER SAMPLING STATION
7. WATER BODY..................
WELL-06
Barbam Market
Selenghatkhola
LEGEND STUDY UNDERTAKEN FOR
GRAPHICAL SCALE:
Barbam TE
WELL-05
6.GROUND WATER SAMPLING STATIONSW1
SW2
SW1
SW3
SW4
GW1
GW1
GW2GW3
GW4GW5
GW6
RAPID EIA-EMP REPORT FOR AMGURI FIELD
Prepared by En-Geo Consultancy & Research Centre, (ENGECORC) GUWAHATI, ASSAM 33
All the basic precautions and care were taken during the sampling to avoid contamination. Spot tests were done as per statutory requirements. Collection and analysis of water samples was carried out as per established standard methods and procedures, prescribed by CPCB, relevant IS Codes and Standard Methods of Examination of water by APHA etc. 5.3 Water Quality Monitoring Stations at Various Locations: A. River Water: Location
1. Jhanji (Up Stream) Labourers Line near Seleng TG SW1 2. Jhanji (Down Stream) near Dulia Gaon. SW2
B. Stream Water: Location
3. Majnoi Jan (Up Stream) SW3 4. Majnoi Jan (Down Stream) SW4
5.4 Water Quality Parameters: The water sample collected as per schedule were analyzed in accordance with APHA standard methods etc for parameters indicated below – Surface Water Ground Water Physico-chemical Parameters: Physico-chemical Parameters: 1. Temperature (0C) 1. Temperature (0C) 2. pH (pH unit) 2. pH (pH unit) 3. Conductivity (µ moh/cm) 3. Conductivity (µ moh/cm) 4. Chloride as Cl (mg/l) 4. Chloride as Cl (mg/l) 5. Total hardness as CaCO3 (mg/l) 5.Total hardness as CaCO3 (mg/l) 6. Total alkalinity as CaCO3 (mg/l) 6. Total alkalinity as CaCO3 (mg/l) 7. Total Iron as Fe (mg/l) 7. Total Iron as Fe (mg/l) 8. Total dissolved solid (TDS) (mg/l) 8. Total dissolved solid (TDS) (mg/l) 9. Calcium as CaCO3 (mg/l) 9. Calcium as CaCO3 (mg/l) 10. Magnesium as CaCO3 (mg/l) 10. Magnesium as CaCO3 (mg/l) 11. Phosphate as PO4 (mg/l) 11. Phosphate as PO4 (mg/l) 12. Nitrate as NO3 (mg/l) 12. Nitrate as NO3 (mg/l) 13. Fluoride as F (mg/l) 13. Fluoride as F (mg/l) 14. Sulphate as SO4 (mg/l) 14. Sulphate as SO4 (mg/l) 15. Sodium Na (mg/l) 15. Sodium Na (mg/l) 16. Potassium K (mg/l) 16. Potassium K (mg/l) 17. Chemical Oxygen Demand (COD) (mg/l) 17.Chemical Oxygen Demand (mg/l) 18. Biochemical Oxygen Demand (BOD)(mg/l) 18. -
RAPID EIA-EMP REPORT FOR AMGURI FIELD
Prepared by En-Geo Consultancy & Research Centre, (ENGECORC) GUWAHATI, ASSAM 34
Parameters of Heavy Metals: 1. Lead (Pb) mg/l 2. Copper (Cu) mg/l 3. Total Chromium (Cr) mg/l 4. Nickel (Ni) mg/l 5. Cadmium (Cd) mg/l 6. Zinc (Zn) mg/l
Bacteriological Parameters:
1. Total Coliform Organism (MPN/100) 2. Fecal Cliform Organism (MPN/100)
For ease of analysis and interpretations, water quality status of surface and sub-surface water sources has been grouped as follows: 1.Physical Parameters: Temperature and Appearance. 2.Mineral Indicators: Conductivity, pH, Chloride, Alkalinity, Hardness
Calcium, Magnesium, Nitrate, Phosphate, Fluoride Sodium, Total dissolved solid, total iron; Sulphate and Potassium are included in this group.
3.Indicators of Organic Pollution: Dissolved Oxygen (DO), Chemical Oxygen Demand (COD), Bio-chemical Oxygen Demand (BOD).
4.Bacteroligal Indication: - Total Coliform and Fecal Coliform organism. 5.5 Observed Water Quality of River Water: Before starting critical discussion on the water quality of the rivers, it may be mentioned here that the acceptability of a particular quality of any inland surface water including rivers depends on its specific uses. Central Pollution Control Board (CPCB) has evolved a classification of river into 5 classes from class ‘A’ to ‘E’ on the basis of ‘Best Designated use’ later another classes i.e. SW-I, SW-II, SW-III, SW-IV & SW-V were incorporated to cover estuarine water. Table 5.1 gives the designated uses of various classes and Table 5.2 provides minimum quality requirement for each of the above classes on the basis of eight basic parameters (adopted by CPCB in 1975). Table 5.3 also shows the tolerance limit for Inland surface water for each of the above uses as was prescribed by Bureau of Indian Standard formerly known as ISI in 1982 Table 5.4 also provides general standards for discharge of Environmental Pollutants (part A-Effluent) notified by CPCB.
Table: 5.1 CPCB Classifications of Streams
Sl. No Designated Best Use Class of Stream
1 Drinking after Source without conventional treatment but after disinfections A
2 Outdoor bathing (organized) B
3 Drinking after Source with conventional treatment followed disinfections C
4 Propagation of wild life, fisheries D
5 Irrigation, industrial cooling controlled wastewater disposal E
6 Saltpans, shell fishing, contact water sport SW-1
RAPID EIA-EMP REPORT FOR AMGURI FIELD
Prepared by En-Geo Consultancy & Research Centre, (ENGECORC) GUWAHATI, ASSAM 35
Table: 5.2 Primary Water Quality Criteria for Various uses* of Fresh Water, as Laid down by the Central Pollution Control Board (1976)
8 Boron, mg/l. Max - - - - 2 * For use classes please refer Table 5.1 ** If the Coliform is found to be more than the prescribed tolerance limits the criteria for Coliform shall be satisfied if not more than 20 percent of sample show more than the tolerance limits specified and not more than 5 percent of samples show values more than 4 times the tolerance limits. There should be no visible discharge of domestic and industrial waste into Class A waters. In case of Classes B and C the discharge shall be so regulated/treated as to ensure maintenance of the stream standards.
Table: 5.3 Tolerance Limits For Inland Surface Waters (as per IS: 2296)
S.No. Parameters and Units Class-A Class-B Class-C Class-D Class-E
1. Dissolved Oxygen (DO) mg/L. (Min)
6 5 4 4 -
2 BOD (3 days at 270 C mg/l. 2 3 3 - -
3 Total Coliform Organisms MPN/ 100ml.Max
50 500 5000 - -
4 TDS mg/L 500 - 1500 - 2,100 5 Chlorides (mg/L as Cl) 250 - 600 - 600 6 Colour Hazen Units 10 300 300 - - 7 Sodium Absorption Ratio - - - - 26 8 Boron (mg/L as B) - - - - 2 9 Sulphate (mg/L as SO4 ) 400 - 400 - 1,000
* These standards shall be applicable for industries, operations or processes other than
those industries, operations or process for which standards have been specified in Schedule of the Environment Protection Rules, 1989.
Keeping in view the classification of water and primary water quality criteria adopted by CPCB and also the tolerance limits prescribed by Bureau of Indian Standard, the following is our observation. 5.6 Water Quality of Rivers: A) Jhanji (Up Stream) Labourers Line near Seleng TG:
On the basis of the Physico-chemical characteristics of the river Jhanji, the water quality status is explained below along with the organic quality. The observed values are given in the Table 5.5. A.1 Physical Parameters: The general appearance of the water found to be turbid during the study period. The value of temperature is found within the acceptable range. Due to the run off from the catchments during the period of study is the main reason for the high value of turbidity. The pH value of the river recorded 7.0, which is within the specified range for water quality to be grouped in Class ‘A’ in terms of the pH value of primary water quality criteria. A.2 Mineral Indicator: The value of conductivity is observed 228 (µs/cm) in the sampling point of the river, which is within the acceptable range and place the part of the river within prescribe standard range. The value of TDS is also found 202 mg/l, which is within the prescribe limit falls under category “A” as per IS: 2296 standard. Most of the mineral indicators like Calcium etc. are found in acceptable limits in the monitoring station. Concentration of Chloride, Iron is quite satisfactory and comparatively low as compared to maximum limits set by BIS for best class of designated use. The value of Chloride and Iron are recorded 12.4 and 0.04 mg/L. Thus, it may be said that the mineral content of this stretch of the river may be designated as Class ‘A’ in case of Chloride & Iron content as per CPCB and BIS norms. A.3 Parameters Related to Organic Pollutants:
The value of Dissolved Oxygen is 7.1 mg/l, which satisfy Class “A” category. The value of Biochemical Oxygen Demand of this stretch is satisfactory and the observed value is 0.9 mg/l. Similarly, the value of Chemical Oxygen Demand is found 3.8 mg/l of the river. This value depict that the organic load is reasonable.
RAPID EIA-EMP REPORT FOR AMGURI FIELD
Prepared by En-Geo Consultancy & Research Centre, (ENGECORC) GUWAHATI, ASSAM 39
Page for Surface water table. Page for Surface water table.
RAPID EIA-EMP REPORT FOR AMGURI FIELD
Prepared by En-Geo Consultancy & Research Centre, (ENGECORC) GUWAHATI, ASSAM 40
B) Jhanji (Down Stream) Near Dulia Gaon: B.1 Physical Parameters: As per the analytical result shown in the Table 5.5, the turbidity of the river is not in the acceptable range. However, the value of temperature is found to be within the acceptable range. The pH value is 6.9. The value of pH reveals that the water quality is good as per the prescribed standard limit. B.2 Mineral Parameters: The value of conductivity is observed 210 (µs/cm), which is within the prescribed limit for best-designated use of water formulated by CPCB. Hence, we may place this part of the river in the Class ‘A’ water quality. Similarly, the value of TDS is 186 (mg/l) also found in the stipulated level and fulfills the criteria to be grouped in Class ‘A’ as per IS: 2296. The value of Chloride in suitable range and quite low to the maximum limit fixed by BIS for best class of designated use in all the sources. The value of hardness and calcium is found to be 66 & 38 mg/l in the sampling portion of the river. These values meet the criteria for quality to be grouped in Class ‘A’. But the value of Magnesium is high and not fulfills the criteria to be grouped in Class ‘A’. B.3 Organic Parameters: The value of Dissolved Oxygen (6.9 mg/l) and Biochemical Oxygen Demand (1.2 mg/l) of this stretch is satisfactory. Similarly, the value of Chemical Oxygen Demand is 4.6 of the river. This result revealed that the organic load is minimum though it is flowing through a thickly populated area. As such, it may be placed in Class ‘A’ quality of water. B.4 Bacteriological Parameters:
As per analytical results shown in table the bacteriological water quality of the stretch of the river is not satisfactory as the total coliform organism recorded in up stream station of the river is 2300/100 ml. Only without local coliform organisms but in this down stream station of the river, the value of total coliform is recorded 2300/100 ml. and fecal coliform 340/100 ml. Hence, this stretch of the river in respect to bacteriological population fall under class ‘C’ water quality criteria. C) Majnoi Jan (Up Stream): From the analytical results given in the Table 5.5, following are the outcome.
C.1 Physical Parameters: It is observed that the water of Majnoi Jan (Up Stream) is found slightly turbid. The value of temperature is recorded 230 C. The pH value recorded 7.2. This value lies to the range of prescribed limits and may be placed in Class ‘A’ of water quality. C.2 Mineral Indicators: The value of conductivity and TDS in this stretch of the river showed a good relation and is found within the acceptable range. These two areas satisfied the criteria of the water quality as Class ‘A’.
RAPID EIA-EMP REPORT FOR AMGURI FIELD
Prepared by En-Geo Consultancy & Research Centre, (ENGECORC) GUWAHATI, ASSAM 41
Concentration of calcium and total hardness is found within the satisfactory range in the sampling station. The Iron content also satisfies the criteria of the water quality as Class ‘A’. C.3 Organic Indicators: The value of Dissolved Oxygen (6.3 mg/l) Biochemical Oxygen Demand (1.1 mg/l) of this stretch is quite satisfactory. Similarly, the value of Chemical Oxygen Demand is 4.2 mg/l of the stream. This value depict that the organic load is minimum though it is flowing through the tea garden area. As such, it may be placed in Class ‘A’ quality of water. D) Majnoi Jan (Down Stream): D.1 Physical Parameters: The water temperature of the stream Majnoi Jan is recorded to be 22.9 0C and the flowing water in appearance looks slightly turbid. Due to the turbidity the water quality is not acceptable without proper treatment. The pH value of the water is 6.8, which is less than the acceptable range as per the criteria for best-designated use. D.2 Mineral Content: The concentration of TDS and conductivity observed 178 mg/l and 202 µs/cm in the sampling station, which is within the prescribed limit. Other mineral contents i.e. Calcium etc. of the water are within the prescribed tolerance limits as per BIS and may be placed in the Class ‘A’ category of water quality. Iron is found within the acceptable range. As per the mineral content, the water may be grouped in Class ‘A’ of water quality. D.3 Organic Parameters: The DO, BOD and COD values of this sampling point recorded 6.2, 1.2 and 5.2 mg/l respectively. This result revealed that the organic load is acceptable as it is flowing through a tea garden area. As such, it may be placed in Class ‘A’ quality of water. 5.7 Observed Ground Water Quality:
Before going in for discussion on the ground water quality, it is essential to consider the prescribed guideline/specification evolved by Bureau of Indian Standard and Standard prescribed by WHO for potable water. The Table 5.6 shows the minimum quality requirement of water for drinking purpose and Table 5.7 gives about desirable and permissible limit for drinking water standards.
Table: 5.6 Drinking Water Quality Standards (as per IS: 10500)
Sl. No.
Parameters and Units Desirable Limit
Permissible Limits in Absence of Alternate Source
1. Turbidity (NTU) 5 10 2 Pathogenic Organism or virus Nil - 3 Total Coliform Organisms
MPN/ 100mL Nil -
4 TDS mg/L 500 2000
RAPID EIA-EMP REPORT FOR AMGURI FIELD
Prepared by En-Geo Consultancy & Research Centre, (ENGECORC) GUWAHATI, ASSAM 42
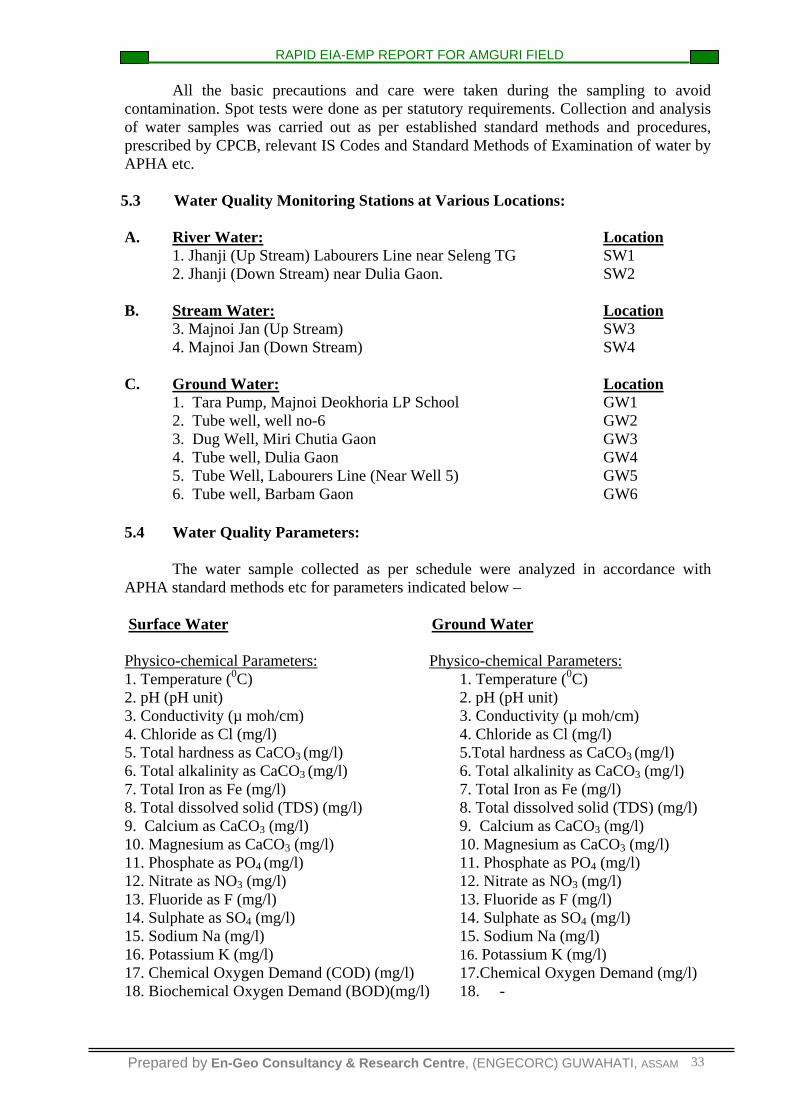
5 Chlorides (mg/L as Cl) 250 1000 6 Free Residual Chlorine (mg/L) 0.2 - 7 Boron (mg/L as B) 1 5 8 Sulphate (mg/L as SO4 ) 200 400 9 Nitrates (mg/L as NO3 ) 45 100 10 Total Alkalinity (mg/L as Ca
CO3 200 600
11 pH 5-8.5 No relaxation 12 Arsenic (mg/L as As) 0.05 No relaxation 13 Iron (mg/L as Fe) 0.3 1 14 Fluoride (mg/L as F) 1 1.5 15 Lead (mg/L as Pb) 0.05 No relaxation 16 Copper (mg/L as Cu) 0.05 1.5 17 Zinc (mg/L as Zn) 5 15 18 Odour Unobjectionable - 19 Taste Agreeable - 20 Mineral Oil (mg/L) 0.01 0.03 21 Free Carbon Dioxide (mg/L as
CO2) 6 -
22 Cyanide (mg/L as CN) 0.05 No relaxation 23 Phenol (mg/L as C6H5OH 0.001 0.002 24 Total Hardness (mg/L as CaCO3 300 600
25 Calcium (mg/L as Ca) 75 200 26 Magnesium (mg/L as Mg) 30 100 27 Manganese (mg/L as Mn) 0.1 0.3 28 Mercury (mg/L as Hg) 0.001 No relaxation 29 Cadmium (mg/L as Cd) 0.01 No relaxation 30 Chromium(VI) (mg/LasCr) 0.05 No relaxation 31 Selenium (mg/L as Se) 0.01 No relaxation 32 Anionic Detergent (mg/L as
Prepared by En-Geo Consultancy & Research Centre, (ENGECORC) GUWAHATI, ASSAM 43
Table: 5.7 INDIAN STANDARDS SPECIFICATIONS FOR DRINKING WATER IS 10500-1983
Serial Substance Requirement Undesirable Desirable Remarks No. or charac- desirable limit effects outside Essential
teristics the desirable limit 1. Turbidity 10 Above 10 Essential May be extended NTUm Max consumer up to 25,in absence Acceptance of alternate sources Decrease 2. pH value 6.5 to 8.5 Beyond this range the Essential May be relaxed up water will affect the relaxed up to 9.2 in Mucous membrane absence of alternate and/or water supply alternate sources.
System. 3. Total 300 Encrustation Essential May be extended up hardness in water supply to 600, in this (as CaCO3) structure and absence of mg/1 max. adverse effects on other sources.
domestic use. 4. Calcium 75 Encrustation Desirable May be extended (as Cal) in water supply up to 200, in the mg/1, Max. structure and absence of other adverse effects on sources. domestic use. 5. Magnesium 30 Encrustation Desirable May be extended up (as Mg) in water supply 100 in the absence of mg/1, Max. structure and adverse other sources effects on domestic use. 6. Iron 0.3 Beyond this limit taste/ Essential May be extended up (As Fe) appearance are adverse to 1.0 in absence of mg/1, Max Effect on domestic alternate sources. uses and water
supply structures, promotes iron bacteria
7. Chlorides 250 Beyond this limit Essential May be extended up (as Cl) taste corrosion and to 1000 in the mg/1, Max. palatability are absence of other affected. Alternate sources. 8. Nitrate 45 Beyond this methane Desirable No relaxation
(as NO3) hemoglobinemia takes place
9. Fluoride 0.6-1.2 Low fluoride level are Desirable linked with dental carries above 1.5 it may cause fluorosis
Keeping in view of the prescribed standard limit by IS 10500-1983 & WHO standard 1972 following observation are made. See Table 5.8.
RAPID EIA-EMP REPORT FOR AMGURI FIELD
Prepared by En-Geo Consultancy & Research Centre, (ENGECORC) GUWAHATI, ASSAM 44
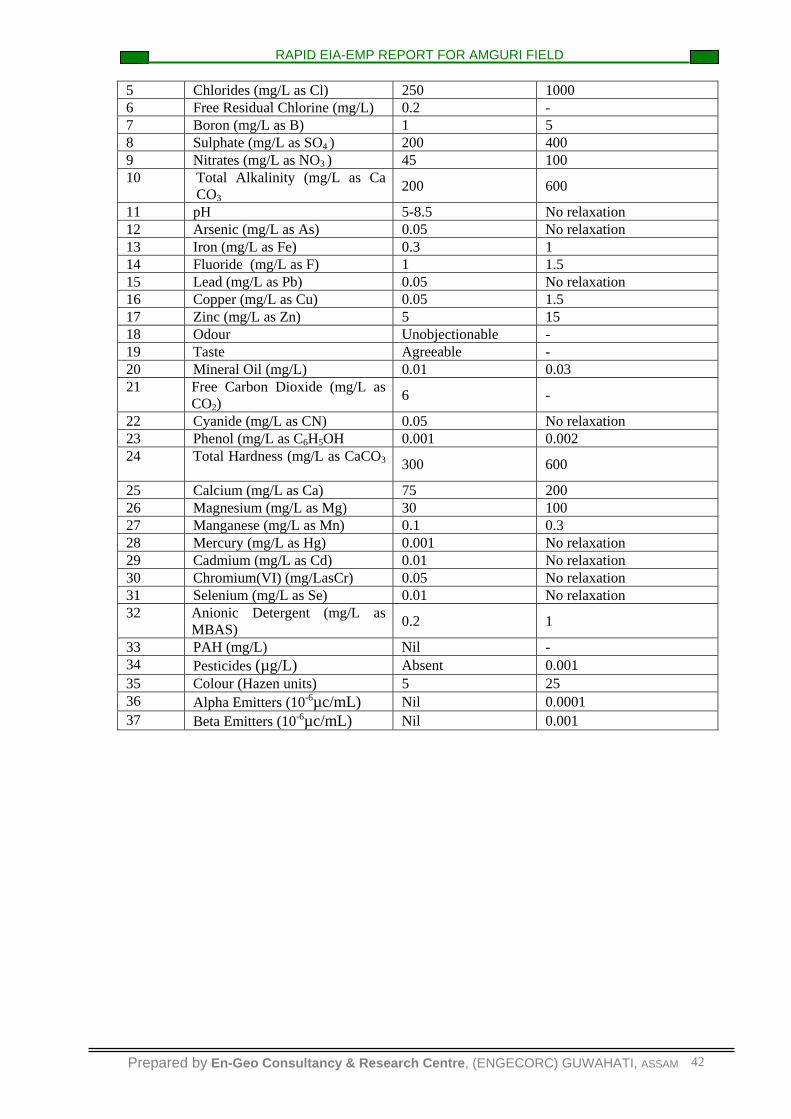
Table: 5.8 World Health Organization Standards for Potable Water
Characteristics Permissible Excessive Total Solid 500 mg/l 1,500 mg/l Colour 5 Hazen units 50 Hazen units Turbidity 5 Jackson Units 25 Jackson Units Iron (Fe) 0.3 mg/l 1.0 mg/l Manganese (Mn) 0.1 mg/l 0.5 mg/l Copper (Cu) 1.0 mg/I 1.5 mg/l Zinc (Zn) 5.0 mg/l 15 mg/l Calcium(Ca) 75 mg/l 200 mg/l Magnesium (Mg) 50 mg/l 150 mg/l Sulphate (SO4) 200 mg/l 400 mg/l Chloride (Cl) 200 mg/l 600 mg/l P H Value 7.0-8.5 6.5 to 9.2 Mg + Ca + SO4 500 mg/l 1,000 mg/l Phenolics 0.001 mg/l 0.003 mg/l Lead (as Pb) - 0.1 mg/l Selenium (as Se) - 0.05 mg/l Arsenic (as As) - 0.05 mg/l Chromium (as Cl) - 0.05 mg/l
Source: World Health Organization (1971) The Physico- chemical results are given in the Table.5.9 for evaluation of status of the water quality ground water.
5.7.1 Physical Parameters:
The value of temperature and the turbidity in all the sources of ground water are observed in the range of 180 C to 200 C. Most of the subsurface samples are found clear. In respect of the temperature, water of the subsurface sources is acceptable. The pH value of water in all the sampling stations were recorded within the range of 6.6-6.9.As such the value of pH meets the prescribed limit of BIS & WHO standards. 5.7.2 Mineral Parameters:
The conductivity (84-281µm/s) and TDS (74-248 mg/l) values of water in all the sampling stations are found in acceptable range and meet the prescribed limit of BIS and WHO standard for potability. Analytical result reveals the most mineral content like chloride, fluoride, nitrate, calcium, phosphate etc are also found within the permissible/desirable limit as per IS & WHO norms. But the iron content in water crossed the desirable limit but found within the permissible limit. The result indicate that the water quality of all the sources are suitable for potable purposes in respect to mineral content except the iron content of which required a simple treatment for iron removal. 5.7.3 Organic Parameters: The COD value, which represents the organic load of the water, indicates that all the samples water are not free from organic contamination as reveled by analytical data. Hence, the water quality of the samples is required proper treatment in respect to organic load.
RAPID EIA-EMP REPORT FOR AMGURI FIELD
Prepared by En-Geo Consultancy & Research Centre, (ENGECORC) GUWAHATI, ASSAM 45
Page for Ground water table
Page for Ground water table
RAPID EIA-EMP REPORT FOR AMGURI FIELD
Prepared by En-Geo Consultancy & Research Centre, (ENGECORC) GUWAHATI, ASSAM 46
GRAPHICAL PRESENTATION OF GROUND WATER QUALITY
0
5
10
15
20
Qua
ntity
Diagram showing Temp,PH & COD of GW1-GW6
TEMP PH COD (mg/l)
TEMP 18 20 18 19 20 20
PH 6.8 6.6 6.6 6.7 6.9 6.8
COD (mg/l) 4.8 3.2 4.2 4.6 4.8 5.1
GW1 GW2 GW3 GW4 GW5 GW6
Fig-5.6 (a)
0
50
100
150
200
250
300
Qua
ntity
Diagram showing Inorgenic Parameters of GW1-GW6
Conductivity TDS
Conductivity 94 142 84 124 281 189
TDS 82 126 74 110 248 168
GW1 GW2 GW3 GW4 GW5 GW6
Fig-5.6 (b)
RAPID EIA-EMP REPORT FOR AMGURI FIELD
Prepared by En-Geo Consultancy & Research Centre, (ENGECORC) GUWAHATI, ASSAM 47
0
10
20
30
40
Qua
ntity
(mg/
L)
Diagram showig Inorgenic Parameters of GW1-GW6
Ca Mg Na
Ca 34 32 36 32 28 32
Mg 28 26 20 27 24 24
Na 10.4 12.2 9.6 10.2 11.4 10.8
GW1 GW2 GW3 GW4 GW5 GW6
Fig-5.6 (c)
0
20
40
60
80
Qua
ntity
(mg/
L)
Diagram showing Inorgenic Parametrs of GW1-GW6
Alkalinity T.H
Alkalinity 64 62 68 72 74 64
T.H 62 58 56 59 52 56
GW1 GW2 GW3 GW4 GW5 GW6
Fig-5.6 (d)
RAPID EIA-EMP REPORT FOR AMGURI FIELD
Prepared by En-Geo Consultancy & Research Centre, (ENGECORC) GUWAHATI, ASSAM 48
0
0.05
0.1
0.15
0.2
0.25
Qua
ntity
(mg/
l)
Diagram showing Inorgenic Parameters of GW1-GW6
NO3 PO4
NO3 0.16 0.12 0.16 0.14 0.12 0.14
PO4 0.21 0.22 0.08 0.2 0.18 0.22
GW1 GW2 GW3 GW4 GW5 GW6
Fig-5.6 (e)
0
2
4
6
8
10
Qua
ntity
(mg/
l)
Diagram showing inorgenic Parameters of GW1-GW6
Cl F
Cl 7.2 7.4 8.2 8.1 8.8 7.4
F 0.03 0.02 0.03 0.02 0.02 0.04
GW1 GW2 GW3 GW4 GW5 GW6
Fig-5.6 (f)
RAPID EIA-EMP REPORT FOR AMGURI FIELD
Prepared by En-Geo Consultancy & Research Centre, (ENGECORC) GUWAHATI, ASSAM 49
0
0.5
1
1.5
2
2.5
3
Qua
ntity
(mg/
l)
Diagram showing inorgenic parameters of GW1-GW6
Fe K
Fe 0.42 0.38 0.4 0.36 0.4 0.36
K 2.4 2.8 1.6 2.1 2.5 2.1
GW1 GW2 GW3 GW4 GW5 GW6
Fig-5.6 (g)
GRAPHICAL PRESENTATION OF SURFACE WATER QUALITY
0
5
10
15
20
25
Qua
ntity
Diagram showing Temp & pH of SW1-SW4
TEMP PH
TEMP 22.6 22.5 23 22.9
PH 7 6.9 7.2 6.8
SW1 SW2 SW3 SW4
Fig-5.7 (a)
RAPID EIA-EMP REPORT FOR AMGURI FIELD
Prepared by En-Geo Consultancy & Research Centre, (ENGECORC) GUWAHATI, ASSAM 50
0
50
100
150
200
250Q
uant
ity
Diagram showing Inorgenic parameters of SW1-SW4
Coductivity TDS
Coductivity 228 210 198 202
TDS 202 186 174 178
SW1 SW2 SW3 SW4
Fig-5.7 (b)
0
2
4
6
Qua
ntity
(mg/
l)
Diagram showing COD & BOD of SW1-SW4
COD BOD
COD 3.8 4.6 4.2 5.2
BOD 0.9 1.2 1.1 1.2
SW1 SW2 SW3 SW4
Fig-5.7(c)
RAPID EIA-EMP REPORT FOR AMGURI FIELD
Prepared by En-Geo Consultancy & Research Centre, (ENGECORC) GUWAHATI, ASSAM 51
0
10
20
30
40
50
Qua
ntity
(mg/
l)
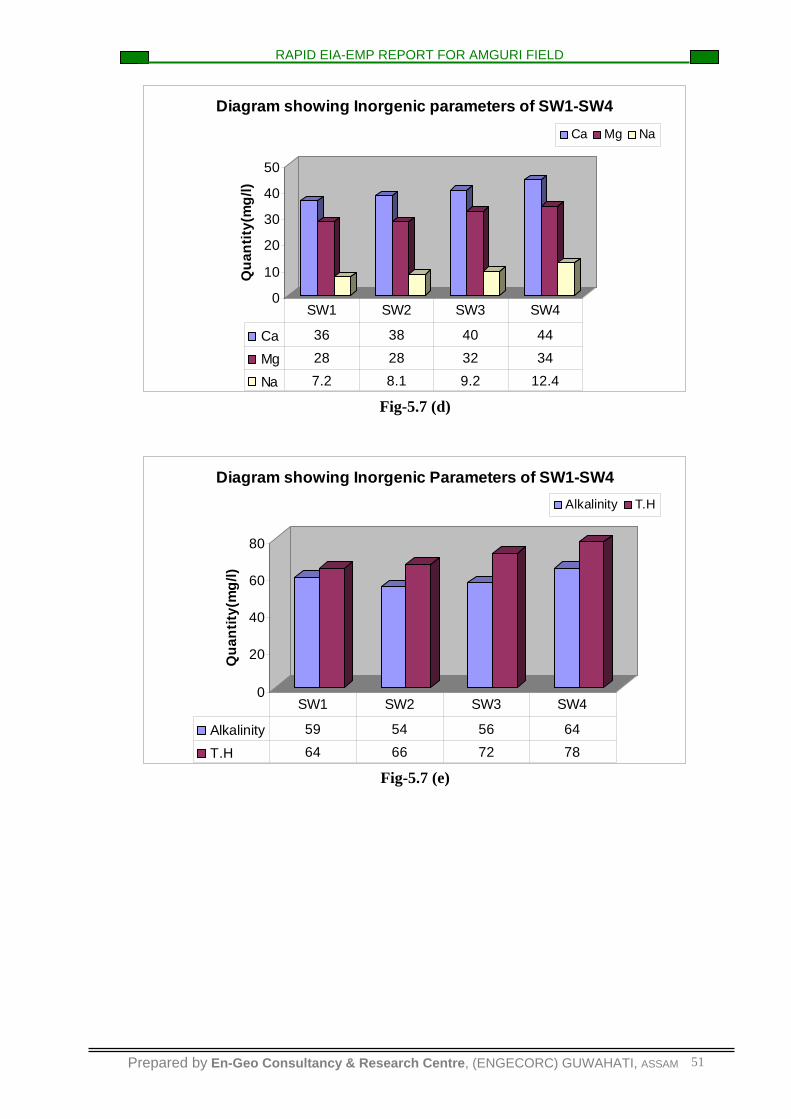
Diagram showing Inorgenic parameters of SW1-SW4Ca Mg Na
Ca 36 38 40 44
Mg 28 28 32 34
Na 7.2 8.1 9.2 12.4
SW1 SW2 SW3 SW4
Fig-5.7 (d)
0
20
40
60
80
Qua
ntity
(mg/
l)
Diagram showing Inorgenic Parameters of SW1-SW4Alkalinity T.H
Alkalinity 59 54 56 64
T.H 64 66 72 78
SW1 SW2 SW3 SW4
Fig-5.7 (e)
RAPID EIA-EMP REPORT FOR AMGURI FIELD
Prepared by En-Geo Consultancy & Research Centre, (ENGECORC) GUWAHATI, ASSAM 52
0
0.5
1
1.5
2
Qua
ntity
( mg/
l)
Diagram showing Inorgenic Parmeters of SW1-SW4Fe k
Fe 0.04 0.14 0.08 0.1
k 1.6 1.8 1.7 2
SW1 SW2 SW3 SW4
Fig-5.7 (f)
0
5
10
15
Qua
ntity
(mg/
l)
Diagram showing Inorgenic Parameters of SW1-SW4Cl F
Cl 12.4 12.2 10.4 10.2
F 0.02 0.02 0.02 0.03
SW1 SW2 SW3 SW4
Fig-5.7 (h)
RAPID EIA-EMP REPORT FOR AMGURI FIELD
Prepared by En-Geo Consultancy & Research Centre, (ENGECORC) GUWAHATI, ASSAM 53
0
0.05
0.1
0.15
Qua
ntity
(mg/
l)
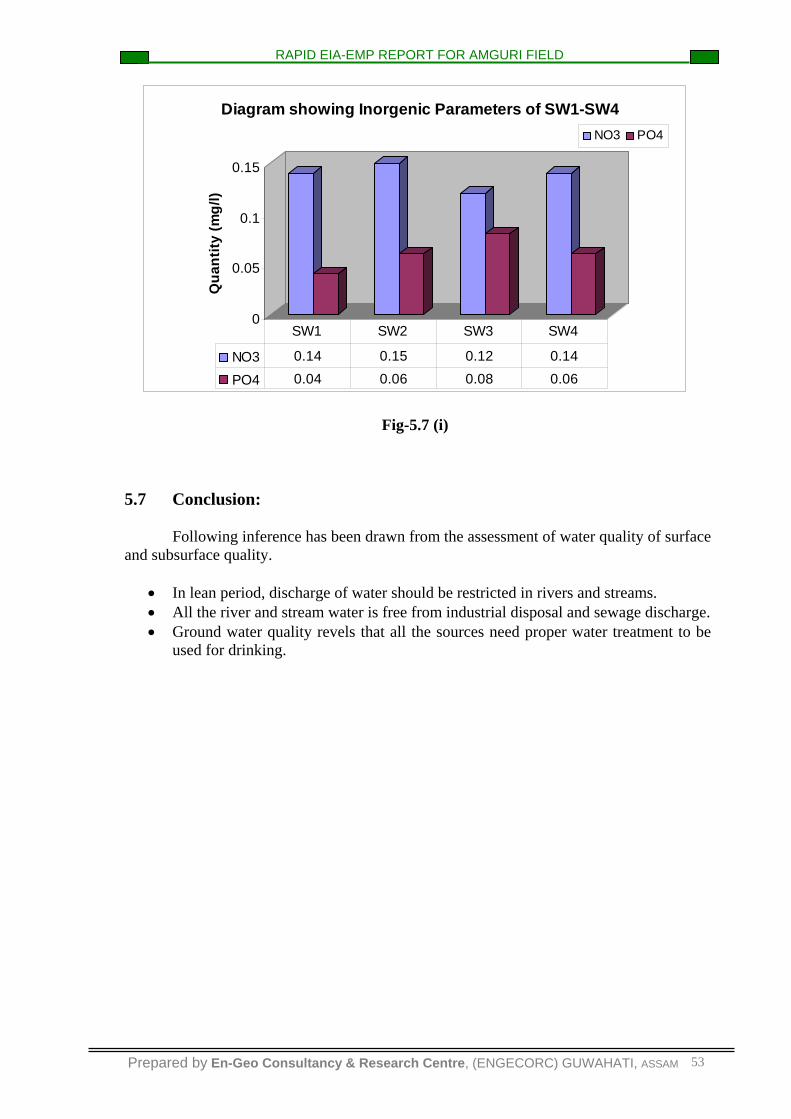
Diagram showing Inorgenic Parameters of SW1-SW4NO3 PO4
NO3 0.14 0.15 0.12 0.14
PO4 0.04 0.06 0.08 0.06
SW1 SW2 SW3 SW4
Fig-5.7 (i)
5.7 Conclusion: Following inference has been drawn from the assessment of water quality of surface and subsurface quality.
• In lean period, discharge of water should be restricted in rivers and streams. • All the river and stream water is free from industrial disposal and sewage discharge. • Ground water quality revels that all the sources need proper water treatment to be
used for drinking.
RAPID EIA-EMP REPORT FOR AMGURI FIELD
Prepared by En-Geo Consultancy & Research Centre, (ENGECORC) GUWAHATI, ASSAM 54
A Few Field Photographs of Surface & Ground Water Collection
Surface Water (SW) at Majnoi Jan Down
GW at Majnoi Deokharia LP School.
Ground Water (GW) at Well 6
SW Janji Down Stream, near Seleng TG.
RAPID EIA-EMP REPORT FOR AMGURI FIELD
Prepared by En-Geo Consultancy & Research Centre, (ENGECORC) GUWAHATI, ASSAM 55
CHAPTER-VI 6.0 Air Environment:
Gaseous mixture of troposphere is called air. The air has a relative constant composition of gases and is utilized by the most of living organism in respiration to liberate chemical energy for their survival. So, it is one of the most important components for survival of living beings. No one can live without breathing air even for a few moments. Air is so far being considered as an unlimited and free resource on which all living being depends. Now entire world has realized that clean air is valuable and essential for our survival. Now, it is impossible task to get free and clean air in the atmosphere. The human activities whether for cooking, space heating, transportation or for industrial production use fuels of various kinds. Burning of fuel leads to combustion products, which contribute towards air pollution. Besides, man made pollutants, air pollution such as in arid and semi arid areas which are having high level of SPM can also be caused by natural condition. Most of the people has already confronted with the environmental and health problems on account of poor shelter and lack of safe water, sanitation and drainage. The problems are further aggravated by harmful emission caused by vehicles, industries and domestic combustion of biomass and fossils fuels. As a result a great change has occurred in the composition of atmospheric air quality. This changed quality becomes a great threat to survival at life, properties, materials and ecosystems as a whole. To improve the quality of life on the earth, the environment needs to be protected through sustainable development. Hence, it is necessary for us to ensure that air quality is not polluted beyond the threshold limits. So monitoring is helpful to ascertain the characteristics and concentration of pollutant present in the air by which necessary abatement measure can be formulated for monitoring and restoring good quality of air in the environment. 6.1 Objective of the Study:
The objectives of the ambient air study is to
Assess present status of air quality in the study area. Identify the source of pollution. Assess the variation of ambient air quality with prescribed standard limit.
6.2 Monitoring Locations: A systemically designed air quality surveillance program forms the basis for impact assessment of air while undertaking any project. An effective plan to combat impact on air is normally taken while considering output of results based on the monitoring. The locations of the monitoring stations are selected based on predominant wind direction and with due consideration to accessibility, sensitivity, availability of reliable power supply, prevailing conditions representative ness of the site in terms of its exposure. Topography and other factor like industrial area, residential area and sensitive area are also considered while finalizing a sampling location. 6.3 Study Area: The area is comprised mainly of - residential, commercial and industrial activities. The region has humid and mesothermal climate. The monsoon season is characterized by very high humidity, weak variable surface window and cloudy sky.
RAPID EIA-EMP REPORT FOR AMGURI FIELD
Prepared by En-Geo Consultancy & Research Centre, (ENGECORC) GUWAHATI, ASSAM 56
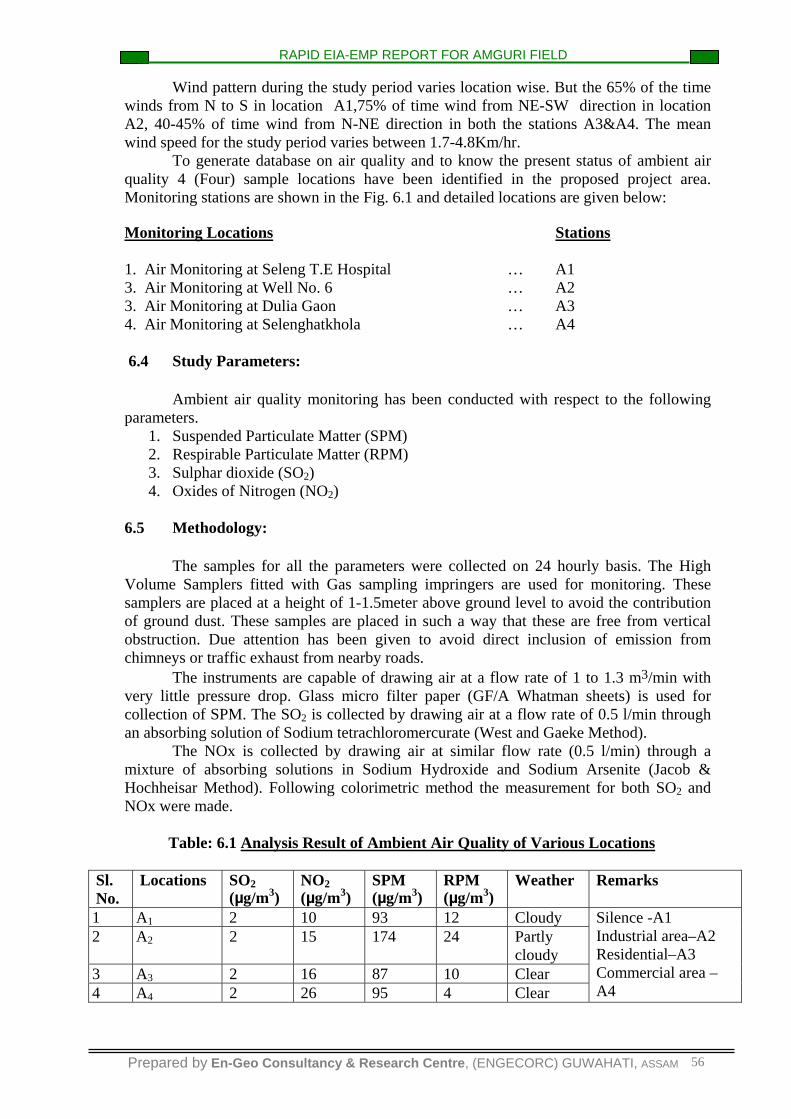
Wind pattern during the study period varies location wise. But the 65% of the time winds from N to S in location A1,75% of time wind from NE-SW direction in location A2, 40-45% of time wind from N-NE direction in both the stations A3&A4. The mean wind speed for the study period varies between 1.7-4.8Km/hr.
To generate database on air quality and to know the present status of ambient air quality 4 (Four) sample locations have been identified in the proposed project area. Monitoring stations are shown in the Fig. 6.1 and detailed locations are given below:
Monitoring Locations Stations
1. Air Monitoring at Seleng T.E Hospital … A1 3. Air Monitoring at Well No. 6 … A2 3. Air Monitoring at Dulia Gaon … A3 4. Air Monitoring at Selenghatkhola … A4 6.4 Study Parameters: Ambient air quality monitoring has been conducted with respect to the following parameters.
6.5 Methodology: The samples for all the parameters were collected on 24 hourly basis. The High Volume Samplers fitted with Gas sampling impringers are used for monitoring. These samplers are placed at a height of 1-1.5meter above ground level to avoid the contribution of ground dust. These samples are placed in such a way that these are free from vertical obstruction. Due attention has been given to avoid direct inclusion of emission from chimneys or traffic exhaust from nearby roads. The instruments are capable of drawing air at a flow rate of 1 to 1.3 m3/min with very little pressure drop. Glass micro filter paper (GF/A Whatman sheets) is used for collection of SPM. The SO2 is collected by drawing air at a flow rate of 0.5 l/min through an absorbing solution of Sodium tetrachloromercurate (West and Gaeke Method).
The NOx is collected by drawing air at similar flow rate (0.5 l/min) through a mixture of absorbing solutions in Sodium Hydroxide and Sodium Arsenite (Jacob & Hochheisar Method). Following colorimetric method the measurement for both SO2 and NOx were made.
Table: 6.1 Analysis Result of Ambient Air Quality of Various Locations
Sl. No.
Locations SO2(µg/m3)
NO2 (µg/m3)
SPM (µg/m3)
RPM (µg/m3)
Weather Remarks
1 A1 2 10 93 12 Cloudy 2 A2 2 15 174 24 Partly
cloudy 3 A3 2 16 87 10 Clear 4 A4 2 26 95 4 Clear
Silence -A1 Industrial area–A2 Residential–A3 Commercial area –A4
RAPID EIA-EMP REPORT FOR AMGURI FIELD
Prepared by En-Geo Consultancy & Research Centre, (ENGECORC) GUWAHATI, ASSAM 57
Gulia Gaon
Chaodang Gaon Beltu
Padumani Chetia GaonHatimuria Gaon
Japihajia Gaon
Gali beel
PO
Seleng T G
Kathalbaria
Jengabari Gaon
Majnai
PitakhoaItakhoa
Amtalia
Dulia Gaon
Factory
Jhan
zi R.
Amguri TG
Kukurakhoa
Ratnakar Satra
Koa Senchoa
PTO
Boisahabi TG
Padumhat Khola
gharphalia
Dallim TG
Labours' line
TG
Taralbasti
Majnai TG
KaliapaniDeodhria Gaon
Longpuria
Dallim
SelenghatRS
Barangayan
Borangayan
chetia Gaon
Charingia
Bailung Gaon
Chetia
Senchoa
chetia Gaon
Dibrual
Changmai Gaon
Charai Mari Gaon
Churamani Gaon
PTOPuranimatia
churamani GaonJhanzi
Pachani Gaon
Bara Gaon
PODihingia Gaon
Barangayan
Teok TG
Disp.
NORTHEAST F
ROINTIE
R RAILW
AY MAIN
LINE
Khanikar TG
Lahing Taralbasti
Gakhirkhoa
Na Gohali Chuk
Abhayapuria
PO
Abhaypuria
Kaliapani Gaon
Gohain Gaon
Gohain Gaon
Chaodang
Abhayapuria
Chaodang
Dibrual
Kaithalguri
Labjan T.G.
Changmai Khankar
GELEKY RESERVE FOREST
Khanikargaon
Laojangaon
HospitalSimaluguri
Naharkatia
RS
Miri Chutiya
Raidangiagaon
Naobaichagaon
Arandharagaon
Jalukgaon
Chaodanggaon
Kamargaon
Baruakurigaon
Lephera Chaodang
Dhekial
Baruagaon
Duliagaon
Bhujangaon
PS
Sonoalgaon
Dibrualgaon
Hospital
Baghjan T G
Kuargaon
Japihajiagaon
Japihajlagaon
Gharphaliagaon
Gharphaliagaon
Haloagaon
Hatimuriagaon
Hatimuriagaon
Dhenuchuchagaon
Mourabazar
GharphaliagaonUttar
Jeheniagaon
AMGURI
JANJHI
AMGURITOWN
FIG:6.1 MAP SHOWING AIR& NOISE MONITORING STATIONS AT AMGURI FIELD
En-Geo Consultancy & Research CentreDigital Database Created By :
RAP GEOGHIC
TEM
Km
Gaon
Gaon
Gaon
(An ISO 9001:2000 Certified Company)4. TEA GARDEN............
5. AMBIENT AIR MONITORING STATION
6. NOISE MONITORING STATION û
/7. WATER BODY..................
/A1
/A2WELL-06
/A3
/A4
ûN1
ûN2ûN3
ûN4
Barbam MarketûN5
SelenghatkholaûN6
LEGEND STUDY UNDERTAKEN FOR
GRAPHICAL SCALE:
RAPID EIA-EMP REPORT FOR AMGURI FIELD
Prepared by En-Geo Consultancy & Research Centre, (ENGECORC) GUWAHATI, ASSAM 58
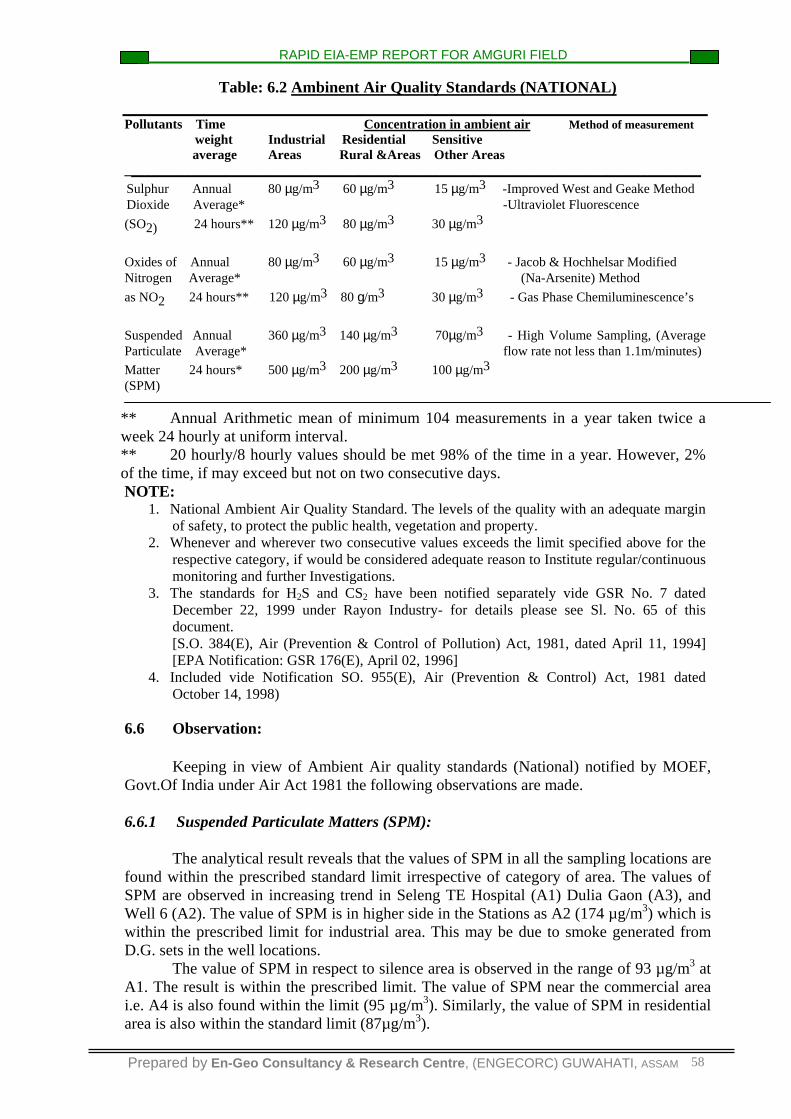
Table: 6.2 Ambinent Air Quality Standards (NATIONAL) Pollutants Time Concentration in ambient air Method of measurement weight Industrial Residential Sensitive
average Areas Rural &Areas Other Areas ______________________________________________________________________________________ Sulphur Annual 80 µg/m3 60 µg/m3 15 µg/m3 -Improved West and Geake Method Dioxide Average* -Ultraviolet Fluorescence (SO2) 24 hours** 120 µg/m3 80 µg/m3 30 µg/m3 Oxides of Annual 80 µg/m3 60 µg/m3 15 µg/m3 - Jacob & Hochhelsar Modified Nitrogen Average* (Na-Arsenite) Method as NO2 24 hours** 120 µg/m3 80 g/m3 30 µg/m3 - Gas Phase Chemiluminescence’s
Suspended Annual 360 µg/m3 140 µg/m3 70µg/m3 - High Volume Sampling, (Average Particulate Average* flow rate not less than 1.1m/minutes) Matter 24 hours* 500 µg/m3 200 µg/m3 100 µg/m3 (SPM)
** Annual Arithmetic mean of minimum 104 measurements in a year taken twice a week 24 hourly at uniform interval. ** 20 hourly/8 hourly values should be met 98% of the time in a year. However, 2% of the time, if may exceed but not on two consecutive days. NOTE:
1. National Ambient Air Quality Standard. The levels of the quality with an adequate margin of safety, to protect the public health, vegetation and property.
2. Whenever and wherever two consecutive values exceeds the limit specified above for the respective category, if would be considered adequate reason to Institute regular/continuous monitoring and further Investigations.
3. The standards for H2S and CS2 have been notified separately vide GSR No. 7 dated December 22, 1999 under Rayon Industry- for details please see Sl. No. 65 of this document. [S.O. 384(E), Air (Prevention & Control of Pollution) Act, 1981, dated April 11, 1994] [EPA Notification: GSR 176(E), April 02, 1996]
4. Included vide Notification SO. 955(E), Air (Prevention & Control) Act, 1981 dated October 14, 1998)
6.6 Observation: Keeping in view of Ambient Air quality standards (National) notified by MOEF, Govt.Of India under Air Act 1981 the following observations are made. 6.6.1 Suspended Particulate Matters (SPM): The analytical result reveals that the values of SPM in all the sampling locations are found within the prescribed standard limit irrespective of category of area. The values of SPM are observed in increasing trend in Seleng TE Hospital (A1) Dulia Gaon (A3), and Well 6 (A2). The value of SPM is in higher side in the Stations as A2 (174 µg/m3) which is within the prescribed limit for industrial area. This may be due to smoke generated from D.G. sets in the well locations. The value of SPM in respect to silence area is observed in the range of 93 µg/m3 at A1. The result is within the prescribed limit. The value of SPM near the commercial area i.e. A4 is also found within the limit (95 µg/m3). Similarly, the value of SPM in residential area is also within the standard limit (87µg/m3).
RAPID EIA-EMP REPORT FOR AMGURI FIELD
Prepared by En-Geo Consultancy & Research Centre, (ENGECORC) GUWAHATI, ASSAM 59
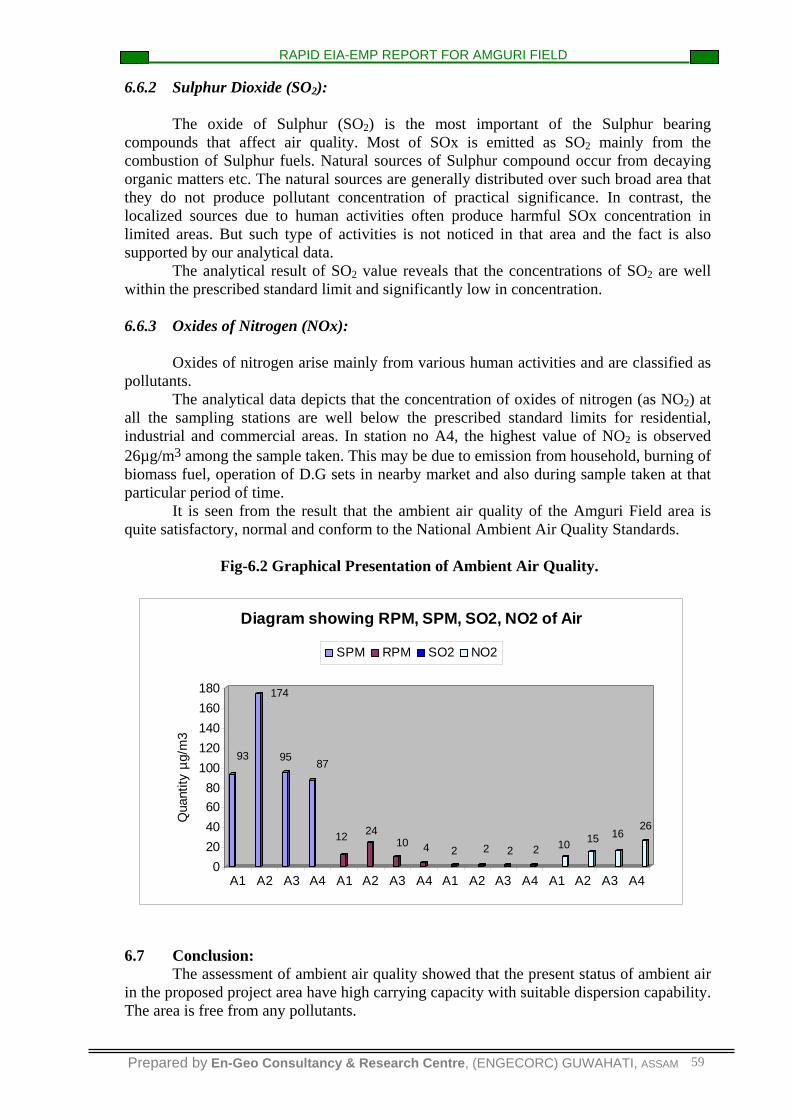
6.6.2 Sulphur Dioxide (SO2): The oxide of Sulphur (SO2) is the most important of the Sulphur bearing compounds that affect air quality. Most of SOx is emitted as SO2 mainly from the combustion of Sulphur fuels. Natural sources of Sulphur compound occur from decaying organic matters etc. The natural sources are generally distributed over such broad area that they do not produce pollutant concentration of practical significance. In contrast, the localized sources due to human activities often produce harmful SOx concentration in limited areas. But such type of activities is not noticed in that area and the fact is also supported by our analytical data. The analytical result of SO2 value reveals that the concentrations of SO2 are well within the prescribed standard limit and significantly low in concentration. 6.6.3 Oxides of Nitrogen (NOx): Oxides of nitrogen arise mainly from various human activities and are classified as pollutants. The analytical data depicts that the concentration of oxides of nitrogen (as NO2) at all the sampling stations are well below the prescribed standard limits for residential, industrial and commercial areas. In station no A4, the highest value of NO2 is observed 26µg/m3 among the sample taken. This may be due to emission from household, burning of biomass fuel, operation of D.G sets in nearby market and also during sample taken at that particular period of time. It is seen from the result that the ambient air quality of the Amguri Field area is quite satisfactory, normal and conform to the National Ambient Air Quality Standards. Fig-6.2 Graphical Presentation of Ambient Air Quality.
93
174
95 87
12 2410 4 2 2 2 2 10 15 16
26
020406080
100120140160180
Qua
ntity
µg/
m3
A1 A2 A3 A4 A1 A2 A3 A4 A1 A2 A3 A4 A1 A2 A3 A4
Diagram showing RPM, SPM, SO2, NO2 of Air
SPM RPM SO2 NO2
6.7 Conclusion:
The assessment of ambient air quality showed that the present status of ambient air in the proposed project area have high carrying capacity with suitable dispersion capability. The area is free from any pollutants.
RAPID EIA-EMP REPORT FOR AMGURI FIELD
Prepared by En-Geo Consultancy & Research Centre, (ENGECORC) GUWAHATI, ASSAM 60
FIELD PHOTOGRAPH OF THE AIR MONITORING LOCATIONS
At Selenghatkhola.
At Well 6.
At Dulia Gaon.
*******
RAPID EIA-EMP REPORT FOR AMGURI FIELD
CHAPTER-VII 7.0 Noise Environment:
ILO Convention No. 148 gives the definition of noise – “the term ‘Noise’ covers all
sound which can result in hearing impairment or be harmful to health or other-wise dangerous”. Noise is usually defined as unwanted sound. Even a low comparatively low-level noise interferes with human conversation and cause emotional or behavioral stress. Noise is no less pollutant than toxic chemical in our environment. As a result of increasing mechanization, the use of increasing voluminous and complicated machinery and equipment and the stepping up of the pace in the production, noise is becoming an increasing widespread and serious source of discomfort and danger. Now attention has been given to noise pollutant by acousticians/ audiologist/ webster etc. due to the deleterious effects on human health and psychological well being of the people. Accordingly MOEF, Govt of India has enacted a rule “The noise Pollution (Regulation and Control) Rule 2000 with an objective to maintain the ambient noise level. 7.1 Major Sources of Noise in the Study Area: The vehicular movement on roads is one of the major sources of noise in the study area, which has significantly increased the ambient noise level. Apart from this a number of tea factories, rice mills, D.G. Sets are also enhanced the noise level to some extent. Besides this, there are number of domestic and commercial noise sources like - a television, video, high volume audio music systems, generators, water pumps, air conditioners and many other appliances. Indiscriminate and improper usage is a major source of ‘noise’ pollution today.
Table: 7.1 Important Noise Sources at Electrical /Mechanical Rig
Sl.No. Name of noise source and
number Individual capacity HP/KW
Noise level d BA at distance of 3-5 meters
1 Diesel engines (7 nos and 2 nos standby) 450HP 90-100
(Source: K. Kappor 186 Studies) The Electrical-drilling rig requires more electric power for different operations. More number of diesel electric generators is therefore required and their capacity is also considerably on the higher side. Generally 4 (four) generators each of 900 KW capacities are used. However, less numbers of diesel engines are required, since electrical motors are used for remaining operations. Average noise level at the Electrical Drilling Rig is about 5 dB lower than that of the Mechanical Rig. Noise at the production system is mainly due to the flow of gas and oil in the pipes, operations of oil & gas valves and gas flow.
Prepared by En-Geo Consultancy & Research Center, (ENGECORC) GUWAHATI, ASSAM 61
RAPID EIA-EMP REPORT FOR AMGURI FIELD
7.2 Monitoring Locations: The noise monitoring locations are selected by considering the population demography, traffic and other human activities. Following sampling locations are identified and shown in the Map -Fig 6.1(Pg. No: 58). The noise monitoring is carried out at the selected 6(six) stations covering industrial, commercial, residential and silence zone during daytime.
Table: 7.2 Noise Monitoring Locations are follows:
Sl. No. Locations Sampling Number 1 Seleng TE Hospital N1 2 Well No. 6 N2 3 Miri Chutia Gaon N3 4 Majnoi N4 5 Barbam Market N5 6 Padumhatkhola N6
7.3 Method of Measurement: ‘Sound Level Meter’ is used for monitoring the noise levels. This device has a microphone fitted with the windscreen, which eliminates all the background noise, and collects the frequency of noise, which is above the stipulated level. The unit is placed normally at 1.5 m above the ground level. This device records in decibel scale dB (A), which is commonly used for measurement of noise levels. 7.4 Objective of the Noise Level Monitoring: The main objective of noise level monitoring is
• To assess the present status of noise level in the proposed project area. • To assess the variation of noise level with standards.
Table 7.3 Ambient Air Quality Standard in Respect to Noise:
Limit in dB (A) leg* Area code Category of Area/
Zone Day time Night time (A) Industrial 75 70 (B) Commercial 65 55 (C) Residential 55 45 (D) Silence Zone 50 40
Note: 1. Daytime shall mean 6.00 a.m. to 10.00 p.m. 2. Night time shall mean from 10.00 p.m. 6.00 a.m.
3. Silence zone is defined as an area comprising not less than 100 meters around hospitals, educational institutions and courts. This silence zones are zones that are declared as such by the competent authority. 4. Mixed categories of zones means - one of the four above-mentioned categories by the competent authority.
Prepared by En-Geo Consultancy & Research Center, (ENGECORC) GUWAHATI, ASSAM 62
RAPID EIA-EMP REPORT FOR AMGURI FIELD
7.5 Zoning of Area:
For ease of interpretation and discussion the sampling stations have been grouped as follows:
i) Residential Area - N3,N4 ii) Commercial Area – N5, N6 iii) Silence Zone – N1 iv) Industrial Area - N2
7.6 Observations: Following observations are recorded in the monitoring locations:
Area Noise level dB (A) Location number Industrial Area: Well No. 6
60.2
N2
Commercial Area : Selenghatkhola Barbam Market
50.4 52.8
N5 N6
Residential Area: Miri Chutia Gaon Majnoi
43.9 47.5
N3 N4
Silence Zone: Seleng TE Hospital
41.5
N1
60.2
50.452.8
41.5 43.947.5
0
10
20
30
40
50
60
70
Qua
ntity
dB
(A)
N2 N5 N6 N1 N3 N4
Graphic Presentation of Noise level in Resepective Area
Industrial Commercial Silence Residential
Fig- 7.2
7.7 Discussion: Keeping in view the values of the ambient air quality standard in respect to noise notified by MOEF, the following inferences can be made.
Prepared by En-Geo Consultancy & Research Center, (ENGECORC) GUWAHATI, ASSAM 63
RAPID EIA-EMP REPORT FOR AMGURI FIELD
7.7.1 Industrial Areas: The proposed area under study does not have any major industry except tea
factories. It is observed that noise levels at N2 is 60.2dB (A) at Well #6, which is within the prescribed standard limit as per industrial area definition. 7.7.2 Commercial Area:
At Near Barbam Market and Selenghatkhola noise levels are monitored during daytime and the values are found to be 52.8 & 50.4 dB (A) respectively, which are within the prescribed values of 65 dB (A). Noise levels at this commercial area are due to vehicular traffic. 7.7.3 Residential Areas: Most of the proposed area is covered by tea garden and agricultural fields as such the population density is competitively thin except in the town area. The values of noise level, which are, recorded lies between 43.9-47.5 dB (A). Vehicular traffic in most of the area within the villages is very less. These observed values are normal and satisfactory as per standard limit. 7.7.4 Silence Zone: Silence zone is one of the most important areas in respect to noise. In the proposed project area hospitals/ Schools are located. In one of among them, at Seleng TE Hospital noise level monitoring was done and found 41.5, which is in satisfactory level for Health Centre. The value of noise level in the hospital area is also found well within the standard limit.
STANDARDS AND GUIDELINES FOR CONTROL OF NOISE POLLUTION FROM STATIONARY DIESEL GENERATOR (DG) SETS.
(A) Noise Standards for DG sets (15-500 KVA)
The total sound power level, Lw, of a DG set should be less than 94+10 log10 (KVA), dB (A), at manufacturing stage, where, KVA is the nominal power rating of a DG set.
This level should fall by 5 dB (A) every five years, till 2007, i.e. in 2002 and then in 2007.
(B) Mandatory acoustic enclosure/acoustic treatment of room for stationary DG sets (5 KVA and above)
Noise from the DG set should be controlled by providing an acoustic enclosure on
by treating the room acoustically. The acoustic enclosure/acoustic treatment of the room should be designed for
minimum 25 dB (A) Insertion Loss or for meeting the ambient noise standards, whichever is on the higher side (if the actual ambient noise is on the higher side, it may not be possible to check the performance of the acoustic enclosure/acoustic treatment. Under such circumstances the performance may be checked for noise reduction upto actual ambient noise level, preferably, in the night time). The measurement for Insertion Loss may be done at different points at o.5m for the acoustic enclosure/room, and then averaged.
The DG set should be provided with proper exhaust muffler with Insertion Loss of minimum 25 dB (A). (C) Guidelines for the manufacturers/users of DG set 5 KVA and above
Prepared by En-Geo Consultancy & Research Center, (ENGECORC) GUWAHATI, ASSAM 64
RAPID EIA-EMP REPORT FOR AMGURI FIELD
The manufacturer should offer to the user a standard acoustic enclosure of 25 dB (a) Insertion Loss and also a suitable exhaust muffler with Insertion Loss of 25 dB (A).
The user should make efforts to bring down the noise levels due to the DG set; outside his premises, within the ambient noise requirements by proper sitting and control measures.
The manufacturer should finish noise power levels of the unsilenced DG sets as per standards prescribed under (A).
The total sound power level of a DG set, at the user’s end, shall be within 2 dB (A) of the total sound power level of the DG set, at the manufacturing stage, as prescribed under (A).
Installation of a DG set must be strictly in compliance with the recommendation of the DG set manufacturer.
A proper routine and maintenance procedure for the DG set should be set and followed in consultation with the DG set manufacturer which would help prevent noise levels of the DG set from deteriorating with use.
(Source: EPA, 1986[GSR 7, dated Dec 22, 1998]) 7.8 Conclusion: The observation of noise level depict that there is no major source of noise pollution and the values are well within the limit and hence the area is considered to be a quite and comfortable.
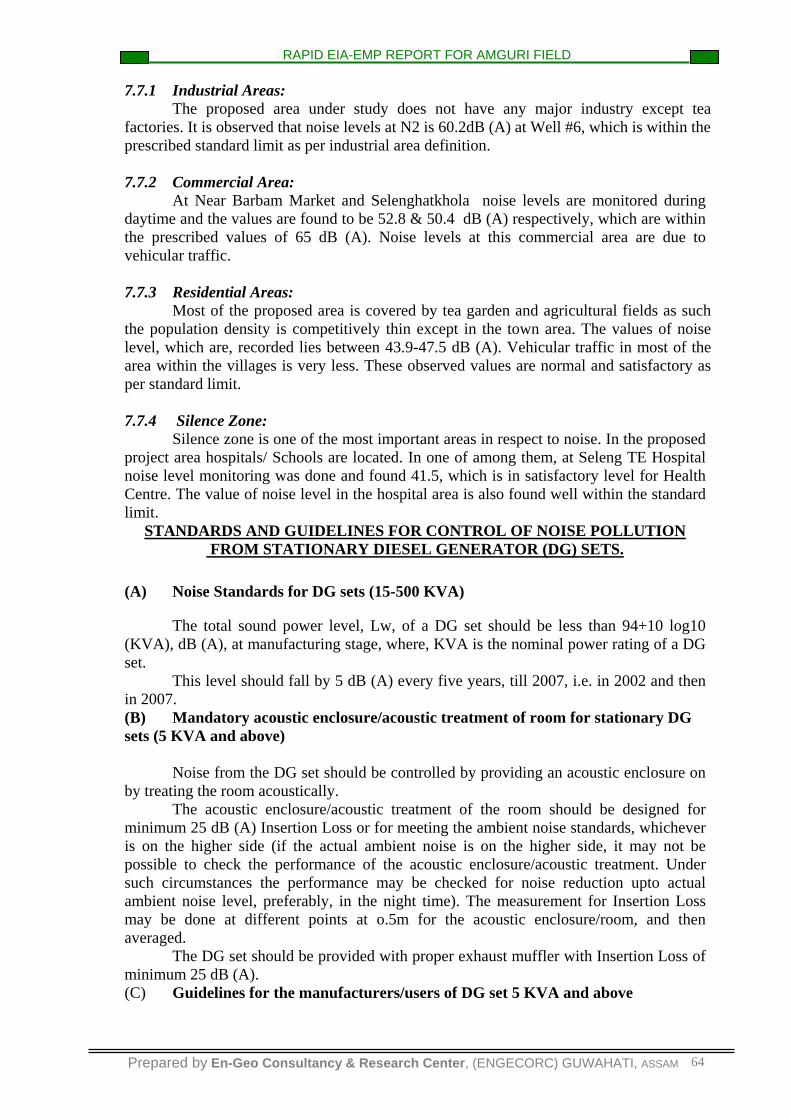
A Few Field Photographs of Noise Monitoring Locations.
At Mirichutia Gaon.
At Padumhatkhola.
*******
Prepared by En-Geo Consultancy & Research Center, (ENGECORC) GUWAHATI, ASSAM 65
RAPID EIA-EMP REPORT FOR AMGURI FIELD
Prepared by En-Geo Consultancy & Research Centre, (ENGECORC) GUWAHATI, ASSAM 66
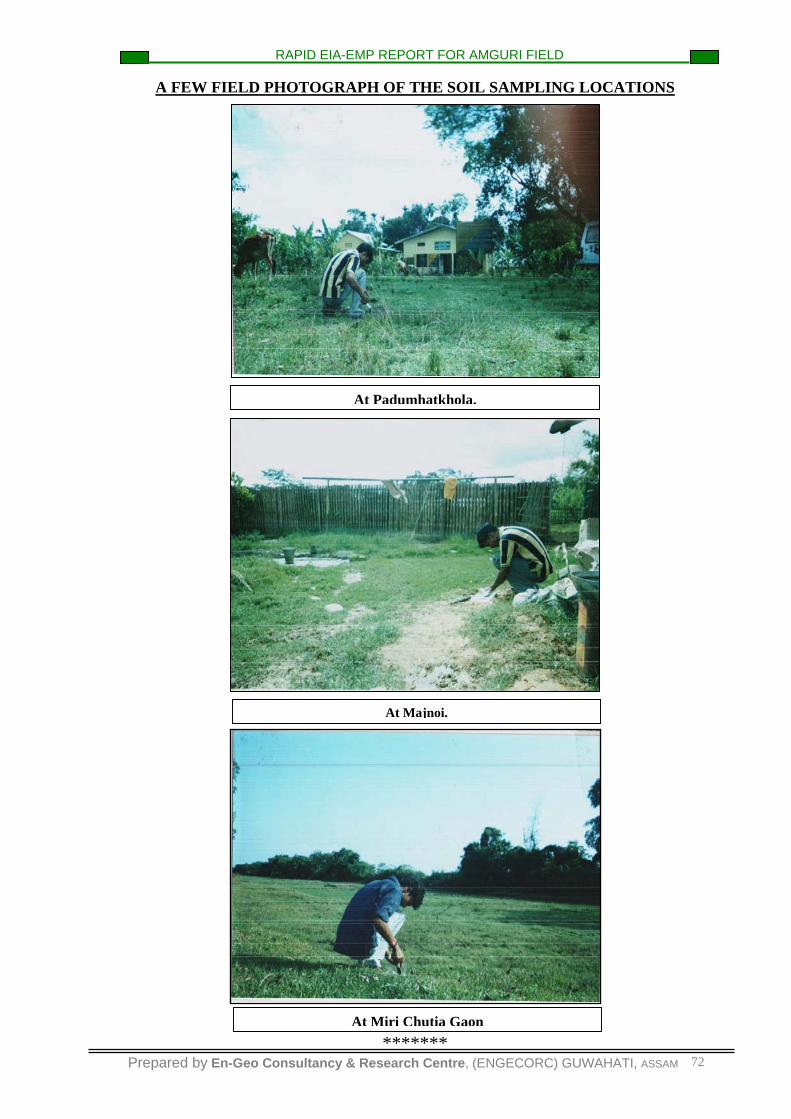
CHAPTER VIII 8.0 Land Environment: Land is one of the most precious natural resources, aptly described as the bridge between the inanimate and the living. It is both a finite and infinite natural endowment. It is infinite, if it is used for organic production process, such as agriculture, plantations, forest etc. It is finite, if it is used for urbanization, mining, quarrying etc. It has one of the poorest land-man relations in the world. Of the total land in the country, which is assessable and capable of production, 54% is used for agriculture. So it is one of the most precious resources of our country. This resource is getting degraded both by natural forces and human activity. Nearly 57% of the country’s geographical area is under various degrees and categories of the soil degradation. Soil erosion, due to water and wind is the single largest cause of degradation, followed by water logging, salinity and declining fertility. Soil is also becoming increasingly polluted with municipal and domestic sewage, pesticides and fertilizers. Degradation of soil has many direct and indirect ill effects. Accelerated runoff, sedimentation of rivers and reservoirs, disruption of nutrient cycle, alteration in water and energy balances, pollution of water bodies and emission of green house gases into the atmosphere are some of the off site impacts. Through its impacts on agricultural productivity and environment, Soil degradation leads to food shortage, which in turn leads to political and social instability. Thus, it affects the very fabric of society. Hence, the assessment of soil quality for agricultural productivity along with management of land is therefore very pertinent issue for a country in recent time. The proposed project area is covered with thick fertile mantle of alluvium build by aggradations rock of the Brahamaputra and its tributaries. Most of the study area is covered with Tea Gardens and agricultural fields. Tea and paddy cultivation are the main primary resources base product of the region. Most of the people depends agriculture for their substances. 8.1 Sampling Stations: On the basis of topography, land use pattern and human activities like agricultural practice and proposed drilling locations are taken into consideration, for selection of the sampling location. The location of the sampling points is indicated in the Fig. 8.1. The details are given below:
Sampling Locations Stations
1. At Majnoi. … … S1 2. From Well No. 6. … … S2 3. At Dulia Gaon. … … S3 4. Barbam T.G … … S4 5. At Miri Chutia Gaon … … S5 6. Padumhatkhola … … S6
RAPID EIA-EMP REPORT FOR AMGURI FIELD
Prepared by En-Geo Consultancy & Research Centre, (ENGECORC) GUWAHATI, ASSAM 67
Gulia Gaon
Chaodang Gaon Beltu
Padumani Chetia GaonHatimuria Gaon
Japihajia Gaon
Gali beel
PO
Seleng T G
Kathalbaria
Jengabari Gaon
Majnai
PitakhoaItakhoa
Amtalia
Dulia Gaon
Factory
Jhan
zi R.
Amguri TG
Kukurakhoa
Ratnakar Satra
Koa Senchoa
PTO
Boisahabi TG
Padumhat Khola
gharphalia
Dallim TG
Labours' line
TG
Taralbasti
Majnai TG
KaliapaniDeodhria Gaon
Longpuria
Dallim
SelenghatRS
Barangayan
Borangayan
chetia Gaon
Charingia
Bailung Gaon
Chetia
Senchoa
chetia Gaon
Dibrual
Changmai Gaon
Charai Mari Gaon
Churamani Gaon
PTOPuranimatia
churamani GaonJhanzi
Pachani Gaon
Bara Gaon
PODihingia Gaon
Barangayan
Teok TG
Disp.
NORTHEAST F
ROINTIE
R RAILW
AY MAIN
LINE
Khanikar TG
Lahing Taralbasti
Gakhirkhoa
Na Gohali Chuk
Abhayapuria
PO
Abhaypuria
Kaliapani Gaon
Gohain Gaon
Gohain Gaon
Chaodang
Abhayapuria
Chaodang
Dibrual
Kaithalguri
Labjan T.G.
Changmai Khankar
GELEKY RESERVE FOREST
Khanikargaon
Laojangaon
HospitalSimaluguri
Naharkatia
RS
Miri Chutiya
Raidangiagaon
Naobaichagaon
Arandharagaon
Jalukgaon
Chaodanggaon
Kamargaon
Baruakurigaon
Lephera Chaodang
Dhekial
Baruagaon
Duliagaon
Bhujangaon
PS
Sonoalgaon
Dibrualgaon
Hospital
Baghjan T G
Kuargaon
Japihajiagaon
Japihajlagaon
Gharphaliagaon
Gharphaliagaon
Haloagaon
Hatimuriagaon
Hatimuriagaon
Dhenuchuchagaon
Mourabazar
GharphaliagaonUttar
Jeheniagaon
AMGURI
JANJHI
AMGURITOWN
FIG:8.1 MAP SHOWING SOIL SAMPLING STATIONS AT AMGURI FIELD
En-Geo Consultancy & Research CentreDigital Database Created By :
RAP GEOGHIC
TEM
Km
Gaon
Gaon
Gaon
(An ISO 9001:2000 Certified Company)4. TEA GARDEN............
5.SOIL SAMPLING STATION
6. WATER BODY..................
WELL-06
Barbam Market
Selenghatkhola
LEGEND STUDY UNDERTAKEN FOR
GRAPHICAL SCALE:
S1
S2
S3
S4Barbam TE
S5
S6WELL-05
S1
RAPID EIA-EMP REPORT FOR AMGURI FIELD
Prepared by En-Geo Consultancy & Research Centre, (ENGECORC) GUWAHATI, ASSAM 68
8.2 Objectives of the Study: The main objective of the soil study is to assess present status of the soil characteristics in respect to productivity as well as to ascertain the level of pollutants if any.
8.3 Methodologies and Parameter Analyzed: In general ecosystem analysis for nutrient dynamic and characterization, rooting depth sampling is adequate. Accordingly soil samples were collected from a depth of 10-15 cm from the surface. Methodology for collection and analysis of the soil samples were followed as prescribed in the Standard methods i.e. Practical Method in Ecology & Environmental Science by R. K. Trivedy, P.K. Goel and C.L. Trisal and heavy metal were analyzed by using A.A.S. For assessment of soil characteristics following parameters were taking into consideration.
8.4 Observed Soil Quality: From the analytical result of the soil samples as given in the Table: 8.1, following observation are made. 8.4.1 Physical Characteristics: Similar physical nature of the soil is observed in all the sampling points with slight variation, otherwise all the soil samples are sandy loam. The pH values were observed between 5.9-6.5, which indicates the soil quality is acidic in nature. It conforms to the normal conditions of soils of Assam region. It is concluded that the quality of soil is normal and considered as good productive soil. This type of soil is suitable for cultivation of tea plantation. The water holding capacity of the soil samples reflect an encouraging status for productivity. The value of ‘percentage’ water holding capacity ranges between 35.6-38.4 %, indicating the suitability of soil quality for any type of agricultural practices. 8.4.2 Chemical Properties: It is observed that the main nutrient parameters i.e. Nitrogen & Phosphate of the soil in all the sampling stations are well within the suitable range 0.292 % - 0.316 % of TKN. Presence of suitable amount of nitrogen in the soil encourages the above ground, vegetative growth and gives a deep green colour to the leave. Phosphate is most essential element in influencing plant growth and production.
RAPID EIA-EMP REPORT FOR AMGURI FIELD
Prepared by En-Geo Consultancy & Research Centre, (ENGECORC) GUWAHATI, ASSAM 69
Page for Soil Table.
Page for Soil Table.
RAPID EIA-EMP REPORT FOR AMGURI FIELD
Prepared by En-Geo Consultancy & Research Centre, (ENGECORC) GUWAHATI, ASSAM 70
The third fertilizer element i.e. potassium content in the soil samples are observed in the range of 0.02 to 0.04 mg/gm. Otherwise the content of phosphorous in all the soil samples are in acceptable range. These ranges of phosphorous contents may be treated as good activator of enzymes responsible for plant metabolic process and also increases crop resistance. The values of % Carbon and % Organic matters in the soil samples are in satisfactory level in respect to agricultural productivity. The value of % organic matter recorded in the range of 1.24 – 3.12 % in the soil samples and % Carbon Content lies between 0.72-1.81 percent in the samples. It is further observed that the C/N ratio of the soil depicts a good picture in respect to active role of micro-organism for available nitrogen and at the same time this C/N ratio help in the stability of soil condition for performing fruitful cultivation and production. The metal content of the soil is quite normal. No toxic metals i.e. Cd, Pb, Cr, Ni are found below detectable range. Zn and Cu content in soil are in satisfactory level.
GRAPHICAL PRESENTATION OF SOIL QUALITY
6.2
38.2
5.9
36.8
6.2
37.2
6.2
36
6.4
35.6
6.5
38.9
0
5
10
15
20
25
30
35
40
Qua
ntity
S1 S2 S3 S4 S5 S6
Diagram showing Inorgenic Parameters of S1-S6
PH W.H.C
Fig. 8.2 (a)
0.12
2.6
1.14
3.1
0.15
2.6
0.16
2.8
0.14
2.1
0.12
2.2
0
0.5
1
1.5
2
2.5
3
3.5
Qua
ntity
(mg/
gm)
S1 S2 S3 S4 S5 S6
Diagram showing Inorgenic Parameters of S1-S6
Na PO4
Fig. 8.2 (b)
RAPID EIA-EMP REPORT FOR AMGURI FIELD
Prepared by En-Geo Consultancy & Research Centre, (ENGECORC) GUWAHATI, ASSAM 71
0.29
2
1.23
0.31
2
1.81
0.29
4
1.29
0.31
4
0.74
0.31
6
0.77
0.22
6
0.72
0
0.5
1
1.5
2
Qua
ntity
(%)
S1 S2 S3 S4 S5 S6
Diagram showing Inorgenic Parameters of S1-S6
TKN C
Fig.8.2 (c)
0.02
0.01
3
0.04
0.00
36
0.02
0.00
44
0.04
0.00
52
0.04
0.11
280.
02
0.00
76
0
0.02
0.04
0.06
0.08
0.1
0.12
Qua
ntity
(mg/
gm)
S1 S2 S3 S4 S5 S6
Diagram showing Inorgenic Parameters of S1-S6
K Zn
Fig. 8.2 (d)
2.12
3.12
2.22
1.28 1.32 1.24
0
0.5
1
1.5
2
2.5
3
3.5
Qua
ntity
(%)
S1 S2 S3 S4 S5 S6
Diagram showing Orgenic matter of S1-S6
O.M.
Fig. 8.2 (e) 8.5 Conclusion: From the analytical results of soil samples it can be observed that the soil quality of this area is quite encouraging for plant growth and tea cultivation, more suitable especially in high land portion.
RAPID EIA-EMP REPORT FOR AMGURI FIELD
Prepared by En-Geo Consultancy & Research Centre, (ENGECORC) GUWAHATI, ASSAM 72
A FEW FIELD PHOTOGRAPH OF THE SOIL SAMPLING LOCATIONS


![Case series }u vP]v Wv}v o X }vG] }(]v Wv}v o X ooµ Z} }v ... · PDF filethe Department of Anatomy, Gauhati Medical College, Guwahati. ... normal livers (e.g. spleen, pancreas etc.)](https://static.documents.pub/doc/80x56/5a9c28727f8b9a30358e7349/case-series-u-vpv-wvv-o-x-vg-v-wvv-o-x-oo-z-v-department-of-anatomy.jpg)


