Page 1
CHARACTERIZATION OF SOLID ACID CATALYSTS
FOR ISOBUTANE/BUTENE ALKYLATION
By
ALEXANDRU PLATON
A dissertation submitted in partial fulfillment of The requirements for the degree of
DOCTOR OF PHYLOSOPHY
WASHINGTON STATE UNIVERSITY Department of Chemical Engineering
DECEMBER 2004
Page 2
ii
To the Faculty of Washington State University:
The members of the Committee appointed to examine the dissertation of
ALEXANDRU PLATON find it satisfactory and recommend that it be accepted.
_______________________________________ Chair
_______________________________________ _______________________________________ _______________________________________
Page 3
iii
ACKNOWLEDGEMENTS
I would like to thank Dr. William J. Thomson for his invaluable advice and help with
defining my research goals and building the necessary self-confidence in order to finalize this
work. I would also like to express my thanks to my committee members, Dr. Kerry W. Hipps, Dr.
Reid C. Miller and Dr. Richard L. Zollars, for their inexhaustible patience towards my many
hesitations along this work. Many thanks go to my close friends and fellow researchers Sekar
Darujati, Dr. David C. Lamont and Dr. Rakesh Radhakrishnan for being very patient listeners and
for providing excellent technical advice, as well as to Diana Thornton, Jo Ann McCabe and Paul
Golter for their help with technical and administrative issues.
Most of this work was carried on in, and funded through, the O.H. Reaugh Laboratory for
Oil and Gas Processing Research.
Page 4
iv
CHARACTERIZATION OF SOLID ACID CATALYSTS
FOR ISOBUTANE/BUTENE ALKYLATION
Abstract
By Alexandru Platon, Ph.D. Washington State University
December 2004
Chair: William J. Thomson
The extinction coefficient ratio (ECR) of coordinatively bonded pyridine (Lpy) and
protonated pyridine (Bpy) was determined by diffuse-reflectance FTIR spectroscopy (DRIFTS),
by exposing sulfated zirconia (SZ) containing chemisorbed pyridine to water vapor. The
previously suggested portability of published ECR values between different IR spectroscopy
techniques or different types of materials was found questionable. For the SZ samples analyzed,
an ECR value of 2.05 was determined, which allowed the measurement of an initial
Lewis/Brönsted acidity ratio of 1.1 in the freshly activated material. This ECR determination
method should be applicable to other similar solid acids.
In a separate study, a new model test reaction was proposed for the estimation of low-
temperature hydride transfer (HT) activity of solid acids. The reaction of cyclohexene with
isobutane on zeolites Beta having SiO2/Al2O3 ratios of 25 (25BEA) and 75 (75BEA), ZSM-5 and
SZ, distinguished between disproportionation/hydrogen transfer (DHGT) and HT. HT was
enhanced in 25BEA due to its higher acid density. On the other hand, the very high acid density
SZ was less active than expected for HT due to its low isobutane adsorption capacity. ZSM-5
completely lacked HT activity although it showed significant DHGT activity.
Finally, the catalytic behavior of the mentioned catalysts was studied in gas-phase, batch
alkylation experiments employing isobutane and 1-butene at 80 °C. The observed alkylation
Page 5
v
performance was compared to their low-temperature HT activity, total acidity, adsorption
capacity and surface area. The measured HT activity correlated with the amount of
trimethylpentane produced per acid site for all materials with 25BEA being the most active and
ZSM-5 being totally inactive for alkylation. Although of moderate alkylation activity, SZ had a
higher cracking activity than other materials. Modification by water vapor exposure of 25BEA
and SZ did not noticeably change their Brönsted acidity, but selectively lowered their alkylation
activity by competitive adsorption between water and isobutane. The apparent butene conversion
correlated well with the total catalyst surface area rather than with the total amount of acid sites.
Evidence indicates that competitive adsorption with butene limits isobutane access to the active
sites in all studied materials, resulting in limited hydride transfer.
Page 6
vi
TABLE OF CONTENTS
Page
ACKNOWLEDGEMENTS ........................................................................................................... iii
ABSTRACT ....................................................................................................................................iv
CHAPTER
1. GENERAL INTRODUCTION ...........................................................................................1
Background on alkylation.............................................................................................1
Alkylation on solid acid catalysts .................................................................................3
Solid acid catalyst characterization...............................................................................4
2. QUANTITATIVE LEWIS/BRÖNSTED RATIOS USING DRIFTS (manuscript) .........13
3. LOW-TEMPERATURE TEST REACTION FOR HYDRIDE TRANSFER ON SOLID
ACID CATALYSTS (manuscript)....................................................................................31
4. SOLID ACID CHARACTERISTICS AND ISOBUTANE/BUTENE ALKYLATION
(manuscript).......................................................................................................................48
APPENDIX
A. PYRIDINE/DRIFTS MEASUREMENTS AND DATA ..................................................69
B. TGA/MS MEASUREMENTS AND DATA.....................................................................75
C. AMMONIA AND ISOBUTANE ADSORPTION –
MEASUREMENTS AND DATA.....................................................................................81
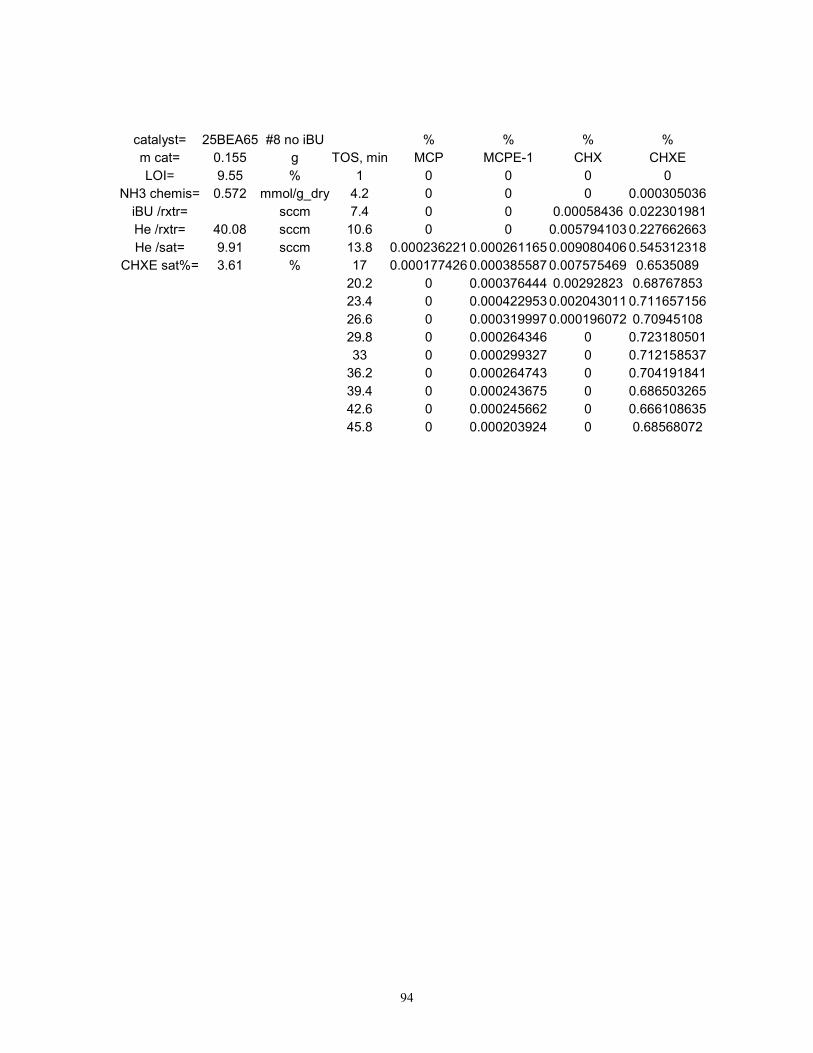
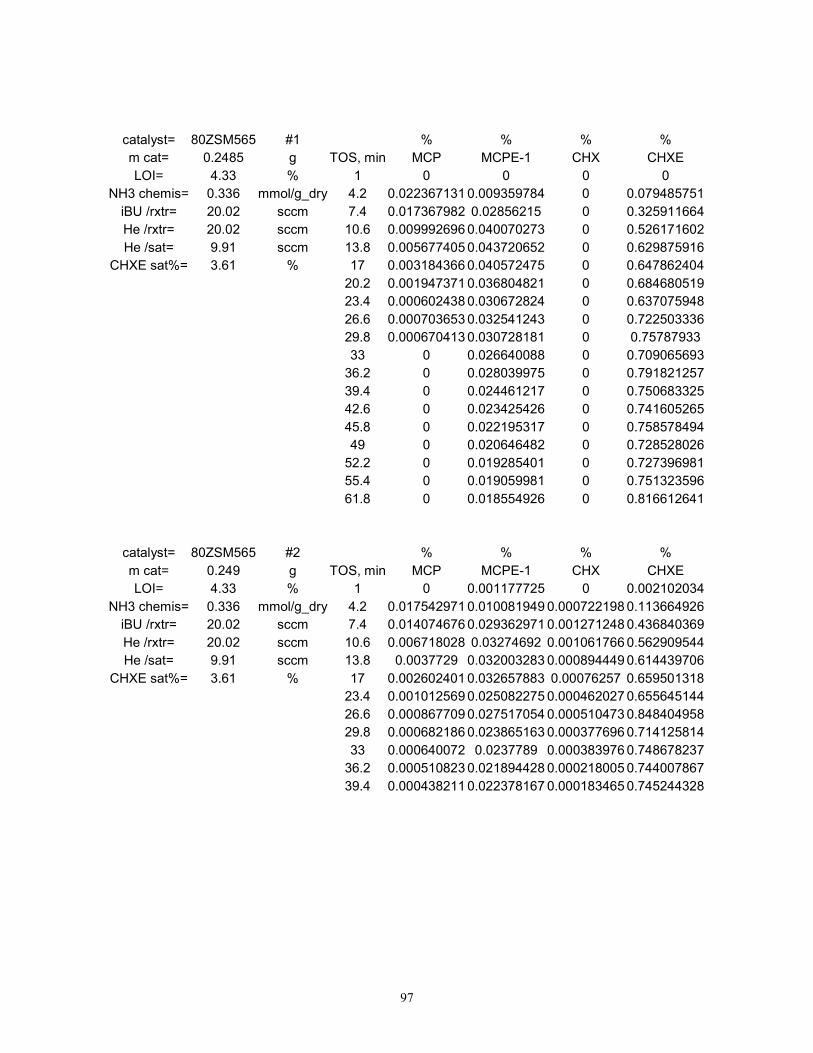
D. RAW HYDRIDE TRANSFER TEST DATA...................................................................89
E. RAW ALKYLATION TEST DATA ................................................................................99
Page 7
vii
Dedication
This work is dedicated to my wife, Codruta, and my son, Alex Jr., who supported me through the
last five years with their limitless confidence and encouragement.
Page 8
1
CHAPTER ONE
GENERAL INTRODUCTION
This work consists of three manuscripts, included in Chapters 2, 3 and 4, which follow
the formats required by the journals Industrial and Engineering Chemistry Research, Catalysis
Letters and Applied Catalysis A: General, respectively. Additionally, a general introduction and
supporting appendices are included in the standard dissertation format. The manuscripts are
coauthored with Professor W.J. Thomson. Mr. Platon contributed with the experimental work,
data analysis and manuscript writing, while Professor Thomson contributed with guidance,
knowledge and organization of manuscript ideas.
Background on Alkylation
From the total US gasoline pool, alkylate constitutes the component having the third most
important contribution to the octane number (Table 1.1 [1]), being surpassed only by reformate
(composed mostly of aromatic hydrocarbons and isoparaffins) and catalytic cracker gasoline
(composed mostly of olefins). Several drawbacks are associated with both reformate and the cat
cracker gasoline. Aromatic hydrocarbons are carcinogens and environmental hazards, especially
if they contaminate aquifers adjacent to gasoline storage and distribution facilities. Olefins on the
other hand have an elevated tendency to polymerize in the presence of ambient oxygen with the
subsequent formation of polymeric deposits in tanks, ducts and fuel injectors; in the quest to
increase the fuel efficiency of the internal combustion engine, restrictions in the allowed content
of polymer precursors are expected to affect the allowed proportion of cat cracker gasoline in the
total pool. Besides alkylate, other high octane number components that could constitute
alternatives include the butane fraction, characterized however by a high volatility and only
suitable for cold climates, and oxygenate components, which have a lower heat of combustion
Page 9
2
than hydrocarbons and are either toxic (methanol), expensive or dangerous to the environment
(ethers easily contaminate aquifers). Alkylate constitutes a very promising alternative to all the
above-mentioned components as it is non-reactive, nontoxic and has a low volatility.
The refinery process of isobutane alkylation with olefins, although a commercial success,
is based on liquid acid catalysts such as hydrofluoric acid and sulfuric acid, which are very
corrosive, and either relatively expensive to recover (H2SO4), or very dangerous in case of an
accidental release (HF). The process is making use of refrigeration in order to achieve the
required low reaction temperatures (typically 5–15 °C). Comparatively, a solid acid catalyst
would be more convenient in terms of reaction temperature, safety and recovery. Researchers
from the SunOil laboratories observed in pioneering studies that an exchanged zeolite was active
for alkylation catalysis at temperatures between 25–100 °C [2]. A major drawback, however,
evidenced in all laboratory-scale evaluations of solid acid catalysts for alkylation is their rapid
deactivation.
Despite the fact that other successful refinery processes in which the catalyst deactivates
within fractions of a second have been used for decades (FCC, or fluid catalytic cracking), current
constraints in a refiner’s economics arising from such factors as oil price fluidity and emerging
environmental policies are making investments in new processes unattractive. Moreover, the
current material balance of the typical US refinery is making use of most of the C3-C4 fraction
available [1]. Refiners will most probably lack motivation to adopt a new solid-acid-based
alkylation process unless particularly stable catalysts and promising technologies are identified.
Page 10
3
Alkylation on solid acid catalysts
The global reaction and principal mechanism for isobutane alkylation with butene are
depicted in Figure 1.1. The relative rates of the elementary processes involved determine the
outcome of the overall alkylation process, with the most important products being the C8
isoalkanes. Most notable is the step involving the octyl carbenium ion that is usually
accompanied by side reactions characteristic of the carbocation chemistry. These side reactions
include isomerization, multiple olefin addition, cracking and dehydrogenation, some of which are
thought to be responsible for catalyst deactivation. One major factor determining these side
processes is the C8 intermediate lifetime, which in turn is determined by the rate of hydride
transfer from isobutane. It is therefore the relative rate of hydride transfer that seems to play an
important role in the alkylation process.
A recurring finding from studies on solid acid-catalyzed alkylation is that the catalyst
deactivates after a very limited number of alkylation turnovers due to loss of hydride transfer
activity. Indications were found that the type, strength and density of acid sites are factors that
determine catalyst performance during alkylation. The initial subject of research in this work was
the identification of key catalyst characteristics that would lead to a successful solid-acid catalyst
for the alkylation of isobutane with 1-butene. The emphasis on catalyst characterization led to
efforts to develop novel methods of quantifying Lewis and Brönsted acidity on solid acids and of
measuring the “true”, Rideal-type bimolecular hydride transfer between isobutane and larger
hydrocarbon intermediates. Finally, these characterization techniques, complemented by total
acidity and reactant adsorption measurements, were employed in a comparative study of the
catalytic behavior of several solid acids in batch, gas-phase alkylation tests.
Page 11
4
Solid acid catalyst characterization
The solid acid catalysts chosen in this study are Beta (BEA) zeolite and sulfated zirconia
(SZ), both of which were previously found to have some activity in the alkylation reaction, as
well as ZSM-5, which is a known cracking catalyst previously evidenced to lack alkylation
activity. Comparing several types of solid acids allowed to evaluate the effect of the catalytic
material type on alkylation. An important characteristic of silica-alumina zeolitic acids is their
SiO2/Al2O3 ratio (SAR), which determines the theoretical density of acid sites. Two SAR values
were chosen for the BEA material: 25 (high acid density) and 75 (low acid density). This way, the
effect of acid density upon alkylation activity could be evaluated. The four mentioned catalysts
were characterized for their acidity type (Lewis/Brönsted), total acidity, as well as their
interaction strength with the reactants isobutane and 1-butene. A short introduction to each
characterization method is given below, along with pointers to the material in the following
chapters and appendices.
Lewis/Brönsted DRIFTS
Some controversy exists regarding the nature of acid sites responsible for sustained
hydride transfer activity and, hence, prolonged alkylation activity. [3,4] An attempt was initially
made to measure the relative concentrations of Lewis and Brönsted acidity on the mentioned
catalysts and then estimate their effect on alkylation activity. A diffuse-reflectance FTIR
spectrometer (DRIFTS) setup was employed in this respect, based on the fact that pyridine
interacting with Lewis (Lpy) and Brönsted (Bpy) acids has different infrared spectra. While no
success was recorded in detecting any Brönsted acidity in the freshly activated zeolites 25BEA
and 75BEA (activation details are given in Chapters 3 and 4), in the case of SZ both acid site
types were detected. However, as emphasized in Chapter 2, in an attempt to quantify the Lpy/Bpy
concentration ratio in SZ, no reliable source for the otherwise assumed-constant extinction
Page 12
5
coefficients could be identified. Noting reports that Lewis and Brönsted sites readily interchanged
in SZ under the effect of water exchange, the setup in Figure 1.2 was used to simultaneously
measure the extinction coefficient ratio and concentration ratio for the Lpy and Bpy species in
SZ, as shown in Chapter 2. Further details regarding the statistical data processing involved are
also given in Appendix A.
Adsorption measurements: ammonia chemisorption and isobutane adsorption capacity
Knowledge of the number of active sites is essential when different materials, or
materials with different active site densities are compared. Catalytic reaction rates expressed in
terms of per-site turnovers per unit time are a direct indication of the catalytic activity when all
other reaction conditions are held constant. Titration with a base such as ammonia is a convenient
method to measure the number of acid sites in solids, and temperature-programmed desorption
and the volumetric measurement of chemisorption isotherms are among the most frequently used
titration techniques. In this study volumetric measurements of ammonia chemisorption isotherms
were used to determine the total acidity of the studied catalysts. An ASDI RXM-100 catalyst
characterization apparatus capable of a theoretical sensitivity of ~ 5x10⁻⁶ mmol was used for this
purpose.
Crucial for the accuracy of these measurements is the knowledge of the dry weight of the
catalyst samples investigated. Moreover, as shown in Chapters 3 and 4, some of the catalysts
studied were obtained in their ammonium-exchanged form, and required a decomposition step in
which acid sites are released from the interaction with ammonia. Samples from each catalyst were
subjected to thermogravimetric/mass spectrometry (TG/MS) studies that allowed the
simultaneous measurement of the dry mass as well as the optimal decomposition/dehydration
(activation) temperatures.
Page 13
6
Details regarding the TG/MS measurements and data acquired are given in Chapters 3, 4,
as well as in Appendix B. The experimental procedure and calculation method involved in the
volumetric acid site titration with ammonia are described in Appendix B and the experimental
data acquired is also included. Attempts were also made to quantify the chemisorption of
alkylation reactants – isobutane and 1-butene. However only the amount of physisorbed isobutane
could be measured on the above-mentioned catalysts, as shown in Chapters 3, 4, and Appendix B.
Hydride transfer activity characterization
Since hydride transfer (HT) seems to be an important factor in alkylation as emphasized
above, a method was sought to directly measure the HT activity of the studied catalysts at a
temperature that is relevant to the alkylation reaction, differentiating at the same time between the
“true”, Rideal-type hydride transfer and hydrogen transfer from carbonaceous deposit on the
catalyst. Based on observations that cyclohexene was reluctant to cracking at relatively elevated
temperatures, a new test method for the measurement of low temperature HT activities was
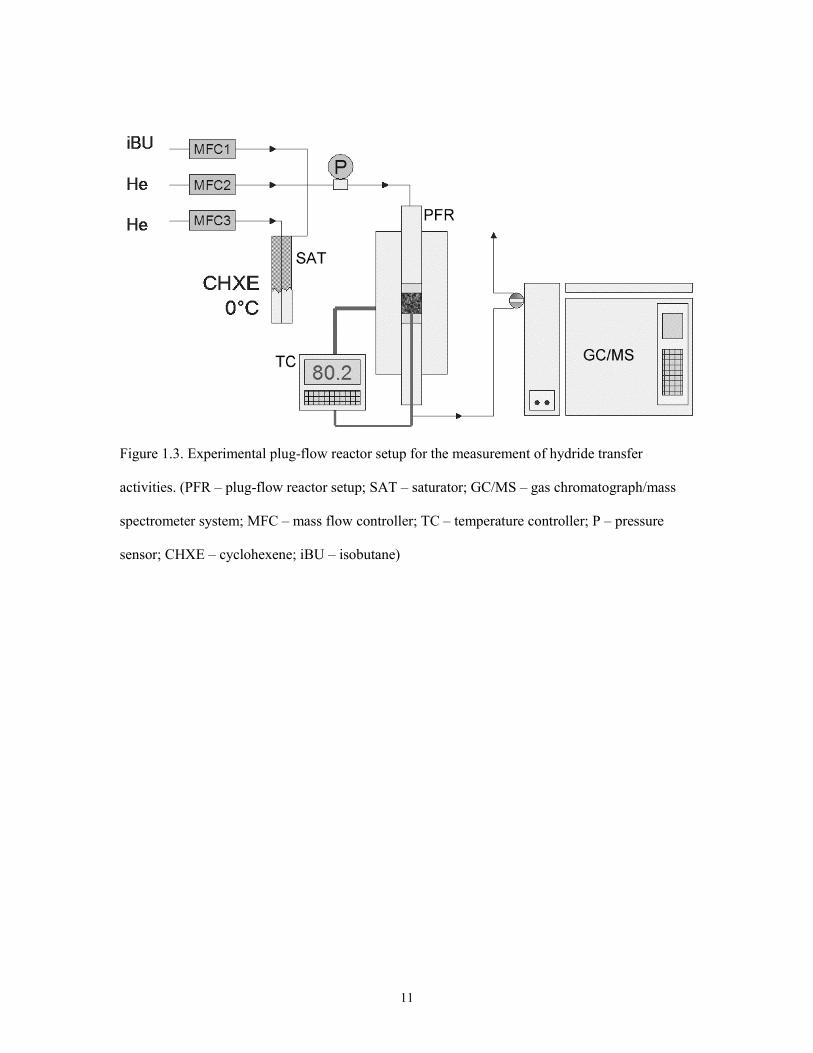
devised. Tests on all catalysts in an experimental setup similar to that in Figure 1.3 showed that
the reaction between cyclohexene and isobutane only yielded products of HT and isomerization at
80 °C. Moreover, the particular chemistry of the reaction system chosen allowed for the active
sites involved in HT processes to be titrated, as shown in Chapter 3. The raw experimental data is
included in Appendix D.
Alkylation reaction tests
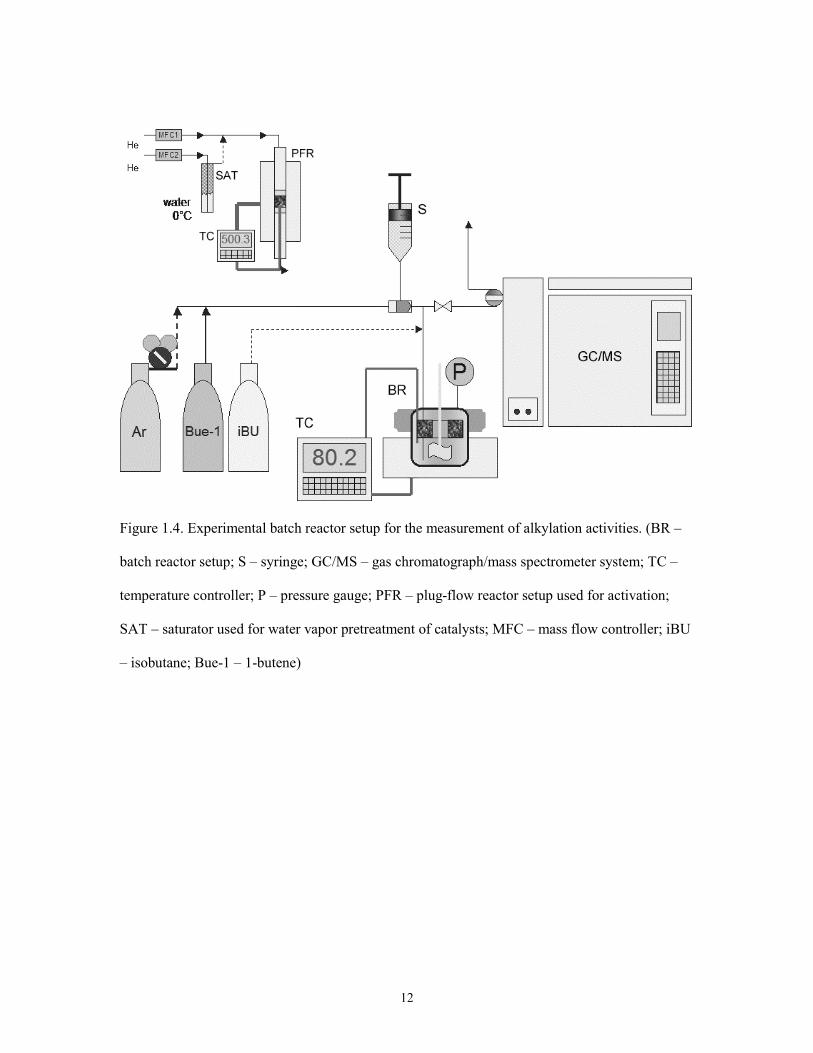
In order to evaluate the effect of the measured catalyst characteristics on alkylation
activity, a simple batch reactor setup was used (Figure 1.4) in which catalysts were contacted
with a constant feed mixture based on a constant butene/acid site ratio. As shown in Chapter 4,
the four catalysts were compared in terms of 2,2,4-trimethylpentane, dimethylhexanes, C8 olefin
and n-pentane productivities per active site. The effect of water vapor pre-exposure for 25BEA
Page 14
7
and SZ was also tested, although no change in the relative Lewis/Brönsted population could be
induced. The raw numerical results from the alkylation reaction tests are included in Appendix E.
References
1. K.D. Miller, Jr., DeWitt & Company Inc., Alkylates. Key components in clean-burning
gasoline, presented to the Clean Air Act Advisory Committee Panel on Oxygenate Use in
Gasoline, May 24, 1999 (www.epa.gov/otaq/consumer/fuels/oxypanel/dxmiller.ppt, accessed
9/13/2004).
2. F W. Kirsch, J.D. Potts, D.S. Barmby, Proceedings - American Petroleum Institute, Division
of Refining 48 (1968) 1000.
3. A. Feller, I. Zuazo, A. Guzman, J.O. Barth, J.A. Lercher, J. Catal. 216 (2003) 313.
4. L. Fan, I. Nakamura, S. Ishida, K. Fujimoto, Ind. & Eng. Chem. Res. 36 (1997) 1458.
Page 15
8
Table 1.1. Octane number (O.N.) contributions from components of a typical US gasoline. [1]
(MTBE – methyl-tert-butylether; TAME – tert-amyl-methylether)
Gasoline Component % of Pool Blending O.N. Contribution
Reformate 41.40 88 36.4
Fluid cat cracker gasoline 26.40 86 22.7
Alkylate 14.30 93 13.3
Isomerate 7.40 87 6.4
Alcohols 3.40 108 3.7
Light straight-run gasoline 1.90 73 1.4
Hydrocracker gasoline 1.60 81 1.3
MTBE 1.00 110 1.1
n-Butane 1.10 92 1.0
Light delayed cocker gasoline 1.20 78 0.9
TAME 0.30 105 0.3
Total 100.00 88.6
Page 16
9
Figure 1.1. Global reaction and main elementary steps in the alkylation of isobutane with butene.
iC4H10 + C4H8 → iC8H18
Page 17
10
Figure 1.2. Experimental setup for the simultaneous measurement of the Lewis/Brönsted
extinction coefficient ratio and concentration ratio.
Page 18
11
Figure 1.3. Experimental plug-flow reactor setup for the measurement of hydride transfer
activities. (PFR – plug-flow reactor setup; SAT – saturator; GC/MS – gas chromatograph/mass
spectrometer system; MFC – mass flow controller; TC – temperature controller; P – pressure
sensor; CHXE – cyclohexene; iBU – isobutane)
Page 19
12
Figure 1.4. Experimental batch reactor setup for the measurement of alkylation activities. (BR –
batch reactor setup; S – syringe; GC/MS – gas chromatograph/mass spectrometer system; TC –
temperature controller; P – pressure gauge; PFR – plug-flow reactor setup used for activation;
SAT – saturator used for water vapor pretreatment of catalysts; MFC – mass flow controller; iBU
– isobutane; Bue-1 – 1-butene)
Page 20
13
CHAPTER TWO
QUANTITATIVE LEWIS/BRÖNSTED RATIOS USING DRIFTS†
Alexandru Platon and William J. Thomson*
Department of Chemical Engineering,
Washington State University,
Pullman, Washington 99164-2710;
Abstract
The extinction coefficient ratio (ECR) of coordinatively bonded pyridine (Lpy) and
protonated pyridine (Bpy) was determined in situ by diffuse-reflectance FTIR spectroscopy
(DRIFTS), by exposing sulfated zirconia (SZ) containing chemisorbed pyridine to water vapor.
Both pure and KBr-diluted SZ samples were analyzed. The linearity with concentration of the
Kubelka-Munk transformation was verified for pyridine interacting with the undiluted SZ
samples. The portability of published ECR values between transmission and diffuse-reflectance
IR spectroscopy, as well as between different types of materials, was found questionable. For the
SZ samples analyzed, following a statistical analysis of the data, an Lpy/Bpy ECR value of
2.05 ± 6.3% was determined, resulting in the calculation of an initial Lewis/Brönsted acidity ratio
value of 1.1 in the freshly activated material. This ECR determination method should be
applicable to other similar solid acids that have a window of relative transparency in the 1600-
1400 cm-1 range and are capable of retaining chemisorbed pyridine upon exposure to water vapor.
† Reproduced with permission from Industrial & Engineering Chemistry Research, vol. 42 (issue
24, 2003) pages 5988–5992. Copyright 2003 American Chemical Society.
* To whom correspondence should be addressed. Tel.: (509)335-8580. Fax: (509)335-4806. E-
mail: [email protected]
Page 21
14
Keywords: in situ DRIFTS; diffuse-reflectance; Lewis/Brönsted; extinction coefficient ratio;
sulfated zirconia.
1. Background
Acidity characterization is often performed to measure the density, strength, and type of
acid active sites of solid catalysts. Such knowledge helps correlate observed catalyst activity with
details from the catalyst preparation stage and provides valuable information for the elucidation
of reaction mechanisms. One such acidity characteristic is the surface population distribution of
Brönsted and Lewis acid sites. The easiest and most direct method of distinguishing between
Brönsted and Lewis acid species is the IR spectroscopy of chemisorbed pyridine.1-5 Upon
interaction with a Brönsted (B) acid, pyridine is protonated and absorbs at a specific IR
wavelength around 1540-1545 cm-1 (Bpy), as well as at several other specific wavelengths not
discussed here. Following interaction with a Lewis (L) acid site, pyridine will also form a
coordinatively bonded complex with a specific IR absorption band centered in the range 1449-
1452 cm-1 (Lpy), along with several other bands. In addition, a band at about 1490 cm-1 is
common to both species. Depending on the analytical technique, quantification of absolute or
relative L/B populations from spectral data involves either the calculation of band absorbances in
transmission IR spectroscopy or a Kubelka-Munk (KM) transformation of diffuse-reflectance
spectra of powder samples.6 In transmission spectroscopy, the calculation of absolute
concentrations from absorbance band intensities is possible through the Lambert-Beer law.
However, in a diffuse-reflectance measurement, such a derivation is restricted to the particular
setup used and is usually heavily affected by errors caused by nonrepeatability in particle size and
packing density between different samples.7,8 Error margins of as much as 10% are reported,8
although a comparable error range is also frequent in transmission IR data (e.g. calculation of
molar absorption coefficients9 ).
Page 22
15
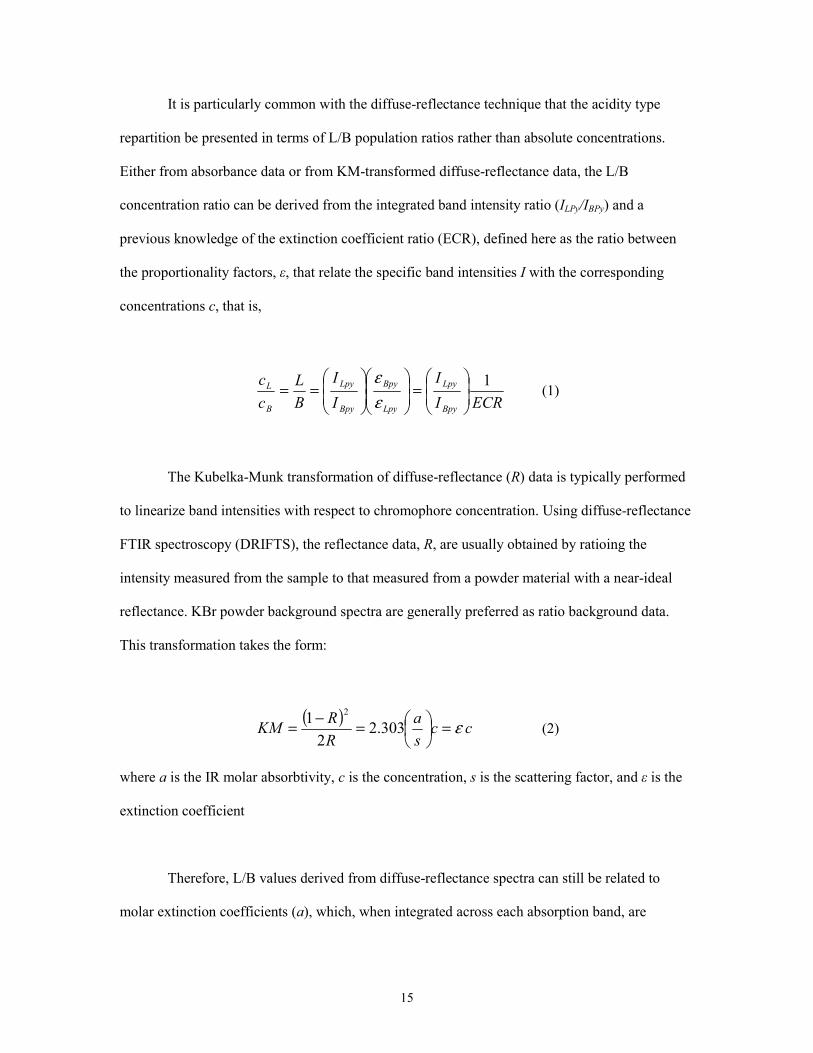
It is particularly common with the diffuse-reflectance technique that the acidity type
repartition be presented in terms of L/B population ratios rather than absolute concentrations.
Either from absorbance data or from KM-transformed diffuse-reflectance data, the L/B
concentration ratio can be derived from the integrated band intensity ratio (ILPy/IBPy) and a
previous knowledge of the extinction coefficient ratio (ECR), defined here as the ratio between
the proportionality factors, ε, that relate the specific band intensities I with the corresponding
concentrations c, that is,
ECRII
II
BL
cc
Bpy
Lpy
Lpy
Bpy
Bpy
Lpy
B
L 1
=
==
εε
(1)
The Kubelka-Munk transformation of diffuse-reflectance (R) data is typically performed
to linearize band intensities with respect to chromophore concentration. Using diffuse-reflectance
FTIR spectroscopy (DRIFTS), the reflectance data, R, are usually obtained by ratioing the
intensity measured from the sample to that measured from a powder material with a near-ideal
reflectance. KBr powder background spectra are generally preferred as ratio background data.
This transformation takes the form:
( ) ccsa
RRKM ε=
=−= 303.2
21 2
(2)
where a is the IR molar absorbtivity, c is the concentration, s is the scattering factor, and ε is the
extinction coefficient
Therefore, L/B values derived from diffuse-reflectance spectra can still be related to
molar extinction coefficients (a), which, when integrated across each absorption band, are
Page 23
16
routinely used in interpreting transmission spectroscopy data. For diffuse-reflectance spectra of
chemisorbed pyridine interacting with the solid acid sample, the ECR can be derived from
ECRKMKM
ss
aa
KMKM
BL
Bpy
Lpy
Lpy
Bpy
Bpy
Lpy 1
1545
1495
=
= (3)
where the values of KM, a and s are integral across the corresponding absorption band.
If the scattering factor (s) is not strongly frequency-dependent (so that s1495 / s1545 ≈ 1), ECR
values derived from transmission IR data can also be used to estimate L/B values from diffuse-
reflectance IR data. Moreover, the assumption that extinction coefficients are not influenced by
the environment set by the solid acid also has to be made when importing extinction coefficients
or their ratio from one material to another.
Corma10 recommends the general use of published extinction coefficients for the
estimation of Brönsted and Lewis acid site populations. These published values are typically
obtained by one of the following transmission IR-coupled methods: selective elimination of
Brönsted acidity followed by water vapor exposure;5,11,12 dosing of known amounts of
pyridine;9,13,14,15 or water vapor exposure to convert Lewis acidity into Brönsted acidity.16 For
DRIFTS measurements, pyridine dosing in parallel with thermogravimetric measurements have
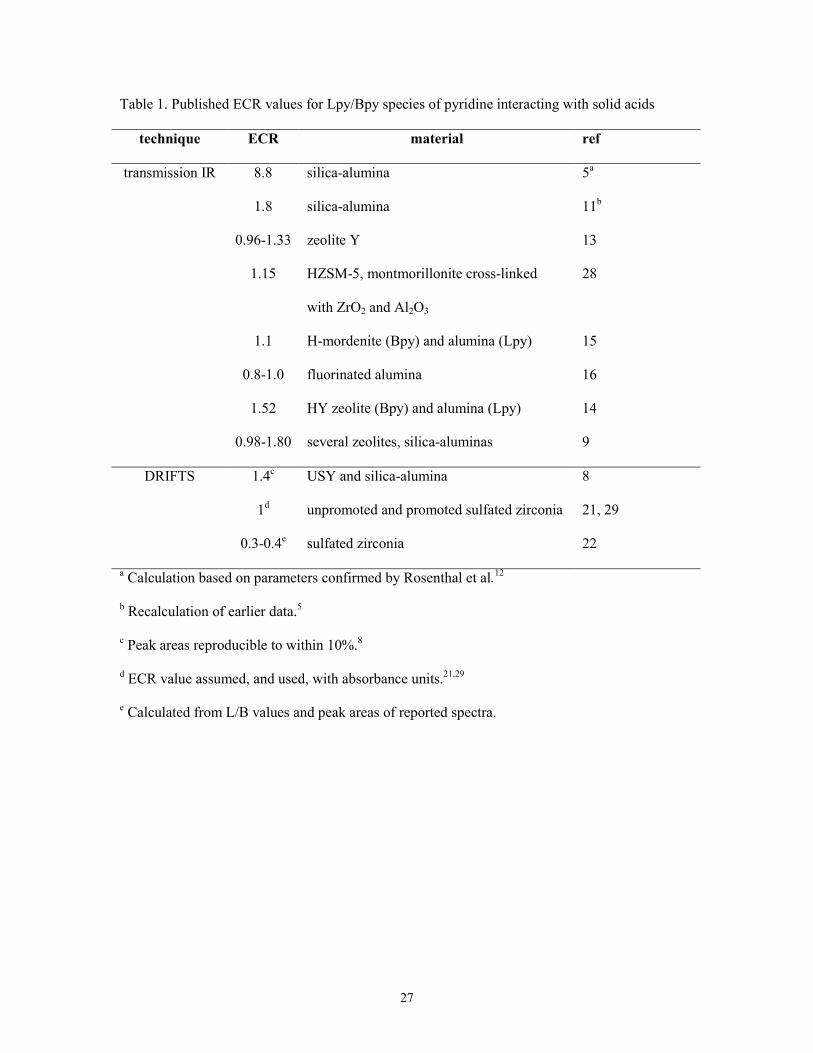
been reported by Chen et al.8 However, the ECR values from published data vary widely (Table
1), and there is little agreement even for the same type of IR setup or material. Thus, the
portability of these values from one material to another, or from transmission to diffuse-
reflectance spectroscopy might be questionable. For example, in a spectrum where the Lpy and
Bpy intensities are in a ratio of 1:1, the calculated L/B ratio could range anywhere between 0.3
and 1.8, or even as high as 8.8, when the published ECR values are used.
Page 24
17
In this study, an attempt has been made to evaluate a simple method for determining a
most probable ECR value, using pyridine as an acidity probe in an in situ diffuse-reflectance
FTIR apparatus. The method has been applied to sulfated zirconia (SZ), utilizing a technique
where chemisorbed pyridine is first exposed to water vapor and then subjected to dehydration to
interconvert the Lpy and Bpy species. This method employs single sample packings and thus
avoids variations in the scattering factor, which is strongly dependant on packing density and
particle size.6,17 SZ was considered a good choice to test the method because it has a window of
relative transparency in the 1400-1600 cm-1 range (R ≈ 45%, KM ≈ 0.34) and, therefore, the
undiluted powder is suitable for KM treatment, as is expected to yield linearity with respect to
concentration and limited distortions caused by specular reflection.17 However, this method
should be suitable for use with any optically similar solid acid in which water does not
completely dislocate chemisorbed pyridine molecules. By avoiding KBr dilution, which is usually
recommended,18 reflectance is maintained in a range where errors inherent to KM in DRIFTS
systems are minimal.7 Also, SZ proved to have very labile Brönsted sites that can easily and
reversibly be converted to Lewis sites.19-22 Another factor in choosing sulfated zirconia is that its
surface acidity has recently been a subject of controversy,23 with some authors considering it
superacidic while others measuring, at most, sulfuric acid-like acidity. In addition, the
contribution of the Lewis or Brönsted acidity to catalytic activity has also been a subject of
divergence23 as a knowledge of the L/B proportion can be of critical importance in optimizing
catalyst activity. For example, Li and Gonzalez22 concluded that the optimum L/B ratio for n-
butane isomerization over SZ was 2.0 (pyridine DRIFTS), although this conclusion was based on
a method and parameter values originally developed for silica-alumina in transmission
spectroscopy.11
Page 25
18
2. Experimental Section
2.1. Equipment and Materials
Spectra were collected with a Perkin-Elmer System 2000 FTIR single-beam spectrometer
using a liquid-nitrogen-cooled MCT detector. Pyridine and water vapor adsorption were carried
out in a Harrick Scientific HVC-DR2 reaction chamber with a detachable NaCl window dome,
mounted inside a Harrick DRA-2 Praying Mantis diffuse-reflectance accessory designed to
minimize parasite specular reflectance. The reaction chamber is capable of heating a 4-mm-thick
powder sample to more than 600°C in controlled, flow-through atmospheres, with the
temperature measured at the center of the sample. Spectra were collected in the 4000-1000 cm-1
interval with a resolution of 4 cm-1, obtained by automatically adding 100 scans. However, the
frequency interval of focus was the SZ transparency window of 1600-1400 cm-1.
Pyridine was obtained from Fisher Scientific (99.9%) and was stored over type 3A
molecular sieves (4-8 mesh beads from Acros Organics) to provide a moisture-free pyridine
source. Ultrahigh purity helium was obtained from Air Liquide and was passed through desiccant
packs of Drierite and molecular sieve 3A to eliminate acquired moisture contamination. The
sulfated zirconia was prepared in our laboratory using established synthesis techniques. Synthesis
details and material characteristics are reported elsewhere.24,25
2.2. Procedures
Test-tube-sized saturators with pyridine (also over molecular sieve 3A desiccant beads)
and water were placed in ice baths, purged with helium to eliminate air, and left overnight to
equilibrate. SZ and KBr were ground separately, depending on the sample size, for 5-10 min with
an agate mortar and pestle, and placed overnight in an oven at 120 °C, along with the detachable
Page 26
19
reaction chamber window dome. This grinding procedure was previously shown to yield particle
sizes up to 40 µm.26 The linearity in concentration of the Kubelka-Munk function was previously
shown to hold when particle sizes in the powder sample are smaller than ~7λ,27 where λ is the IR
radiation wavelength. For the 1400-1600 cm-1 wavelength interval considered here, the maximum
acceptable particle size was ~275 µm. For a separate series of samples, preparations of 10% SZ
dispersed in KBr were obtained by weighing the necessary quantities from each previously
ground material and then mixing the powders intimately for 1 min in a glass vial placed in a
SpectroMill (Chemplex Ind.) impact grinder.
Measurements were performed separately on KBr and SZ. Powder samples were loaded
with minimum packing in the DRIFTS sample cup, in repeated sweeps performed with a
specially designed tool from Harrick, until the powder surface was free of visible defects. The
heating and cooling rates were set to 10°C/min to prevent degradation of the powder surface by
uneven thermal expansion. A constant helium flow of 25 sccm, passing through the reaction
chamber and powder sample at atmospheric pressure, was maintained for the entire duration of
the experiments. KBr powders were dehydrated in situ at 350 °C for 1 h, prior to the collection of
background reference spectra at 25°C. Pure SZ and 10% SZ/KBr samples were activated under
the same conditions.
Following activation, with the SZ sample temperature held at 150°C, approximately 650
Pa of pyridine vapor was admitted to the reaction chamber for 30 min, by diverting the helium
flow through the corresponding saturator. Subsequently, physisorbed pyridine was allowed to
desorb for one h at 150°C under helium flow, before the temperature was lowered to 25°C.
Spectra of chemisorbed pyridine were then collected at this temperature. These “initial” spectra,
as well as all subsequent spectra, were collected as total energy counts and separately ratioed
against the KBr total energy reference scans to obtain relative reflectance spectra.
Page 27
20
After the initial spectra had been collected, approximately 630 Pa of water vapor was
admitted to the reaction chamber in a similar manner, and the SZ samples were held at 25°C for
30-60 min. Initially, spectra were recorded during hydration to ensure that the samples were not
reaching saturation and to verify the linearity of the hydration data. After the flow had been
switched back to pure inert, the SZ samples were allowed to slowly dehydrate in the dry inert
flow, and spectra were recorded every 10 min for 3-4 h. A similar procedure was used for the
10% SZ/KBr samples. Relative reflectance spectra were subsequently subjected to the KM
transformation and integrated between 1565 and 1510 cm-1 (Bpy) and 1465-1424 cm-1 (Lpy).
Initial spectral data, as well as spectra at the end of each hydration step, were then used to
determine the ECR.
3. Results and Discussion
3.1. Reversibility of the Lpy-Bpy Interconversion
A first step in the study was testing the reversibility of L-B interconversion upon
hydration and dehydration, performed on single sample packings in the in situ DRIFTS setup. In
this way, errors introduced by variable scattering factors from one sample packing to another
were avoided. By simply measuring and plotting initial Lpy and Bpy peak areas, as well as peak
areas measured during the hydration and dehydration steps, both the linearity of the KM
transformation with respect to concentration and the persistence of chemisorbed pyridine can be
probed, assuming that undesirable KM-concentration nonlinearities and pyridine loss do not
cancel each other.
Previous reports indicate that, upon water vapor exposure of chemisorbed pyridine on SZ,
hydrogen-bonded pyridine can be detected.20 The presence of such a species could affect the
Page 28
21
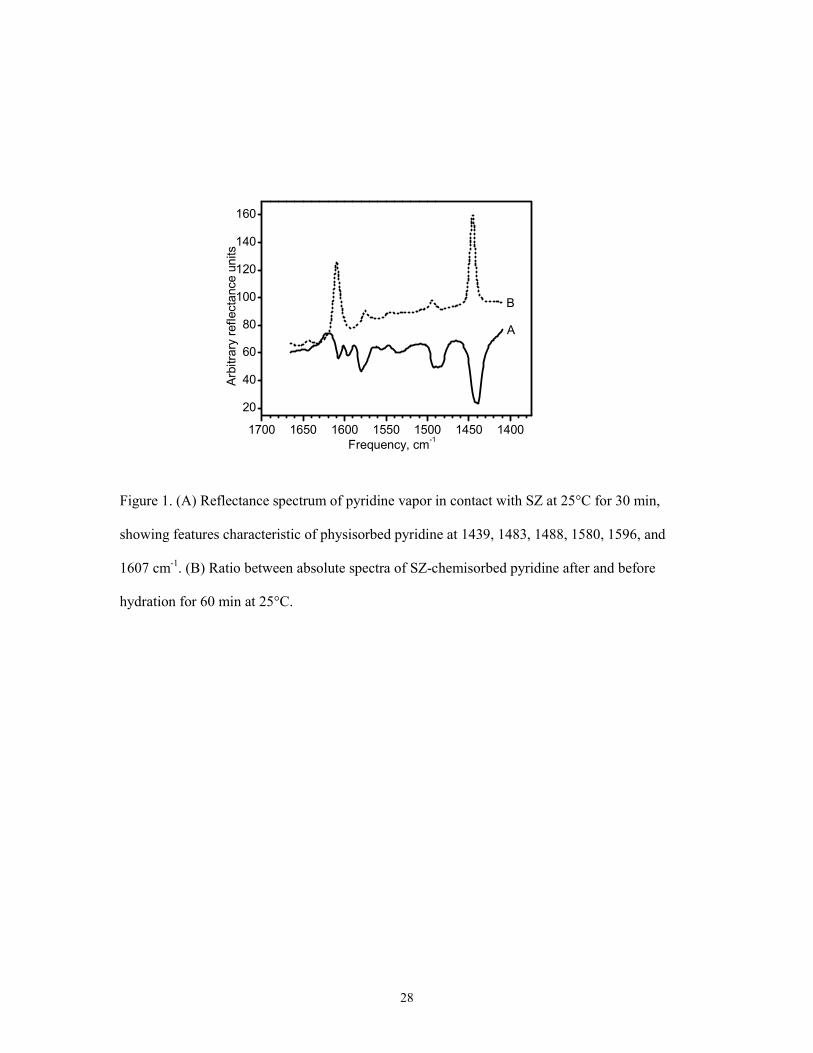
quantification of the Lpy and Bpy species. Therefore, absolute energy spectra taken before and
after 60 min of water adsorption at 25°C were ratioed and compared with reflectance spectra of
pyridine vapors in contact with SZ at the same temperature. These results are shown in Figure 1,
where emerging species in the ratio spectrum, B, should be characterized by downward bands. As
can be seen, only slight curvature distortions, corresponding to the strongest features common to
physisorbed or hydrogen-bonded pyridine (spectrum A), can be observed. It can therefore be
concluded that only minor pyridine dislocation occurs under these conditions.
Data from three repeated linearity tests are merged in Figure 2. Comparing the lines
connecting the initial and final hydration points with the dehydration points, it can be concluded
that the general trend of Lpy and Bpy band evolution during the dehydration step is to linearly
recover the initial L/B distribution. The deviations from linearity during dehydration were found
to be associated with interference attributed to gaseous water. Neither at the beginning nor at the
end of the hydration step was any immediate, noticeable change observed in this interference.
Therefore, it was concluded that the low water concentration under the very short optical length
of the DRIFTS reaction chamber could not be the source of the interference. This interference is
more likely due to ambient water vapor and the much longer optical length of the internal optical
compartment or the sample chamber of the FTIR instrument. It was noticed that the most frequent
positive deviations from the linear trend were associated with a decrease in the water interference
signal. This phenomenon could therefore be explained by a slow desiccation process, i.e., water
vapor admitted to the instrument during the initial experimental setup being slowly absorbed by
the desiccant packs.
Rather frequently, this interference observed during the course of the slow dehydration
process caused significant error in absorption band quantification. Therefore, data collected over
such a long interval was deemed to be unreliable for an ECR calculation, especially when ratioed
Page 29
22
against a KBr background obtained separately at a time interval of at least 2 h. The next logical
approach was to use the data corresponding to the initial, dry pyridine/SZ and the hydrated
pyridine/SZ data points and to statistically determine the most probable Lpy-Bpy slope. These
sets of data points were recorded no more than 1 h apart, so that the probability of environmental
variations and distortion was greatly diminished.
3.2. ECR Determination
In the absence of pyridine loss during the hydration process, it is expected that Lpy
species convert into Bpy with a 1:1 stoichiometry. Therefore the decrease in the Lpy
concentration should equal the increase in the Bpy concentration. Referring to eq. 3, it is obvious
that the slope of a KMLpy/KMBpy plot is the negative of the extinction coefficient ratio ECR. In
Figure 3, 15 pairs of dry/hydrated pyridine data points for undiluted SZ are compared with 3
paired data points obtained for 10% sulfated zirconia in KBr. Further evidence of the linearity of
the KM transformation for spectra on undiluted SZ is the obvious parallelism between the two
trends.
In Figure 3, the “tangential” spread (T) is most probably due to the nonrepeatability in the
initial degree of dehydration of SZ, whereas the “radial” spread (R) is caused by nonrepeatability
in the packing (and therefore in the optical density) of the powder samples. Because these
nonrepeatability sources should affect not the slope (ECR) but rather the absolute positions of the
Lpy/Bpy data points taken before and after hydration, a statistical analysis was performed on the
set of ECR values calculated from each pair of initial/hydrated data points. Using all the available
data for both undiluted (16 values) and diluted (5 values) SZ, the mean ECR was found to be 2.22
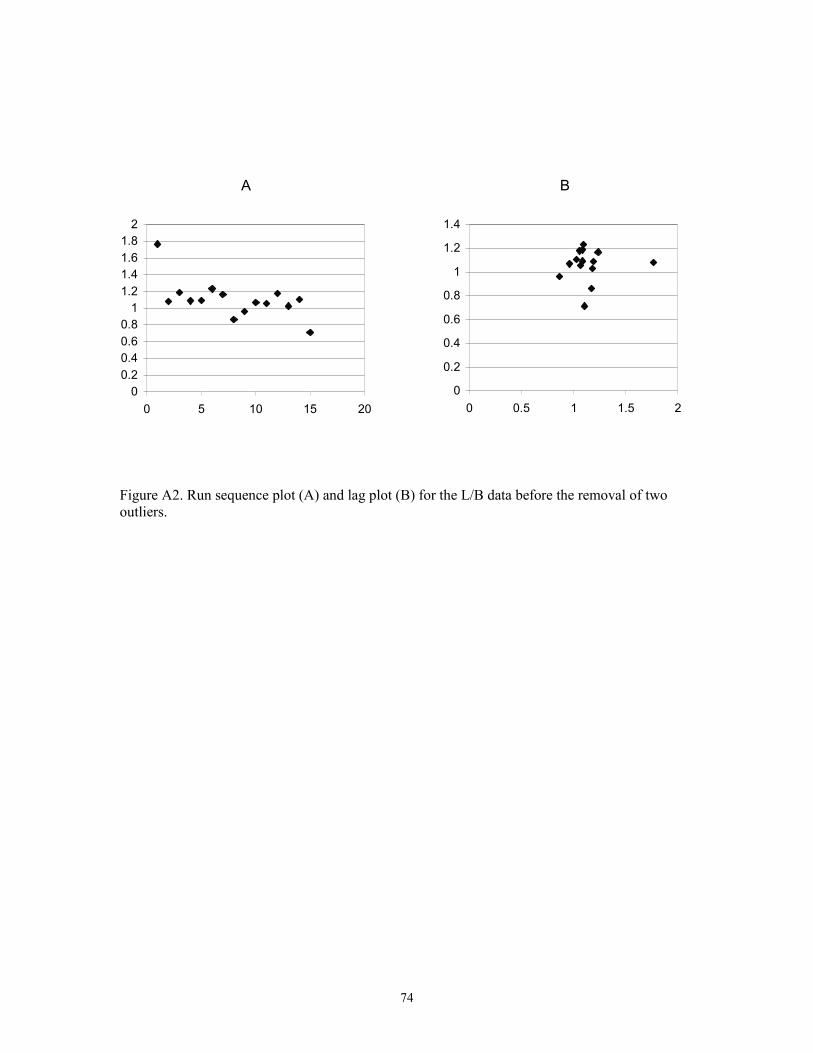
± 0.31, within a 95% confidence interval, that is, with an error of ± 14%. However, after
elimination of a few outliers detected graphically in the run sequence plot, the most probable
Page 30
23
ECR estimate was 2.05 ± 0.13 with 95% confidence (or a ± 6.3% error). The L/B concentration
ratio calculated from this ECR value for the set of dry, initial SZ sample spectra was 1.11 with a
95% confidence interval of ±11.3%, and after the statistical removal of two outliers, the L/B ratio
was 1.09 ±4.5%. The tangential data spread in Figure 3 indicates that this initial L/B ratio might
have been affected by reproducibility in the dehydration procedure or by accidental pyridine
contamination with water. Horr et al.7 have demonstrated that the KM transformation of
reflectance spectra is characterized by a propensity to amplify any fluctuations in an FTIR
instrument response. Because there were evident fluctuations in the ambient water vapor
background in these experiments, the spread in the calculated L/B values might also include such
artifacts from the KM treatment.
Although the portability of published extinction coefficient values was suggested,10 the
spread and disagreement in the calculation of this quantity is not uncommon. Examples for both
transmission IR and DRIFTS data for pyridine adsorbed on solid acids are listed in Table 1.
Proper ECR data for pyridine/SZ, especially in diffuse-reflectance IR spectroscopy, is scarce, and
therefore, the use of values obtained from transmission IR spectroscopy on different materials
might be questionable. As an example, the specific pyridine ring vibration mode, 19b, is
responsible for both the Lpy and Bpy bands at rather very different frequencies.1 This points to
the fact that the environment has a decisive influence upon the energy of oscillation. As suggested
by the fact that most reported ECR values differ from unity, the extinction coefficients differ
between Lpy and Bpy species for this vibration mode. That is, the type and strength of interaction
between pyridine and the acid site should affect both the wavenumber and extinction coefficient.
For the different materials utilized in published reports, band frequencies for the same vibration
mode have shown a slight but noticeable spread (1540-1550 cm-1 for Bpy and 1450-1455 cm-1 for
Lpy.)5, 8, 9, 11-16,22,28,29 This observation, along with the ECR values listed in Table 1, suggests that
Page 31
24
the environment, i.e., the material type and acid strength, should and does exert an influence upon
the ECR values. Moreover, the scattering factor, which determines the correlation between
concentration and KM band intensity, could very well be frequency-dependent.
In light of this reasoning, it is not surprising that the ECR value calculated here differs
from values reported in previous works. The data acquired in this study suggests that ECR and
extinction coefficient data are not portable from one material to another and/or from one IR
technique to another.
References:
(1) Cook, D. Vibrational Spectra of Pyridinium Salts. Can. J. Chem. 1961, 39, 2009.
(2) Gill, N. S.; Nuttall, R. H.; Scaife, D. E.; Sharp, D. W. A. Infrared Spectra of Pyridine
Complexes and Pyridinium Salts. J. Inorg. & Nuclear Chem. 1961, 18, 79.
(3) Zerbi, G.; Crawford, B., Jr.; Overend, J. Normal Coordinates of The Planar Vibrations of
Pyridine and its Deuterioisomers [Determined] with a Modified Urey-Bradley Force
Field. J. Chem. Phys. 1963, 38, 127.
(4) Parry, E. P. An Infrared Study of Pyridine Adsorbed on Acidic Solids. Characterization of
Surface Acidity. J. Catal. 1963, 2, 371.
(5) Basila, M. R.; Kantner, T. R.; Rhee, K. H. The Nature of the Acidic Sites on a Silica-
Alumina. Characterization by Infrared Spectroscopic Studies of Trimethylamine and
Pyridine Chemisorption. J. Phys. Chem. 1964, 68, 3197.
(6) Fuller, M. P.; Griffiths, P. R. Diffuse-reflectance Measurements by Infrared Fourier
Transform Spectrometry. Anal. Chem. 1978, 50, 1906.
(7) Horr, T. J.; Ralston, J.; Smart, R. St. C. Methods for Quantitative Diffuse-reflectance FT-
IR: Adsorption Densities of Alcohols on Silica Powders. Collois. Surf. 1992, 64, 67
(8) Chen, D.; Sharma, S.; Cardona-Martínez, N.; Dumesic, J. A.; Bell, V. A.; Hodge, G. D.;
Madon, R. J. Acidity Studies of Fluid Catalytic Cracking Catalysts by Microcalorimetry
and Infrared Spectroscopy. J. Catal. 1992, 136, 392.
Page 32
25
(9) Emeis, C. A. Determination of Integrated Molar Extinction Coefficients for Infrared
Absorption Bands of Pyridine Adsorbed on Solid Acid Catalysts. J. Catal. 1993, 141,
347.
(10) Corma, A. Inorganic Solid Acids and Their Use in Acid-Catalyzed Hydrocarbon Reactions.
Chem. Rev. 1995, 95, 559.
(11) Basila, M. R.; Kantner, T. R. The Nature of the Acidic Sites on Silica-alumina. A
Reevaluation of the Relative Absorption Coefficients of Chemisorbed Pyridine. J. Phys.
Chem. 1966, 70, 1681.
(12) Rosenthal, D. J.; White, M. G.; Parks, G. D. Estimating the Relative Acid Site Density of
Silica-alumina by Infrared Spectroscopy Using a Selective Reactant Poison. AIChE J.
1987, 33, 336.
(13) Hughes, T. R; White, H. M. A Study of the Surface Structure of Decationized Y Zeolite by
Quantitative Infrared Spectroscopy. J. Phys. Chem. 1967, 71, 2192.
(14) Datka, J.; Turek, A. M.; Jehng, J. M.; Wachs, I. E. Acidic Properties of Supported Niobium
Oxide Catalysts: An Infrared Spectroscopy Investigation. J. Catal. 1992, 135, 186.
(15) Guisnet, M.; Ayrault, P.; Datka, J. Acid Properties of Dealuminated Mordenites Studied by
IR Spectroscopy. 2. Concentration, Acid Strength and Heterogeneity of OH Groups. Pol.
J. Chem. 1997, 71, 1455.
(16) Matulewicz, E. R. A.; Kerkhof, F. P. J. M.; Moulijn, J. A.; Reitsma, H. J. Structure and
Activity of Fluorinated Alumina. 1. Determination of the Number of Protonic Sites by an
Infrared Study of Adsorbed Pyridines. J. Colloids Interf. Sci. 1980, 77, 110.
(17) Delgass, W. N.; Haller, G. L.; Kellerman, R.; Lunsford, J. H. Spectroscopy in
Heterogeneous Catalysis; Academic Press: New York, 1979.
(18) Smith, B. C. Fundamentals of Fourier Transform Infrared Spectroscopy; CRC Press: Boca
Raton, FL, 1996.
(19) Arata, K. Solid Superacids. Adv. Catal. 1990, 37, 165 .
(20) Morterra, C.; Cerrato, G.; Bolis, V. Lewis and Brönsted Acidity at the Surface of Sulfate-
doped ZrO2 Catalysts. Catal. Today 1993, 17, 505.
(21) Zhang, C.; Miranda, R.; Davis, B. H. Platinum-sulfated-zirconia. Infrared Study of
Adsorbed Pyridine. Catal. Lett. 1994, 29, 349.
(22) Li, B.; Gonzalez, R. D. In Situ DRIFTS Study of the Deactivation and Regeneration of
Sulfated Zirconia. Catal. Today 1998, 46, 55.
(23) Davis B. H.; Keogh, R. A.; Srinivasan, R. Sulfated Zirconia as a Hydrocarbon Conversion
Catalyst. Catal. Today 1994, 20, 219.
Page 33
26
(24) Chellappa, A. S.; Miller, R. C.; Thomson, W. J. Supercritical Alkylation and Butene
Dimerization over Sulfated Zirconia and Iron-manganese Promoted Sulfated Zirconia
Catalysts. Appl. Catal. A: Gen. 2001, 209, 359.
(25) Gore, R. B.; W. J. Thomson, W. J. Pulsed Gas-phase Alkylation of Isobutane/2-Butene
over Sulfated Zirconia. Appl. Catal. A: Gen. 1998, 168, 23.
(26) Gore, R. B. Surface Acidity and Catalytic Activity of Sulfated Zirconia. Ph.D. Dissertation,
Washington State University, Pullman, WA, 1997.
(27) Mandelis, A.; Boroumand, F.; van den Bergh, H. Quantitative Diffuse-reflectance and
Transmittance Spectroscopy of Loosely Packed Powders. Spectrochim. Acta 1991, 47A,
943.
(28) Take, J.; Yamaguchi, T.; Miyamoto, K.; Ohyama, H.; Misono, M. Brönsted Site Population
on External and on Internal Surface of Shape-Selective Catalysts. Stud. Surf. Sci. Catal.
1986, 28, 495.
(29) Davis, B. H.; Keogh, R. A.; Alerasool, S.; Zalewski, D. J.; Day, D. E.; Doolin, P. K.
Infrared Study of Pyridine Adsorbed on Unpromoted and Promoted Sulfated Zirconia. J.
Catal. 1999, 183, 45.
Page 34
27
Table 1. Published ECR values for Lpy/Bpy species of pyridine interacting with solid acids
technique ECR material ref
transmission IR 8.8 silica-alumina 5a
1.8 silica-alumina 11b
0.96-1.33 zeolite Y 13
1.15 HZSM-5, montmorillonite cross-linked
with ZrO2 and Al2O3
28
1.1 H-mordenite (Bpy) and alumina (Lpy) 15
0.8-1.0 fluorinated alumina 16
1.52 HY zeolite (Bpy) and alumina (Lpy) 14
0.98-1.80 several zeolites, silica-aluminas 9
DRIFTS 1.4c USY and silica-alumina 8
1d unpromoted and promoted sulfated zirconia 21, 29
0.3-0.4e sulfated zirconia 22
a Calculation based on parameters confirmed by Rosenthal et al.12
b Recalculation of earlier data.5
c Peak areas reproducible to within 10%.8
d ECR value assumed, and used, with absorbance units.21,29
e Calculated from L/B values and peak areas of reported spectra.
Page 35
28
1700 1650 1600 1550 1500 1450 1400
20
40
60
80
100
120
140
160
B
A
Arbi
trary
refle
ctan
ce u
nits
Frequency, cm-1
Figure 1. (A) Reflectance spectrum of pyridine vapor in contact with SZ at 25°C for 30 min,
showing features characteristic of physisorbed pyridine at 1439, 1483, 1488, 1580, 1596, and
1607 cm-1. (B) Ratio between absolute spectra of SZ-chemisorbed pyridine after and before
hydration for 60 min at 25°C.
Page 36
29
5 6 7 8 9 10 112
4
6
8
10
12
14 A B C123
LPy
peak
are
a (K
M c
m-1)
BPy peak area (KM cm-1)
Figure 2. Linearity test for pyridine/SZ hydration/dehydration at 25 °C, for 3 experiments. (A)
initial points, (B) data taken during and at the end of the 60-min hydration, (C) data taken during
the 4–h dehydration in dry He flow. (Dotted lines are qualitative.)
Page 37
30
0 2 4 6 8 10 120
2
4
6
8
10
12
14
16
TR
I H100
LPy
peak
are
a (K
M c
m-1)
BPy peak area (KM cm-1)
0.4 0.6
0.2
0.4
0.6
10
Figure 3. Comparison between undiluted- and diluted-SZ hydration of pyridine chemisorbed on
Lewis and Brönsted sites: (I) initial, dry pyridine/SZ; (H) hydrated pyridine/SZ; (100) undiluted
SZ; (10) 10% SZ dispersed in KBr. (dotted lines are qualitative.)
Page 38
31
CHAPTER THREE
LOW-TEMPERATURE TEST REACTION FOR HYDRIDE TRANSFER ON SOLID
ACID CATALYSTS
Short title: Hydride transfer test
Alexandru Platon and William J. Thomson*
Department of Chemical Engineering,
Washington State University,
Pullman, WA 99164-2710;
Abstract
A new model test reaction is proposed for the estimation of low-temperature hydride transfer
(HT) activity of solid acids. The reaction of cyclohexene with isobutane on zeolite Beta, ZSM-5
and sulfated zirconia distinguished between disproportionation/hydrogen transfer and HT. The
effects of acid site density, catalyst structure and interaction with isobutane are discussed.
Keywords: hydride transfer; hydrogen transfer; isobutane; alkylation; cyclohexene; solid acid
catalyst; zeolite Beta; sulfated zirconia; ZSM-5.
* To whom correspondence should be addressed. Tel.: (509)335-8580, Fax: (509)335-4806, E-
mail: [email protected]
Page 39
32
Introduction
Hydride transfer is a significant process that accompanies most solid-acid-catalyzed reactions of
hydrocarbons. During low temperature reactions at which cracking becomes slower than
oligomerization, hydride transfer has been found to be responsible for limiting the buildup of
carbonaceous deposits that block catalyst active sites [1,2], as well as for determining the catalyst
lifetime and product distribution in the solid-acid catalyzed alkylation of isobutane with light
olefins (see for ex. [3,4,5]). The process employs the bimolecular transfer of a hydride ion from a
donor species to an acceptor species. On acid active sites, acceptors are carbenium-type
carbocations and, following the hydride ion transfer, they desorb as neutral hydrocarbons, while a
new carbocation is formed from the donor (Reaction 1).
R(+) + R’-H → R-H + R’(+) (1)
If both the acceptor and the donor are found in a chemisorbed state before the transfer occurs,
similar to a Langmuir-Hinshelwood surface reaction model, a net transfer of hydrogen from the
donor to one or more acceptors can occur, along with a buildup of the remaining carbon-rich
deposits on the catalyst. This particular case is usually termed hydrogen transfer [6]. Situations
also exist when a transfer between identical chemisorbed species results in a simple
disproportionation. Disproportionation, however, can also be an initial step in the hydrogen
transfer process when the resulting carbenium product undergoes oligomerization and
dehydrogenation faster than it desorbs. Therefore, these two cases will be referred together to as
disproportionation and/or hydrogen transfer (DHGT).
A contrasting case is that of hydride ion transfer from a physisorbed donor to a chemisorbed
acceptor as described by the Rideal surface reaction model. This process can be viewed as a chain
Page 40
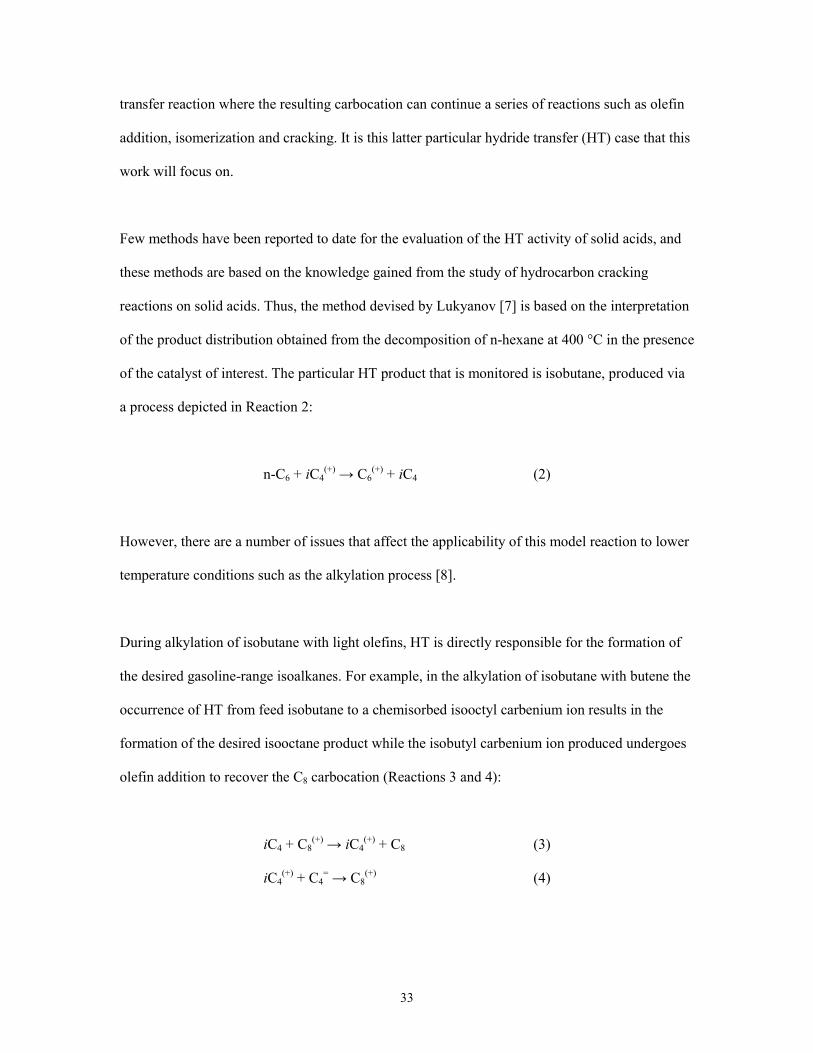
33
transfer reaction where the resulting carbocation can continue a series of reactions such as olefin
addition, isomerization and cracking. It is this latter particular hydride transfer (HT) case that this
work will focus on.
Few methods have been reported to date for the evaluation of the HT activity of solid acids, and
these methods are based on the knowledge gained from the study of hydrocarbon cracking
reactions on solid acids. Thus, the method devised by Lukyanov [7] is based on the interpretation
of the product distribution obtained from the decomposition of n-hexane at 400 °C in the presence
of the catalyst of interest. The particular HT product that is monitored is isobutane, produced via
a process depicted in Reaction 2:
n-C6 + iC4(+) → C6
(+) + iC4 (2)
However, there are a number of issues that affect the applicability of this model reaction to lower
temperature conditions such as the alkylation process [8].
During alkylation of isobutane with light olefins, HT is directly responsible for the formation of
the desired gasoline-range isoalkanes. For example, in the alkylation of isobutane with butene the
occurrence of HT from feed isobutane to a chemisorbed isooctyl carbenium ion results in the
formation of the desired isooctane product while the isobutyl carbenium ion produced undergoes
olefin addition to recover the C8 carbocation (Reactions 3 and 4):
iC4 + C8(+) → iC4
(+) + C8 (3)
iC4(+) + C4
= → C8(+) (4)
Page 41
34
The hydride transfer from isobutane in Reaction 3 is the key step that controls the alkylation
process, and therefore it is opposite of Reaction 2 where isobutane is a reaction product.
Moreover, the extrapolation of measured HT activities from 400 °C to the much lower
temperatures typical of alkylation could prove ineffective in describing the behavior of the
catalyst of interest when activation energies of the simultaneous elementary processes are very
different.
It was therefore found necessary to devise a test method capable of more accurate measurements
of HT activity at low temperatures that are meaningful for the study of processes such as the
solid-acid catalyzed isobutane/olefin alkylation. In addition to its ability to quantitatively measure
HT, further considerations of utility as a model test reaction included simplicity and
unsophisticated reaction product analysis.
Since cyclic hydrocarbons are relatively reluctant to cracking when compared to normal- or
isoalkanes, Cheng and Rajagopalan [9] and Suarez et al. [10] have employed cyclohexene to
estimate the relative reaction rates of hydrogen transfer, isomerization and other elementary
processes. They found that cracking was insignificant at 250 °C on various zeolite catalysts.
Chemisorbed cyclohexene (i.e. the cyclohexyl carbenium ion) is comparable in terms of
molecular size to the isooctyl intermediate found in alkylation. Moreover, the oligomerization of
a bulky cycloolefin such as cyclohexene should be sterically inhibited to a certain degree,
especially in the narrow pores of a zeolite.
It was therefore hypothesized in this study that the reaction of cyclohexene in the presence of
isobutane, a hydride donor, could prove itself useful in estimating the low temperature hydride
transfer activity of solid acids. For the purpose of testing this proposed model reaction, three
types of catalysts were considered: zeolites Beta and ZSM-5, and sulfated zirconia. Zeolite Beta
Page 42
35
and sulfated zirconia are reported to be active for isobutane alkylation with olefins, which, as
stated earlier, is a HT-demanding process [11,12]. At the same time, zeolite ZSM-5 is a narrow-
pore cracking catalyst that is known to sterically limit hydride transfer to a greater extent than
zeolite Beta [13]. The presumption was made, and tested, that differences in the HT activities of
these materials would result in measurable changes in the product distribution from the reaction
of cyclohexene and isobutane.
Experimental
Samples of zeolite Beta with SiO2/Al2O3 ratio values (SAR) of 25 (25BEA) and 75 (75BEA), as
well as zeolite ZSM-5 with an SAR value of 80 (80ZSM5), were purchased from Zeolyst
(CP814E, lot no. 1822-92; CP811E-75, lot no. 1822-74; CVB8014, lot no. 1822-80, respectively)
in a very fine powder form. The 25BEA and the 80ZSM5 zeolites were supplied in the NH4-
exchanged form, while the 75BEA was in the acidic form. Sulfated zirconia (SZ) was previously
synthesized in our laboratory, as described in an earlier publication [14].
The zeolite powders were converted into their corresponding larger particle size materials by
dispersion in colloidal silica (Ludox LS 30 wt.%, d=1.210) to yield a zeolite concentration of
approximately 65±1 wt.% in the resulting dry material. The dry material was crushed and sieved,
and the particle size cut of 0.59-1.651mm was retained for the subsequent measurements. The
corresponding materials were coded 25BEA65, 75BEA65 and 80SZM565, respectively.
Surface area measurements were performed using a Coulter SA-3100 automated characterization
machine using the BET method. The catalyst dry weights were determined by heating catalyst
samples in a Netzsch STA 409PC/Balzers Quadstar 422 TGA/MS analyzer under a flow of ultra-
Page 43
36
pure argon (Air Liquide) up to 1000 °C and then holding at the maximum temperature for one
hour. The weight loss for SZ was calculated only up to 650 °C, since above about 700 °C major
sulfate loss occurred. Catalyst activation temperature profiles were also identified in the TGA/MS
analyzer. For the zeolite samples in their ammonium form, complete decomposition into the
acidic form was achieved by holding the temperature at 500 °C for two hours. Under a heating
ramp of 10 °C/min, all zeolites showed a major water loss peak between 90-250 °C and a
secondary one centered at about 450-500 °C, and therefore activation was considered complete
after holding these materials for two hours at 500 °C. The sulfated zirconia samples showed
complete activation (as indicated by water evolution) as well as undetectable sulfur loss at
350 °C.
Total acidity measurements were carried out in an ASDI RXM-100 catalyst characterization
apparatus. Catalyst samples were loaded into a quartz tube, evacuated for at least one hour at
room temperature, and then heated under continuous vacuum up to 130 °C at a rate of 2 °C/min,
then up to the activation temperature at a rate of 10 °C/min, whereupon the activation temperature
was held constant for two hours. The total and physical adsorption isotherms of ammonia were
measured volumetrically at 80 °C for several samples from each catalyst. An overnight
evacuation of the sample was performed after every total adsorption isotherm measurement in
order to allow physisorbed ammonia to desorb from the catalysts. The chemisorption amounts
were calculated for each sample as the difference between the two isotherms in their flat and
parallel monolayer regions, normalized to the dry catalyst weight. Total isobutane adsorption
capacities were determined using the same apparatus, conditions and activation method, from the
total adsorption isotherm of isobutane in contact with samples from each material, by
extrapolating the linear monolayer region of each isotherm to a zero equilibrium pressure.
Isobutane chemisorption could not be detected at 80 °C.
Page 44
37
The reaction tests were performed at atmospheric pressure in a simple quartz plug-flow reactor
situated inside a furnace at a controlled temperature. Empty spaces in the reactor were filled with
inert material (pyrex wool and glass beads) in order to minimize axial dispersion and mixing
transients. Gas flows were controlled using Matheson 8272 mass-flow controllers. Catalyst
samples were activated in situ under a constant flow of 20 STDcm3/min (sccm) of UHP helium
(Air Liquide). The activation temperature profiles were identical to those used for the total acidity
measurements. Following activation, the temperature was lowered to 80 °C and a flow of 20 sccm
of isobutane (99%, Matheson) was added to the helium feed for at least 30 minutes. Cyclohexene
(≥99.0%, Aldrich) was then added to the feed stream at a rate of 0.371 equivalent sccm, by
passing 10 sccm of UHP helium through a saturator containing liquid at 0 °C. The catalyst
loadings in the reactor were calculated to yield a constant cyclohexene molar space velocity of
0.208 min-1 with respect to the number of catalyst acid sites as determined from the total acidity
measurements. The effluent composition was measured by means of a mass spectrometer-coupled
gas chromatograph (GC/MS, Hewlett-Packard model GCD G1800A) equipped with a Supelco
Supel-Q-Plot capillary column. For each experiment, samples were injected every 3.2 min using
an in-line sampling valve during a continuous, isothermal GC analysis at 150 °C. GC peak
separation was enhanced by extracting the corresponding characteristic ion fragments for
cyclohexane (M/z=80), cyclohexene (M/z=67), methylcyclopentane (M/Z=56) and
methylcyclopentene (M/z=67) from the total ion current recorded in the MS. Isobutane
concentrations were not quantified; no other products were detected during the experiments.
Control experiments were run for each material with the purpose of testing the cyclohexene
disproportionation and/or hydrogen transfer (DHGT) activity when isobutane was absent.
Cyclohexene feed concentrations and molar space velocities were maintained identical to the test
employing isobutane, by balancing the feed with supplemental helium. Experimental
Page 45
38
uncertainties, although not evaluated for these controls, were considered similar to those observed
for each material during the hydride transfer tests.
Results and discussion
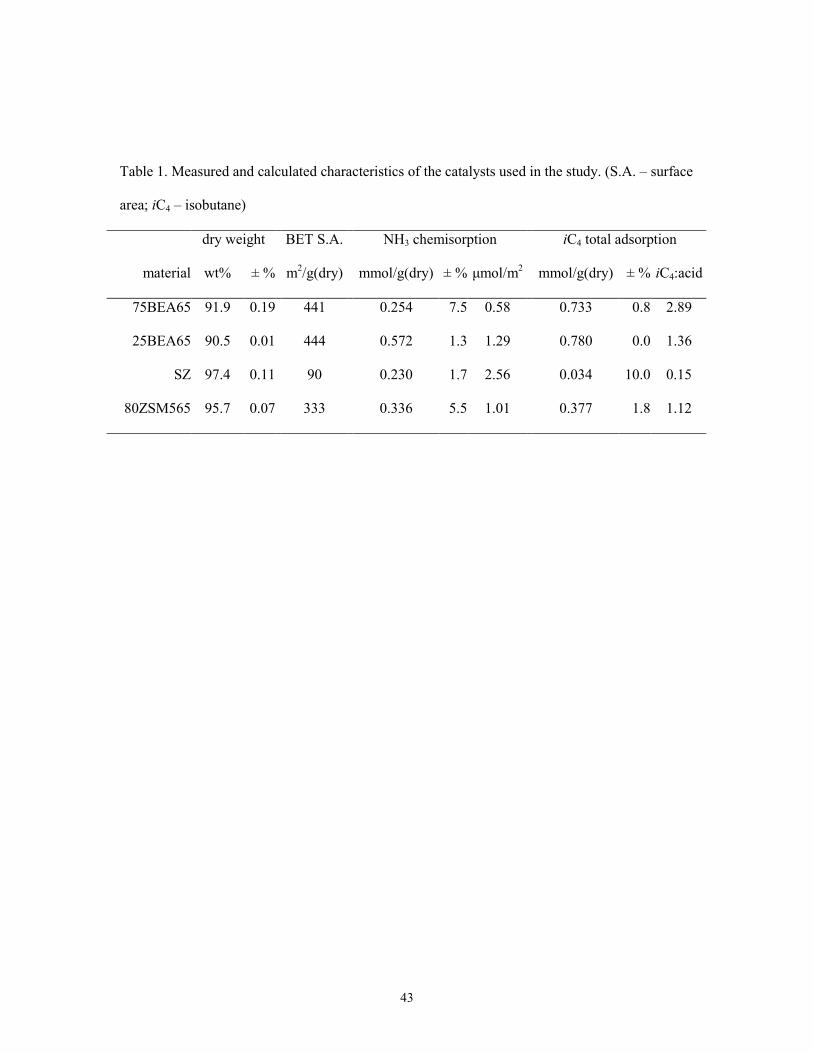
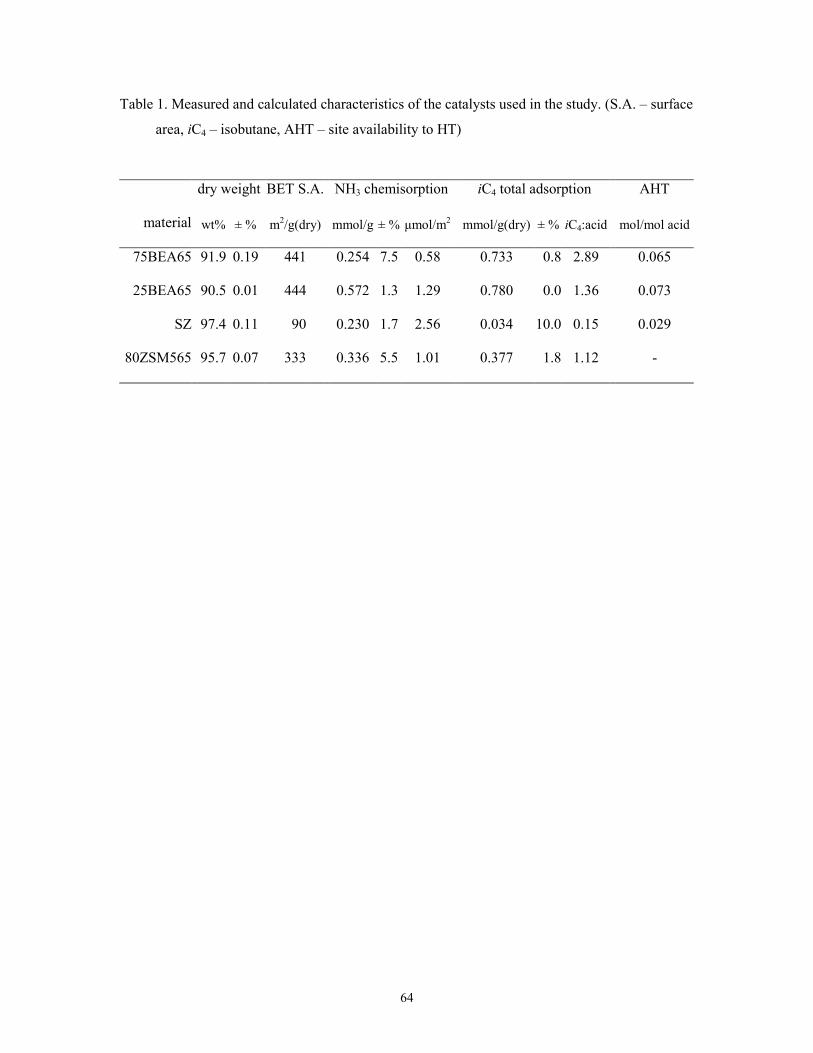
Table 1 summarizes all the measured characteristics for the four materials tested. Aside from the
quantities measured directly, surface acid site density and adsorbed isobutane/acid site ratios have
been calculated in order to help in the interpretation of the reaction results.
The observed product distribution from the reaction of cyclohexene (CHXE) with isobutane
(IBU) included cyclohexane (CHX), methylcyclopentane (MCP) and 1-methylcyclopentene
(MCPE). No other C4 hydrocarbons were detected in the product stream. Small traces of
bicyclohexyl were detected at the end of the whole experiment series upon reconditioning the GC
column at an elevated temperature. The proposed reaction mechanism is represented in Figure 1.
It is assumed that CHX is a product of hydride transfer (HT), MCPE a product of isomerization
(ISO), while MCP is a product of ISO followed by HT (similar to ref. [9]).
Typical experimental data from the test reaction on 25BEA65 at 80 °C is presented in Figure 2.
During all experiments, CHX, MCP and MCPE concentrations have peaked within the first 40
minutes on stream, while CHXE conversions dropped to values lower than the observed noise
level in experimental data. Since no C4 hydrocarbon products were detected, it was concluded
that once one HT turnover was complete on an active site, the formed tC4+ carbenium ion
completely blocks the active site from participating in any subsequent reaction cycle. While this
situation is not suitable for a practical reactor due to the almost instantaneous deactivation of the
catalyst, it is however ideal for the purpose of titrating the acid sites active for hydride transfer.
Page 46
39
For the purpose of active site titration, HT product formation rates were expressed in terms of
turnover frequency (TOF), as moles of cycloalkane products formed per mole of acid site per unit
time, although this quantity loses its meaning when applied to transient data. Upon integration of
the HT TOF peak with respect to time on stream, the total number of moles of HT products
formed on each mole of active sites can be calculated. It was shown above that acid sites
undergoing hydride transfer are completely deactivated after one turnover. Indeed, this is in part
validated by the fact that the above integral was always smaller than unity for all materials tested,
as shown by the results in Figure 3. Therefore, the above integral can be thought of as the
apparent fraction of sites active for HT out of the total acid sites that are detected by ammonia
chemisorption, or in other words, the acid site availability to hydride transfer (AHT). It was of
interest to also estimate the activities for the Rideal-type HT decoupled from the undesired
DHGT contributions. Product formation rates measured for each material during the DHGT
control experiments (“no IBU” in Figure 3) were subtracted from the data obtained above. Based
upon this difference, 25BEA65 fared best in terms of acid site AHT (7.3%), followed closely by
75BEA65 (6.5%) and then by SZ (2.9%). 80ZSM565 seems to completely lack HT activity at
80 °C, but shows a significant DHGT activity as judged by this calculation.
Peak values of HT and ISO turnover frequencies were also compared in Figure 4. While the
overall AHT was more elevated on 75BEA65 than on SZ, the peak HT TOF was lower on the
75BEA65. The observed maximum rates could be affected to some degree by the limited
diffusion rates in the narrow pores of the zeolite structure, while the overall AHT should be more
closely related to the intrinsic activity of the catalysts. SZ as well as both BEA materials showed
almost identical DHGT activities, both in terms of percent availability (Figure 3) and peak rates
(Figure 4), indicating that the tendency to form polyunsaturated carbonaceous deposits should be
similar in all three materials at 80 °C. SZ showed a significantly higher ISO peak rate than the
two BEA zeolites, while the higher acid density 25BEA65 was slightly more active for ISO than
Page 47
40
75BEA65. The peak isomerization rate was not influenced by the presence or absence of IBU on
SZ and 80ZSM565, as the ISO results indicate, while on zeolites Beta, ISO is somewhat inhibited
by the presence of IBU. Based on this observation, ring rearrangement isomerization in
intermediates on SZ and 80ZSM565 happens much faster than any subsequent HT, DHGT or
cycloolefin desorption process.
As expected from the higher aluminum content, a higher ammonia chemisorption amount was
measured on 25BEA65 than on 75BEA65. The measured AHT values suggest that within the
same type of structure (BEA), the higher acid site density of 25BEA65 improves hydride transfer
activity in terms of the apparent number of acid sites involved in HT. This result is to a certain
degree in accord with the report from Suarez et al. [10] who have found that the hydrogen
transfer activity, measured during CHXE conversion at 250 °C on several zeolites, correlates
directly with the fraction of paired aluminum sites in the zeolite structure. Following theoretical
calculations of carbocations interacting with Si-O-Si and Si-O-Al zeolite-like sites, Mota et al.
[15] concluded that the carbenium ion resulting from a HT reaction (such as tC4+ in the scheme in
Figure 1) is better stabilized by the more acidic Si-O-Al site and therefore, the direct mutual
proximity of such highly acidic sites should enhance the likelihood of HT reactions.
An intriguing case however is sulfated zirconia. Its surface acid site density as calculated in Table
1 is twice the surface acid density on 25BEA65, yet its hydride transfer activity is 2.5 times
lower. A possible explanation of the poor AHT in SZ is its lower adsorption capacity for IBU, as
shown in Table 1. Indeed, when compared with 25BEA65, the IBU physisorption amount
detected on SZ was 23 times lower when normalized to the dry weight, or 9 times lower when
normalized to the number of acid sites. It was shown that the dilution of the hydride donor IBU
was detrimental to the formation of HT products during solid-acid catalyzed alkylation [2,16]. An
Page 48
41
argument can be made that a catalyst structure capable of adsorbing an increased amount of IBU
in the proximity of the active sites should exhibit enhanced HT from the adsorbed hydride donor.
Conclusion
Little choice exists to date in the estimation of low-temperature activities for hydride transfer
(HT) of solid acid catalysts. Methods originally developed to describe high temperature cracking
reaction systems could be of little help in conjunction with reactions such as isobutane/olefin
alkylation. The reaction between isobutane and cyclohexene is proposed as a test to estimate the
HT activity of solid acids at low temperatures. The proposed test easily discerned between
disproportionation/hydrogen transfer and isobutane/cyclohexene HT on zeolites Beta, ZSM-5 and
sulfated zirconia. Out of the total number of acid sites determined by ammonia chemisorption
titration, the apparent fraction available to mediate HT reactions could be estimated. The results
obtained for two silica/alumina ratio values in zeolite Beta were found in perfect accord with
evidence indicating that denser strong-acid sites enhance the HT process. The lower per-site HT
activity measured in the even denser-acid-site sulfated zirconia could be explained by its much
lower isobutane adsorption capacity per acid site. Although zeolite ZSM-5 showed significant
disproportionation/hydrogen transfer activity, no measurable Rideal-type, low-temperature HT
activity was detected for this otherwise successful cracking catalyst.
Acknowledgements
This work was supported by the O.H. Reaugh Laboratory for Oil and Gas Processing Research at
Washington State University. Suggestions for devising the GC analysis procedure were kindly
provided by David C. LaMont.
Page 49
42
References
[1] C. Flego, G. Bellussi, I. Kiricsi, Appl. Catal. A 126 (1995) 401
[2] D.M. Ginosar, D.N. Thompson, K.C. Burch, Appl. Catal. A 262 (2004) 223
[3] F W. Kirsch, J.D. Potts, D.S. Barmby, Proceedings - American Petroleum Institute, Division
of Refining 48 (1968) 1000
[4] G.S. Nivarthy, Y. He, K. Seshan, J.A. Lercher, J. Catal. 176 (1998) 192
[5] A. Feller, I. Zuazo, A. Guzman, J.O. Barth, J.A. Lercher, J. Catal. 216 (2003) 313
[6] A. Corma, P.J. Miguel, A.V. Orchillés, Appl. Catal. A 138 (1996) 57
[7] D.B. Lukyanov, J. Catal. 145 (1994) 54
[8] K. Yoo, P.G. Smirniotis, Appl. Catal. A 227 (2002) 171
[9] W.-C. Cheng, K. Rajagopalan, J. Catal. 35 (1993) 483
[10] W. Suarez, W.-C. Cheng, K. Rajagopalan, A.W. Peters, Chem. Eng. Sci. 45 (1990) 2581
[11] K. Hatakeyama, T. Suzuka, M. Yamane, Sekiyu Gakkaishi 34 (1991) 267
[12] A. Corma, M.I. Juan-Rajadell, J.M. Lopez-Nieto, A. Martinez, C. Martinez, Appl. Catal. A
111 (1994) 175
[13] B.G. Anderson, R.R. Schumacher, R. van Duren, A.P. Singh, R.A. van Santen, J. Mol. Cat.
A 181 (2002) 291
[14] A.S. Chellappa, R.C. Miller and W.J. Thomson, Appl. Catal. A 209 (2001) 359
[15] C.J.A. Mota, P.M. Esteves, M.B. de Amorim, J. Phys. Chem., 100 (1996) 12418
[16] D.M. Ginosar, D.N. Thompson, K. Coates, D.J. Zalewski, Ind. & Eng. Chem. Res. 41
(2002) 2864
Page 50
43
Table 1. Measured and calculated characteristics of the catalysts used in the study. (S.A. – surface
area; iC4 – isobutane)
dry weight BET S.A. NH3 chemisorption iC4 total adsorption
material wt% ± % m2/g(dry) mmol/g(dry) ± % µmol/m2 mmol/g(dry) ± % iC4:acid
75BEA65 91.9 0.19 441 0.254 7.5 0.58 0.733 0.8 2.89
25BEA65 90.5 0.01 444 0.572 1.3 1.29 0.780 0.0 1.36
SZ 97.4 0.11 90 0.230 1.7 2.56 0.034 10.0 0.15
80ZSM565 95.7 0.07 333 0.336 5.5 1.01 0.377 1.8 1.12
Page 51
44
+ (H*)
CH+
*-
+ iC4H10
C+
CH3
- (tC4H9+ *-)
CH3
+ iC4H10
CH3
- (H*)
*- - (tC4H9+ *-)
CHXE CHX
MCPE-1 MCP
ISO
HT
HT
Figure 1. Proposed reaction mechanism. (*) symbolizes an active site.
Page 52
45
0.0E+00
4.0E-03
8.0E-03
1.2E-02
0 10 20 30 40 50
TOS, min
(○) H
T TO
F, m
in-1
0.0E+00
2.0E-04
4.0E-04
6.0E-04
(×) I
SO T
OF,
min
-1
Figure 2. Cumulative data obtained on zeolite 25BEA65 at 80 °C
Page 53
46
0%
2%
4%
6%
8%
10%
12%
75BEA65
(no IBU)
25BEA65
(no IBU)
SZ
(no IBU)
80ZS
M565
(no IBU)
Site
ava
ilabi
lity
to H
T
Figure 3. Integrals of HT TOF peaks can be interpreted as a measure of the fraction of the total
acid sites that are available for hydride transfer.
Page 54
47
0
0.002
0.004
0.006
0.008
0.01
0.012
0.014
0.016
0.018
75BEA65
(no IB
U)
25BEA65
(no IB
U)SZ
(no IB
U)
80ZSM565
(no IB
U)
TOF,
min
^-1
Figure 4. Maximum formation rates recorded for the HT (open bars) and ISO (filled bars)
products.
Page 55
48
CHAPTER FOUR
SOLID ACID CHARACTERISTICS AND ISOBUTANE/BUTENE ALKYLATION
Alexandru Platon and William J. Thomson*
Department of Chemical Engineering,
Washington State University,
Pullman, WA 99164-2710;
Abstract:
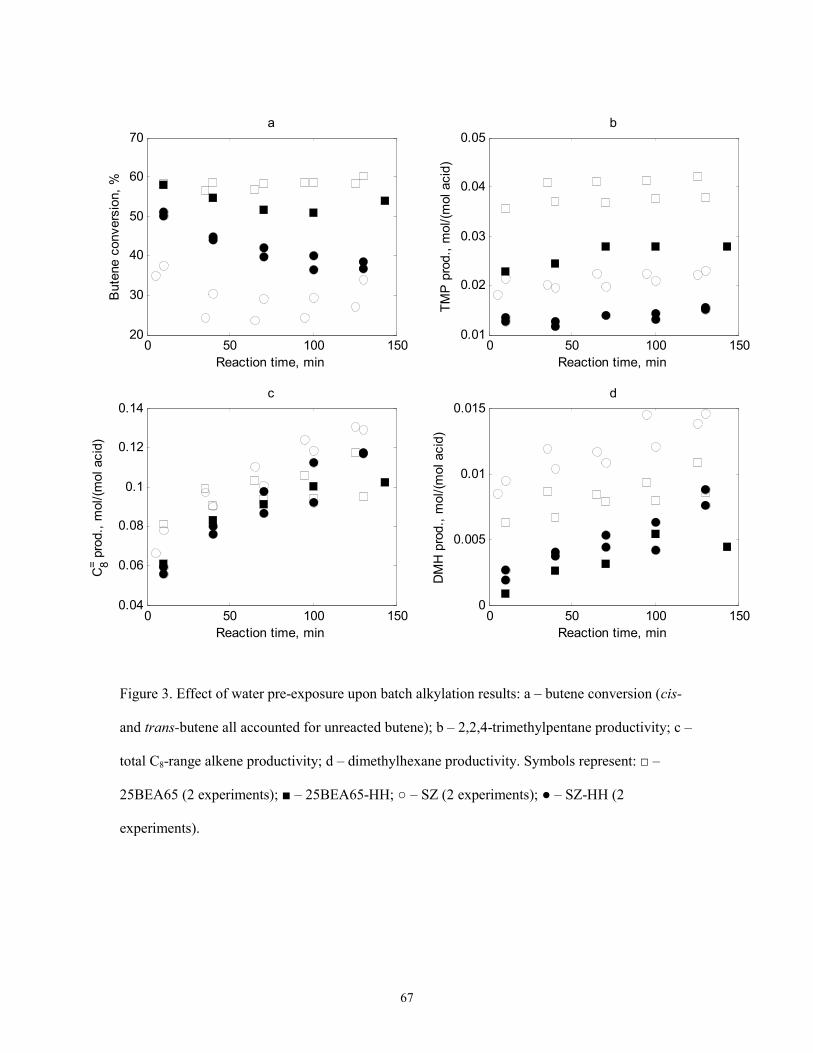
Catalytic behavior during gas-phase, batch alkylation experiments employing isobutane and 1-
butene at 80 °C was studied for Beta zeolites with SiO2/Al2O3 (SAR) ratios of 25 (25BEA) and 75
(75BEA), ZSM-5 and sulfated zirconia (SZ). The observed alkylation performance was compared
to the low-temperature hydride transfer (HT) activity of the studied catalysts and with their
acidity, adsorption capacity and surface area measurements. For all materials studied, a
correlation was observed between the measured HT activity and the amount of trimethylpentane
(TMP) produced per acid site. The 25BEA catalyst produced the highest amount of
trimethylpentane (TMP) and also had the most elevated HT activity. ZSM-5 was found to be
inactive for both HT and alkylation, and although SZ had moderate alkylation activity, it also had
a higher cracking activity than other materials. Modification by water vapor exposure of 25BEA
and SZ did not create any noticeable change in Brönsted acidity, but a dramatic decrease in TMP
production was detected on the modified catalysts and explained by competitive adsorption
between water and isobutane. The apparent butene conversion correlated well with the total
catalyst surface area rather than with the total amount of acid sites. In all the catalysts studied a
much stronger interaction with butene than with isobutane was observed, suggesting that
* To whom correspondence should be addressed. Tel.: (509)335-8580, Fax: (509)335-4806, E-
mail: [email protected]
Page 56
49
competitive adsorption between the two reactants limits isobutane access to the active sites,
resulting in limited hydride transfer.
Keywords: hydride transfer; alkylation of isobutane; butene; cyclohexene; solid acid catalyst;
zeolite Beta; sulfated zirconia; ZSM-5.
1. Introduction
Alkylate, the refinery product from isobutane alkylation with alkenes, is among the top
contributors to the octane number in the typical US gasoline pool. Whereas newer and stricter
environmental regulations are expected to increase pressure for the elimination of some of the
highest octane rating gasoline components, alkylate is one of the few components that seems to
avoid such restrictions [1,2] due to its low volatility, reactivity and toxicity. While alkylate is
currently produced by successful commercial refinery processes involving liquid acid catalysts
such as sulfuric acid and hydrofluoric acid, increasing efforts are currently concentrated towards
finding an alternative solid catalyst that would overcome some of the drawbacks associated with
the liquid acids [1,3]. However, the major problem encountered with alkylation on solid acid
catalysts is their rapid deactivation.
Numerous efforts have been made to understand the processes responsible for activity and
deactivation during alkylation over solid acids. Thus, it is generally agreed that the main
alkylation process between isobutane and butene involves Reactions 1-3 listed below. In Reaction
1, butene chemisorbs on an active site (depicted by a star) to form an intermediate butyl
carbenium ion. This ion further reacts with another alkene molecule yielding an isooctyl
carbenium intermediate, as in Reaction 2. The desired product, isooctane, is formed when the
Page 57
50
isooctyl species undergoes a hydride ion transfer from an isobutane molecule, while the butyl
carbenium ion is regenerated (Reaction 3).
C4H8 + *H → (C4H9)+ (*)- (1)
C4H8 + (C4H9)+ (*)- → (iC8H17)+ (*)- (2)
iC4H10 + (iC8H17)+ (*)- → (tC4H9+) (*)- + iC8H18 (3)
Along with these desired reactions, the carbenium intermediates are involved in side reactions
such as multiple olefin addition (oligomerization), molecule chain rearrangement (isomerization),
β-scission (cracking), dehydrogenation and subsequent formation of polyenes and polyaromatic
hydrocarbons (“coking”). A major, recurring finding among published studies is that hydride
transfer (HT) in Reaction 3 is the key process that dictates product distribution and catalyst
lifetime [3] during isobutane alkylation. However, few methods have been reported so far for the
independent evaluation of the HT activity of solid acids. These methods are usually based on the
knowledge gained from the study of hydrocarbon cracking reactions on solid acids. Thus, the
method devised by Lukyanov [4] (hexane cracking at 400 °C), and used in some instances to
correlate this observed activity with low-temperature alkylation activity [5], is based on Reaction
4 below, which is somewhat opposite to the hydride transfer step in Reaction 3:
nC6H14 + (iC4H9)+ → (C6H14)+ + iC4H10 (4)
The reaction between cyclohexene and isobutane was reported elsewhere by our group [6] to be
capable of measuring low-temperature hydride transfer activities while discriminating between
the “true”, Rideal-type HT from isobutane (as in Reaction 3) and disproportionation/hydrogen
transfer (DHGT) of cyclohexene (similar to the definitions by Corma et al. in ref [7]). This HT
test reaction was shown to be able to differentiate among sulfated zirconia, zeolites Beta, and
Page 58
51
ZSM-5 (which was inactive for HT), as well as sense the effect of aluminum content on HT in
zeolite Beta.
In this study an attempt was made to correlate catalyst performance data for batch alkylation
experiments with HT activity as measured by this low-temperature reaction. Furthermore, the
effects of the catalytic material, acid site density, catalyst-reactant interaction and catalyst pre-
exposure to moisture were investigated. Three different catalytic materials were tested: zeolites
Beta and sulfated zirconia, which are known to promote alkylation reactions [8,9], as well as the
known cracking catalyst ZSM-5, in which alkylation was found to be limited by its narrow pores
[10]. Although gas phase reaction was found to be unfavorable to catalyst stability during
alkylation [11], batch gas-phase conditions were chosen for experimental simplicity. Under these
conditions, differences in the characteristics and HT activity of the catalysts were expected to
yield measurable differences in their C8-range product distribution.
2. Materials and experimental procedure
2.1. Catalytic materials
Samples of zeolite Beta with silica/alumina ratios (SAR) of 25 (CP814E, lot no. 1822-92) and 75
(CP811E-75, lot no. 1822-74), as well as zeolite ZSM-5 with an SAR value of 80 (CVB8014, lot
no. 1822-80), were purchased from Zeolyst in a very fine powder form and represented here by
25BEA, 75BEA and 80ZSM5, respectively. The 25BEA and the 80ZSM5 zeolites were supplied
in the ammonium-exchanged form, while the 75BEA was provided in the acidic form. Sulfated
zirconia (SZ) was previously synthesized in our laboratory, and characterization data and
synthesis details are given elsewhere [12].
Page 59
52
Larger particles of zeolite were prepared by dispersing the fine powders in colloidal silica (Ludox
LS 30 wt.%, d=1.210) followed by an overnight drying at 100 °C, to yield a zeolite concentration
of approximately 65±1 wt.% in the resulting dry material. The dry material was crushed and
sieved, and a particle size cut of 0.59-1.651mm was retained for the subsequent measurements.
The corresponding materials are represented here by 25BEA65, 75BEA65 and 80SZM565,
respectively.
2.2. Catalyst characterization
A Netzsch STA 409PC thermogravimetric analyzer coupled with a Balzers Quadstar 422 mass
spectrometer (TGA/MS) was used to measure catalyst dry weights and to determine activation
temperature profiles for the catalysts. Catalysts samples were heated with a 10 °C/min rate up to
1000 °C in a flow of ultra pure argon (Air Liquide). Weight losses were used to calculate the dry
weights. Because a major sulfur loss occurred in SZ above about 700 °C, its dry weight was
based on the weight loss up to 650 °C. Two water losses were detected in the zeolitic materials—
a major one between 90-250 °C and a structural water loss at about 450-500 °C. For the
ammonium-exchanged zeolites complete ammonia loss occurred by holding the temperature at
500 °C for two hours. It was therefore decided that a complete decomposition/activation is
achieved on all zeolites under this latter treatment. Judged from water evolution SZ showed a
complete activation at 350 °C.
Surface areas were measured with a Coulter SA-3100 automated characterization machine using
the BET method with nitrogen (99.998%, Air Liquide) adsorption data at 77 K. Total acidity and
reactant adsorption capacities were determined volumetrically in an ASDI RXM-100 catalyst
characterization apparatus. Catalyst samples were activated in a quartz tube under vacuum by
being heated 2 °C/min up to 130 °C and then 10°/min up to the activation temperatures
determined above which were held constant for two hours. Total ammonia adsorption and
Page 60
53
physisorption isotherms at 80 °C were then determined with an intermediate overnight evacuation
to desorb physisorbed ammonia. The ammonia chemisorption capacity normalized to the dry
catalyst weight was computed by subtracting the two isotherms in their parallel, monolayer
segment. Additionally, separate samples from 25BEA65 and 75BEA65 were activated by
following the same temperature profile but under a gas stream comprising of 20% oxygen
(99.5%, Air Liquide) diluted in helium, and then their dry weights and total acidities were
measured. Ammonia chemisorption measurements showed no significant difference in the total
acidity of these materials compared to their vacuum/inert-activated counterparts. Separately,
isobutane adsorption capacities at 80 °C were determined from the total adsorption isotherm by
extrapolating the linear monolayer segment to zero pressure. No isobutane chemisorption was
detected in any of the materials tested and thus the isobutane adsorption capacities reported in this
work represent physisorbed isobutane. Attempts to measure 1-butene adsorption have
consistently failed on all materials because equilibrium pressures could not be reached and the
alkene steadily accumulated on the catalysts.
Diffuse-reflectance infrared spectroscopy (DRIFTS) of chemisorbed pyridine was employed to
detect and measure Lewis and Brönsted acidity on the catalyst samples. The equipment and
materials used were described in detail in ref. [13]. Samples from 25BEA and 75BEA were
prepared by diluting portions from the original powdered materials with finely ground KBr (5
minutes with an agate mortar and pestle) to yield 30 wt.% zeolite. SZ powder samples were not
diluted in KBr. Samples thus prepared were loaded in the sample cup of the DRIFTS apparatus,
then a flow of 25 STDcm3/min (sccm) UHP helium (further desiccated through drierite/molecular
sieve 3A) was established for the whole duration of the measurement. Samples were activated in
situ at 500 °C for two hours (zeolites) or 350 °C for one hour (SZ). Some of the 25BEA65 and SZ
samples were then cooled to 25 °C, exposed to approximately 630 Pa of water vapor for 60
minutes and then activated again at 175 °C for one hour. These samples were coded 25BEA-HH
Page 61
54
and SZ-HH, respectively. Afterwards, all samples were exposed to approx. 650 Pa of pyridine
vapor for 60 minutes at 100-150°C (zeolites) or 30 minutes at 150 °C (SZ). Physisorbed pyridine
was allowed to desorb at the same temperature for 3 hours (zeolites) or 1 hour (SZ), and then total
energy spectra were recorded at 25 °C. Reference spectra were obtained at 25 °C and 150 °C
from KBr samples that were subjected to an in situ activation treatment similar to the
corresponding catalyst samples. All heating and cooling rates were 10 °C/min. Total energy
spectra were ratioed against the reference KBr spectra, and then the resulting reflectance spectra
were converted with the Kubelka-Munk transformation. For the SZ and SZ-HH samples, the
Lewis/Brönsted acidity ratio was calculated using the L/B extinction coefficient ratio and method
suggested in [13]. No Brönsted acidity was detected in 75BEA, 25BEA or 25BEA-HH.
2.4. Catalytic activity measurements
Hydride transfer activities were measured on these materials using the test reaction between
cyclohexene and isobutane at 80 °C. Cycloalkane products were counted as products of HT and
DHGT. HT-only activities were determined by subtracting the cycloalkane amounts produced in
the presence and in the absence of isobutane. Experimental details about the method are provided
elsewhere [6].
In order to estimate the catalytic activity for alkylation, samples from each material, containing
the fixed amount of 0.093 mmol acid sites (as measured by ammonia chemisorption), were first
activated in an inert flow following the procedure described above, in the PFR reactor setup.
Following activation and cooling to room temperature under the inert flow, the catalyst samples
were quickly transferred into a stainless steel wire mesh basket inside a bench-top, stirred and
temperature-controlled reactor (Parr model no. 4565, 100 cm3, 316 stainless steel). Some of the
SZ and 25BEA65 catalyst samples were exposed for one hour to approx. 630 Pa of water vapor in
an attempt to modify their Lewis/Brönsted acid ratio, prior to being transferred into the reactor.
Page 62
55
These samples were coded SZ-HH and 25BEA65-HH, respectively. Following loading into the
reactor, all catalyst samples were evacuated for about one hour, after which a flow of 50 sccm of
UHP helium was established through the reactor. A second, in situ activation was performed at
175 °C for one hour to remove physisorbed water acquired during catalyst loading. Samples that
were pre-exposed to water vapor as described above were also subjected to this activation step in
order to remove excess physisorbed water. Following the in situ activation, the reactor was cooled
and held at a temperature of 80 °C, evacuated, and then refilled with isobutane (Matheson, 99%)
vapor directly from the tank up to 3.46 bar. Separately and similarly, a 10-cc syringe was filled
with 1-butene (Matheson, 99%) vapor up to 2.97 bar. The butene was mixed in four syringe
washes with isobutane from and back into the reactor through heated tubing and fittings, in order
to improve the transfer of the butene. Two subsequent washes were done with UHP argon at 3.76
bar into the reactor. The total elapsed time for butene introduction into the reactor was less than 2
minutes. Separate, blank tests showed that in average about 52% from the theoretical amount of
butene was transferred into the reactor, and that the initial isobutane/butene ratio was between 15
and 25. The reactor was operated in a batch, gas phase mode. Samples were taken starting as
early as 5 minutes on-stream, every 30 minutes, for a few hours. A typical initial pressure
following the butene injection was 4.03–4.45 bar, with a pressure loss of about 0.14–0.34 bar per
each sample. The samples were extracted using a heated needle valve and sent for analysis
through the online sampling loop of a mass spectrometer-coupled gas chromatograph (Hewlett-
Packard model GCD G1800A) equipped with a 30-m Supelco Supel-Q-Plot capillary column. C8-
range saturates included 2,2,4-trimethylpentane (TMP) and dimethylhexane (DMH) isomers.
Separation of the individual DMHs was not achieved, and neither was the separation of individual
C8-range alkenes (C8=). Instead, each of these groups was lumped. Separation between the DMHs
and C8= groups was enhanced by extracting the specific ion fragment signals 57 and 43,
respectively. In the calculation of conversions, the observed cis- and trans-butenes were counted
Page 63
56
towards unreacted butene, while in the estimation of cracking activity, the n-pentane
concentration was recorded.
3. Results and discussion
3.1. Characterization results
Table 1 summarizes all the measured characteristics for the four materials tested. Surface acid site
density and adsorbed isobutane/acid site ratios have been calculated in order facilitate the
interpretation of the reaction results. Considering the 65% zeolite concentration in the 25BEA65
and 75BEA65 materials, the measured ammonia chemisorption values are in agreement with
reported values obtained from ammonia temperature-programmed desorption measurements
[5,14,15]. The availabilities for hydride transfer (AHT) are a measure of HT activity and are
determined from the number of moles of HT products formed per each mole of acid during the
test reaction of cyclohexene with isobutane [6]. The AHT values are shown as differences
between tests in the presence and in the absence of isobutane, and therefore are not affected by
dimerization/hydrogen transfer (DGHT). The higher AHT in the 25BEA65 material as compared
to 75BEA65 is in accord with previous theoretical calculations [16] showing that a higher density
of aluminum sites in a zeolite promotes HT by stabilizing intermediates formed during HT.
Although of a much higher acid density than any of the zeolites, the low HT activity of SZ was
explained by its much lower isobutane adsorption capacity, while in zeolite 80ZSM565, HT was
blocked sterically by the narrower pore structure.
3.2. Alkylation tests
The batch alkylation test results in Figure 1 are represented as productivities by normalizing the
produced amounts of 2,2,4-trimethylpentane (TMP), the total dimethylhexanes (DMH) and the
Page 64
57
total C8 alkenes (C8=), to the number of acid sites that were measured by ammonia chemisorption.
Most butene conversion was achieved within the first 5 minutes of reaction on all materials with
the maximum apparent conversion being recorded on 75BEA65. The apparent butene conversion
on this material continued to increase over the first 50 minutes before stabilizing, whereas
conversion was observed to decrease and reach a minimum on all other materials. In all cases
unreacted butene was almost completely isomerized to cis- and trans-butene. At the same time,
the production of both C8= and DMH steadily increased for all materials while a steady TMP
concentration was reached within minutes for all catalysts except 80ZSM565. These observations
indicate that on all catalysts (except 80ZSM565) sites active for TMP production deactivate
rapidly, while dimerization is still possible on the remaining, possibly weaker active sites, as
indicated by the evolution of C8= and DMH [17]. The apparent drop in butene conversion with
reaction time on 25BEA65, SZ and 80ZSM565 is attributed to the gradual reactor
depressurization with each sample and the subsequent release of isomerized butene from the
weakest acid sites. The observed increase in butene conversion with the 75BEA65 catalyst could
be due to the accumulation of heavier oligomers from butene adsorbed on its stronger sites, or
perhaps to a slow rate of butene adsorption. Compared to 25BEA65, the less dense acid sites in
this material would allow oligomeric intermediates to build up to a greater extent before any
hydride transfer or cracking on an adjacent site could proceed.
3.3. Effect of measured hydride transfer activity
TMP is primarily a product of HT in the sequence of reactions 1 through 3. Indeed, 25BEA65,
which showed the highest AHT value in the reaction of cyclohexene with isobutane, also had the
highest TMP productivity. Moreover, zeolite ZSM-5 for which no AHT was detected, but which
had significant DHGT activity [6], did not produce any saturates. Yoo and Smirniotis [5] have
found that in a series of Beta zeolites of different SAR values, maximum 2-butene conversion for
liquid-phase alkylation at 80 °C was obtained for SAR values between 17 and 30. While little
Page 65
58
detail regarding the variation of the alkylate yield with SAR was given, the cited result is
somewhat consistent with the finding here that the higher aluminum content enhances alkylation
activity. A relatively good correlation exists between the AHT values and the observed TMP
productivities, as shown in Figure 2. This finding directly confirms that HT, as opposed to
DHGT, is the key factor in the production of TMP for all the materials analyzed. However,
noticeable deviations can be observed in this correlation. In the case of 75BEA65, a lower than
expected TMP productivity was recorded. As indicated by the observed increase with reaction
time in butene conversion in Figure 1, a steady accumulation of butene keeps occurring with a
slightly lower C8= release rate than in the other materials. Thus, a slightly deeper oligomerization
of adsorbed butene could have contributed to an early pore blockage, limiting the availability of
active sites for HT reactions. It is likely that such a process was limited in the HT test reaction
with cyclohexene because cyclohexene oligomer intermediates are bulkier and could easily have
been size-restricted in the narrow zeolite pores.
On the other hand, SZ showed a slightly higher TMP production than expected from the AHT
values and at the same time had the highest rate of C8= formation. This slight enhancement in
TMP could be the effect of early oligomerization, subsequent cracking and hydrogen transfer, as
suggested by Corma et al [17]. Indeed, when comparing the relative amounts of n-pentane
produced by the four materials up to 130 min reaction time, the following series is found: SZ
(5.0) > 25BEA65 (1.5) > 75BEA65 (1.0) > 80ZSM565 (0.0). The very high acid site density
(Table 1) and strength in this material are most probably responsible for the higher
oligomerization and cracking rates during alkylation, whereas cyclohexene oligomers are
expected to be resistant to cracking in the HT test reaction.
Page 66
59
3.4. Effect of moisture
Because previous investigations have suggested that Brönsted acidity is necessary for alkylation
[3], an attempt was made to modify the two most active catalysts 25BEA65 and SZ by water
vapor exposure (resulting materials coded 25BEA65-HH and SZ-HH). The alkylation results for
these catalysts are compared to those for the “dry” catalysts in Figure 3. Following the in situ
reactivation of these materials at 175 °C, both suffered a significant decrease in the quantities of
TMP and DMH produced, while their C8= productivities remained virtually unchanged. An
interesting effect was observed in the butene conversion trends where SZ-HH converted more
butene than the corresponding, “dry” SZ. In both materials that were exposed to water vapor,
cracking activity did not significantly change (as indicated by n-pentane formation) but TMP and
DMH formation was inhibited. However, n-pentane is also a saturated hydrocarbon formed by
HT and/or DHGT from the corresponding carbocation intermediate. Therefore, water exposure
seemed to selectively inhibit the HT reactions that yield C8 saturates without significantly
affecting other reactions. The 25BEA-HH and SZ-HH materials were tested using the IR
spectroscopy of chemisorbed pyridine in the DRIFTS apparatus with the purpose of measuring
any change in the relative Lewis/Brönsted (L/B) acidity. After in situ reactivation at 175 °C, no
significant change in the L/B ratio was detected for SZ-HH. An approximate L/B value of 1.1 was
measured both in the freshly activated SZ [13] and in SZ-HH. However, neither 25BEA nor
25BEA-HH showed any Brönsted acidity, following the in-situ activation in the DRIFTS
accessory. In fact, the 75BEA catalyst also lacked Brönsted acidity. This lack of Brönsted acidity
was attributed to the activation of the zeolites in a completely dry atmosphere at 500 °C and
TGA/MS measurements confirmed that a structural water loss occurred at about 450-500 °C. This
is in accord with earlier findings [18] that activation at increasing temperatures in dry inert flows
leads to successively lower Brönsted acidity in Beta zeolites. Although the studied Beta zeolites
completely lacked Brönsted acidity in the DRIFTS apparatus, they were active for both HT and
alkylation. Because of the high-temperature activation of the zeolites, the separate influence of
Page 67
60
Brönsted acidity, if any, could not be evaluated. On the other hand, the decrease in C8 saturate
selectivity in 25BEA65-HH and SZ-HH when compared to25BEA65 and SZ shows that a certain
modification was induced in the catalysts by water exposure. If the reactivation for one hour at
175 °C only partially removed physisorbed water, competitive physisorption between water and
isobutane produced a lower adsorbed isobutane/acid site ratio than the values shown in Table 1.
In SZ-HH on the other hand, the increase in butene conversion could be due to a slight change in
the L/B ratio under the effect of adsorbed water, which might have been below the sensitivity
limit of the DRIFTS method. It was previously shown that a fast Lewis-Brönsted interconversion
is possible in sulfated zirconia (see for ex. [13,19]). Thus, the change in SZ-HH surface chemistry
caused by the creation of a small number of new Brönsted acid sites could have accounted for the
increased butene conversion.
3.5. Effect of catalyst interaction with reactants
The catalyst loadings in the alkylation batch experiments were such that a constant
1-butene/acid molar ratio of about 6.3 was used in each experiment. In Figure 1, the drop in the
apparent butene conversion with advancing sample number—and inherent pressure drop in the
reactor—seems to indicate that some butene is reversibly adsorbed on all catalysts except
75BEA65. At the same time, all catalysts showed relatively similar C8= productivities per acid
site regardless of the different butene conversions observed. As evidenced in Figure 4, a
correlation can be established between the total catalyst surface area and butene conversion. This
correlation promptly indicates that the observed “conversion” is a strong function of the
adsorption capacity of the catalyst. Separate volumetric butene adsorption experiments showed
that on all catalysts equilibrium could not be reached even after 48 h, so that butene total
adsorption measurements were not usable. Whether this steady butene accumulation was by
reversible physisorption or by irreversible chemisorption remains unclear. However, during
isobutane adsorption experiments equilibrium was reached relatively fast on all materials and no
Page 68
61
chemisorption could be detected. Therefore, the overall interaction (physical and chemical)
between the solid acids studied and isobutane is weaker than with butene. If the productivity of
C8 alkenes per acid site is thought of as an indication of the extent of butene oligomerization, it
can be concluded from Figure 1c that, except on the narrower-pore 80ZSM565, oligomerization
is only a function of the number of acid sites available and is not affected by the apparent butene
conversion. It could therefore be argued that at least under the studied experimental conditions,
competitive adsorption favoring butene to isobutane is partially lowering the alkylate production
by blocking the access of isobutane to the active sites and is at the same time responsible for a
fraction of the apparent butene conversion. Judging by these observations, the negative deviation
in the TMP – AHT correlation in Figure 2 corresponding to 75BEA65, and the positive deviation
observed for SZ, could be seen as a result of competitive adsorption.
4. Conclusions
Batch isobutane alkylation tests with 1-butene performed under gas-phase conditions have shown
a good correlation between the amount of TMP produced per acid site and the independently
measured low-temperature HT activity. Under the current conditions, alkene formation was
favored. The lack of any alkylation activity in the ZSM-5 catalyst correlated perfectly with its
complete lack of HT activity even though it had an elevated DHGT activity. Sites initially active
for alkylation deactivate rapidly, while the remaining sites maintain oligomerization activity, as
evidenced by C8= and DMH evolution. On the basis of the test reaction between cyclohexene and
isobutane, SZ showed a higher than expected productivity of TMP, attributable to intense
oligomerization and cracking, while 75BEA65 showed lower than expected yields of C8 due to
advanced oligomerization. 25BEA65 had the highest low-temperature HT activity and produced
the most TMP in the alkylation tests.
Page 69
62
No Brönsted acidity was detected in the 25BEA and 75BEA catalyst samples that were activated
in the DRIFTS apparatus at 500 °C in a completely dry inert. Exposure of 25BEA65 and SZ to
water vapor at room temperature did not create any new Brönsted sites, however this treatment
selectively inhibited their alkylation activity with no change in C8 alkene formation. It is therefore
desirable that moisture not be present in any of these catalysts in order to achieve higher
alkylation selectivities. In the water-exposed SZ, an increased butene conversion was detected
compared to the dry catalyst and could be explained by changes in the surface chemistry below
the sensitivity of the DRIFTS method.
Finally, the observed butene conversion correlated with the total surface area exposed by the
catalysts to the reaction mixture, indicating that this conversion was due in part to reversible
adsorption of butene on the weakest acid sites. Evidence indicates that all the studied catalysts
adsorbed butene stronger than isobutane. While isobutane chemisorption was not observed on any
of the catalysts, 1-butene was strongly adsorbed and equilibrium adsorption was not achieved,
even after 48 hours. It was concluded that a partial cause of limited alkylation activity under the
reaction conditions studied could be the competitive adsorption that favors butene versus
isobutane, thus lowering the access of the hydride donor to the active sites. An increase of the
isobutane availability for the HT step (such as an increase in the isobutane adsorption capacity) at
the expense of butene adsorption is thought to be necessary in order to promote alkylation
reactions.
Acknowledgements
This work was carried on in, and funded through the O.H. Reaugh Laboratory for Oil and Gas
Processing Research at Washington State University.
Page 70
63
References
[1] S.I. Hommeltoft, Appl. Catal. A 221 (2001) 421.
[2] J.M. Meister, S.M. Black, B.S. Muldoon, D.H. Wei, C.M. Roesler, Hydrocarbon
Processing 79 (2000).
[3] A. Feller, I. Zuazo, A. Guzman, J.O. Barth, J.A. Lercher, J. Catal. 216 (2003) 313.
[4] D.B. Lukyanov, J. Catal. 145 (1994) 54
[5] K. Yoo, P.G. Smirniotis, Appl. Catal. A 227 (2002) 171
[6] A. Platon, W.J. Thomson, in preparation
[7] A. Corma, P.J. Miguel, A.V. Orchillés, Appl. Catal. A 138 (1996) 57
[8] K. Hatakeyama, T. Suzuka, M. Yamane, Sekiyu Gakkaishi 34 (1991) 267
[9] A. Corma, M.I. Juan-Rajadell, J.M. Lopez-Nieto, A. Martinez, C. Martinez, Appl. Catal. A
111 (1994) 175
[10] Y.F. Chu, A.W. Chester, Zeolites 6 (1986) 195
[11] R. B. Gore, W. J. Thomson, Appl. Catal. A 168 (1998) 23
[12] A.S. Chellappa, R.C. Miller and W.J. Thomson, Appl. Catal. A 209 (2001) 359
[13] A. Platon, W.J. Thomson, Ind. Eng. Chem. Res. 42 (2003) 5988
[14] G.S. Nivarthy, K. Seshan, J.A. Lercher, Microporous Mesoporous Mater. 22 (1998) 379
[15] G.S. Nivarthy, Y. He, K. Seshan, J.A. Lercher J. Catal. 176 (1998) 192
[16] C.J.A. Mota, P.M. Esteves, M.B. de Amorim, J. Phys. Chem., 100 (1996) 12418
[17] A. Corma, A. Martinez, C. Martinez, J. Catal. 149 (1994) 52
[18] E. Baburek, J. Novakova, Appl. Catal. A 185 (1999) 123
[19] B. Li, R.D. Gonzalez, Catal. Today 46 (1998) 55.
Page 71
64
Table 1. Measured and calculated characteristics of the catalysts used in the study. (S.A. – surface
area, iC4 – isobutane, AHT – site availability to HT)
dry weight BET S.A. NH3 chemisorption iC4 total adsorption AHT
material wt% ± % m2/g(dry) mmol/g ± % µmol/m2 mmol/g(dry) ± % iC4:acid mol/mol acid
75BEA65 91.9 0.19 441 0.254 7.5 0.58 0.733 0.8 2.89 0.065
25BEA65 90.5 0.01 444 0.572 1.3 1.29 0.780 0.0 1.36 0.073
SZ 97.4 0.11 90 0.230 1.7 2.56 0.034 10.0 0.15 0.029
80ZSM565 95.7 0.07 333 0.336 5.5 1.01 0.377 1.8 1.12 -
Page 72
65
0 50 100 150 200 25020
40
60
80
100
Reaction time, min
But
ene
conv
ersi
on, %
a
0 50 100 150 200 2500
0.01
0.02
0.03
0.04
0.05
Reaction time, min
TMP
pro
d., m
ol/(m
ol a
cid)
b
0 50 100 150 200 2500
0.05
0.1
0.15
0.2
Reaction time, min
C8= p
rod.
, mol
/(mol
aci
d)
c
0 50 100 150 200 2500
0.005
0.01
0.015
0.02
Reaction time, min
DM
H p
rod.
, mol
/(mol
aci
d)
d
Figure 1. Batch alkylation results: a – butene conversion (cis- and trans-butene all accounted for
unreacted butene); b – 2,2,4-trimethylpentane productivity; c – total C8-range alkene productivity;
d – dimethylhexane productivity. Symbols represent: ∆ – 75BEA65 (3 experiments); □ –
25BEA65 (2 experiments); ○ – SZ (2 experiments); – 80ZSM565.
Page 73
66
0 0.02 0.04 0.06 0.080
0.01
0.02
0.03
0.04
0.05
AHT
TMP
pro
d., m
ol/(m
ol a
cid)
80ZSM565
SZ
75BEA65
25BEA65
Figure 2. Correlation of TMP productivity during the alkylation test with the apparent acid site
availability for hydride transfer (AHT) as measured with the cyclohexene+isobutane test reaction.
(TMP values are estimated from linear regression at 130 min reaction time; error bars calculated
for 95% confidence)
Page 74
67
0 50 100 15020
30
40
50
60
70
Reaction time, min
But
ene
conv
ersi
on, %
a
0 50 100 1500.01
0.02
0.03
0.04
0.05
Reaction time, min
TMP
pro
d., m
ol/(m
ol a
cid)
b
0 50 100 1500.04
0.06
0.08
0.1
0.12
0.14
Reaction time, min
C8= p
rod.
, mol
/(mol
aci
d)
c
0 50 100 1500
0.005
0.01
0.015
Reaction time, min
DM
H p
rod.
, mol
/(mol
aci
d)
d
Figure 3. Effect of water pre-exposure upon batch alkylation results: a – butene conversion (cis-
and trans-butene all accounted for unreacted butene); b – 2,2,4-trimethylpentane productivity; c –
total C8-range alkene productivity; d – dimethylhexane productivity. Symbols represent: □ –
25BEA65 (2 experiments); ■ – 25BEA65-HH; ○ – SZ (2 experiments); ● – SZ-HH (2
experiments).
Page 75
68
50 100 15020
40
60
80
100
Total surface area, m2
App
aren
t but
ene
conv
ersi
on, %
SZ
25BEA65
80ZSM565
75BEA65
Figure 4. Correlation between the total catalyst surface area and the observed butene conversion
during the alkylation tests. 2-Butenes (cis and trans) were considered unreacted butene.
(conversion values are estimated from linear regression at 130 min reaction time; error bars
calculated for 95% confidence)
Page 76
69
APPENDIX A
PYRIDINE/DRIFTS MEASUREMENTS AND DATA
Spectra of pyridine interacting with sulfated zirconia were collected as total energy
spectra and thereafter ratioed against total energy spectra obtained from KBr samples. Specific
peaks corresponding to the Bpy and Lpy species were integrated numerically on the intervals
1565–1510 cm-1 and 1465–1424 cm-1. It was shown before that the slope of a Lpy–Bpy plot is the
negative of the ECR. Variability is possible in powder packing affecting the scattering factor and
the optical density of the samples, however, the slope of the Lpy–Bpy plot should, at least in
theory, hold constant from one sample to another. Errors introduced by such factors as
inconsistent catalyst activation/dehydration, or inconsistent desiccation of pyridine or inert gas
should be this way eliminated provided the linearity of the Kubelka-Munk transform with
concentration holds, and chemisorbed pyridine is not displaced by water exposure. In practice
however, the major source of experimental error came from variable water vapor interference
along the optical path of the FTIR instrument. It was not uncommon to detect in the acquired data
changes in outside precipitation, or the presence or absence of laboratory coworkers. The data
acquired (Table A1, Figure A1) showed a significant number of outliers that were most probably
related to variations in ambient humidity.
The raw ECR data from Table 1 was plotted in Figures A1(A) and (B) as a run sequence
plot and a lag plot. The run sequence plot is useful in revealing trends in data evolution (such as a
slow drift in equipment sensitivity) as well as abnormal data (outliers). The lag plot is useful in
pointing out both outliers and oscillations in equipment response (data “running in circles”).
Some statistics on the raw ECR data are listed below:
Page 77
70
Mean: 2.219476
Median: 0.2060000E+01
Standard deviation: 0.6887106
Standard deviation of mean: 0.1502890
95% confidence interval for actual mean: 1.90598 through 2.53297
A quick look at the run sequence plot shows that data tends to concentrate around the
ECR value of 2.0. Looking at the fluctuations and jumps in the ECR values, there is no reason to
trust data that fall outside the interval 1.5–2.5. Also the lag plot clearly shows about 6 outliers,
and no significant oscillation. The outliers were eliminated from the calculation, and the resulting
plots are shown in Figures A(C) and (D). The statistics on this filtered data are listed below.
Noticeable is the coincidence between the new mean, median and the median from the raw,
unfiltered data:
Mean: 2.049333
Median: 0.2050000e+01
Standard deviation: 0.2406677
Standard deviation of mean: 0.6214014E-01
95% confidence interval for actual Mean: 1.91606 through 2.18261
This ECR value was used to calculate the L/B ratio on the remaining data. The statistics
for this data are listed below. The run sequence and lag plots in Figure A2 clearly show two
outliers.
Mean: 1.106933
Median: 0.1088000E+01
Page 78
71
Standard deviation: 0.2253494
Standard deviation of mean: 0.5818497e-01
95% confidence interval for actual Mean: 0.982139 through 1.23173
After the elimination of the two outliers, the updated statistical calculation shows a good
match between the median and the mean L/B values:
Mean: 1.086385
Median: 0.1088000E+01
Standard deviation: 0.9894573E-01
Standard deviation of mean: 0.2744261E-01
95% confidence interval for actual Mean: 1.02659 through 1.14618
Page 79
72
Table A1. Raw pyridine/DRIFTS data showing Lpy, Bpy peak areas before and after
hydration as well as the calculated ECR values.
Expt Sample
Peak Limits,
cm-1
Initial Bpy
area
Initial Lpy
area
Final Bpy
area
Final Lpy
area ECR
20020930 SZ 1565-1510 1465-1424 4.099 14.870 7.631 9.340 1.566
20021001 SZ 1565-1510 1465-1424 5.954 13.245 9.494 6.486 1.909
20021002 SZ 1565-1510 1465-1424 5.337 13.009 9.026 6.328 1.811
20021007 SZ 1565-1510 1465-1424 5.962 13.327 9.551 4.481 2.464
20021008 SZ 1565-1510 1465-1424 5.297 13.434 8.064 5.414 2.898
20021014 SZ 1565-1510 1465-1424 5.854 11.482 8.860 2.760 2.902
20021016 SZ 1565-1510 1465-1424 6.004 13.484 10.397 4.772 1.983
20021017 SZ 1565-1510 1465-1425 5.093 12.907 8.824 5.367 2.021
20021018 SZ 1565-1510 1465-1426 5.597 13.435 9.457 5.509 2.054
20021108 SZ 1565-1510 1465-1427 6.622 11.749 10.165 4.453 2.060
20021112 SZ 1565-1510 1465-1428 6.837 13.509 10.560 4.530 2.411
20021113 SZ 1565-1510 1465-1429 5.744 12.603 9.514 4.356 2.187
20021115 SZ 1565-1510 1465-1430 5.642 12.253 9.817 4.935 1.753
20021118 SZ 1565-1510 1465-1431 5.142 12.453 9.067 3.519 2.276
20021120 SZ 1565-1510 1465-1432 4.981 10.517 8.590 2.497 2.222
20030305 SZ 1565-1510 1465-1424 4.813 11.070 7.926 4.597 2.079
20021122 10%SZ/KBr 1565-1510 1465-1433 0.313 0.593 0.730 0.086 1.218
20021127 10%SZ/KBr 1565-1510 1465-1434 1.493 2.064 2.144 0.227 2.824
20021202 10%SZ/KBr 1565-1510 1465-1435 1.050 1.245 1.295 0.132 4.532
20021204 10%SZ/KBr 1565-1510 1465-1436 0.291 0.532 0.576 0.124 1.430
20021206 10%SZ/KBr 1565-1510 1465-1437 0.422 0.620 0.683 0.096 2.009
Page 80
73
A
0.0
1.0
2.0
3.0
4.0
5.0
0 10 20 30
B
0.0
1.0
2.0
3.0
4.0
5.0
0.0 1.0 2.0 3.0 4.0 5.0
C
0.0
0.5
1.0
1.5
2.02.5
3.0
0 5 10 15 20
D
0.0
0.5
1.0
1.5
2.0
2.5
3.0
0.0 1.0 2.0 3.0
Figure A1. Run sequence plots (A, C) and lag plots (B, D) for the ECR data before (A, B) and
after (C, D) the elimination of outliers.
Page 81
74
A
00.20.40.60.81
1.21.41.61.82
0 5 10 15 20
B
0
0.2
0.4
0.6
0.8
1
1.2
1.4
0 0.5 1 1.5 2
Figure A2. Run sequence plot (A) and lag plot (B) for the L/B data before the removal of two outliers.
Page 82
75
APPENDIX B
TGA/MS MEASUREMENTS AND DATA
As stated in Chapter Three, TGA/MS experiments were carried in order to (1) measure
the catalyst dry weights that all subsequent chemisorption and adsorption capacities were
normalized to, and (2) identify the optimal catalyst activation pretreatment that would be
consistent from one catalyst sample to another. Two major constraints existed for the activation
temperature of the zeolites materials: (1) zeolites 25BEA and 80ZSM5 were purchased in their
ammonium form, and therefore, they required decomposition into the acidic form, and (2) the
maximum temperature achievable with the hydride transfer test setup was 510 °C. Based on the
decomposition profiles shown in Figures B1—B3, a common decomposition/activation
temperature for all zeolite materials was selected to be 500 °C. In figure B4, the decomposition
profiles for SZ show a major sulfate loss peak above ca. 700 °C, and therefore the dry weight was
calculated only up to 650 °C. Also, based on the weight loss curve, an activation temperature of
350 °C was considered sufficient for this material.
All dry weight results are summarized in Table B1.
Page 83
76
A
91.00
92.00
93.00
94.00
95.00
96.00
97.00
98.00
99.00
100.00
TG /%
0 20 40 60 80 100 120 140Time /min
0.2
0.4
0.6
0.8
1.0
Ion Current *10-8 /A
0
200
400
600
800
1000
Temperature /°C
M/z=18
temperature
TG signal
structural w ater loss [1]
[1]
[2][2]
B
Figure B1. TGA/MS profiles for the decomposition/activation of 25BEA65. A – Data showing
temperature ramp, relative weight and mass spectrometer fragment M/z=18 (mostly water); B –
Data from a different experiment showing temperature ramp, relative weight and fragment
M/z=15 (mostly ammonia) which peaks at ~400 °C, ~500 °C and ~850 °C.
Page 84
77
92.0
93.0
94.0
95.0
96.0
97.0
98.0
99.0
100.0
TG /%
0 20 40 60 80 100 120 140Time /min
0
0.5
1.0
1.5
2.0
Ion Current *10-8 /A
0
200
400
600
800
1000
Temperature /°C
M/z=18
temperature
TG signal
structural w ater loss [1]
[1]
[2][2]
Figure B2. TGA/MS profiles for the activation of 75BEA65. Up to 500 °C, two important water
losses (M/z=18) occurred, at ~180 °C and ~500 °C.
Page 85
78
A
96.00
96.50
97.00
97.50
98.00
98.50
99.00
99.50
100.00
TG /%
0 20 40 60 80 100 120 140Time /min
1.0
2.0
3.0
4.0
5.0
Ion Current *10-9 /A
0
200
400
600
800
1000
Temperature /°C
M/z=18
temperature
TG signal
structural w ater loss [1]
[1]
[2][2]
B
Figure B3. TGA/MS profiles for the activation/decomposition of 80ZSM565. A – Data showing
temperature ramp, relative weight and fragment M/z=18 (mostly water); B – Data from the same
experiment showing temperature ramp, relative weight and fragment M/z=15 (mostly ammonia)
which peaks at ~480 °C
Page 86
79
95.0
96.0
97.0
98.0
99.0
100.0
TG /%
0 20 40 60 80 100 120 140Time /min
0
200
400
600
800
1000
Temperature /°C
M/z=64
M/z=18
TG signal
temperatureMass Change: -2.45 %
Mass Change: -2.46 %
[1]
[1]
[2]
[2]
[3][3]
Figure B4. TGA/MS profiles for the activation of SZ. A major sulfur loss occurs above ~700 °C
(M/z=64, SO2), and the most important water loss occurs at ~110 °C.
Page 87
80
Table B1. TGA/MS weight loss results
%wt. loss to 1000°C 10°C/min
material Run #1 Run #2 Run #3 average ± %
25NH4BEA65 9.55 9.54 9.56 9.55 0.1
75BEA65 7.93 8.11 8.23 8.09 2.1
80NH4ZSM565 4.26 4.36 4.36 4.33 1.5
SZ* 2.45 2.59 2.64 2.56 4.4
* Weight loss determined only up to 650 °C.
Page 88
81
APPENDIX C
AMMONIA AND ISOBUTANE ADSORPTION – MEASUREMENTS AND DATA
Reactant adsorption and chemisorption measurements were carried out in the ASDI
RXM-100 catalyst characterization apparatus. Catalyst samples were loaded in bulb-type reactors.
Gases are expanded from a calibrated volume (reaction manifold, RMF, of volume 10.956 cm3)
into the reactor while pressures are precisely measured (±0.01 torr). Based on the typical reactor
sizes used, the theoretical sensitivity with this method is about 5×10⁻⁶ mmol. Much larger
uncertainties, however, arise from the varying dry catalyst masses employed in the measurement,
especially for highly hygroscopic materials such as SZ and all zeolites. Another source of
experimental uncertainty is sample inhomogeneity. Especially in the case of silica-bound zeolites,
variations in the measured (chemi)sorption values were correlated to some extent with the color
shade of the catalyst particles, which were determined by the varying concentrations in zeolitic
material.
For each catalyst, after the sample had been subjected to the activation treatments
detailed in Chapter 3, a room-temperature expansion of ultra-pure helium was performed by
putting the previously pressurized RMF in contact with the evacuated reactor and catalyst (Figure
C1). The ratio between the final and initial pressure was recorded as the room-temperature
expansion ratio, E0:
E 0P fP i
V RMFV RMF V RA+ V RT+
Page 89
82
where: P – pressures: i – initial, f – final; VRMF – volume of reaction manifold (calibrated
volume), VRA – equivalent reactor volume held at ambient temperature, VRT – equivalent reactor
volume to be held at chemisorption temperature T.
The procedure was repeated with the reactor held at the desired (chemi)sorption
temperature – in this case 80 °C, and the expansion ratio ET also recorded:
n constantP i V RMF⋅
R T 0⋅P f
VRTR T⋅
V RMF V RA+
R T 0⋅+
⋅
E TP fP i
V RMF
T 0
V RTT
V RMF V RA+
T 0+
where: n – number of moles, T0 – ambient temperature, T – temperature of catalyst
sample, R – universal ideal gas constant.
From the above formulas, the volumes held at temperature T (80 °C) – VRT – and at
ambient temperature – VA = VRA+VRMF – were calculated:
VRT V RMFT E T E 0−( )⋅
E T E 0⋅ T T 0−( )⋅⋅
VA VRMFT E 0⋅ E T T 0⋅−
E T E 0⋅ T T 0−( )⋅⋅
Thereafter, following complete evacuation, expansion of known pressures of adsorbate
(ammonia or isobutane) was performed. The recorded pressures from each expansion step were
Page 90
83
compared with the ideal-gas expected final pressures, and the difference in mole numbers was
accounted for as the adsorbed quantity from the specific gas.
∆n a n i n f−P i V RMF⋅
R T 0⋅P f
V AR T 0⋅
V RTR T⋅
+
⋅−
where: ∆na – number of moles adsorbed, ni – initial number of moles in RMF, nf – final
number of moles in the gas phase.
Incremental re-pressurizations of the RMF and subsequent expansions into the reactor
were performed without intermediate evacuations, thus allowing for the adsorption isotherms to
be measured. The number of moles adsorbed during incremental step k is calculated as:
∆n ak( )
n ik( ) n f
k( )−P i
k( ) V RMF⋅
R T 0⋅P f
k 1−( ) V RTR T⋅
VRAR T 0⋅
+
⋅+
P fk( ) VA
R T 0⋅
V RTR T⋅
+
⋅
−
The adsorption isotherm was obtained by calculating the integral adsorbed moles
normalized to the dry weight of the catalyst sample as a function of equilibrium (final) pressure
per each increment. For the purpose of this work, isotherm acquisition was considered completed
once a linear, monolayer region was attained. In the cases where chemisorption occurred—such
as with ammonia— the first adsorption isotherm included both physisorbed and chemisorbed
adsorbate. Following an overnight evacuation at constant temperature it was considered that all
physisorbed gas was removed. A similar, second adsorption measurement on the evacuated
material was used to measure the physisorption isotherm. By subtracting the two isotherms in the
linear, and parallel segments, the numbers of moles of chemisorbed adsorbate per gram of dry
catalyst were calculated. A typical chemisorption data sheet is shown in Figure C2. The complete
ammonia chemisorption data acquired are listed in Table C1.
Page 91
84
In the case of isobutane used as an adsorbate, no chemisorption could be measured. The
physisorption capacity of all catalysts was calculated by extrapolation of the adsorbed number of
moles from the linear, monolayer isotherm to a zero pressure. The complete isobutane adsorption
capacities measured are listed in Table C2.
Page 92
85
Figure C1. Volumetric measurement of ammonia chemisorption – derivation of calculation
formulas.
VRT
VA VRMF
VR
Temp. ambient=T0
Temp. sample=T
RMF
Page 93
86
Figure C2. Typical chemisorption data sheet.
Page 94
87
Table C1. Complete ammonia chemisorption data
NH3 chemisorption, mmol/g
material run#1 run#2 run#3 average ±%
25BEA65 0.576 0.564 0.575 0.572 1.3
75BEA65 0.253 0.237 0.271 0.254 7.5
80ZSM565 0.342 0.317 0.348 0.336 5.5
SZ 0.228 0.228 0.234 0.230 1.7
25BEA65B* 0.567 0.688 0.457 0.570 22.9
* Samples of 25BEA65 that were activated in a stream of 20% oxygen diluted in ultra pure
helium prior to being analyzed by ammonia chemisorption.
Page 95
88
Table C2. Complete isobutane adsorption capacity data
iC4 total ads mmol/g
material run1 run2 run3 avg ± %
75BEA65 0.736 0.730 - 0.733 0.82
25BEA65 0.780 0.780 - 0.780 0.01
SZ 0.037 0.034 0.031 0.034 9.98
80ZSM565 0.377 0.383 0.371 0.377 1.80
Page 96
89
APPENDIX D
RAW HYDRIDE TRANSFER TEST DATA
catalyst= 75BEA65 #1 % % % % m cat= 0.343 g TOS, min MCP MCPE-1 CHX CHXE LOI= 8.09 % 1 0 0 0 0.002592
NH3 chemis= 0.254 mmol/g_dry 4.2 0 0 0 0.001893iBU /rxtr= 20.02 sccm 7.4 0.000197 0 0.002822 0.001997He /rxtr= 20.02 sccm 10.6 0.000808 0 0.010542 0.00169He /sat= 9.91 sccm 13.8 0.001107 0 0.018273 0.001795
CHXE sat%= 3.61 % 17 0.001048 0 0.02213 0.004611 20.2 0.000969 0 0.024029 0.077948 23.4 0.000437 0.000524 0.012712 0.402608 26.6 0 0.00082 0.004447 0.715106 29.8 0 0.000747 0.000843 0.726821 33 0 0.000703 0.0003 0.749446 36.2 0 0.000708 0 0.726631 39.4 0 0.00056 0 0.691173 42.6 0 0.000464 0 0.706485 45.8 0 0.000449 0 0.605552
catalyst= 75BEA65 #3 % % % % m cat= 0.343 g TOS, min MCP MCPE-1 CHX CHXE LOI= 8.09 % 1 0 0 0 0.001133
NH3 chemis= 0.254 mmol/g_dry 4.2 0 0 0 0.000998iBU /rxtr= 20.02 sccm 7.4 9.53E-05 0 0.002115 0.001054He /rxtr= 20.02 sccm 10.6 0.000678 0 0.007929 0.000722He /sat= 9.91 sccm 13.8 0.001055 0 0.016069 0.000663
CHXE sat%= 3.61 % 17 0.001071 0 0.020616 0.001231 20.2 0.000709 0 0.016631 0.015961 23.4 0.000571 7.79E-05 0.014335 0.143001 26.6 0.000172 0.000425 0.008435 0.343596 29.8 0 0.000714 0.001648 0.560838 33 0 0.000818 0.000657 0.6599 36.2 0 0.000768 0.000116 0.657241 39.4 0 0.000678 0 0.630229 42.6 0 0.000646 0 0.633428 45.8 0 0.00068 3.45E-05 0.693977 49 0 0.000578 0 0.687515
Page 97
90
catalyst= 75BEA65 #4 % % % % m cat= 0.343 g TOS, min MCP MCPE-1 CHX CHXE LOI= 8.09 % 1 0 0 0 0.00113
NH3 chemis= 0.254 mmol/g_dry 4.2 0 0 0.000273 0.001159iBU /rxtr= 20.02 sccm 7.4 0.000176 0 0.004597 0.000971He /rxtr= 20.02 sccm 10.6 0.000665 0 0.011029 0.001532He /sat= 9.91 sccm 13.8 0.000734 0 0.014409 0.024099
CHXE sat%= 3.61 % 17 0.000695 0 0.015157 0.116009 20.2 0.000442 8.03E-05 0.01248 0.213585 23.4 0.000343 0.000287 0.010468 0.327543 26.6 5.98E-05 0.000351 0.007553 0.423862 29.8 3.41E-05 0.000507 0.006197 0.574318 33 0 0.000504 0.003006 0.614967 36.2 0 0.000542 0.001365 0.680588 39.4 0 0.000627 0.000816 0.788805 42.6 0 0.000669 0.000238 0.79623 45.8 0 0.00065 8.08E-05 0.741865
catalyst= 75BEA65 #5 % % % % m cat= 0.343 g TOS, min MCP MCPE-1 CHX CHXE LOI= 8.09 % 1 0 0 0 0.001417
NH3 chemis= 0.254 mmol/g_dry 4.2 0 0 0.000602 0.001326iBU /rxtr= 20.02 sccm 7.4 0.000291 0 0.005164 0.00102He /rxtr= 20.02 sccm 10.6 0.00073 0 0.011461 0.001527He /sat= 9.91 sccm 13.8 0.000824 0 0.015373 0.018713
CHXE sat%= 3.61 % 17 0.000688 0 0.014228 0.07352acid sites= 0.080074 mmol 20.2 0.00059 5.16E-05 0.013965 0.164575F_CHXE= 0.016559 mmol/min 23.4 0.000487 0.000318 0.01241 0.276518
CHXE_feed%= 0.732162 % 26.6 0.000241 0.000354 0.008639 0.382195F_feed= 2.245077 mmol/min 29.8 2.5E-05 0.000462 0.006206 0.467322
iBU/CHXE= 53.94053 33 0 0.000478 0.003484 0.53942CHXE mol.S.V.= 0.206794 mmol/mmol_min 36.2 0 0.0006 0.001691 0.583841
39.4 0 0.000558 0.000658 0.639866 42.6 0 0.000566 3.09E-05 0.662386 45.8 0 0.00055 0 0.672974 49 0 0.000559 0 0.657095
Page 98
91
catalyst= 75BEA65 #6 NIBU % % % % m cat= 0.343 g TOS, min MCP MCPE-1 CHX CHXE LOI= 8.09 % 1 0 0 0 0.006767835
NH3 chemis= 0.254 mmol/g_dry 4.2 0 0 0 0.004254623iBU /rxtr= 0 sccm 7.4 0 0 0 0.003061524He /rxtr= 40.08 sccm 10.6 0 0 0 0.002216152He /sat= 9.91 sccm 13.8 0 0 0 0.001672698
CHXE sat%= 3.61 % 17 0 0 0 0.001020971acid sites= 0.08007383 mmol 20.2 0 0 0 0.00052749F_CHXE= 0.016558825 mmol/min 23.4 0 0 0.001316486 0.023558673
CHXE_feed%= 0.731584226 % 26.6 0 0 0.001691261 0.074236576F_feed= 2.246861314 mmol/min 29.8 0.000151923 0.000110559 0.004711734 0.221952503
iBU/CHXE= 0 33 0.000457314 0.000260857 0.008050989 0.386961771CHXE mol.S.V.= 0.206794463 36.2 5.92242E-05 0.000503616 0.003407974 0.557109903
(mmol/mmol_min) 39.4 0 0.000537059 0.002560435 0.566057104 42.6 0 0.000603158 0.000589842 0.621517814 45.8 0 0.000557125 0.00015271 0.598361699 49 0 0.000550436 0 0.609016996
Page 99
92
catalyst= 25BEA65 #4 % % % % m cat= 0.155 g TOS, min MCP MCPE-1 CHX CHXE LOI= 9.55 % 1 0 0 0 0
NH3 chemis= 0.572 mmol/g_dry 4.2 0.001148597 0 0.023235124 0.002922931iBU /rxtr= 20.02 sccm 7.4 0.001319369 0 0.041644737 0.049630165He /rxtr= 20.02 sccm 10.6 0.000800097 0.000128535 0.030234653 0.253300264He /sat= 9.91 sccm 13.8 0 0.000291861 0.011058428 0.537723908
CHXE sat%= 3.61 % 17 0 0.000429577 0.003121148 0.672230749 20.2 0 0.000356129 0.000865075 0.721513129 23.4 0 0.000330035 0 0.685482395 26.6 0 0.000283647 0 0.751688624 29.8 0 0.000283164 0 0.787742373 33 0 0.000178789 0 0.725297 36.2 0 0.000281714 0 0.760384963 39.4 0 0.000253204 0 0.82791073 42.6 0 0.000156561 0 0.759515499 45.8 0 0.000200051 0 0.718276509
catalyst= 25BEA65 #5 % % % % m cat= 0.155 g TOS, min MCP MCPE-1 CHX CHXE LOI= 9.55 % 1.5 0 0 0.000967953 0.001356229
NH3 chemis= 0.572 mmol/g_dry 4.7 0.001226978 0 0.029467677 0.004329155iBU /rxtr= 20.02 sccm 7.9 0.001043339 0 0.038576317 0.086861521He /rxtr= 20.02 sccm 11.1 0.000624226 0 0.023685575 0.344140838He /sat= 9.91 sccm 14.3 0 0.000196871 0.009559681 0.564685213
CHXE sat%= 3.61 % 17.5 0 0.000144825 0.0033979 0.65436298 20.7 0 0.000274375 0.001404355 0.759456249 23.9 0 0.000198568 4.66594E-05 0.714129862 27.1 0 0.00010183 0 0.701795065 30.3 0 0.000134642 0 0.691513073 33.5 0 0.000268152 0 0.775752951 36.7 0 6.67551E-05 0 0.652646487 39.9 0 0.00016519 0 0.772917744 43.1 0 0.000171413 0 0.686910478 46.3 0 0.000188951 0 0.712144918
Page 100
93
catalyst= 25BEA65 #6 % % % % m cat= 0.155 g TOS, min MCP MCPE-1 CHX CHXE LOI= 9.55 % 2 0 0 0.00257675 0.007764151
NH3 chemis= 0.572 mmol/g_dry 5.2 0.001228978 0 0.029630119 0.012414611iBU /rxtr= 20.02 sccm 8.4 0.00119309 0.000231757 0.039476987 0.095010471He /rxtr= 20.02 sccm 11.6 0.000618213 0.000533869 0.025738222 0.326759618He /sat= 9.91 sccm 14.8 0 0.000623365 0.010358034 0.596958106
CHXE sat%= 3.61 % 18 0 0.00074959 0.003599921 0.774737824 21.2 0 0.000677165 0.001084243 0.715909868 24.4 0 0.000550941 0.000144733 0.751970099 27.6 0 0.00048369 0 0.725844113 30.8 0 0.000363672 0 0.689507374 34 0 0.000405058 0 0.781359437 37.2 0 0.000374536 0 0.702954102 40.4 0 0.000266417 0 0.781275481 43.6 0 0.0002659 0 0.708862998 46.8 0 0.000259692 0 0.719785556
catalyst= 25BEA65 #7 % % % % m cat= 0.155 g TOS, min MCP MCPE-1 CHX CHXE LOI= 9.55 % 3 0.000323665 0 0.007341843 0.000596311
NH3 chemis= 0.572 mmol/g_dry 6.2 0.001341473 0 0.036987839 0.00452016iBU /rxtr= 20.02 sccm 9.4 0.001037943 0 0.039812629 0.109736838He /rxtr= 20.02 sccm 12.6 0.000281382 0.000121139 0.014722246 0.391344228He /sat= 9.91 sccm 15.8 0 0.000245739 0.003605308 0.604990473
CHXE sat%= 3.61 % 19 0 0.00028881 0.001206538 0.752936672 22.2 0 0.000237663 0.000334596 0.683629588 25.4 0 0.000200744 0.000113191 0.696276945 28.6 0 0.000170363 0 0.668571886 31.8 0 0.000307269 0 0.807027309 35 0 0.000309192 0 0.8068109 38.2 0 0.00038649 0 0.686182396
Page 101
94
catalyst= 25BEA65 #8 no iBU % % % % m cat= 0.155 g TOS, min MCP MCPE-1 CHX CHXE LOI= 9.55 % 1 0 0 0 0
NH3 chemis= 0.572 mmol/g_dry 4.2 0 0 0 0.000305036iBU /rxtr= sccm 7.4 0 0 0.00058436 0.022301981He /rxtr= 40.08 sccm 10.6 0 0 0.005794103 0.227662663He /sat= 9.91 sccm 13.8 0.000236221 0.000261165 0.009080406 0.545312318
CHXE sat%= 3.61 % 17 0.000177426 0.000385587 0.007575469 0.6535089 20.2 0 0.000376444 0.00292823 0.68767853 23.4 0 0.000422953 0.002043011 0.711657156 26.6 0 0.000319997 0.000196072 0.70945108 29.8 0 0.000264346 0 0.723180501 33 0 0.000299327 0 0.712158537 36.2 0 0.000264743 0 0.704191841 39.4 0 0.000243675 0 0.686503265 42.6 0 0.000245662 0 0.666108635 45.8 0 0.000203924 0 0.68568072
Page 102
95
catalyst= SZ #1 % % % % m cat= 0.356 g TOS, min MCP MCPE-1 CHX CHXE LOI= 2.56 % 1 0.003561341 0 0.005424738 0
NH3 chemis= 0.23 mmol/g_dry 4.2 0.009057099 0 0.022669265 0.159658118iBU /rxtr= 20.02 sccm 7.4 0.002867072 4.50197E-05 0.00852232 0.395624588He /rxtr= 20.02 sccm 10.6 0.000302671 0.000198905 0.002016737 0.515467989He /sat= 9.91 sccm 13.8 0 0.000160025 0.000611574 0.531018594
CHXE sat%= 3.61 % 17 0 0.000220187 0.000342852 0.600878271
catalyst= SZ #2 % % % % m cat= 0.357 g TOS, min MCP MCPE-1 CHX CHXE LOI= 2.56 % 1 0.012059614 9.80631E-05 0.022533271 0.030941079
NH3 chemis= 0.23 mmol/g_dry 4.2 0.007755244 0.000445793 0.018833779 0.404903421iBU /rxtr= 20.02 sccm 7.4 0.003832254 0.000486371 0.010380271 0.48040892He /rxtr= 20.02 sccm 10.6 0.001369874 0.000463264 0.004764953 0.582793252He /sat= 9.91 sccm 13.8 0.000258188 0.000490879 0.001623256 0.618358294
CHXE sat%= 3.61 % 17 0 0.000490316 0.000420169 0.703315526 20.2 0 0.000444666 0 0.642847101 23.4 0 0.000482989 5.10401E-05 0.732329871 26.6 0 0.000450301 0 0.735352199 29.8 0 0.000485807 0 0.722682283
Page 103
96
catalyst= SZ #3 % % % % m cat= 0.357 g TOS, min MCP MCPE-1 CHX CHXE LOI= 2.56 % 0.5 0 0 0 0
NH3 chemis= 0.23 mmol/g_dry 3.7 0.010642258 0 0.026518142 0.031423799iBU /rxtr= 20.02 sccm 6.9 0.000350747 0 0.002991931 0.457909736He /rxtr= 20.02 sccm 10.1 0 5.91483E-05 0.000646297 0.548177172He /sat= 9.91 sccm 13.3 0 0.000146585 0.000212937 0.699538374
CHXE sat%= 3.61 % 16.5 0 0.000178988 0 0.685113041 19.7 0 0.00020059 0 0.700806794 22.9 0 0.000310657 0 0.681767786 26.1 0 0.000326087 0 0.72962389 29.3 0 0.000339974 0 0.644992669
catalyst= SZ #4, No IBU % % % % m cat= 0.357 g TOS, min MCP MCPE-1 CHX CHXE LOI= 2.56 % 0.5 0 0 0 0.007051673
NH3 chemis= 0.23 mmol/g_dry 3.7 0.01096386 0 0.001956135 0.005201336iBU /rxtr= sccm 6.9 0.003354817 3.17853E-05 0.003795443 0.330692597He /rxtr= 40.08 sccm 10.1 0 9.47779E-05 0.000200941 0.511402816He /sat= 9.91 sccm 13.3 0 0.000517233 0.000101872 0.607025018
CHXE sat%= 3.61 % 16.5 0 0.000805612 0 0.65025462 19.7 0 0.000664601 0 0.686957577 22.9 0 0.001189346 0 0.684137723 26.1 0 0.001139646 0 0.714170287
Page 104
97
catalyst= 80ZSM565 #1 % % % % m cat= 0.2485 g TOS, min MCP MCPE-1 CHX CHXE LOI= 4.33 % 1 0 0 0 0
NH3 chemis= 0.336 mmol/g_dry 4.2 0.022367131 0.009359784 0 0.079485751iBU /rxtr= 20.02 sccm 7.4 0.017367982 0.02856215 0 0.325911664He /rxtr= 20.02 sccm 10.6 0.009992696 0.040070273 0 0.526171602He /sat= 9.91 sccm 13.8 0.005677405 0.043720652 0 0.629875916
CHXE sat%= 3.61 % 17 0.003184366 0.040572475 0 0.647862404 20.2 0.001947371 0.036804821 0 0.684680519 23.4 0.000602438 0.030672824 0 0.637075948 26.6 0.000703653 0.032541243 0 0.722503336 29.8 0.000670413 0.030728181 0 0.75787933 33 0 0.026640088 0 0.709065693 36.2 0 0.028039975 0 0.791821257 39.4 0 0.024461217 0 0.750683325 42.6 0 0.023425426 0 0.741605265 45.8 0 0.022195317 0 0.758578494 49 0 0.020646482 0 0.728528026 52.2 0 0.019285401 0 0.727396981 55.4 0 0.019059981 0 0.751323596 61.8 0 0.018554926 0 0.816612641
catalyst= 80ZSM565 #2 % % % % m cat= 0.249 g TOS, min MCP MCPE-1 CHX CHXE LOI= 4.33 % 1 0 0.001177725 0 0.002102034
NH3 chemis= 0.336 mmol/g_dry 4.2 0.017542971 0.010081949 0.000722198 0.113664926iBU /rxtr= 20.02 sccm 7.4 0.014074676 0.029362971 0.001271248 0.436840369He /rxtr= 20.02 sccm 10.6 0.006718028 0.03274692 0.001061766 0.562909544He /sat= 9.91 sccm 13.8 0.0037729 0.032003283 0.000894449 0.614439706
CHXE sat%= 3.61 % 17 0.002602401 0.032657883 0.00076257 0.659501318 23.4 0.001012569 0.025082275 0.000462027 0.655645144 26.6 0.000867709 0.027517054 0.000510473 0.848404958 29.8 0.000682186 0.023865163 0.000377696 0.714125814 33 0.000640072 0.0237789 0.000383976 0.748678237 36.2 0.000510823 0.021894428 0.000218005 0.744007867 39.4 0.000438211 0.022378167 0.000183465 0.745244328
Page 105
98
catalyst= 80ZSM565 #3 % % % % m cat= 0.249 g TOS, min MCP MCPE-1 CHX CHXE LOI= 4.33 % 1 0 0 0 0.0011749
NH3 chemis= 0.336 mmol/g_dry 4.2 0.022961168 0.011645941 0.001074366 0.102671926iBU /rxtr= 20.02 sccm 7.4 0.022375268 0.03483099 0.001818494 0.386414394He /rxtr= 20.02 sccm 10.6 0.010370516 0.038800759 0.001410618 0.486061997He /sat= 9.91 sccm 13.8 0.006428525 0.044225299 0.001334073 0.62819147
CHXE sat%= 3.61 % 17 0.003274224 0.037168157 0.000805911 0.621456969 20.2 0.002195797 0.035850648 0.000788962 0.664915139 23.4 0.001354562 0.032523236 0.000581196 0.660390284 26.6 0.001135955 0.030726664 0.000541284 0.68862903 29.8 0.000798311 0.029234366 0.00032641 0.704964908 33 0.000637675 0.027759986 0.000347734 0.712712089 36.2 0.000468189 0.026504346 0.000356482 0.712854032 39.4 0.000478367 0.025247354 0.000215967 0.74272392 42.6 0.000386322 0.023653631 8.52932E-05 0.680863956
catalyst= 80ZSM565 #4 no iBU % % % % m cat= 0.249 g TOS, min MCP MCPE-1 CHX CHXE LOI= 4.33 % 1 0 0 0 0.002606285
NH3 chemis= 0.336 mmol/g_dry 4.2 0 0 0 0.001856757iBU /rxtr= 0 sccm 7.4 0 0.010324133 0 0.088369335He /rxtr= 40.08 sccm 10.6 0 0.032326866 5.8658E-05 0.426658681He /sat= 9.91 sccm 13.8 0.006877669 0.035742566 0.000125137 0.569555254
CHXE sat%= 3.61 % 17 0.017780386 0.032409771 3.24015E-05 0.609037092 20.2 0.014851804 0.030838024 6.20099E-05 0.66300066 23.4 0.010054029 0.024166562 0 0.59604101 26.6 0.007508872 0.023968971 0 0.644940086 29.8 0.004717291 0.024452931 3.0167E-05 0.730420387 33 0.003662423 0.020532544 0 0.671247904 36.2 0.003056089 0.020337717 0 0.703843835 39.4 0.001926615 0.019020213 0 0.701069363 42.6 0.001615988 0.017376614 0 0.673806049 45.8 0.001324802 0.016364824 0 0.668500245 49 0.001001514 0.016319571 0 0.698533156
Page 106
99
APPENDIX E
RAW ALKYLATION TEST DATA
Reactor feed calculation: Ar% Bue% Bue/Ar Ar/TMP I/O
test 1 16.0 3.4 0.913 1.9 23.9 14.5 3.2 0.956 1.7 25.9 13.3 3.1 1.021 1.6 26.7 13.1 3.4 1.136 1.6 24.4
test 2 26.5 4.9 0.810 3.2 13.9 25.0 5.0 0.866 3.0 14.0 22.4 4.8 0.921 2.7 15.3
test 3 16.9 4.2 1.084 2.0 18.7 15.3 4.1 1.173 1.9 19.5 14.0 4.1 1.284 1.7 19.8 17.70 4.02 1.02 2.14 20.2 =avg 18.01 7.72 =theoretical (HYSYS)
p, psig= 47 ==> n, mmol= 14.5 V, cc= 100 nBUE1 feed, mmol= 0.583 T, C= 80 n acid= 0.093 R, l*atm/mol/k= 0.082 BUE1/acid= 6.27
Page 107
100
cat. Acid mmol= 0.093 Bue C8= TMP DMH Bue conv nC5 material Reaction time, min % % % % % % 75BEA652 30.00 0.9332 0.0591 0.0123 0.0057 76.81 0.0149 60.00 0.6191 0.0551 0.0108 0.0062 84.62 0.0129 90.00 0.5119 0.0546 0.0101 0.0069 87.28 0.0157 120.00 0.4691 0.0591 0.0115 0.0069 88.34 0.0158 150.00 0.4254 0.0669 0.0122 0.0096 89.43 0.0144 180.00 0.3820 0.0706 0.0129 0.0083 90.51 0.0201 210.00 0.3788 0.0697 0.0136 0.0100 90.59 0.0220 10.00 0.8727 0.0535 0.0129 0.0056 78.32 0.0172 40.00 0.5230 0.0584 0.0136 0.0071 87.01 0.0188 70.00 0.4173 0.0610 0.0148 0.0079 89.63 0.0215 100.00 0.3638 0.0698 0.0166 0.0096 90.96 0.0234 130.00 0.3398 0.0709 0.0168 0.0101 91.56 0.0238 5.00 1.3392 0.0377 0.0104 0.0032 66.73 0.0110 35.00 0.9227 0.0465 0.0103 0.0045 77.07 0.0148 65.00 0.8115 0.0467 0.0106 0.0053 79.84 0.0168 95.00 0.6619 0.0500 0.0107 0.0051 83.55 0.0158 125.00 0.6029 0.0512 0.0107 0.0056 85.02 0.0176 155.00 0.5953 0.0521 0.0110 0.0056 85.21 0.0150 25BEA65 1.9106 0.0584 0.0283 0.0044 52.53 0.0264 35.00 1.7501 0.0637 0.0262 0.0056 56.52 0.0253 65.00 1.7381 0.0664 0.0264 0.0054 56.82 0.0258 95.00 1.6733 0.0680 0.0264 0.0060 58.43 0.0270 125.00 1.6781 0.0754 0.0270 0.0070 58.31 0.0319 10.00 1.6762 0.0520 0.0229 0.0041 58.36 0.0218 40.00 1.6717 0.0581 0.0237 0.0043 58.47 0.0234 70.00 1.6820 0.0603 0.0236 0.0051 58.21 0.0219 100.00 1.6679 0.0606 0.0241 0.0051 58.56 0.0245 130.00 1.5981 0.0612 0.0242 0.0055 60.29 0.0244
Page 108
101
cat. Acid mmol= 0.093 Bue C8= TMP DMH Bue conv nC5 material Reaction time, min % % % % % % SZ 10.00 2.5186 0.0501 0.0137 0.0061 37.43 0.0753 40.00 2.7955 0.0579 0.0126 0.0067 30.54 0.0808 70.00 2.8497 0.0648 0.0127 0.0070 29.20 0.0754 100.00 2.8343 0.0760 0.0134 0.0078 29.58 0.0758 130.00 2.6565 0.0827 0.0148 0.0093 34.00 0.0721 5.00 2.6148 0.0428 0.0116 0.0055 35.03 0.1215 35.00 3.0461 0.0626 0.0129 0.0076 24.32 0.1253 65.00 3.0709 0.0708 0.0143 0.0075 23.70 0.1220 95.00 3.0440 0.0796 0.0143 0.0093 24.37 0.1210 125.00 2.9304 0.0838 0.0143 0.0089 27.19 0.1169 25BEA65-HH 10.00 1.6888 0.0391 0.0147 0.0006 58.04 0.0159 40.00 1.8227 0.0534 0.0157 0.0017 54.71 0.0190 70.00 1.9426 0.0585 0.0178 0.0020 51.74 0.0193 100.00 1.9754 0.0643 0.0178 0.0035 50.92 0.0173 143.00 1.8569 0.0656 0.0178 0.0028 53.86 0.0195 SZ-HH 10.00 1.9612 0.0380 0.0082 0.0012 51.27 0.0941 40.00 2.2212 0.0514 0.0075 0.0026 44.81 0.1021 70.00 2.4235 0.0629 0.0090 0.0034 39.79 0.1028 100.00 2.5572 0.0721 0.0091 0.0040 36.47 0.1039 130.00 2.5462 0.0755 0.0097 0.0056 36.74 0.1058 10.00 2.0068 0.0359 0.0087 0.0017 50.14 0.1230 40.00 2.2515 0.0487 0.0082 0.0024 44.06 0.1190 70.00 2.3257 0.0556 0.0089 0.0028 42.22 0.1207 100.00 2.4103 0.0591 0.0084 0.0027 40.12 0.1274 130.00 2.4706 0.0751 0.0099 0.0049 38.62 0.1216 80ZSM565 10.00 1.3908 0.0000 0.0000 0.0000 65.44 0.0000 40.00 2.1530 0.0029 0.0000 0.0000 46.51 0.0000 70.00 2.2661 0.0025 0.0000 0.0000 43.70 0.0000