CSA GLOBAL CSA Global presents: Cobalt: Out of the Blue; Powering the Next Century Presenter: Aaron Green, Director - Australasia Wednesday 15 th November 2017 Low Emissions and Technology Minerals Conference 2017
Transcript
CSA GLOBAL
CSA Global presents:Cobalt: Out of the Blue; Powering the Next Century
Presenter: Aaron Green, Director - Australasia
Wednesday 15th November 2017
Low Emissions and Technology Minerals Conference 2017
Cobalt: Did you know?
• Atomic Number 27
• Density: 8.9g/cm3
• Melting point: 1,495°C
• 33rd most abundant element in the Earth’s crust
• Not found in its native metallic form in nature
• Has the ability to maintain its magnetic properties at high temperatures (up to 1121°C)
• Common cobalt-bearing minerals include:
• Cobaltite (pictured right)
• Skutterudite
• Corollite
• Erythrite
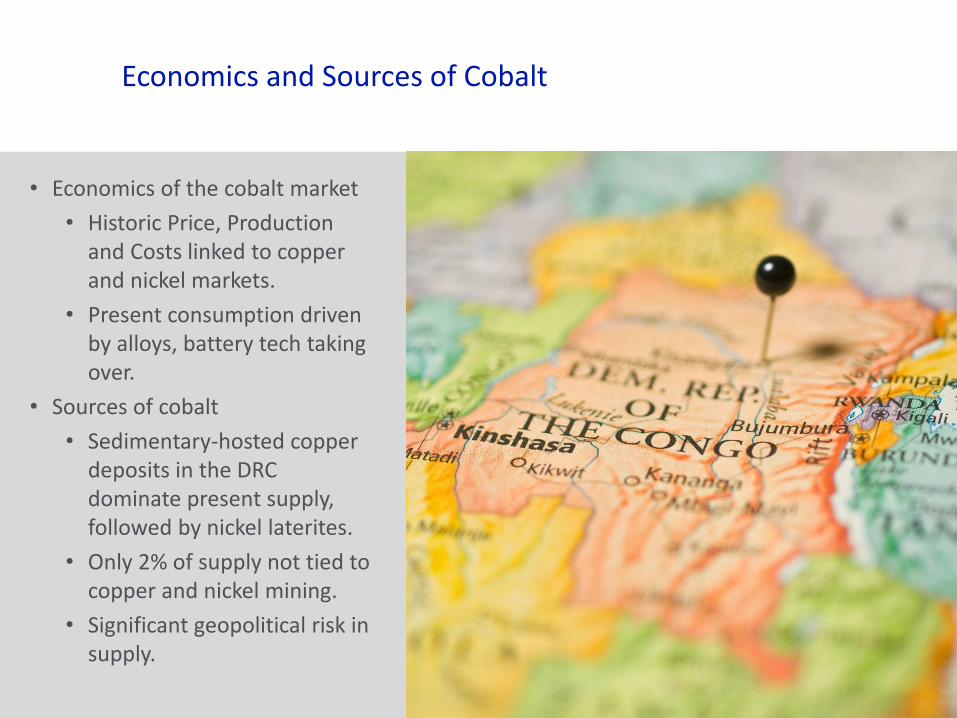
• Economics of the cobalt market
• Historic Price, Production and Costs linked to copper and nickel markets.
• Present consumption driven by alloys, battery tech taking over.
• Sources of cobalt
• Sedimentary-hosted copper deposits in the DRC dominate present supply, followed by nickel laterites.
• Only 2% of supply not tied to copper and nickel mining.
• Significant geopolitical risk in supply.
Economics and Sources of Cobalt
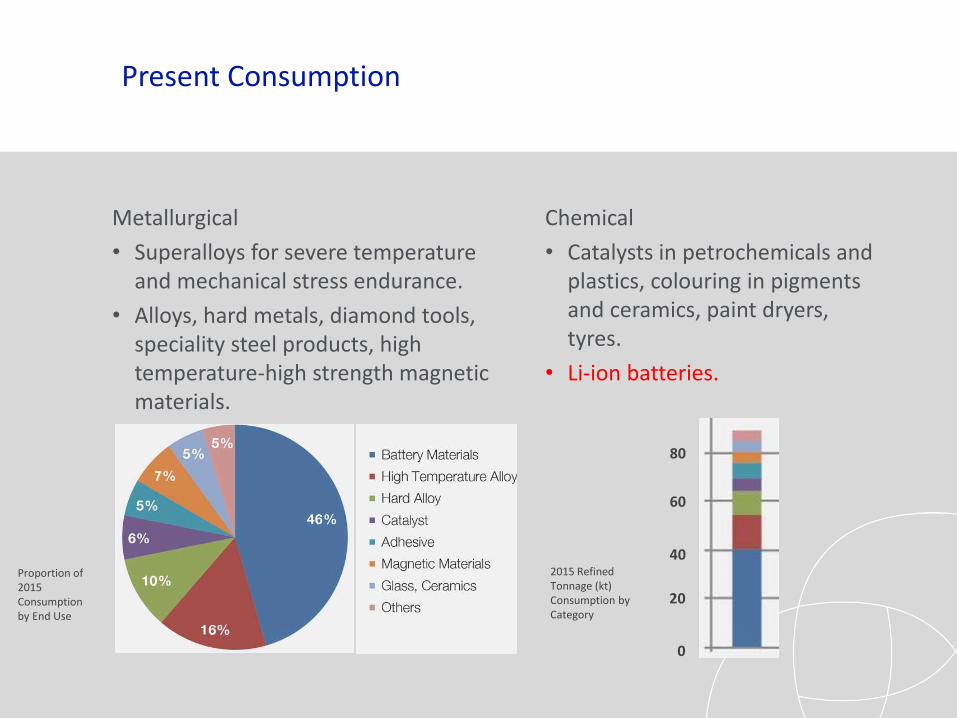
Present Consumption
Metallurgical
• Superalloys for severe temperature and mechanical stress endurance.
• Alloys, hard metals, diamond tools, speciality steel products, high temperature-high strength magnetic materials.
Chemical
• Catalysts in petrochemicals and plastics, colouring in pigments and ceramics, paint dryers, tyres.
• Li-ion batteries.
80
60
40
20
0
2015 Refined Tonnage (kt)Consumption by Category
Proportion of 2015Consumption by End Use
Present Supply
Primary Cobalt Mining
Source: USGSTotal 123,000 tonnes
Source: CRU
Nickel Mining By-product
Copper Mining By-product
• 98% of 2016 global cobalt mine production was derived as a secondary by-product from either nickel or copper mining
• 54% of 2016 global cobalt mine production was derived from copper mining in the DRC, 65% from mining in Africa
Copper Mining By-product
Nickel Mining By-product
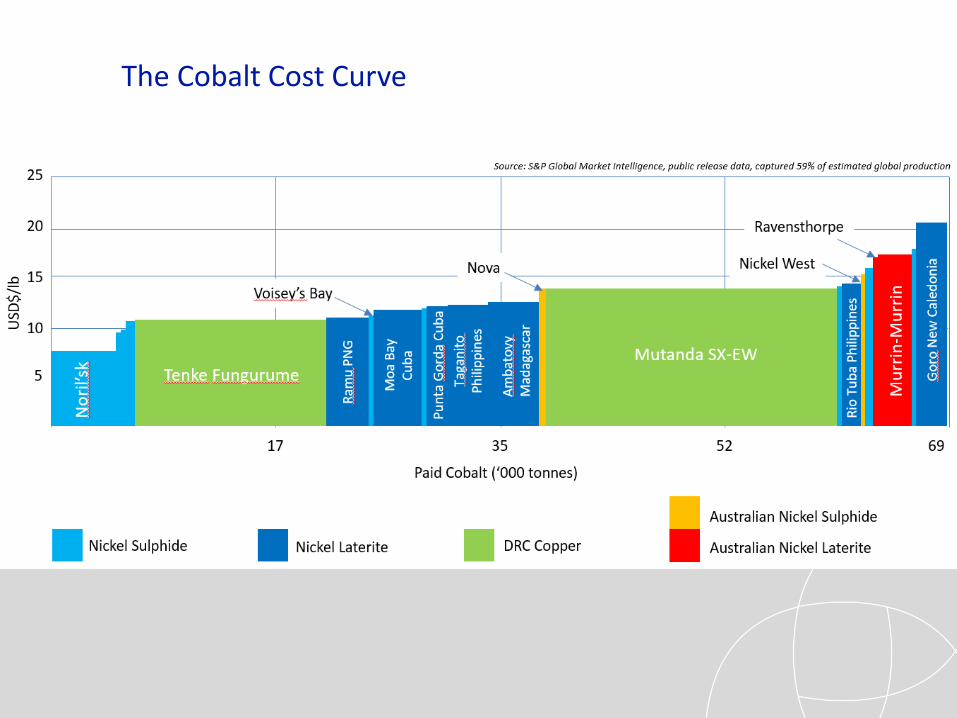
The Cobalt Cost Curve
• Historically, cobalt supply and price has been dictated by factors unrelated to cobalt demand, largely by copper and nickel economics.
• Recoveries not tuned to maximise efficiency in cobalt extraction.
• Only 2% of 2016 production from primary cobalt operations.
• Small volume of total market, unable to influence supply/demand.
• Heavily dependent on mine production in regions prone to conflict and high geopolitical risk.
• 58% of current production sourced from the DRC and Zambia.
• Significant production from jurisdictions such as Philippines, Cuba, Africa.
• Growing list of end consumers declaring they will not source cobalt from conflict zones or from artisanal mining.
• High concentration of refined cobalt sourced from one country.
• 50% of refined cobalt supply is produced in China (Source: USGS).
Present Supply - Constraints
Present Market
Pre-2016. Supply surplus due tonickel and copper projects coming online
Pre-2016Predominantly lag response to Ni and Cu production
Post-2016Decoupling from Ni and CuEmergence of EV, Li-ion battery demand
LME Daily Price $AUD
Annual Refined Production vs Demand
Source: S&P Global Market IntelligenceSource: USGS
• Innovation has brought technology within bounds of market expectations.
• Growing number of jurisdictions planning legislation for minimum number of electric vehicles in response to pollution control issues.
• Growing number of vehicle manufacturers planning to phase out internal combustion engine production in favour of EV’s and hybrids.
Cobalt Demand – Electric Vehicles
EV Penetration accelerating thanks to continuous improvement in technology and cost reduction.
• Battery energy density to increase 50% by 2020
• Better charging speeds
• 300+ mile range, increasing
• Battery manufacturing costs down 80%, continual economies of scale will decrease further.
Cobalt Demand – EV Penetration
Source: Exane BNP Paribas
Cobalt an essential major component in required battery technology to make all this happen.
Cobalt Demand – Battery Technology
Source: The Alchemist
Source: Australian Mines
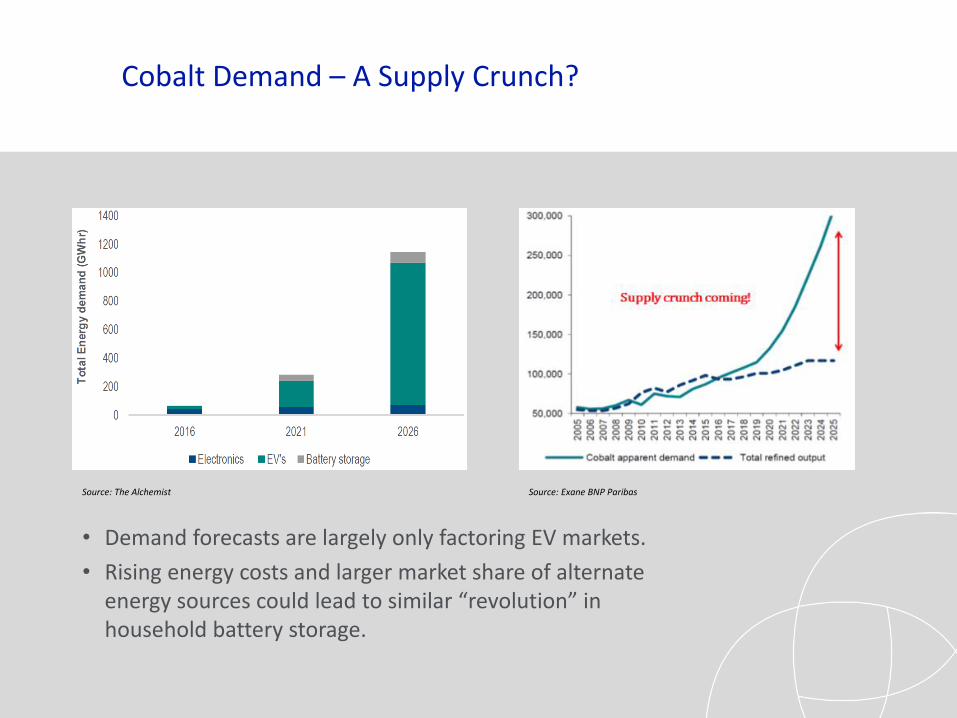
• Demand forecasts are largely only factoring EV markets.
• Rising energy costs and larger market share of alternate energy sources could lead to similar “revolution” in household battery storage.
Cobalt Demand – A Supply Crunch?
Source: The Alchemist Source: Exane BNP Paribas
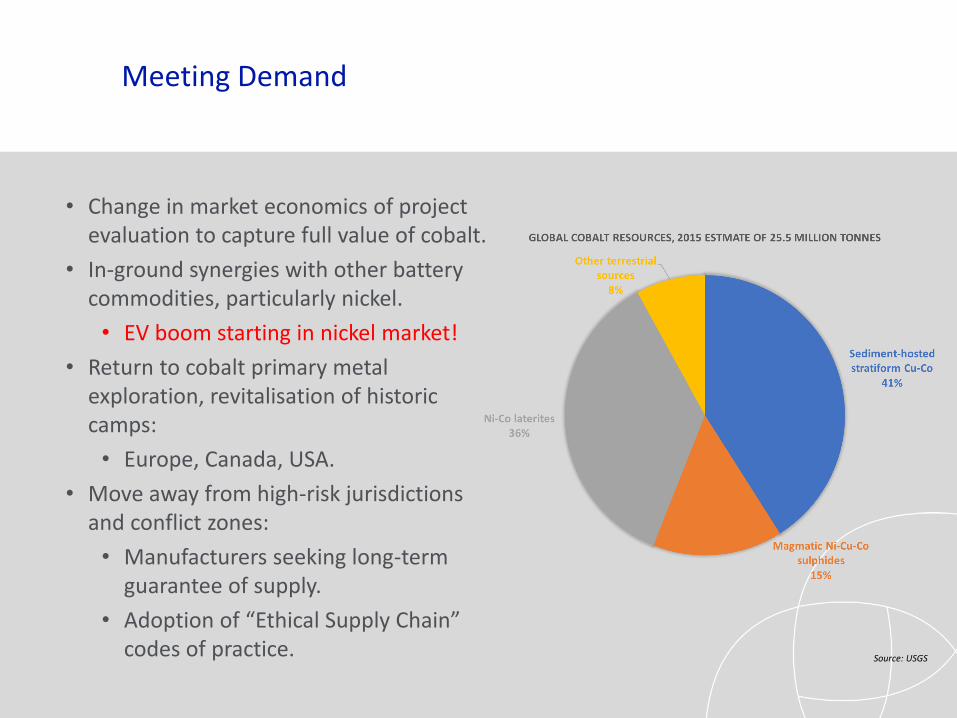
• Change in market economics of project evaluation to capture full value of cobalt.
• In-ground synergies with other battery commodities, particularly nickel.
• EV boom starting in nickel market!
• Return to cobalt primary metal exploration, revitalisation of historic camps:
• Europe, Canada, USA.
• Move away from high-risk jurisdictions and conflict zones:
• Manufacturers seeking long-term guarantee of supply.
• Adoption of “Ethical Supply Chain” codes of practice.
Meeting Demand
Source: USGS
Approved projects –further concentration of proportion of supply from DRC into 2022.
• Over 75% of global supply in 2022
• Concentration of supply risk
Meeting Demand – DRC still the King…
DRC
Rest of the World
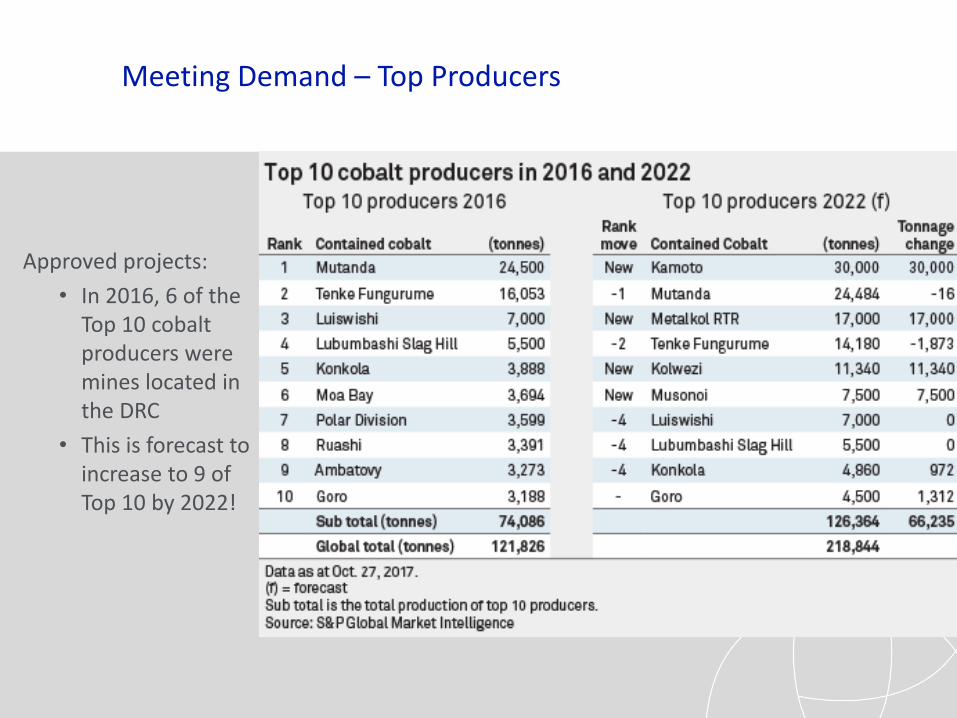
Approved projects:
• In 2016, 6 of the Top 10 cobalt producers were mines located in the DRC
• This is forecast to increase to 9 of Top 10 by 2022!
Meeting Demand – Top Producers
Not all “Resources” become Reserves.
Advanced projects (not yet in production) with cobalt as a primary target or by-product.
Meeting Demand – The Project Pipeline
Source: S&P Global Market Intelligence
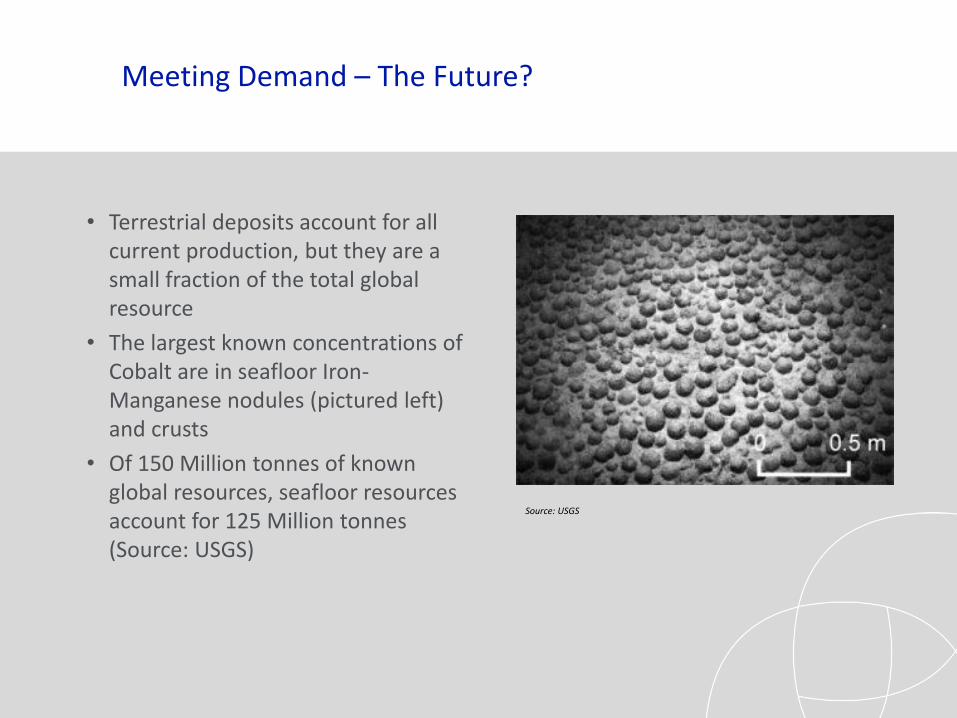
Meeting Demand – The Future?
Source: USGS
• Terrestrial deposits account for all current production, but they are a small fraction of the total global resource
• The largest known concentrations of Cobalt are in seafloor Iron-Manganese nodules (pictured left) and crusts
• Of 150 Million tonnes of known global resources, seafloor resources account for 125 Million tonnes (Source: USGS)
Potential downside factors include:
• Cobalt prices go too high forcing end-users to identify ‘substitutes’ that are more readily available
• Instability in the DRC causing end-users to source alternatives to reduce the supply risk
• A major shift in battery technology, particularly the EV sector, reducing the need for cobalt
• Improvement in associated commodity prices, particularly nickel, leading to a cobalt oversupply
• Cheap oil and gas.
Downside Factors
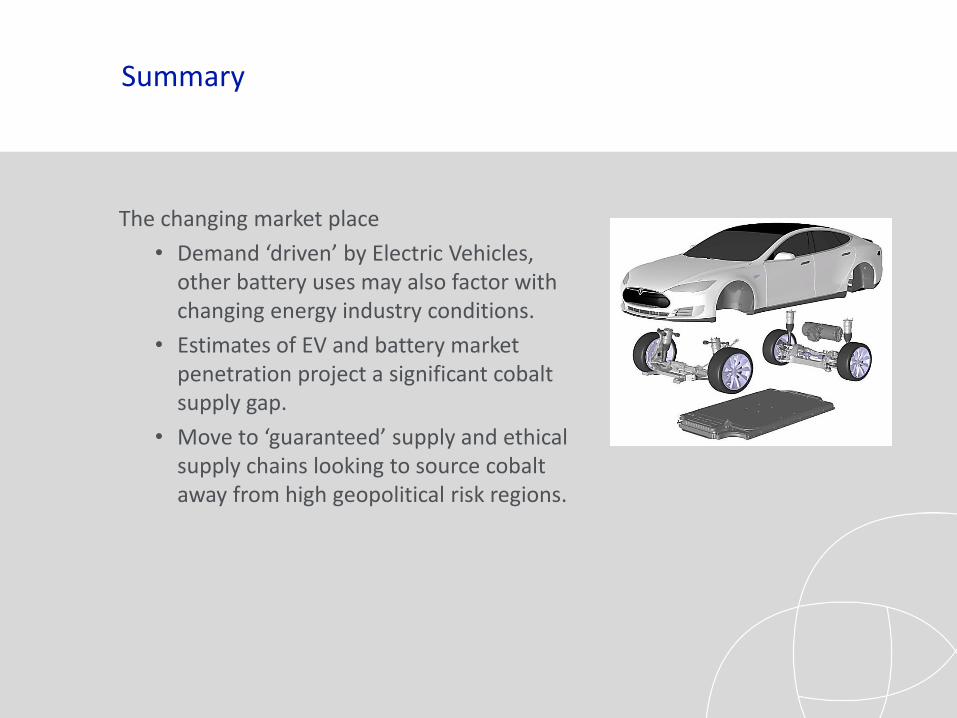
The changing market place
• Demand ‘driven’ by Electric Vehicles, other battery uses may also factor with changing energy industry conditions.
• Estimates of EV and battery market penetration project a significant cobalt supply gap.
• Move to ‘guaranteed’ supply and ethical supply chains looking to source cobalt away from high geopolitical risk regions.
Summary
• Potential new sources
• Future supply likely to still be dominated by copper and nickel orebody development
• However:
• Growing exploration base looking for primary cobalt deposits.
• Movement back into historic primary cobalt regions with low geopolitical risk – Canada, USA, Europe, Australia.
• Changing project evaluation economics to try and fully capture cobalt value.
• Synergies exist between cobalt and other battery metals, particularly nickel.
• More sources needed in low geopolitical risk jurisdictions to meet projected “ethical” and guaranteed supply demand.
• Perhaps the seafloor?
Summary
About CSA Global
CSA Global is a leading mining, geological, technology and management
consulting company which provides high quality solutions to our clients
in the global minerals industry
Our team include mining engineers, geologists project managers, data
and information technology management professionals and various
support personnel.
EXPLORATION RESOURCES MINING TECHNOLOGY CORPORATE
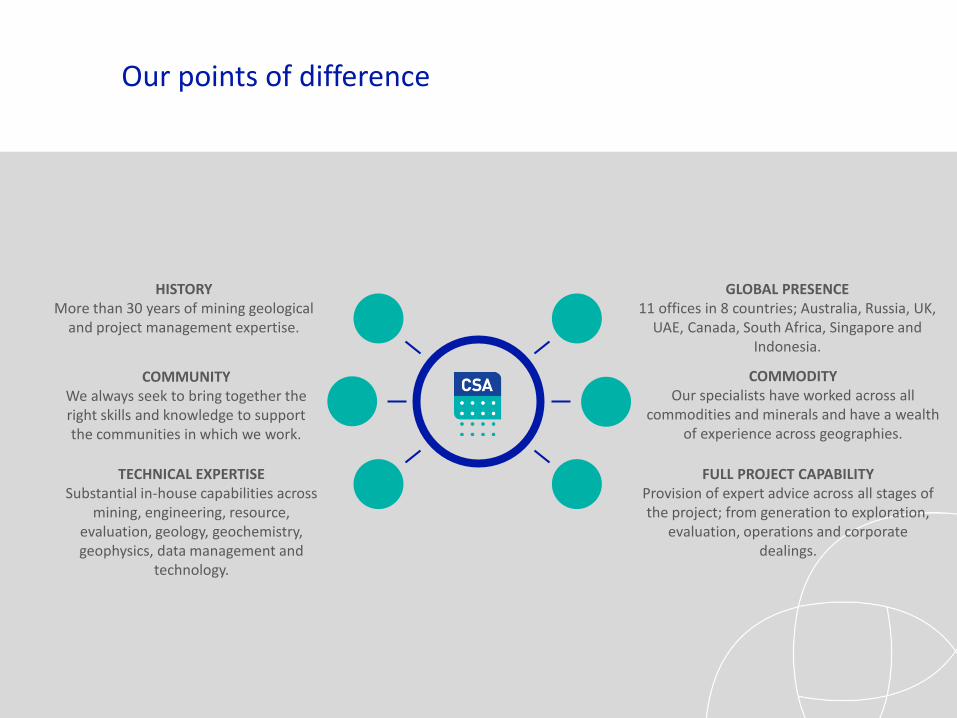
Our points of difference
HISTORYMore than 30 years of mining geological
and project management expertise.
COMMUNITYWe always seek to bring together the right skills and knowledge to support the communities in which we work.
TECHNICAL EXPERTISESubstantial in-house capabilities across
mining, engineering, resource, evaluation, geology, geochemistry, geophysics, data management and
technology.
GLOBAL PRESENCE11 offices in 8 countries; Australia, Russia, UK,
UAE, Canada, South Africa, Singapore and Indonesia.
FULL PROJECT CAPABILITYProvision of expert advice across all stages of the project; from generation to exploration,
evaluation, operations and corporate dealings.
COMMODITYOur specialists have worked across all
commodities and minerals and have a wealth of experience across geographies.
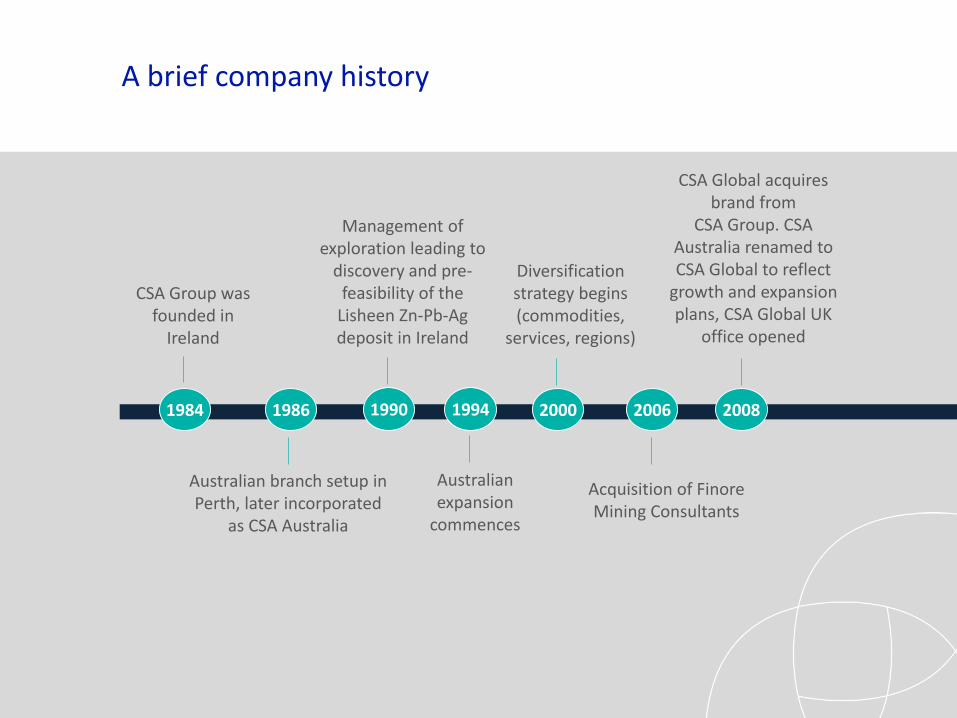
A brief company history
CSA Group was founded in
Ireland
1984 1986
Australian branch setup in Perth, later incorporated
as CSA Australia
Diversification strategy begins (commodities,
services, regions)
2000 2006
Acquisition of FinoreMining Consultants
CSA Global acquires brand from
CSA Group. CSA Australia renamed to CSA Global to reflect
growth and expansion plans, CSA Global UK
office opened
20081990
Management of exploration leading to
discovery and pre-feasibility of the
Lisheen Zn-Pb-Ag deposit in Ireland
1994
Australian expansion
commences
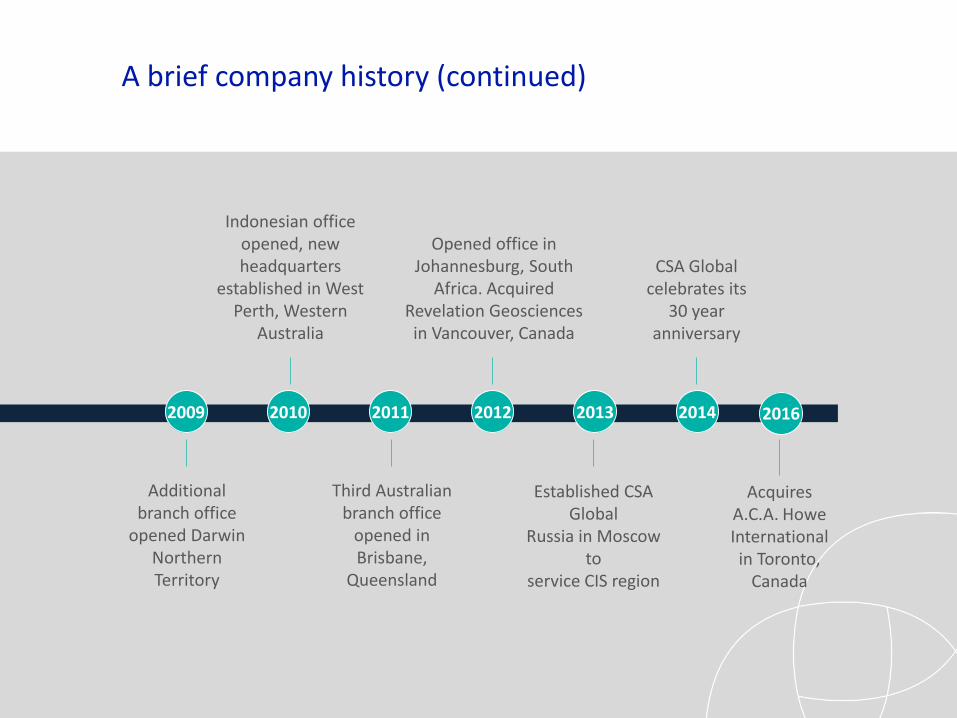
A brief company history (continued)
Additional branch office
opened Darwin Northern Territory
2009 2010
Indonesian office opened, new headquarters
established in West Perth, Western
Australia
Third Australian branch office
opened in Brisbane,
Queensland
2011 2012
Opened office in Johannesburg, South
Africa. Acquired Revelation Geosciences in Vancouver, Canada
Established CSA Global
Russia in Moscow to
service CIS region
20142013
CSA Global celebrates its
30 year anniversary
2016
Acquires A.C.A. Howe International in Toronto,
Canada
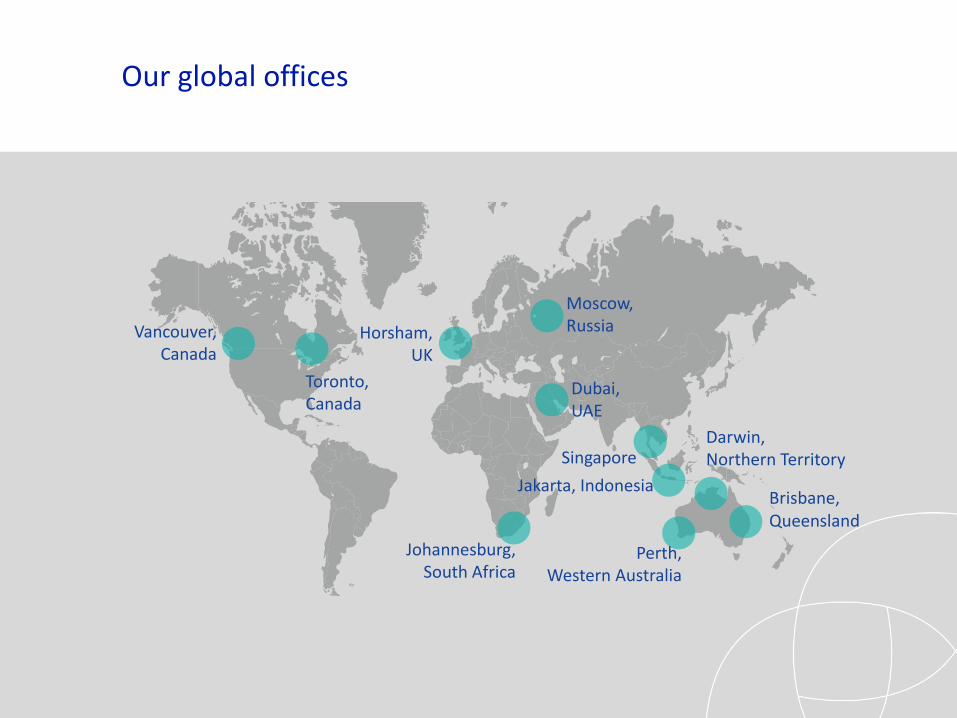
Our global offices
Perth, Western Australia
Johannesburg,South Africa
Brisbane,Queensland
Darwin, Northern Territory
Jakarta, Indonesia
Singapore
Dubai, UAE
Moscow, RussiaHorsham,
UK
Toronto, Canada
Vancouver, Canada
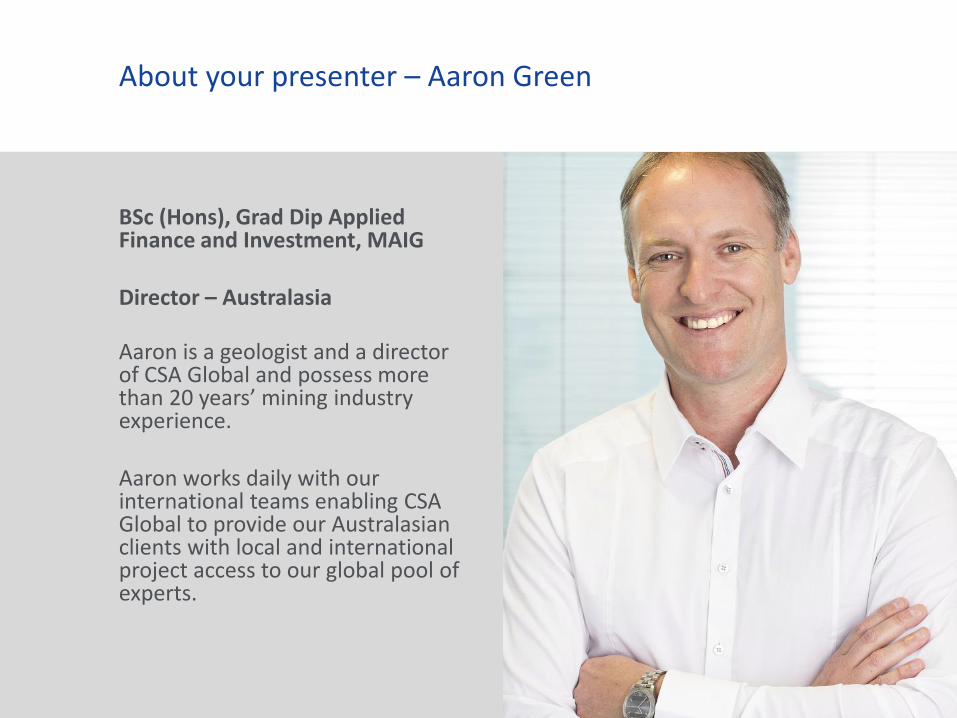
BSc (Hons), Grad Dip Applied Finance and Investment, MAIG
Director – Australasia
Aaron is a geologist and a director of CSA Global and possess more than 20 years’ mining industry experience.
Aaron works daily with our international teams enabling CSA Global to provide our Australasian clients with local and international project access to our global pool of experts.