SECTION 5.4.1: RISK ASSESSMENT – FLOOD DMA 2000 Hazard Mitigation Plan Update – Broome County, New York 5.4.1-1 February 2013 One hundred-year floodplains (or 1% annual chance floodplain) can be described as a bag of 100 marbles, with 99 clear marbles and one black marble. Every time a marble is pulled out from the bag, and it is the black marble, it represents a 100-year flood event. The marble is then placed back into the bag and shaken up again before another marble is drawn. It is possible that the black marble can be picked one out of two or three times in a row, demonstrating that a 100-year flood event could occur several times in a row (Interagency Floodplain Management Review Committee, 1994). 5.4.1 FLOOD This section provides a profile and vulnerability assessment for the flood hazard. HAZARD PROFILE This section provides profile information including description, location, extent, previous occurrences and losses and the probability of future occurrences. Description Floods are one of the most common natural hazards in the U.S. They can develop slowly over a period of days or develop quickly, with disastrous effects that can be local (impacting a neighborhood or community) or regional (affecting entire river basins, coastlines and multiple counties or states) (Federal Emergency Management Agency [FEMA], 2010). Most communities in the U.S. have experienced some kind of flooding, after spring rains, heavy thunderstorms, coastal storms, or winter snow thaws (George Washington University, 2001). Floods are the most frequent and costly natural hazards in New York State in terms of human hardship and economic loss, particularly to communities that lie within flood prone areas or flood plains of a major water source. As defined in the NYS HMP, flooding is a general and temporary condition of partial or complete inundation on normally dry land from the following: Riverine flooding, including overflow from a river channel, flash floods, alluvial fan floods, dam- break floods and ice jam floods; Local drainage or high groundwater levels; Fluctuating lake levels; Coastal flooding; Coastal erosion (NYS HMP 2011) Unusual and rapid accumulation or runoff of surface waters from any source; Mudflows (or mudslides); Collapse or subsidence of land along the shore of a lake or similar body of water caused by erosion, waves or currents of water exceeding anticipated cyclical levels that result in a flood as defined above (Floodsmart.gov, 2012); Sea Level Rise; or Climate Change (USEPA, 2012). A floodplain is defined as the land adjoining the channel of a river, stream, ocean, lake, or other watercourse or water body that becomes inundated with water during a flood. Most often floodplains are referred to as 100-year floodplains. A 100-year floodplain is not the flood that will occur once every 100 years, rather it is the flood that has a one-percent chance of being equaled or exceeded each year. Thus, the 100-year flood could occur more than once in a relatively short period of time. With this term being misleading, FEMA has properly defined it as the one-percent annual chance flood. This one percent annual chance flood is now the standard used by most Federal and State agencies and by the National Flood Insurance Program (NFIP) (FEMA,
Transcript
SECTION 5.4.1: RISK ASSESSMENT – FLOOD
DMA 2000 Hazard Mitigation Plan Update – Broome County, New York 5.4.1-1February 2013
One hundred-year floodplains (or 1%annual chance floodplain) can bedescribed as a bag of 100 marbles, with99 clear marbles and one black marble.Every time a marble is pulled out from thebag, and it is the black marble, itrepresents a 100-year flood event. Themarble is then placed back into the bagand shaken up again before anothermarble is drawn. It is possible that theblack marble can be picked one out of twoor three times in a row, demonstrating thata 100-year flood event could occur severaltimes in a row (Interagency FloodplainManagement Review Committee, 1994).
5.4.1 FLOOD
This section provides a profile and vulnerability assessment for the flood hazard.
HAZARD PROFILE
This section provides profile information including description, location, extent, previous occurrences andlosses and the probability of future occurrences.
Description
Floods are one of the most common natural hazards in the U.S. They can develop slowly over a period ofdays or develop quickly, with disastrous effects that can be local (impacting a neighborhood orcommunity) or regional (affecting entire river basins, coastlines and multiple counties or states) (FederalEmergency Management Agency [FEMA], 2010). Most communities in the U.S. have experienced somekind of flooding, after spring rains, heavy thunderstorms, coastal storms, or winter snow thaws (GeorgeWashington University, 2001). Floods are the most frequent and costly natural hazards in New YorkState in terms of human hardship and economic loss, particularly to communities that lie within floodprone areas or flood plains of a major water source. As defined in the NYS HMP, flooding is a generaland temporary condition of partial or complete inundation on normally dry land from the following:
Riverine flooding, including overflow from a river channel, flash floods, alluvial fan floods, dam-break floods and ice jam floods;
Local drainage or high groundwater levels; Fluctuating lake levels; Coastal flooding; Coastal erosion (NYS HMP 2011)
Unusual and rapid accumulation or runoff of surface waters from any source;
Mudflows (or mudslides);
Collapse or subsidence of land along the shore of a lake or similar body of water caused byerosion, waves or currents of water exceeding anticipated cyclical levels that result in a flood asdefined above (Floodsmart.gov, 2012);
Sea Level Rise; or
Climate Change (USEPA, 2012).
A floodplain is defined as the land adjoining the channel of ariver, stream, ocean, lake, or other watercourse or water bodythat becomes inundated with water during a flood. Mostoften floodplains are referred to as 100-year floodplains. A100-year floodplain is not the flood that will occur onceevery 100 years, rather it is the flood that has a one-percentchance of being equaled or exceeded each year. Thus, the100-year flood could occur more than once in a relativelyshort period of time. With this term being misleading,FEMA has properly defined it as the one-percent annualchance flood. This one percent annual chance flood is nowthe standard used by most Federal and State agencies and bythe National Flood Insurance Program (NFIP) (FEMA,
SECTION 5.4.1: RISK ASSESSMENT – FLOOD
DMA 2000 Hazard Mitigation Plan Update – Broome County, New York 5.4.1-2February 2013
2003).
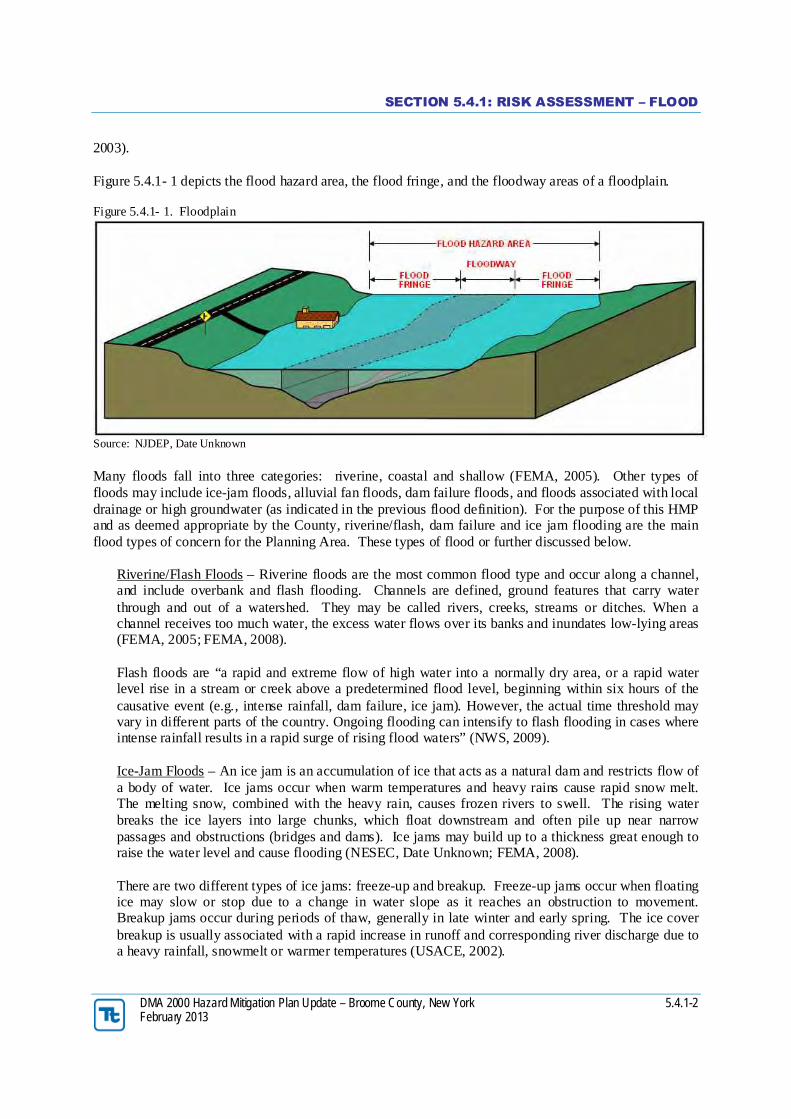
Figure 5.4.1- 1 depicts the flood hazard area, the flood fringe, and the floodway areas of a floodplain.
Figure 5.4.1- 1. Floodplain
Source: NJDEP, Date Unknown
Many floods fall into three categories: riverine, coastal and shallow (FEMA, 2005). Other types offloods may include ice-jam floods, alluvial fan floods, dam failure floods, and floods associated with localdrainage or high groundwater (as indicated in the previous flood definition). For the purpose of this HMPand as deemed appropriate by the County, riverine/flash, dam failure and ice jam flooding are the mainflood types of concern for the Planning Area. These types of flood or further discussed below.
Riverine/Flash Floods – Riverine floods are the most common flood type and occur along a channel,and include overbank and flash flooding. Channels are defined, ground features that carry waterthrough and out of a watershed. They may be called rivers, creeks, streams or ditches. When achannel receives too much water, the excess water flows over its banks and inundates low-lying areas(FEMA, 2005; FEMA, 2008).
Flash floods are “a rapid and extreme flow of high water into a normally dry area, or a rapid waterlevel rise in a stream or creek above a predetermined flood level, beginning within six hours of thecausative event (e.g., intense rainfall, dam failure, ice jam). However, the actual time threshold mayvary in different parts of the country. Ongoing flooding can intensify to flash flooding in cases whereintense rainfall results in a rapid surge of rising flood waters” (NWS, 2009).
Ice-Jam Floods – An ice jam is an accumulation of ice that acts as a natural dam and restricts flow ofa body of water. Ice jams occur when warm temperatures and heavy rains cause rapid snow melt.The melting snow, combined with the heavy rain, causes frozen rivers to swell. The rising waterbreaks the ice layers into large chunks, which float downstream and often pile up near narrowpassages and obstructions (bridges and dams). Ice jams may build up to a thickness great enough toraise the water level and cause flooding (NESEC, Date Unknown; FEMA, 2008).
There are two different types of ice jams: freeze-up and breakup. Freeze-up jams occur when floatingice may slow or stop due to a change in water slope as it reaches an obstruction to movement.Breakup jams occur during periods of thaw, generally in late winter and early spring. The ice coverbreakup is usually associated with a rapid increase in runoff and corresponding river discharge due toa heavy rainfall, snowmelt or warmer temperatures (USACE, 2002).
SECTION 5.4.1: RISK ASSESSMENT – FLOOD
DMA 2000 Hazard Mitigation Plan Update – Broome County, New York 5.4.1-3February 2013
Dam Failure Floods – A dam is an artificial barrier that has the ability to impound water, wastewater,or any liquid-borne material for the purpose of storage or control of water (FEMA, 2010). Dams areman-made structures built across a stream or river that impound water and reduce the flowdownstream (FEMA, 2003). They are built for the purpose of power production, agriculture, watersupply, recreation, and flood protection. Dam failure is any malfunction or abnormality outside of thedesign that adversely affect a dam’s primary function of impounding water (FEMA, 2011). Dams canfail for one or a combination of the following reasons:
Overtopping caused by floods that exceed the capacity of the dam (inadequate spillway capacity);
Prolonged periods of rainfall and flooding;
Deliberate acts of sabotage (terrorism);
Structural failure of materials used in dam construction;
Movement and/or failure of the foundation supporting the dam;
Settlement and cracking of concrete or embankment dams;
Piping and internal erosion of soil in embankment dams;
Inadequate or negligent operation, maintenance and upkeep;
The Broome County Planning Committee indicated that ground failure due to saturated soils is also aconcern in the County. Historic areas of concern include Route 88 embankment failure between Exits 2and 3 and Airport Road Exit (Route 71) embankment failure next to Route 17 (Broome County Meeting,2012).
Extent
In the case of riverine or flash flooding, once a river reaches flood stage, the flood extent or severitycategories used by the NWS include minor flooding, moderate flooding, and major flooding. Eachcategory has a definition based on property damage and public threat:
Minor Flooding - minimal or no property damage, but possibly some public threat orinconvenience.
Moderate Flooding - some inundation of structures and roads near streams. Some evacuations ofpeople and/or transfer of property to higher elevations are necessary.
Major Flooding - extensive inundation of structures and roads. Significant evacuations of peopleand/or transfer of property to higher elevations (NWS, 2011).
The severity of a flood depends not only on the amount of water that accumulates in a period of time, butalso on the land's ability to manage this water. One element is the size of rivers and streams in an area;but an equally important factor is the land's absorbency. When it rains, soil acts as a sponge. When theland is saturated or frozen, infiltration into the ground slows and any more water that accumulates mustflow as runoff (Harris, 2001).
Flood severity from a dam failure can be measured with a low, medium or high severity, which are furtherdefined as follows:
SECTION 5.4.1: RISK ASSESSMENT – FLOOD
DMA 2000 Hazard Mitigation Plan Update – Broome County, New York 5.4.1-4February 2013
Low severity - No buildings are washed off their foundations; structures are exposed to depths ofless than 10 feet.
Medium severity - Homes are destroyed but trees or mangled homes remain for people to seekrefuge in or on; structures are exposed to depths of more than 10 feet.
High severity - Floodwaters sweep the area clean and nothing remains. Locations are flooded bythe near instantaneous failure of a concrete dam, or an earthfill dam that turns into "jello" andwashes out in seconds rather than minutes or hours. In addition, the flooding caused by the damfailure sweeps the area clean and little or no evidence of the prior human habitation remains afterthe floodwater recedes (Graham, 1999).
Two factors which influence the potential severity of a full or partial dam failure include (1) The amountof water impounded; and (2) The density, type, and value of development and infrastructure locateddownstream (City of Sacramento Development Service Department, 2005).
Location
Flooding is the primary natural hazard in New York State because the State exhibits a unique blend ofclimatological and meteorological features that influence the potential for flooding. These factors includetopography, elevations, latitude and water bodies and waterways. Flooding is the primary natural hazardin New York State and they occur in every part of the State. Some areas are more flood prone thanothers, but no area is exempt, including Broome County.
The NYSDEC conducted a vulnerability assessment that depicted how vulnerable a county may be toflood hazards. This was determined by a rating score; each county accumulated points based on the valueof each vulnerability indicator. The higher the indication for flood exposure, the more points assigned,resulting in a final rating score. The result of this assessment presented an indication of a county’svulnerability to the flood hazard. Broome County’s rating is 28, out of a possible 35. The County’sranking makes it the 6th most vulnerable to the flood hazard in New York State. The rating was based onnumber of NFIP insurance policies, number of NFIP claims, total amount of NFIP claims, total amount ofNFIP policy coverage, number of repetitive flood loss properties, and number of flood disasters (NYSHMP 2011).
Riverine flooding problems are most severe in the Delaware, Susquehanna, Chemung, Erie-Niagara,Genesse, Allegany, Hudson and Mohawk River Basins (NYS HMP 2011). Broome County is part of theDelaware and Susquehanna River Basins (NYSDEC, Date Unknown). Please refer to Section 4 (CountyProfile) for detailed information regarding the river basins and the hydrography/hydrology of the County.
Water Resources
Water resources have shaped settlement patterns in the region well before the inception of BroomeCounty. Native Americans settled along the Susquehanna, Chenango, Tioughnioga, Otselic, andDelaware Rivers, and utilized the resources for food, travel and navigation. After the AmericanRevolution, the land at the confluence of the Susquehanna and Chenango was given to William Bingham,who, along with Joshua Whitney, envisioned a new village at the confluence. The river systems wouldprovide transportation and a corridor for economic development. This land and surrounding area laterbecame Broome County (Broome County Comprehensive Plan, 2012).
With the establishment of the railroad system, the Rivers became less as a means of transportation but stillprovided a valuable service. Today, Broome County depends on surface water and ground water fordrinking water, recreation, industry, and agriculture. Water resources and their natural features provide
SECTION 5.4.1: RISK ASSESSMENT – FLOOD
DMA 2000 Hazard Mitigation Plan Update – Broome County, New York 5.4.1-5February 2013
significant services include: public water supply, groundwater recharge, sediment and erosion control,flood protection, scenic enhancement, recreation, and agricultural productivity (Broome CountyComprehensive Plan, 2012).
Development decisions can significantly minimize adverse impacts on water quality from land usepractices and development. This is important in areas that have high water resource value includingfloodplains, stream buffers, wetlands and their buffers, groundwater recharge areas, lake shores, drinkingwater sources and headwater areas (Broome County Comprehensive Plan, 2012).
Streams
Stream buffers of at least 100 feet are recommended to provide adequate stream protection.Approximately 16.8 square miles of Broome County are encompassed in the zone within 100 feet ofmajor streams. In addition, maintain vegetated buffers around lake shores can help maintain the waterquality of these systems (Broome County Comprehensive Plan, 2012).
Aquifers
Approximately 80% of Broome County’s water for public use comes from groundwater sources. Thereare several aquifers located beneath the Susquehanna and Chenango Rivers and their surroundingfloodplains. These are referred to as unconsolidated aquifers, characterized as having frequentdischarge/recharge with the streams that lie above them. Bedrock aquifers are common in the rural partsof the County, which are hydrologically isolated from large streams and hold water in bedrock fractures(Broome County Comprehensive Plan, 2012).
Aquifers are classified based on importance as a public water supply, productivity, and vulnerability topollution. Johnson City, Endwell, Endicott and Vestal are all dependent on primary aquifers. There arealso a number of principal aquifers which are classified as highly productive; however, used by a lowerpercentage of the County’s population (Broome County Comprehensive Plan, 2012).
All of Broome County that is located within the Susquehanna River watershed is federally designated bythe U.S. EPA as a sole source aquifer (Clinton Street-Ballpark Aquifer System). Sole source aquiferssupply 50% or more of the area’s drinking water. If it is contaminated, it would create a significanthazard to public health and could not be replaced by another water source (Broome CountyComprehensive Plan, 2012).
Floodplains
Flooding has historically been a significant threat to properties in Broome County. FEMA updated thefloodplain maps of the County and according to these new maps, approximately 26 square miles of theCounty lie within the Special Flood Hazard Area (SFHA). Approximately 3.7 square miles is locatedwithin the 500-year floodplains. This includes several urbanized areas, which makes flooding a primaryconcern for the County (Broome County Comprehensive Plan, 2012).
Wetlands
Wetlands are periodically or permanently flooded areas that support plant and animal species adapted tolive in those conditions. Wetlands include swamps, blogs, marshes and ponds. They function to trap andslowly release surface water, providing natural flood control. Wetlands and their buffers are alsoimportant to protect water quality and hydrology. Any development impacting wetlands requires a permitfrom the state or federal government (Broome County Comprehensive Plan, 2012).
SECTION 5.4.1: RISK ASSESSMENT – FLOOD
DMA 2000 Hazard Mitigation Plan Update – Broome County, New York 5.4.1-6February 2013
In Broome County, there are approximately 2,190 acres of state designated wetlands. New York Stateprotects all wetlands at least 12.4 acres in size. Smaller wetlands may be protected by the State if deemedlocally unusual or important. The U.S. Army Corps of Engineers has the authority to protect wetlandsthat are larger than one acre. There are approximately 21.25 square miles (13,600 acres) listed on theNational Wetland Inventory, protected by the federal government, that includes the Susquehanna,Chenango, and Tioughnioga Rivers, which encompass 3,700 acres (Broome County Comprehensive Plan,2012).
Management Issues
Flood
Flooding creates a hazard to Broome County’s municipalities. The Susquehanna River is one of the mostflood-prone regions in the U.S. Higher gradient streams in the lower basin and highly erodible soils resultin frequent flash flooding and excessive erosion. Recently, the County has been subject to multiple majorflood events, which have received FEMA disaster declarations (June 2006 and September 2011).Flooding due to high river levels is not the only concern in the County, there have also been impactsrelated to poor drainage and flash flooding, with a significant event occurring November 2006 thatreceived a FEMA disaster declaration as well (Broome County Comprehensive Plan, 2012).
Flooding events have had devastating impacts on the County’s communities. This includes displacementof residents and businesses and the endangerment of public health and safety. There are long termimpacts that include economic hardships for residents, businesses and local municipalities, damage tolocal infrastructure and negative impacts on local economies. Environmental impacts include disruptedwastewater treatment for treatment plants and private septic systems, as well as the threat of chemicalsand other pollutants washed away from flooded commercial and industrial properties (Broome CountyComprehensive Plan, 2012).
There is a significant system of publically-owned flood control structures that are operated andmaintained by Broome County. There are also several federally-owned flood control structures located inthe City of Binghamton, the Towns of Union and Vestal, and the Villages of Endicott, Johnson City,Lisle, Port Dickinson, and Whitney Point. These structures were built by the U.S. Army Corps ofEngineers and maintained by the NYSDEC. Broome County owns and maintains 24 flood controlstructures that are referred to as watersheds (Broome County Comprehensive Plan, 2012).
The local communities of Broome County have incorporated floodplain ordinances into their local codes.These ensure that development within floodplains are built to acceptable standards, minimizing impacts tothe structure or neighboring properties and discourage inappropriate land use in the floodplains. Localcommunities have also participated in the acquisition of properties substantially damaged during floodingevents. Development is prohibited on these properties, removing vulnerable structures and adding inflood mitigation (Broome County Comprehensive Plan, 2012).
Stormwater
Broome County has a history of poor drainage and flash flooding events which exacerbates floodingevents due to high river levels. Localized flooding and erosion problems lead to significant damage toinfrastructure and properties during less significant events. The leading causes of flooding and erosioninclude: improperly managed stormwater; rain and snow melt that run off surfaces such as rooftops,paved streets, highways and parking lots. This can lead to property damage, cause road safety hazards,and clog catch basins and culverts with sediment and debris. It addition, stormwater carries materials and
SECTION 5.4.1: RISK ASSESSMENT – FLOOD
DMA 2000 Hazard Mitigation Plan Update – Broome County, New York 5.4.1-7February 2013
pollutants from paved surfaces to the waterways, degrading the quality of drinking water, damaging plantand wildlife habitat, and making water resources unsuitable for consumption, recreation or other uses(Broome County Comprehensive Plan, 2012).
FEMA Flood Hazard Areas
According to FEMA, flood hazard areas are defined as areas that are shown to be inundated by a flood ofa given magnitude on a map. These areas are determined using statistical analyses of records ofriverflow, storm tides, and rainfall; information obtained through consultation with the community;floodplain topographic surveys; and hydrologic and hydraulic analyses. Flood hazard areas are delineatedon FEMA’s Flood Insurance Rate Maps (FIRM), which are official maps of a community on which theFederal Insurance and Mitigation Administration has indicated both the Special Flood Hazard Areas(SFHA) and the risk premium zones applicable to the community. These maps identify the SFHAs; thelocation of a specific property in relation to the SFHA; the base (100-year) flood elevation (BFE) at aspecific site; the magnitude of a flood hazard in a specific area; the undeveloped coastal barriers whereflood insurance is not available and locates regulatory floodways and floodplain boundaries (100-year and500-year floodplain boundaries) (FEMA, 2003; FEMA, 2005; FEMA, 2008).
The land area covered by the floodwaters of the base flood is the SFHA on a FIRM. It is the area wherethe National Flood Insurance Programs (NFIP) floodplain management regulations must be enforced andthe area where the mandatory purchase of flood insurance applies. The SFHA includes Zones A, AO,AH, A1-30, AE, A99, AR, AR/A1-30, AR/AE, AR/AO, AR/AH, AR/A, VO, V1-30, VE, and V. (FEMA,2007). This regulatory boundary is a convenient tool for assessing vulnerability and risk in flood-pronecommunities since many communities have maps showing the extent of the base flood and likely depthsthat will be experienced. The base flood is often referred to as the “100-year” flood designation (or 1%annual chance event). The BFE on a FIRM is the elevation of a base flood event, or a flood which has a1-percent chance of occurring in any given year as defined by the NFIP. The BFE describes the exactelevation of the water that will result from a given discharge level, which is one of the most importantfactors used in estimating the potential damage to occur in a given area. A structure located within a 1%(100-year) floodplain has a 26-percent chance of suffering flood damage during the term of a 30-yearmortgage. The 100-year flood is a regulatory standard used by Federal agencies and most states, toadminister floodplain management programs. The 1% (100-year) annual chance flood is used by theNFIP as the basis for insurance requirements nationwide. FIRMs also depict 500-year flood designations,which is a boundary of the flood that has a 0.2-percent chance of being equaled or exceeded in any givenyear (FEMA, 2003; FEMA, 2005).
It is important to recognize, however, that flood events and flood risk is not limited to the NFIPdelineated flood hazard areas. In fact, in Broome County, significant flood events have resulted indevastating impacts to structures and infrastructure outside of currently mapped floodplains. Developingand maintaining accurate flood risk maps is an ongoing process involving direct input from the impactedcommunities and the county, and such mapping will only ever be able to help identify areas of statisticallyhigher risk within the limits of current science and understanding of the myriad of factors (weather,topography, hydrology and hydraulics, development, etc.) that affect flooding the region. See Section 4(County Profile) for information regarding the SFHA updates within Broome County.
Flood Insurance Study (FIS)
In addition to FIRM and DFIRMs, FEMA also provides FISs for entire counties and individualjurisdictions. These studies aid in the administration of the National Flood Insurance Act of 1968 and theFlood Disaster Protection Act of 1973. They are narrative reports of countywide flood hazards, includingdescriptions of the flood areas studied and the engineered methods used, principal flood problems, flood
SECTION 5.4.1: RISK ASSESSMENT – FLOOD
DMA 2000 Hazard Mitigation Plan Update – Broome County, New York 5.4.1-8February 2013
protection measures and graphic profiles of the flood sources (FEMA, Date Unknown). A countywideFIS for Broome County has been completed; however, it is a preliminary document. The FIS states thatflooding may occur in Broome County during any season of the year, but it is most likely to occur in thelate winter-early spring months when melting snow may combine with intense rainfall to produceincreased runoff. During the winter, flooding has been a threat when ice and debris jam in the channeland at the bridges. Summer and fall floods occur due to hurricane and thunderstorm activity (FEMA FIS,2010).
The following discussion presents flood information as directly provided in the FEMA FIS document(s).The 2010 preliminary FIS discussed the principal flood problems in the County.
Village of Deposit – In the Village, flooding on several streams has caused damage. ButlerBrook floods almost each year, causing damage to residential, farm, and commercial propertiesalong the eastern side of the Village. Flooding from Big Hollow has also damaged the school andresidential properties. Oquaga Creek can flood residential and commercial properties in the areaof Borden Street. The West Branch of the Delaware River floods a relatively small area. Someagricultural flood damage above the Pine Street bridge occurs, as well as some residential andcommercial flood damage, between Pine Street and the Conrail embankment (FEMA FIS, 2010).
Most of the Bone Creek channel is now concrete-lined throughout the Village. In 1929, a floodon the Creek led to the subsequent construction of the concrete lined channel (FEMA FIS, 2010).
Village of Johnson City – Finch Hollow Creek and Little Choconut Creek are sources of minorflooding in the Village. Flooding on these creeks has basically the same causes as flooding on theSusquehanna River, but with the added effect of backwater from the Susquehanna River (FEMAFIS, 2010).
Town of Sanford – All streams in the Town have caused floodwater damage. The West Branchof the Delaware River floods infrequently; however, when it overflows, it floods a small areathroughout the length of the stream, except for a three-mile segment beginning approximately4,000 feet downstream of the Highway 17 bridge. The most severe flooding along Oquaga Creekoccurs in the Hamlet of McClure and at its confluence with Marsh Creek (FEMA FIS, 2010).
Ice Jam Hazard Areas
Ice jams are common in the Northeast U.S. and New York is not an exception. In fact, according to theUSACE, New York State ranks second in the U.S. for total number of ice jam events, with over 1,500incidents documented between 1867 and 2010. Areas of New York State that include characteristicslending to ice jam flooding include the northern counties of the Finger Lakes region and far western NewYork, the Mohawk Valley of central and eastern New York State, and the North Country (NYS HMP2011). Figure 5.4.1- 2 presents the number of ice jam incidences within the vicinity of Broome Countybetween 1875 and 2007.
SECTION 5.4.1: RISK ASSESSMENT – FLOOD
DMA 2000 Hazard Mitigation Plan Update – Broome County, New York 5.4.1-9February 2013
Figure 5.4.1- 2. Number of Ice Jam Incidents on New York State Rivers (1875 – 2007)
Source: NYS HMP, 2011Note (1): Circle indicates location of Broome CountyNote (2): This map displays the number of instances a river was referenced as being the location for an ice jam in the USACE
Cold Regions Research and Engineering Laboratory (CRREL) database.Note (3): Multiple instances of ice jams can be associated to a single point location.
The Ice Jam Database, maintained by the Ice Engineering Group at the USACE Cold Regions Researchand Engineering Laboratory (CRREL), currently consists of over 18,000 records from across the U.S.According to the USACE-CRREL, Broome County experienced 46 historic ice jam events between 1875and 2011 (Ice Engineering Research Group, 2012). Historical events are further mentioned in the“Previous Occurrences” section of this hazard profile.
Dam Break Hazard Area
According to the NYSDEC Division of Water Bureau of Flood Protection and Dam Safety, the hazardclassification of a dam is assigned according to the potential impacts of a dam failure pursuant to 6NYCRR Part 673.3. Dams are classified in terms of potential for downstream damage if the dam were tofail. These hazard classifications are identified and defined below:
Low Hazard (Class A) is a dam located in an area where failure will damage nothing more thanisolated buildings, undeveloped lands, or township or county roads and/or will cause nosignificant economic loss or serious environmental damage. Failure or mis-operation wouldresult in no probable loss of human life. Losses are principally limited to the owner's property
Intermediate Hazard (Class B) is a dam located in an area where failure may damage isolatedhomes, main highways, minor railroads, interrupt the use of relatively important public utilities,and/or will cause significant economic loss or serious environmental damage. Failure or mis-operation would result in no probable loss of human life, but can cause economic loss,environment damage, disruption of lifeline facilities, or impact other concerns. Significant hazardpotential classification dams are often located in predominantly rural or agricultural areas butcould be located in areas with population and significant infrastructure.
High Hazard (Class C) is a dam located in an area where failure may cause loss of human life,serious damage to homes, industrial or commercial buildings, important public utilities, main
SECTION 5.4.1: RISK ASSESSMENT – FLOOD
DMA 2000 Hazard Mitigation Plan Update – Broome County, New York 5.4.1-10February 2013
highways or railroads and/or will cause extensive economic loss. This is a downstream hazardclassification for dams in which more than 6 lives would be in jeopardy and excessive economicloss (urban area including extensive community, industry, agriculture, or outstanding naturalresources) would occur as a direct result of dam failure (NYSDEC, Date Unknown).
Refer to Table 4-23 and Figure 4-17 in the County Profile (Section 4) for dams located in BroomeCounty.
The County further notes that there are numerous dams that are below the threshold impoundment size formonitoring by NYSDEC, however such dams still pose significant risk and threat to the region that mustbe managed to protect public safety.
Additional documentation provided the following information regarding location of flooding in themunicipalities of Broome County:
Town of Conklin – The majority of flooding in the Town has occurred from riverine flooding ofthe Susquehanna River, and to a lesser extent, Snake Creek and Little Snake Creek. TheSusquehanna River in the Town is also subject to ice jams and subsequent flooding (Town ofConklin HMP, 2006).
Town of Fenton – There are several flood prone areas within the Town, including most landsalong the Chenango River and a large low-lying area between Port Crane and the Page BrookOutlet. There are also 100-year floodplains along Phelps Creek, Page Brook, and Osborne Creek(Town of Fenton Comprehensive Plan, 2007).
Town of Triangle – After the 1935 flood, the U.S. Army Corps of Engineers constructed theWhitney Point Dam on the Otselic River as a unit of the flood control plan for the southern tier ofNew York State and eastern Pennsylvania communities in the Susquehanna River basin. TheWhitney Point Dam forms the Whitney Point Reservoir. The 100-year floodplain within theTown is limited to the area immediately adjacent to the northern and southern portions of theWhitney Point Reservoir. No portions of Page Brook, Ticknor Brook or Halfway Brook arelocated within the floodplain (Town of Triangle Comprehensive Plan, 2004).
Town of Union – Repetitive loss properties in the Town are located in the Endwell andFairmount Park areas. These properties are located in 100-year floodplains along theSusquehanna River. The most severe floods in the Town tend to occur in the late winter or earlyspring. Ice jams cause flooding along the Chenango and Susquehanna Rivers in the Town as well(Town of Union HMP, 2008).
River Road, Argonne Avenue, Scarborough Drive and Chaumont Drive in Endwell are frequentlyflooded by the Susquehanna River. When the Susquehanna River reaches a flood stage of 20 to21 feet, basement flooding occurs on the south side of Argonne Avenue. With more severeflooding at flood stage of 22 to 23 feet, flooding occurs at the Kent Avenue Trailer Park (nowdefunct) and the lower end of Davis Avenue, Shady Drive, Verdun Avenue, Davis Avenue andFairmont Avenue. At a flood stage of 25 to 26 feet, the mobile home park is flooded with fourfeet of water. Houses along Kent Avenue, Shady Drive, Verdun Avenue, Davis Avenue andFairmont Avenue are also flooded (Town of Union HMP, 2008).
The Fairmont Park area is subject to the backwater effect from the Susquehanna River alongexisting water conveyance paths and Gray Creek (Town of Union HMP, 2008).
Patterson Creek has been subject to flash floods. A dam was constructed on the Creek aboveStruble Road to provide flood control and flash floods have not occurred since the construction ofthis dam (Town of Union HMP, 2008).
SECTION 5.4.1: RISK ASSESSMENT – FLOOD
DMA 2000 Hazard Mitigation Plan Update – Broome County, New York 5.4.1-11February 2013
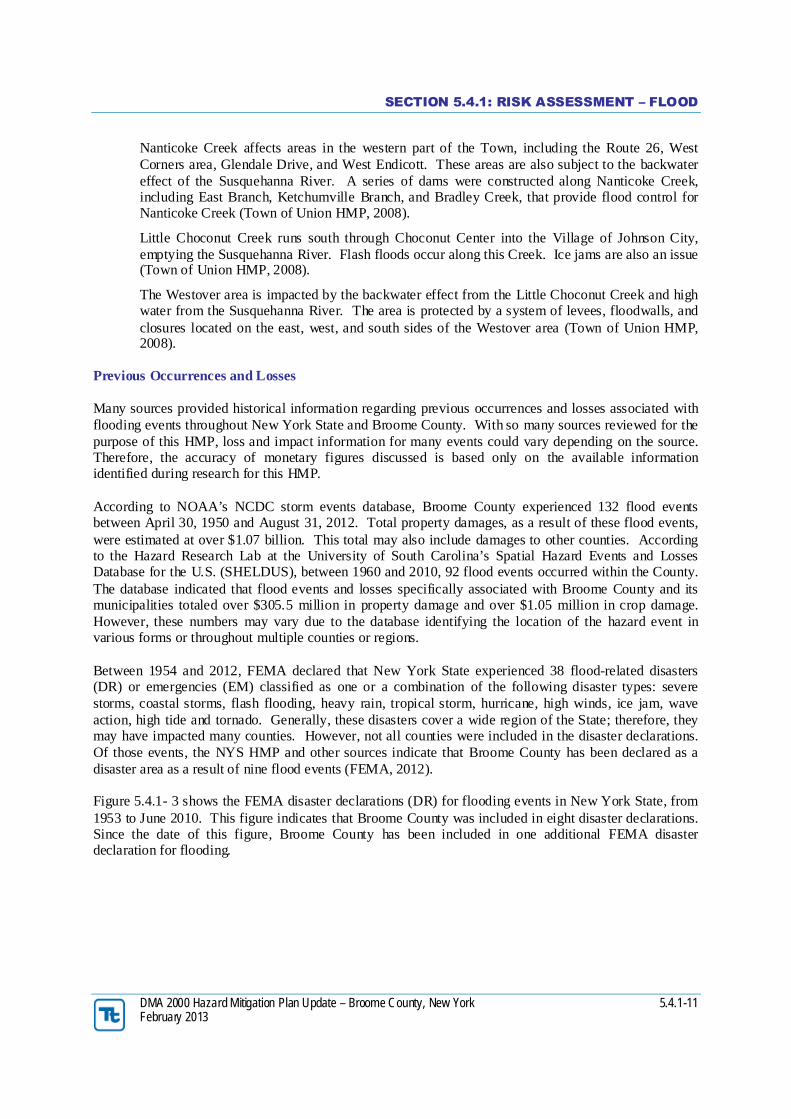
Nanticoke Creek affects areas in the western part of the Town, including the Route 26, WestCorners area, Glendale Drive, and West Endicott. These areas are also subject to the backwatereffect of the Susquehanna River. A series of dams were constructed along Nanticoke Creek,including East Branch, Ketchumville Branch, and Bradley Creek, that provide flood control forNanticoke Creek (Town of Union HMP, 2008).
Little Choconut Creek runs south through Choconut Center into the Village of Johnson City,emptying the Susquehanna River. Flash floods occur along this Creek. Ice jams are also an issue(Town of Union HMP, 2008).
The Westover area is impacted by the backwater effect from the Little Choconut Creek and highwater from the Susquehanna River. The area is protected by a system of levees, floodwalls, andclosures located on the east, west, and south sides of the Westover area (Town of Union HMP,2008).
Previous Occurrences and Losses
Many sources provided historical information regarding previous occurrences and losses associated withflooding events throughout New York State and Broome County. With so many sources reviewed for thepurpose of this HMP, loss and impact information for many events could vary depending on the source.Therefore, the accuracy of monetary figures discussed is based only on the available informationidentified during research for this HMP.
According to NOAA’s NCDC storm events database, Broome County experienced 132 flood eventsbetween April 30, 1950 and August 31, 2012. Total property damages, as a result of these flood events,were estimated at over $1.07 billion. This total may also include damages to other counties. Accordingto the Hazard Research Lab at the University of South Carolina’s Spatial Hazard Events and LossesDatabase for the U.S. (SHELDUS), between 1960 and 2010, 92 flood events occurred within the County.The database indicated that flood events and losses specifically associated with Broome County and itsmunicipalities totaled over $305.5 million in property damage and over $1.05 million in crop damage.However, these numbers may vary due to the database identifying the location of the hazard event invarious forms or throughout multiple counties or regions.
Between 1954 and 2012, FEMA declared that New York State experienced 38 flood-related disasters(DR) or emergencies (EM) classified as one or a combination of the following disaster types: severestorms, coastal storms, flash flooding, heavy rain, tropical storm, hurricane, high winds, ice jam, waveaction, high tide and tornado. Generally, these disasters cover a wide region of the State; therefore, theymay have impacted many counties. However, not all counties were included in the disaster declarations.Of those events, the NYS HMP and other sources indicate that Broome County has been declared as adisaster area as a result of nine flood events (FEMA, 2012).
Figure 5.4.1- 3 shows the FEMA disaster declarations (DR) for flooding events in New York State, from1953 to June 2010. This figure indicates that Broome County was included in eight disaster declarations.Since the date of this figure, Broome County has been included in one additional FEMA disasterdeclaration for flooding.
SECTION 5.4.1: RISK ASSESSMENT – FLOOD
DMA 2000 Hazard Mitigation Plan Update – Broome County, New York 5.4.1-12February 2013
Figure 5.4.1- 3. Presidential Disaster Declarations for Flooding Events, 1953-2010
Source: NYS HMP 2011Note: The black circle indicates the approximate location of Broome County.
Based on all sources researched, known flooding events that have affected Broome County and itsmunicipalities are identified in Table 5.4.1- 1. With flood documentation for New York State being soextensive, not all sources have been identified or researched. Therefore, Table 5.4.1- 1 may not includeall events that have occurred throughout the County and region.
SECTION 5.4.1: RISK ASSESSMENT – FLOOD
DMA 2000 Hazard Mitigation Plan Update – Broome County, New York 5.4.1-13February 2013
Table 5.4.1- 1. Flooding Events Between 1903 and 2012
Dates of Event Event TypeFEMA
DeclarationNumber
CountyDesignated?
Losses / Impacts Source(s)
1903 Flood N/A N/AThe West Branch of the Delaware River overflowed its banks,
sending floodwaters through the center of the Village of Deposit.This was one of the largest floods on record.
FEMA FIS
April 8, 1935 Flooding N/A N/A
On this date, a 24-hour flood event caused the Dudley Creekand the Tioughnioga, Otselic, and Chenango Rivers to flood.
This caused damage to the City of Binghamton, Towns of Lisleand Chenango and the Village of Whitney Point. Four peopledrowned during this event and six were reported missing or
presumed drowned.
Broome CountyHMP
July 8, 1935 Flooding N/A N/A
Flash flooding of the Chenango River caused $1.6 M indamages to the City of Binghamton. The flood event of the
Chenango River caused the water level in Chenango TownshipChenango Fork Station to rise to 20.3 feet, resulting in serious
flooding at Port Crane, Chenango Bridge and Broad Acres.
Broome CountyHMP
March 18, 1936 Flooding N/A N/A
Flash flooding of the Susquehanna River closed bridges in theCity of Binghamton, which divided the City into four,
disconnected sections. Flooding of the Chenango River at theWashington Street Station caused water to rise to a record high(22 feet), resulting in some evacuation; stop logs being erectedat Chamberlain Creek, Conrail Railroad, and Exchange Street
Bridge; and many road closures. Vestal Station had recordhighs during this flood event (up to 30.5 feet).
Broome CountyHMP
July 3, 1970Severe Stormsand Flooding
DR-290 YesThe County had approximately $250 K in property damage and$25 K in crop damage. In the Village of Deposit, the flooding
damaged over 50 homes and commercial buildings.
FEMA, FEMA FIS,SHELDUS
June 20-25, 1972Flooding, SevereStorm and TSTM
N/A N/AThe County had over $1.6 M in property and crop damages
from this event.SHELDUS
March 17-19,1973
Flooding, SevereStorm and TSTM
N/A N/AThe County had approximately $200 K in property damages
from this event.SHELDUS
July 11, 1976 Flash Flood N/A N/A
This flash flood event resulted from intense rainfall over theNanticoke Creek watershed and caused $900 K in damage.
Approximately 30 homes in the Town of Nanticoke wereseverely damaged. Both the East Branch and West Branch ofthe Nanticoke Creeks crested within one hour of the start of the
rainfall. Several roads, including State Route 26 at severallocations and Pendall Hill Road were overtopped and
impassable. The Leekville Road and Dunham Hill Road bridgesover the East Branch were washed out. Erosion undermined
FEMA FIS
SECTION 5.4.1: RISK ASSESSMENT – FLOOD
DMA 2000 Hazard Mitigation Plan Update – Broome County, New York 5.4.1-14February 2013
Dates of Event Event TypeFEMA
DeclarationNumber
CountyDesignated?
Losses / Impacts Source(s)
trailers at the Green Valley Trailer Park in Glen Aubrey.
December 12,1983
Flood N/A N/A
A flood event on the Susquehanna River included 5.10 inches ofrain in 28 hours; over 100 homes and 64 trailers/mobile homes
were inundated. The County had over $227 K in propertydamage from this event.
SHELDUS, BroomeCounty HMP
March 14, 1986 Flooding N/A N/A The County had approximately $1 M in property damage. SHELDUS
July 31, 1986 Flooding N/A N/A The County had approximately $50 K in property damage. SHELDUS
August 6, 1986 Flooding N/A N/A The County had approximately $50 K in property damage. SHELDUS
April 4, 1987 Flooding N/A N/AThe County had over $2 M in property damage and over $200 K
in crop damage.SHELDUS
March 29 – April5, 1993
Flooding N/A N/A
The County had approximately $1 M in property damage.
In the Town of Union, on April 2, the Susquehanna Rivercrested at a flood stage of 25.6 feet. Argone Avenue and
adjacent streets were flooded. Residents were evacuated.
SHELDUS, Town ofUnion HMP
April 10-14, 1993 Flooding N/A N/A
The County had approximately $500 K in property damage.
In the Town of Union, on April 11, the Susquehanna Rivercrested at a flood stage of 26.3 feet.
SHELDUS, Town ofUnion HMP
March 10-11,1994
Flash Flood N/A N/A Flash flooding of Occanum Creek along Main and Grove Streetsoccurred in Windsor.
Broome CountyHMP
March 24-26,1994
Ice Jam Flooding N/A N/AAn ice jam along the Susquehanna River at the Town of Conklin
resulted in flooding along River Road.Broome County
HMP
January 19-20,1996
Severe Stormsand Flooding
DR-1095(IA and PA)
Yes
The City of Binghamton experienced $35 M in damages. In theTown of Chenango, the flood event caused widespread floodingand extensive damage to dozens of town roads. In the Town ofSanford, the event resulted in $296,405.91 in roadway losseswithin the Town. Many roads were washed out as a result ofthe flooding. In the Town of Union, the Susquehanna River
crested at a flood stage of 27.25 feet (January 19) and 24.6 feet(January 20). A 30-inch snowpack melted within a 48-hour
FEMA, SHELDUS,Broome CountyHMP, Town of
Union HMP
SECTION 5.4.1: RISK ASSESSMENT – FLOOD
DMA 2000 Hazard Mitigation Plan Update – Broome County, New York 5.4.1-15February 2013
Dates of Event Event TypeFEMA
DeclarationNumber
CountyDesignated?
Losses / Impacts Source(s)
period with two to three inches of rain causing creeks and smallstreams to overflow. River Road and Argonne Avenue in the
Town of Union (hamlet of Endwell) were evacuated. NanticokeDrive at Bradley Creek Road in Union Center was flooded.
Overall, the County had approximately $7.9 M in propertydamage.
June 30, 1998 Flash Flood N/A N/A
A flash flood event near Chenango Bride on Hiner Park Creekcaused the creek to flood its banks and several basement
homes were flooded. The County had approximately $10 K inproperty damage.
SHELDUS, BroomeCounty HMP
July 8, 1998 Flooding N/A N/A The County had approximately $75 K in property damage. SHELDUS
May 10, 2000 Flooding N/A N/AFlooding occurred throughout the Town of Chenango and
resulted in minor roadside erosion damages.Broome County
HMP
April 4, 2000 Flooding N/A N/A
A flood event washed out numerous town roads, includingWater Street and Dorman, Hand, Dimmock Hill, and Mix Roads.The recovery time for this event was at least four days and the
damage included hill road washouts, clogged ditches, anderosion.
Broome CountyHMP
July 29, 2000 Flooding N/A N/A
Flooding impacted the eastern portion of the Town ofChenango. Washouts occurred on hill roads. Barricades andflashing lights were placed on Mix and East Hill Roads until allthe washouts could be repaired. Large rocks and mud were
present in the roadways. East Hill, Oak Hill, and Mix Roads hadto be closed as a result of flooding.
Broome CountyHMP
May 28, 2002 Flooding N/A N/A The County had approximately $100 K in property damage. SHELDUS
June 14, 2003 Flooding N/A N/A The County had approximately $100 K in property damage. SHELDUS
June 16, 2004Flooding and
TSTMsN/A N/A
Severe TSTMs and flooding affected the northern part of theTown of Chenango, affecting the hamlet of Castle Creek.
Castle Creek flooding and damage occurred to several homes,the Civic Association, and area ball fields.
Broome CountyHMP
March 4, 2004 Flooding N/A N/A
A huge raft of ice broke free on the Chenango River, upstreamfrom Chenango Bridge. That bridge is located a few miles
upstream of the merger of the Chenango and SusquehannaRivers in the City of Binghamton. The ice first jammed against a
SHELDUS, BroomeCounty HMP
SECTION 5.4.1: RISK ASSESSMENT – FLOOD
DMA 2000 Hazard Mitigation Plan Update – Broome County, New York 5.4.1-16February 2013
Dates of Event Event TypeFEMA
DeclarationNumber
CountyDesignated?
Losses / Impacts Source(s)
railroad bridge and then, the Route 12A Bridge that crosses theriver. The jam almost completely blocked the flow of the
Chenango River, causing water to back up behind the Route12A Bridge. This flooded an ice skating rink, a golf course, a
parking lot, and an office building which houses a pub, asenator’s office, and a financial institution. The NWS in
Binghamton issued a Flash Flood Warning to alert residentsalong the river of the rapid rises that this and other potential icejams could cause when the ice eventually breaks free and flowsdownstream. The County had approximately $50K in property
damage.
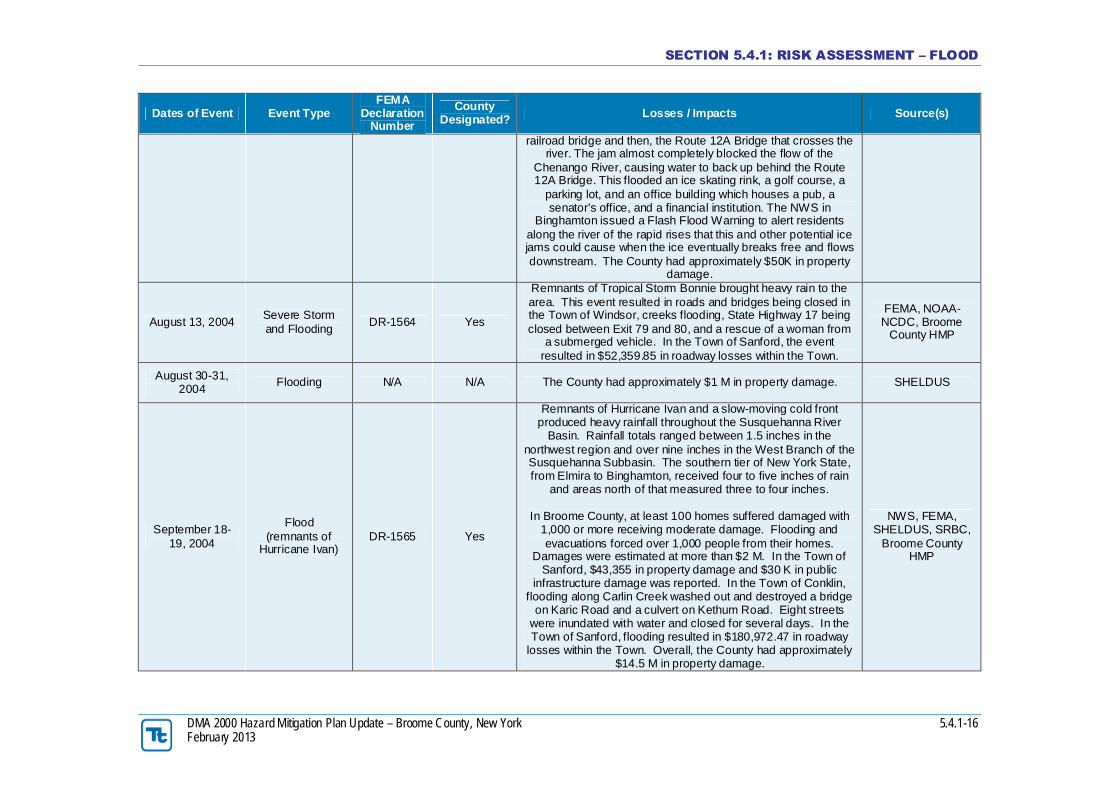
August 13, 2004Severe Stormand Flooding
DR-1564 Yes
Remnants of Tropical Storm Bonnie brought heavy rain to thearea. This event resulted in roads and bridges being closed inthe Town of Windsor, creeks flooding, State Highway 17 beingclosed between Exit 79 and 80, and a rescue of a woman from
a submerged vehicle. In the Town of Sanford, the eventresulted in $52,359.85 in roadway losses within the Town.
FEMA, NOAA-NCDC, Broome
County HMP
August 30-31,2004
Flooding N/A N/A The County had approximately $1 M in property damage. SHELDUS
September 18-19, 2004
Flood(remnants of
Hurricane Ivan)DR-1565 Yes
Remnants of Hurricane Ivan and a slow-moving cold frontproduced heavy rainfall throughout the Susquehanna River
Basin. Rainfall totals ranged between 1.5 inches in thenorthwest region and over nine inches in the West Branch of theSusquehanna Subbasin. The southern tier of New York State,from Elmira to Binghamton, received four to five inches of rain
and areas north of that measured three to four inches.
In Broome County, at least 100 homes suffered damaged with1,000 or more receiving moderate damage. Flooding andevacuations forced over 1,000 people from their homes.
Damages were estimated at more than $2 M. In the Town ofSanford, $43,355 in property damage and $30 K in public
infrastructure damage was reported. In the Town of Conklin,flooding along Carlin Creek washed out and destroyed a bridge
on Karic Road and a culvert on Kethum Road. Eight streetswere inundated with water and closed for several days. In theTown of Sanford, flooding resulted in $180,972.47 in roadway
losses within the Town. Overall, the County had approximately$14.5 M in property damage.
NWS, FEMA,SHELDUS, SRBC,
Broome CountyHMP
SECTION 5.4.1: RISK ASSESSMENT – FLOOD
DMA 2000 Hazard Mitigation Plan Update – Broome County, New York 5.4.1-17February 2013
Dates of Event Event TypeFEMA
DeclarationNumber
CountyDesignated?
Losses / Impacts Source(s)
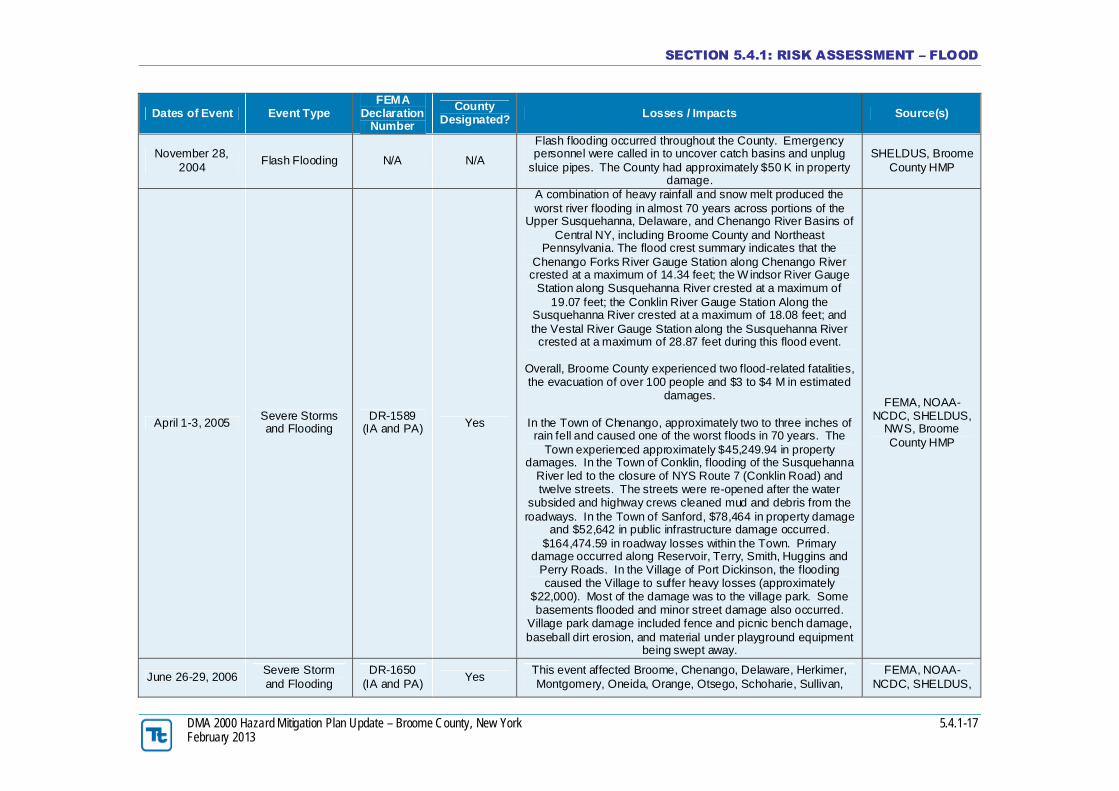
November 28,2004
Flash Flooding N/A N/A
Flash flooding occurred throughout the County. Emergencypersonnel were called in to uncover catch basins and unplug
sluice pipes. The County had approximately $50 K in propertydamage.
SHELDUS, BroomeCounty HMP
April 1-3, 2005Severe Stormsand Flooding
DR-1589(IA and PA) Yes
A combination of heavy rainfall and snow melt produced theworst river flooding in almost 70 years across portions of the
Upper Susquehanna, Delaware, and Chenango River Basins ofCentral NY, including Broome County and Northeast
Pennsylvania. The flood crest summary indicates that theChenango Forks River Gauge Station along Chenango Rivercrested at a maximum of 14.34 feet; the Windsor River Gauge
Station along Susquehanna River crested at a maximum of19.07 feet; the Conklin River Gauge Station Along the
Susquehanna River crested at a maximum of 18.08 feet; andthe Vestal River Gauge Station along the Susquehanna River
crested at a maximum of 28.87 feet during this flood event.
Overall, Broome County experienced two flood-related fatalities,the evacuation of over 100 people and $3 to $4 M in estimated
damages.
In the Town of Chenango, approximately two to three inches ofrain fell and caused one of the worst floods in 70 years. The
Town experienced approximately $45,249.94 in propertydamages. In the Town of Conklin, flooding of the Susquehanna
River led to the closure of NYS Route 7 (Conklin Road) andtwelve streets. The streets were re-opened after the water
subsided and highway crews cleaned mud and debris from theroadways. In the Town of Sanford, $78,464 in property damage
and $52,642 in public infrastructure damage occurred.$164,474.59 in roadway losses within the Town. Primary
damage occurred along Reservoir, Terry, Smith, Huggins andPerry Roads. In the Village of Port Dickinson, the floodingcaused the Village to suffer heavy losses (approximately
$22,000). Most of the damage was to the village park. Somebasements flooded and minor street damage also occurred.
Village park damage included fence and picnic bench damage,baseball dirt erosion, and material under playground equipment
DMA 2000 Hazard Mitigation Plan Update – Broome County, New York 5.4.1-18February 2013
Dates of Event Event TypeFEMA
DeclarationNumber
CountyDesignated?
Losses / Impacts Source(s)
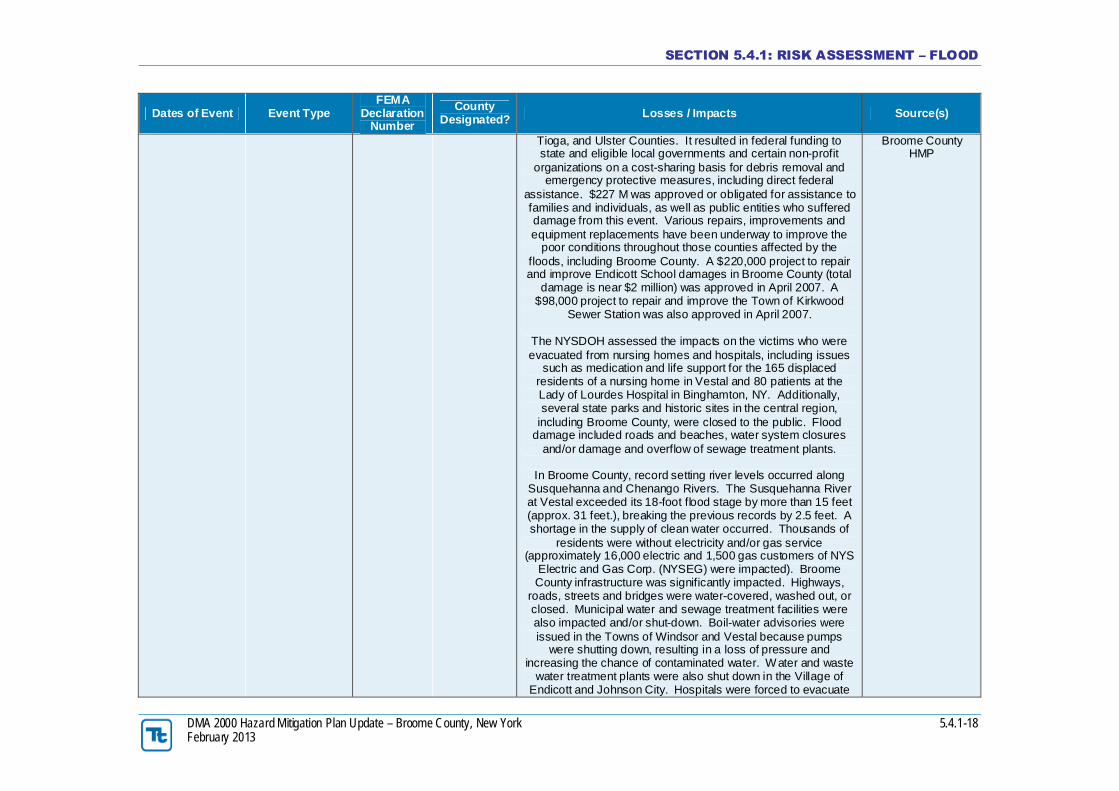
Tioga, and Ulster Counties. It resulted in federal funding tostate and eligible local governments and certain non-profit
organizations on a cost-sharing basis for debris removal andemergency protective measures, including direct federal
assistance. $227 M was approved or obligated for assistance tofamilies and individuals, as well as public entities who suffereddamage from this event. Various repairs, improvements andequipment replacements have been underway to improve the
poor conditions throughout those counties affected by thefloods, including Broome County. A $220,000 project to repairand improve Endicott School damages in Broome County (total
damage is near $2 million) was approved in April 2007. A$98,000 project to repair and improve the Town of Kirkwood
Sewer Station was also approved in April 2007.
The NYSDOH assessed the impacts on the victims who wereevacuated from nursing homes and hospitals, including issues
such as medication and life support for the 165 displacedresidents of a nursing home in Vestal and 80 patients at theLady of Lourdes Hospital in Binghamton, NY. Additionally,several state parks and historic sites in the central region,
including Broome County, were closed to the public. Flooddamage included roads and beaches, water system closures
and/or damage and overflow of sewage treatment plants.
In Broome County, record setting river levels occurred alongSusquehanna and Chenango Rivers. The Susquehanna Riverat Vestal exceeded its 18-foot flood stage by more than 15 feet(approx. 31 feet.), breaking the previous records by 2.5 feet. Ashortage in the supply of clean water occurred. Thousands of
residents were without electricity and/or gas service(approximately 16,000 electric and 1,500 gas customers of NYS
Electric and Gas Corp. (NYSEG) were impacted). BroomeCounty infrastructure was significantly impacted. Highways,
roads, streets and bridges were water-covered, washed out, orclosed. Municipal water and sewage treatment facilities werealso impacted and/or shut-down. Boil-water advisories wereissued in the Towns of Windsor and Vestal because pumps
were shutting down, resulting in a loss of pressure andincreasing the chance of contaminated water. Water and waste
water treatment plants were also shut down in the Village ofEndicott and Johnson City. Hospitals were forced to evacuate
Broome CountyHMP
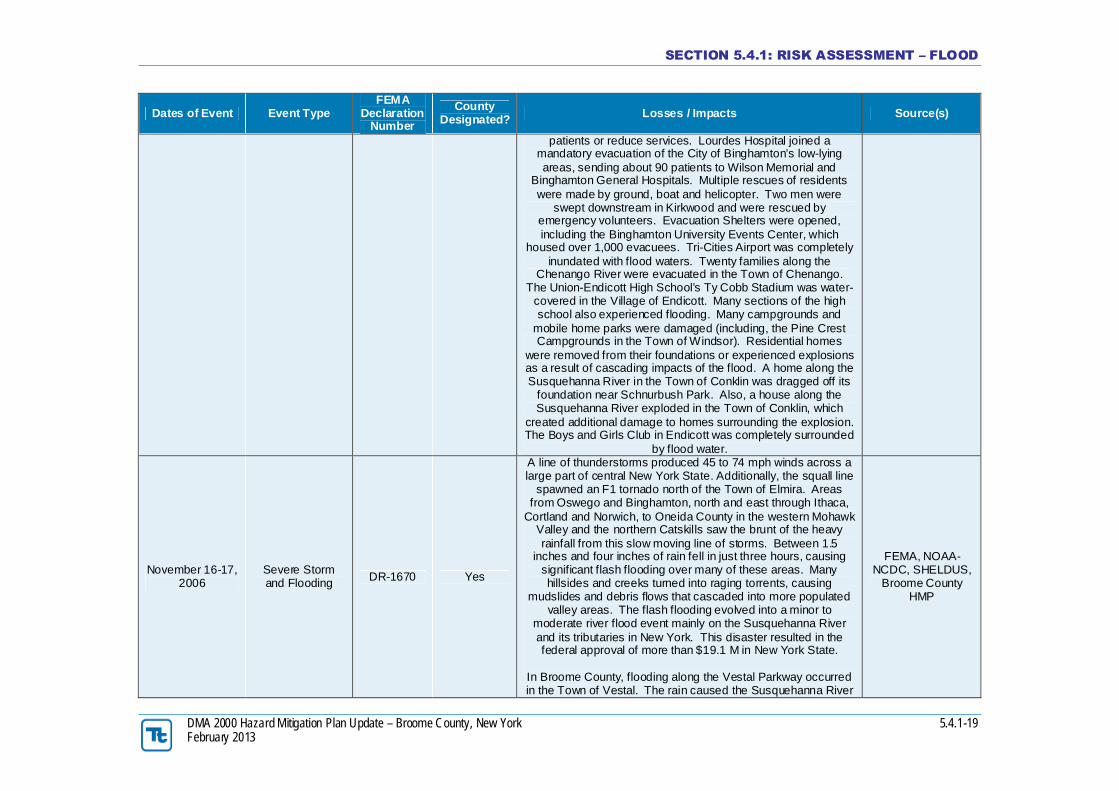
SECTION 5.4.1: RISK ASSESSMENT – FLOOD
DMA 2000 Hazard Mitigation Plan Update – Broome County, New York 5.4.1-19February 2013
Dates of Event Event TypeFEMA
DeclarationNumber
CountyDesignated?
Losses / Impacts Source(s)
patients or reduce services. Lourdes Hospital joined amandatory evacuation of the City of Binghamton’s low-lyingareas, sending about 90 patients to Wilson Memorial and
Binghamton General Hospitals. Multiple rescues of residentswere made by ground, boat and helicopter. Two men were
swept downstream in Kirkwood and were rescued byemergency volunteers. Evacuation Shelters were opened,including the Binghamton University Events Center, which
housed over 1,000 evacuees. Tri-Cities Airport was completelyinundated with flood waters. Twenty families along the
Chenango River were evacuated in the Town of Chenango.The Union-Endicott High School’s Ty Cobb Stadium was water-
covered in the Village of Endicott. Many sections of the highschool also experienced flooding. Many campgrounds and
mobile home parks were damaged (including, the Pine CrestCampgrounds in the Town of Windsor). Residential homes
were removed from their foundations or experienced explosionsas a result of cascading impacts of the flood. A home along theSusquehanna River in the Town of Conklin was dragged off its
foundation near Schnurbush Park. Also, a house along theSusquehanna River exploded in the Town of Conklin, which
created additional damage to homes surrounding the explosion.The Boys and Girls Club in Endicott was completely surrounded
by flood water.
November 16-17,2006
Severe Stormand Flooding
DR-1670 Yes
A line of thunderstorms produced 45 to 74 mph winds across alarge part of central New York State. Additionally, the squall line
spawned an F1 tornado north of the Town of Elmira. Areasfrom Oswego and Binghamton, north and east through Ithaca,
Cortland and Norwich, to Oneida County in the western MohawkValley and the northern Catskills saw the brunt of the heavyrainfall from this slow moving line of storms. Between 1.5
inches and four inches of rain fell in just three hours, causingsignificant flash flooding over many of these areas. Manyhillsides and creeks turned into raging torrents, causing
mudslides and debris flows that cascaded into more populatedvalley areas. The flash flooding evolved into a minor to
moderate river flood event mainly on the Susquehanna Riverand its tributaries in New York. This disaster resulted in thefederal approval of more than $19.1 M in New York State.
In Broome County, flooding along the Vestal Parkway occurredin the Town of Vestal. The rain caused the Susquehanna River
FEMA, NOAA-NCDC, SHELDUS,
Broome CountyHMP
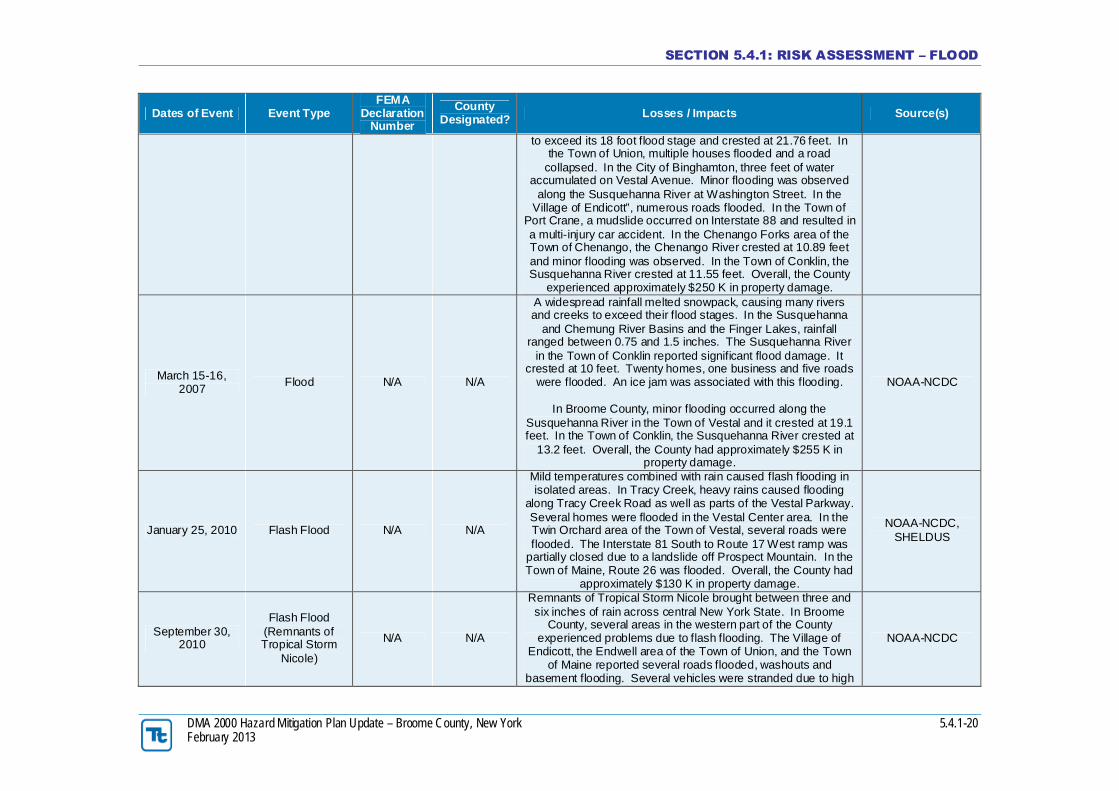
SECTION 5.4.1: RISK ASSESSMENT – FLOOD
DMA 2000 Hazard Mitigation Plan Update – Broome County, New York 5.4.1-20February 2013
Dates of Event Event TypeFEMA
DeclarationNumber
CountyDesignated?
Losses / Impacts Source(s)
to exceed its 18 foot flood stage and crested at 21.76 feet. Inthe Town of Union, multiple houses flooded and a road
collapsed. In the City of Binghamton, three feet of wateraccumulated on Vestal Avenue. Minor flooding was observed
along the Susquehanna River at Washington Street. In theVillage of Endicott”, numerous roads flooded. In the Town of
Port Crane, a mudslide occurred on Interstate 88 and resulted ina multi-injury car accident. In the Chenango Forks area of theTown of Chenango, the Chenango River crested at 10.89 feetand minor flooding was observed. In the Town of Conklin, theSusquehanna River crested at 11.55 feet. Overall, the County
experienced approximately $250 K in property damage.
March 15-16,2007
Flood N/A N/A
A widespread rainfall melted snowpack, causing many riversand creeks to exceed their flood stages. In the Susquehanna
and Chemung River Basins and the Finger Lakes, rainfallranged between 0.75 and 1.5 inches. The Susquehanna River
in the Town of Conklin reported significant flood damage. Itcrested at 10 feet. Twenty homes, one business and five roads
were flooded. An ice jam was associated with this flooding.
In Broome County, minor flooding occurred along theSusquehanna River in the Town of Vestal and it crested at 19.1feet. In the Town of Conklin, the Susquehanna River crested at
13.2 feet. Overall, the County had approximately $255 K inproperty damage.
NOAA-NCDC
January 25, 2010 Flash Flood N/A N/A
Mild temperatures combined with rain caused flash flooding inisolated areas. In Tracy Creek, heavy rains caused flooding
along Tracy Creek Road as well as parts of the Vestal Parkway.Several homes were flooded in the Vestal Center area. In theTwin Orchard area of the Town of Vestal, several roads wereflooded. The Interstate 81 South to Route 17 West ramp was
partially closed due to a landslide off Prospect Mountain. In theTown of Maine, Route 26 was flooded. Overall, the County had
approximately $130 K in property damage.
NOAA-NCDC,SHELDUS
September 30,2010
Flash Flood(Remnants ofTropical Storm
Nicole)
N/A N/A
Remnants of Tropical Storm Nicole brought between three andsix inches of rain across central New York State. In Broome
County, several areas in the western part of the Countyexperienced problems due to flash flooding. The Village of
Endicott, the Endwell area of the Town of Union, and the Townof Maine reported several roads flooded, washouts and
basement flooding. Several vehicles were stranded due to high
NOAA-NCDC
SECTION 5.4.1: RISK ASSESSMENT – FLOOD
DMA 2000 Hazard Mitigation Plan Update – Broome County, New York 5.4.1-21February 2013
Dates of Event Event TypeFEMA
DeclarationNumber
CountyDesignated?
Losses / Impacts Source(s)
water at road intersections and in parking lots. The County hadapproximately $50 K in property damage.
April 26 – May 8,2011
Severe Storm,Flooding,
Straight-LineWinds
DR-1993 Yes
A significant severe weather outbreak developed across centralNew York State as a storm system moved east from the Great
Lakes. First, showers and TSTMs developed early in theevening on the 27th, as an upper level disturbance approached
the region. Two of the more significant storms included onesupercell that produced a tornado in Steuben County causedtree and structural damage across Steuben, Chemung and
Schuyler counties. Elsewhere across central New York, stormscaused scattered wind damage and heavy rain.
Broome County experienced significant flash flooding,especially along the Route 26 corridor. Route 26 was closed
between the hamlet of Glen Aubrey and the Village of WhitneyPoint, with 18 houses cut off by flood waters. Nanticoke Creekin the Town of Maine flooded many homes, with water up to thefirst floor of some homes. About 150 people were evacuated
and two shelters were set up. The County experiencedapproximately $4 M in property damages.
FEMA, NOAA-NCDC
August 27-28,2011
Hurricane IreneEM-
3328/DR-4020
No
Hurricane Irene brought heavy rains and high winds fromnortheast Pennsylvania to the Catskill Mountains of New York.Rainfall totaled from two to five inches over most of northeastPennsylvania and in the Susquehanna Region of central NewYork. Between four and eight inches of rain fell in the westernCatskills with portions of Wyoming and northern Susquehanna
Counties in northeast Pennsylvania and southern BroomeCounty in New York receiving six to eight inches of rain. In
addition to the heavy rains, high winds from the storm knockeddown numerous trees and power-lines across Broome,
Delaware, Sullivan and Otsego Counties in New York. Duringthe height of the storm, over 40,000 residences were withoutpower. In some cases, power was not restored for one week.
In Broome County, heavy rains in the Town of Conklin (hamletof Conklin Forks) caused flooding along Pierce Creek Road. Inthe Town of Conklin, the Susquehanna River at Conklin crested
at 16.34 feet. Many roads were flooded in the Town ofKirkwood area and several roads and one bridge were closed
due to flash flooding. In the Town of Vestal, major flash floodingoccurred along the Choconut Creek and many roads were
FEMA, NOAA-NCDC
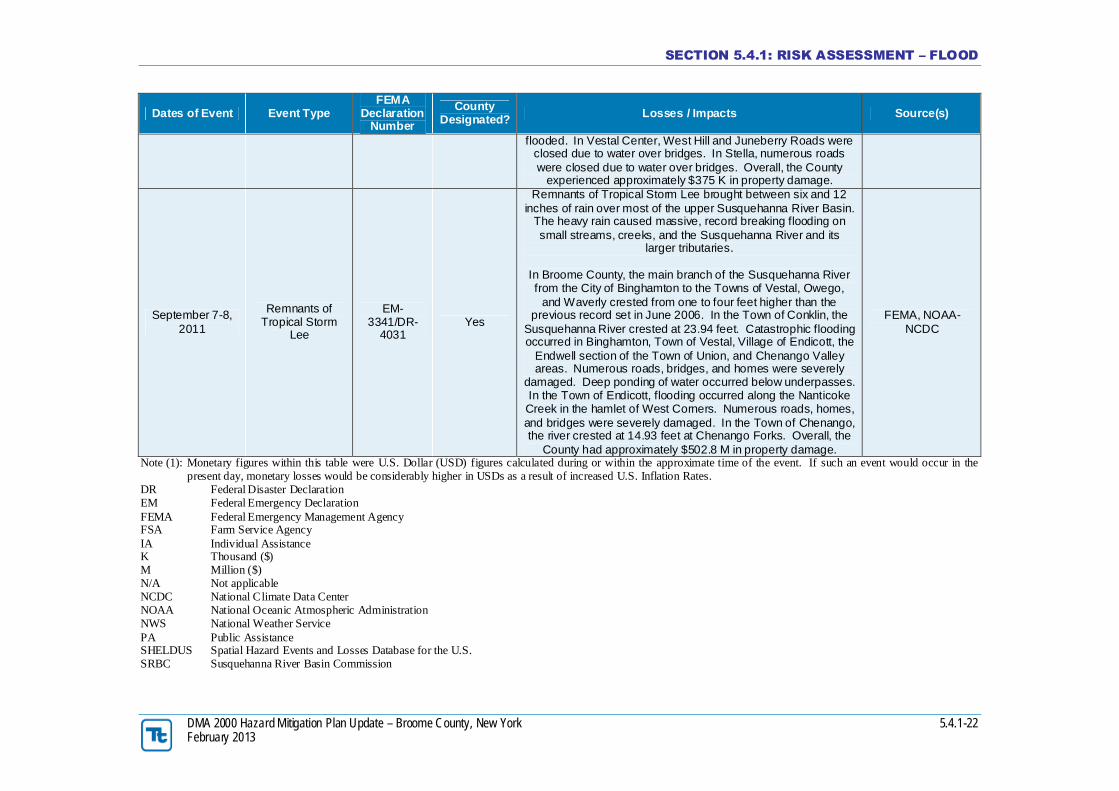
SECTION 5.4.1: RISK ASSESSMENT – FLOOD
DMA 2000 Hazard Mitigation Plan Update – Broome County, New York 5.4.1-22February 2013
Dates of Event Event TypeFEMA
DeclarationNumber
CountyDesignated?
Losses / Impacts Source(s)
flooded. In Vestal Center, West Hill and Juneberry Roads wereclosed due to water over bridges. In Stella, numerous roadswere closed due to water over bridges. Overall, the County
experienced approximately $375 K in property damage.
September 7-8,2011
Remnants ofTropical Storm
Lee
EM-3341/DR-
4031Yes
Remnants of Tropical Storm Lee brought between six and 12inches of rain over most of the upper Susquehanna River Basin.
The heavy rain caused massive, record breaking flooding onsmall streams, creeks, and the Susquehanna River and its
larger tributaries.
In Broome County, the main branch of the Susquehanna Riverfrom the City of Binghamton to the Towns of Vestal, Owego,
and Waverly crested from one to four feet higher than theprevious record set in June 2006. In the Town of Conklin, the
Susquehanna River crested at 23.94 feet. Catastrophic floodingoccurred in Binghamton, Town of Vestal, Village of Endicott, the
Endwell section of the Town of Union, and Chenango Valleyareas. Numerous roads, bridges, and homes were severely
damaged. Deep ponding of water occurred below underpasses.In the Town of Endicott, flooding occurred along the NanticokeCreek in the hamlet of West Corners. Numerous roads, homes,and bridges were severely damaged. In the Town of Chenango,the river crested at 14.93 feet at Chenango Forks. Overall, the
County had approximately $502.8 M in property damage.
FEMA, NOAA-NCDC
Note (1): Monetary figures within this table were U.S. Dollar (USD) figures calculated during or within the approximate time of the event. If such an event would occur in thepresent day, monetary losses would be considerably higher in USDs as a result of increased U.S. Inflation Rates.
DR Federal Disaster DeclarationEM Federal Emergency DeclarationFEMA Federal Emergency Management AgencyFSA Farm Service AgencyIA Individual AssistanceK Thousand ($)M Million ($)N/A Not applicableNCDC National Climate Data CenterNOAA National Oceanic Atmospheric AdministrationNWS National Weather ServicePA Public AssistanceSHELDUS Spatial Hazard Events and Losses Database for the U.S.SRBC Susquehanna River Basin Commission
SECTION 5.4.1: RISK ASSESSMENT – FLOOD
DMA 2000 Hazard Mitigation Plan Update – Broome County, New York 5.4.1-23February 2013
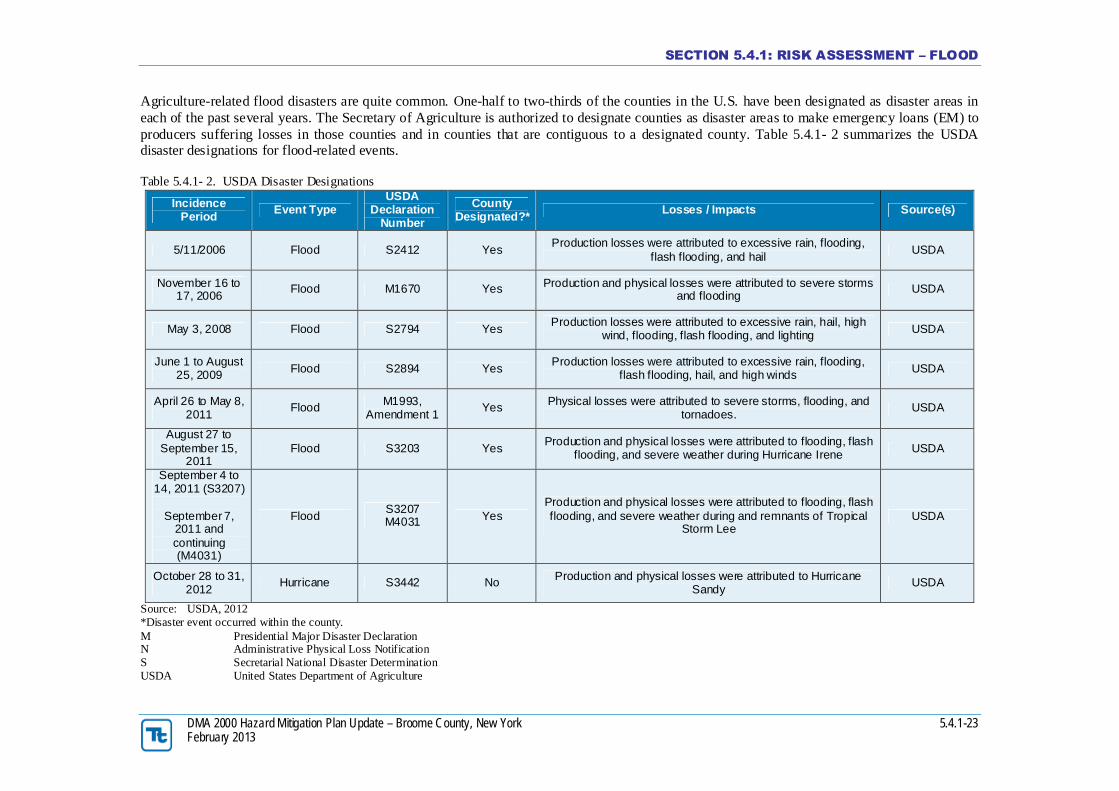
Agriculture-related flood disasters are quite common. One-half to two-thirds of the counties in the U.S. have been designated as disaster areas ineach of the past several years. The Secretary of Agriculture is authorized to designate counties as disaster areas to make emergency loans (EM) toproducers suffering losses in those counties and in counties that are contiguous to a designated county. Table 5.4.1- 2 summarizes the USDAdisaster designations for flood-related events.
Table 5.4.1- 2. USDA Disaster Designations
IncidencePeriod
Event TypeUSDA
DeclarationNumber
CountyDesignated?*
Losses / Impacts Source(s)
5/11/2006 Flood S2412 YesProduction losses were attributed to excessive rain, flooding,
flash flooding, and hailUSDA
November 16 to17, 2006
Flood M1670 Yes Production and physical losses were attributed to severe stormsand flooding
USDA
May 3, 2008 Flood S2794 YesProduction losses were attributed to excessive rain, hail, high
wind, flooding, flash flooding, and lightingUSDA
June 1 to August25, 2009
Flood S2894 YesProduction losses were attributed to excessive rain, flooding,
flash flooding, hail, and high windsUSDA
April 26 to May 8,2011
FloodM1993,
Amendment 1Yes
Physical losses were attributed to severe storms, flooding, andtornadoes.
USDA
August 27 toSeptember 15,
2011Flood S3203 Yes
Production and physical losses were attributed to flooding, flashflooding, and severe weather during Hurricane Irene
USDA
September 4 to14, 2011 (S3207)
September 7,2011 andcontinuing(M4031)
FloodS3207M4031 Yes
Production and physical losses were attributed to flooding, flashflooding, and severe weather during and remnants of Tropical
Storm LeeUSDA
October 28 to 31,2012
Hurricane S3442 NoProduction and physical losses were attributed to Hurricane
SandyUSDA
Source: USDA, 2012*Disaster event occurred within the county.M Presidential Major Disaster DeclarationN Administrative Physical Loss NotificationS Secretarial National Disaster DeterminationUSDA United States Department of Agriculture
SECTION 5.4.1: RISK ASSESSMENT – FLOOD
DMA 2000 Hazard Mitigation Plan Update – Broome County, New York 5.4.1-24February 2013
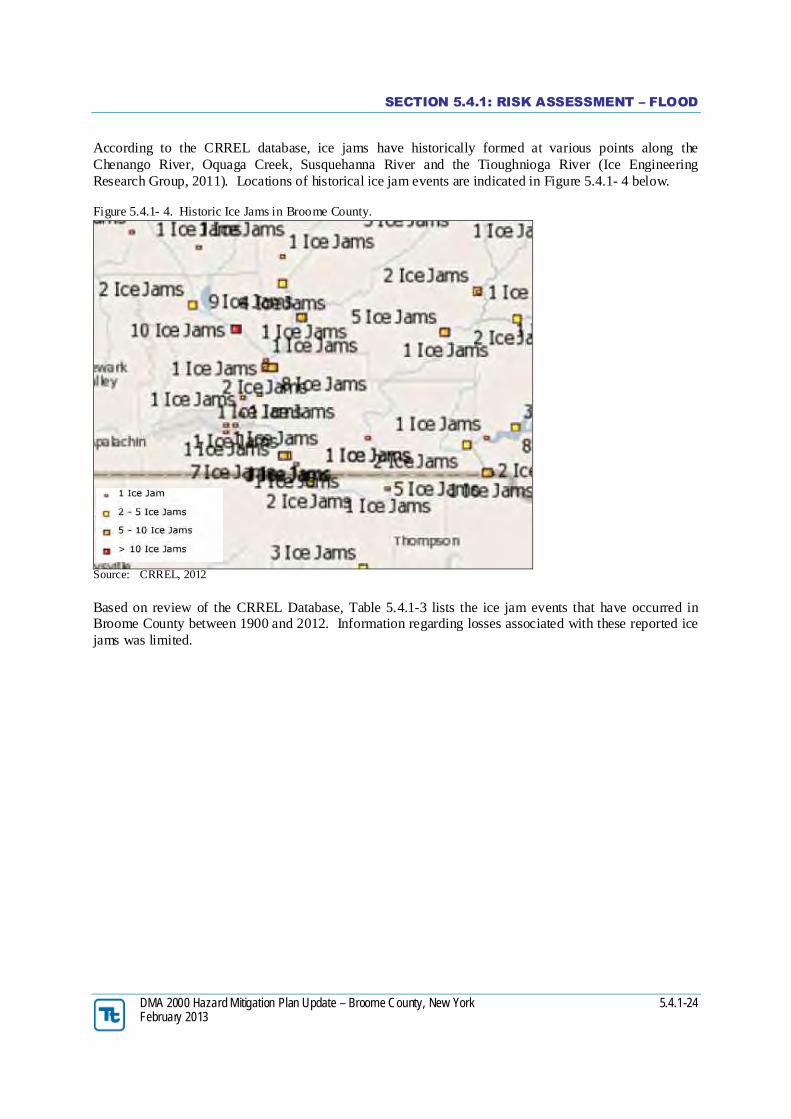
According to the CRREL database, ice jams have historically formed at various points along theChenango River, Oquaga Creek, Susquehanna River and the Tioughnioga River (Ice EngineeringResearch Group, 2011). Locations of historical ice jam events are indicated in Figure 5.4.1- 4 below.
Figure 5.4.1- 4. Historic Ice Jams in Broome County.
Source: CRREL, 2012
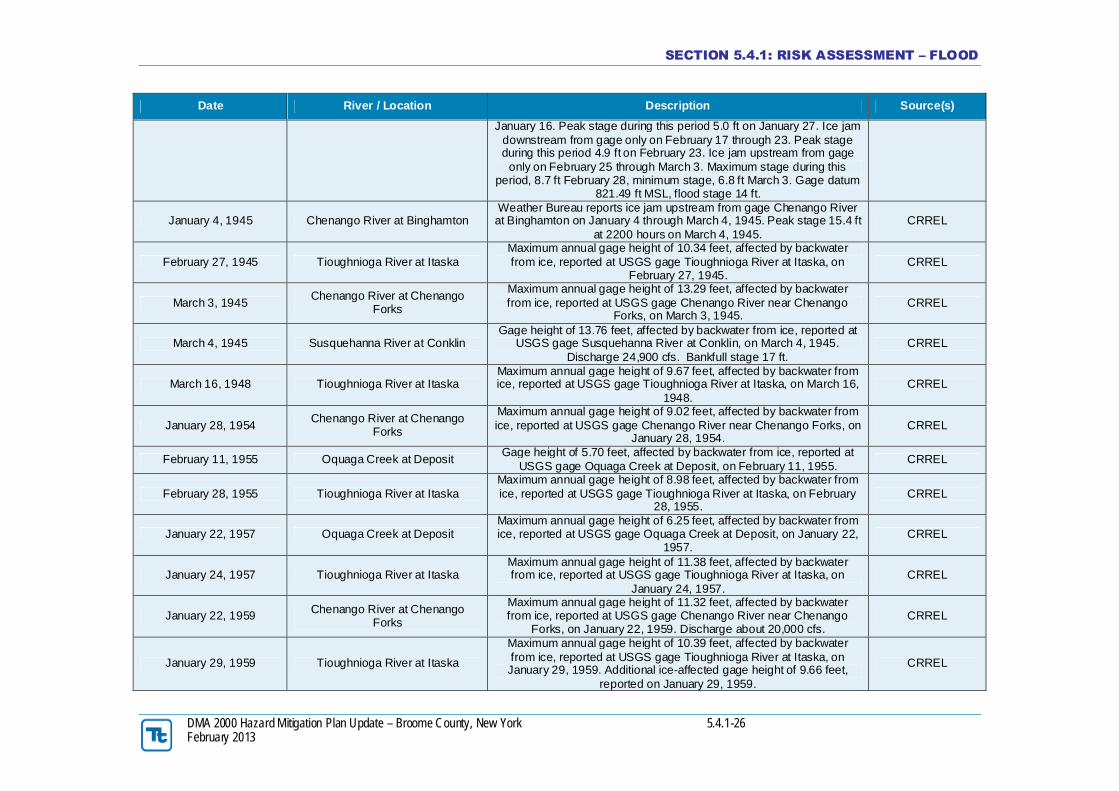
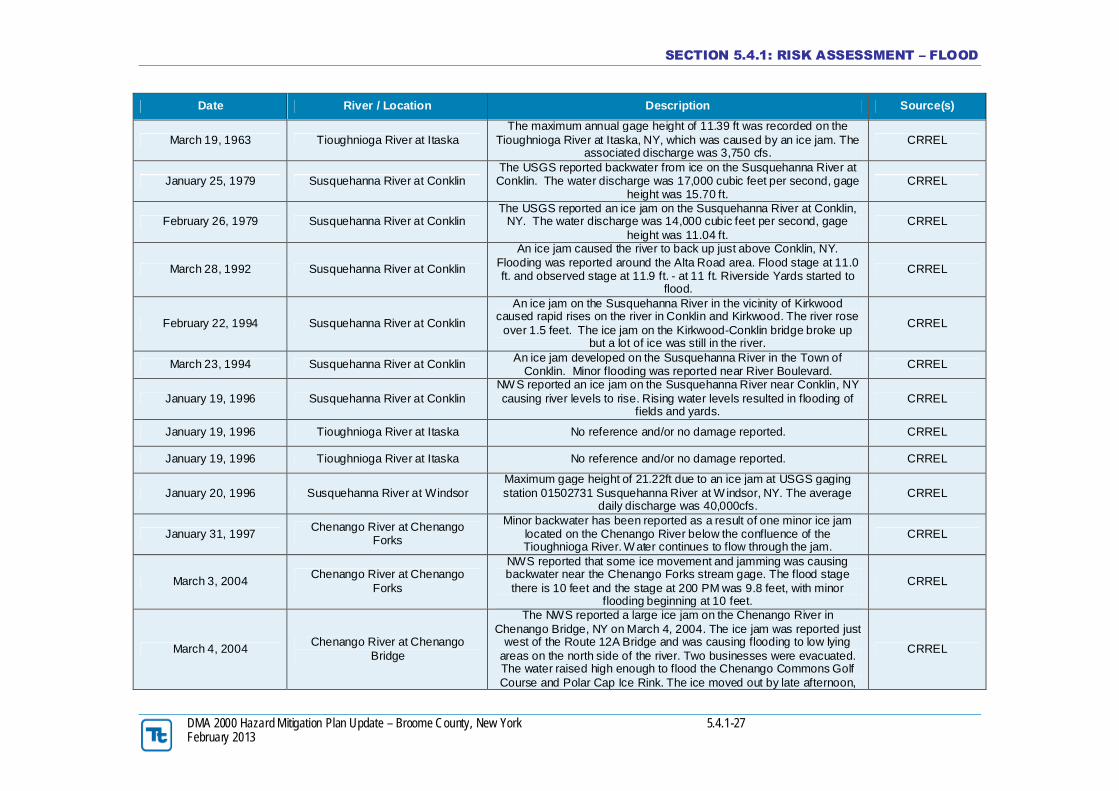
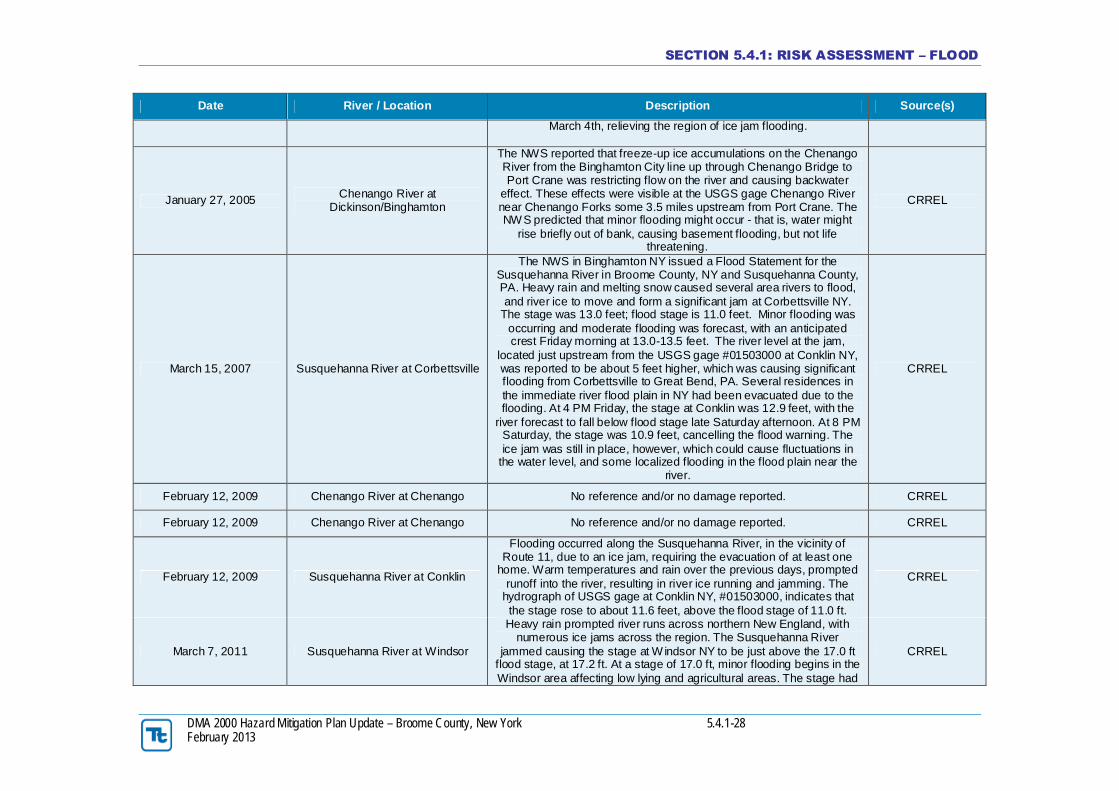
Based on review of the CRREL Database, Table 5.4.1-3 lists the ice jam events that have occurred inBroome County between 1900 and 2012. Information regarding losses associated with these reported icejams was limited.
SECTION 5.4.1: RISK ASSESSMENT – FLOOD
DMA 2000 Hazard Mitigation Plan Update – Broome County, New York 5.4.1-25February 2013
Table 5.4.1-3. Ice Jam Events in Broome County between 1900 and 2012
Date River / Location Description Source(s)
March 24, 1904 Susquehanna River at Binghamton No reference and/or no damage reported. CRREL
February 21, 1918 Susquehanna River at Conklin No reference and/or no damage reported. CRREL
February 26, 1918Chenango River at Chenango
ForksNo reference and/or no damage reported. CRREL
March 13, 1920Chenango River at Chenango
Forks No reference and/or no damage reported. CRREL
March 13, 1920 Susquehanna River at Conklin No reference and/or no damage reported. CRREL
February 24, 1922Chenango River at Chenango
Forks
Maximum annual gage height of 11.82 feet, affected by backwaterfrom ice, reported at USGS gage Chenango River near Chenango
Forks.CRREL
March 24, 1926Chenango River at Chenango
Forks
Maximum annual gage height of 13.54 feet, affected by backwaterfrom ice, reported at USGS gage Chenango River near Chenango
Forks. Additional ice-affected gage height of 10.71 feet, reported onMarch 25, 1926. Discharge about 19,900 cfs.
CRREL
March 4, 1934Chenango River at Chenango
ForksMaximum annual gage height of 10.50 feet, affected by backwater
from ice, reported at USGS gage Tioughnioga River at Itaska.CRREL
March 4, 1934 Tioughnioga River at ItaskaMaximum annual gage height of 10.50 feet, affected by backwaterfrom ice, reported at USGS gage Tioughnioga River at Itaska, on
March 4, 1934.CRREL
February 20, 1939 Tioughnioga River at ItaskaMaximum annual gage height of 12.16 feet, affected by backwaterfrom ice, reported at USGS gage Tioughnioga River at Itaska, on
February 20, 1939. Discharge 15,300 cfs.CRREL
March 31, 1940 Tioughnioga River at Itaska
Maximum annual gage height of 10.63 feet, affected by backwaterfrom ice, reported at USGS Tioughnioga River at Itaska, on March 31,1940. Additional ice-affected gage height of 9.63 feet, reported on April
1, 1940. Discharge 15,000 cfs.
CRREL
February 25, 1943 Susquehanna River at ConklinGage height of 15.26 feet, affected by backwater from ice, reported at
USGS gage Susquehanna River at Conklin, on February 25, 1943.Discharge 27,500 cfs. Bankfull stage 17 ft.
CRREL
March 17, 1944 Tioughnioga River at ItaskaMaximum annual gage height of 9.05 feet, affected by backwater fromice, reported at USGS gage Tioughnioga River at Itaska, on March 17,
1944. Discharge 12,500 cfs.CRREL
March 18, 1944 Susquehanna River at ConklinUSGS reported a gage height of 15 ft and a discharge of 30,000 cfs on
March 18, 1944 on the Susquehanna River at Conklin, NY due tobackwater from ice.
CRREL
January 3, 1945 Susquehanna River at Binghamton
Weather Bureau reports ice jam upstream from gage SusquehannaRiver at Binghamton on January 3 through 17, 1945. Maximum stage6.8 ft January 3, minimum stage 3.1 ft January 17. Ice jams reported
both upstream and downstream from gage on January 18 through
CRREL
SECTION 5.4.1: RISK ASSESSMENT – FLOOD
DMA 2000 Hazard Mitigation Plan Update – Broome County, New York 5.4.1-26February 2013
Date River / Location Description Source(s)
January 16. Peak stage during this period 5.0 ft on January 27. Ice jamdownstream from gage only on February 17 through 23. Peak stageduring this period 4.9 ft on February 23. Ice jam upstream from gage
only on February 25 through March 3. Maximum stage during thisperiod, 8.7 ft February 28, minimum stage, 6.8 ft March 3. Gage datum
821.49 ft MSL, flood stage 14 ft.
January 4, 1945 Chenango River at BinghamtonWeather Bureau reports ice jam upstream from gage Chenango Riverat Binghamton on January 4 through March 4, 1945. Peak stage 15.4 ft
at 2200 hours on March 4, 1945.CRREL
February 27, 1945 Tioughnioga River at ItaskaMaximum annual gage height of 10.34 feet, affected by backwaterfrom ice, reported at USGS gage Tioughnioga River at Itaska, on
February 27, 1945.CRREL
March 3, 1945Chenango River at Chenango
Forks
Maximum annual gage height of 13.29 feet, affected by backwaterfrom ice, reported at USGS gage Chenango River near Chenango
Forks, on March 3, 1945.CRREL
March 4, 1945 Susquehanna River at ConklinGage height of 13.76 feet, affected by backwater from ice, reported at
USGS gage Susquehanna River at Conklin, on March 4, 1945.Discharge 24,900 cfs. Bankfull stage 17 ft.
CRREL
March 16, 1948 Tioughnioga River at ItaskaMaximum annual gage height of 9.67 feet, affected by backwater fromice, reported at USGS gage Tioughnioga River at Itaska, on March 16,
1948.CRREL
January 28, 1954Chenango River at Chenango
Forks
Maximum annual gage height of 9.02 feet, affected by backwater fromice, reported at USGS gage Chenango River near Chenango Forks, on
January 28, 1954.CRREL
February 11, 1955 Oquaga Creek at DepositGage height of 5.70 feet, affected by backwater from ice, reported at
USGS gage Oquaga Creek at Deposit, on February 11, 1955.CRREL
February 28, 1955 Tioughnioga River at ItaskaMaximum annual gage height of 8.98 feet, affected by backwater fromice, reported at USGS gage Tioughnioga River at Itaska, on February
28, 1955.CRREL
January 22, 1957 Oquaga Creek at DepositMaximum annual gage height of 6.25 feet, affected by backwater fromice, reported at USGS gage Oquaga Creek at Deposit, on January 22,
1957.CRREL
January 24, 1957 Tioughnioga River at ItaskaMaximum annual gage height of 11.38 feet, affected by backwaterfrom ice, reported at USGS gage Tioughnioga River at Itaska, on
January 24, 1957.CRREL
January 22, 1959Chenango River at Chenango
Forks
Maximum annual gage height of 11.32 feet, affected by backwaterfrom ice, reported at USGS gage Chenango River near Chenango
Forks, on January 22, 1959. Discharge about 20,000 cfs.CRREL
January 29, 1959 Tioughnioga River at Itaska
Maximum annual gage height of 10.39 feet, affected by backwaterfrom ice, reported at USGS gage Tioughnioga River at Itaska, onJanuary 29, 1959. Additional ice-affected gage height of 9.66 feet,
reported on January 29, 1959.
CRREL
SECTION 5.4.1: RISK ASSESSMENT – FLOOD
DMA 2000 Hazard Mitigation Plan Update – Broome County, New York 5.4.1-27February 2013
Date River / Location Description Source(s)
March 19, 1963 Tioughnioga River at ItaskaThe maximum annual gage height of 11.39 ft was recorded on the
Tioughnioga River at Itaska, NY, which was caused by an ice jam. Theassociated discharge was 3,750 cfs.
CRREL
January 25, 1979 Susquehanna River at ConklinThe USGS reported backwater from ice on the Susquehanna River atConklin. The water discharge was 17,000 cubic feet per second, gage
height was 15.70 ft.CRREL
February 26, 1979 Susquehanna River at ConklinThe USGS reported an ice jam on the Susquehanna River at Conklin,
NY. The water discharge was 14,000 cubic feet per second, gageheight was 11.04 ft.
CRREL
March 28, 1992 Susquehanna River at Conklin
An ice jam caused the river to back up just above Conklin, NY.Flooding was reported around the Alta Road area. Flood stage at 11.0ft. and observed stage at 11.9 ft. - at 11 ft. Riverside Yards started to
flood.
CRREL
February 22, 1994 Susquehanna River at Conklin
An ice jam on the Susquehanna River in the vicinity of Kirkwoodcaused rapid rises on the river in Conklin and Kirkwood. The river rose
over 1.5 feet. The ice jam on the Kirkwood-Conklin bridge broke upbut a lot of ice was still in the river.
CRREL
March 23, 1994 Susquehanna River at ConklinAn ice jam developed on the Susquehanna River in the Town of
Conklin. Minor flooding was reported near River Boulevard.CRREL
January 19, 1996 Susquehanna River at ConklinNWS reported an ice jam on the Susquehanna River near Conklin, NYcausing river levels to rise. Rising water levels resulted in flooding of
fields and yards.CRREL
January 19, 1996 Tioughnioga River at Itaska No reference and/or no damage reported. CRREL
January 19, 1996 Tioughnioga River at Itaska No reference and/or no damage reported. CRREL
January 20, 1996 Susquehanna River at WindsorMaximum gage height of 21.22ft due to an ice jam at USGS gagingstation 01502731 Susquehanna River at W indsor, NY. The average
daily discharge was 40,000cfs.CRREL
January 31, 1997Chenango River at Chenango
Forks
Minor backwater has been reported as a result of one minor ice jamlocated on the Chenango River below the confluence of theTioughnioga River. Water continues to flow through the jam.
CRREL
March 3, 2004Chenango River at Chenango
Forks
NWS reported that some ice movement and jamming was causingbackwater near the Chenango Forks stream gage. The flood stagethere is 10 feet and the stage at 200 PM was 9.8 feet, with minor
flooding beginning at 10 feet.
CRREL
March 4, 2004Chenango River at Chenango
Bridge
The NWS reported a large ice jam on the Chenango River inChenango Bridge, NY on March 4, 2004. The ice jam was reported just
west of the Route 12A Bridge and was causing flooding to low lyingareas on the north side of the river. Two businesses were evacuated.The water raised high enough to flood the Chenango Commons GolfCourse and Polar Cap Ice Rink. The ice moved out by late afternoon,
CRREL
SECTION 5.4.1: RISK ASSESSMENT – FLOOD
DMA 2000 Hazard Mitigation Plan Update – Broome County, New York 5.4.1-28February 2013
Date River / Location Description Source(s)
March 4th, relieving the region of ice jam flooding.
January 27, 2005Chenango River at
Dickinson/Binghamton
The NWS reported that freeze-up ice accumulations on the ChenangoRiver from the Binghamton City line up through Chenango Bridge toPort Crane was restricting flow on the river and causing backwater
effect. These effects were visible at the USGS gage Chenango Rivernear Chenango Forks some 3.5 miles upstream from Port Crane. TheNWS predicted that minor flooding might occur - that is, water might
rise briefly out of bank, causing basement flooding, but not lifethreatening.
CRREL
March 15, 2007 Susquehanna River at Corbettsville
The NWS in Binghamton NY issued a Flood Statement for theSusquehanna River in Broome County, NY and Susquehanna County,PA. Heavy rain and melting snow caused several area rivers to flood,and river ice to move and form a significant jam at Corbettsville NY.
The stage was 13.0 feet; flood stage is 11.0 feet. Minor flooding wasoccurring and moderate flooding was forecast, with an anticipatedcrest Friday morning at 13.0-13.5 feet. The river level at the jam,
located just upstream from the USGS gage #01503000 at Conklin NY,was reported to be about 5 feet higher, which was causing significantflooding from Corbettsville to Great Bend, PA. Several residences inthe immediate river flood plain in NY had been evacuated due to theflooding. At 4 PM Friday, the stage at Conklin was 12.9 feet, with the
river forecast to fall below flood stage late Saturday afternoon. At 8 PMSaturday, the stage was 10.9 feet, cancelling the flood warning. Theice jam was still in place, however, which could cause fluctuations in
the water level, and some localized flooding in the flood plain near theriver.
CRREL
February 12, 2009 Chenango River at Chenango No reference and/or no damage reported. CRREL
February 12, 2009 Chenango River at Chenango No reference and/or no damage reported. CRREL
February 12, 2009 Susquehanna River at Conklin
Flooding occurred along the Susquehanna River, in the vicinity ofRoute 11, due to an ice jam, requiring the evacuation of at least one
home. Warm temperatures and rain over the previous days, promptedrunoff into the river, resulting in river ice running and jamming. The
hydrograph of USGS gage at Conklin NY, #01503000, indicates thatthe stage rose to about 11.6 feet, above the flood stage of 11.0 ft.
CRREL
March 7, 2011 Susquehanna River at Windsor
Heavy rain prompted river runs across northern New England, withnumerous ice jams across the region. The Susquehanna River
jammed causing the stage at W indsor NY to be just above the 17.0 ftflood stage, at 17.2 ft. At a stage of 17.0 ft, minor flooding begins in theWindsor area affecting low lying and agricultural areas. The stage had
CRREL
SECTION 5.4.1: RISK ASSESSMENT – FLOOD
DMA 2000 Hazard Mitigation Plan Update – Broome County, New York 5.4.1-29February 2013
Date River / Location Description Source(s)
risen to 18.3 ft with minor flooding occurring and moderate floodingforecast.
Source: CRREL, 2012Note: Although many events were reported for Broome County, information pertaining to every event was not easily ascertainable; therefore this table may not represent all ice
jams in the County.
SECTION 5.4.1: RISK ASSESSMENT – FLOOD
DMA 2000 Hazard Mitigation Plan Update – Broome County, New York 5.4.1-30February 2013
National Flood Insurance Program
The U.S. Congress established the NFIP with the passage of the National Flood Insurance Act of 1968(FEMA’s 2002 National Flood Insurance Program (NFIP): Program Description). The NFIP is aFederal program enabling property owners in participating communities to purchase insurance as aprotection against flood losses in exchange for State and community floodplain management regulationsthat reduce future flood damages. As stated in the NYS HMP, the NFIP collects and stores a vastquantity of information on insured structures, including the number and location of flood insurancepolicies, number of claims per insured property, dollar value of each claim and aggregate value of claims,repetitive flood loss properties, etc. NFIP data presents a strong indication of the location of flood eventsamong other indicators (NYSDPC, 2008).
There are three components to NFIP: flood insurance, floodplain management and flood hazard mapping.Nearly 20,000 communities across the U.S. and its territories participate in the NFIP by adopting andenforcing floodplain management ordinances to reduce future flood damage. In exchange, the NFIPmakes federally backed flood insurance available to homeowners, renters, and business owners in thesecommunities. Community participation in the NFIP is voluntary. Flood insurance is designed to providean alternative to disaster assistance to reduce the escalating costs of repairing damage to buildings andtheir contents caused by floods. Flood damage is reduced by nearly $1 billion a year throughcommunities implementing sound floodplain management requirements and property owners purchasingof flood insurance. Additionally, buildings constructed in compliance with NFIP building standardssuffer approximately 80 percent less damage annually than those not built in compliance (FEMA, 2008).
NFIP data for Broome County is presented further in Table 5.4.1-11 in the Vulnerability Assessmentsection of this profile.
As an additional component of NFIP, the Community Rating System (CRS) is a voluntary incentiveprogram that recognizes and encourages community floodplain management activities that exceed theminimum NFIP requirements. As a result, flood insurance premium rates are discounted to reflect thereduced flood risk resulting from the community actions meeting the three goals of the CRS: (1) reduceflood losses; (2) facilitate accurate insurance rating; and (3) promote the awareness of flood insurance(FEMA, 2012).
Probability of Future Events
Given the history of flood events that have impacted Broome County, it is apparent that future flooding ofvarying degrees will occur. The fact that the elements required for flooding exist and that major floodinghas occurred throughout the county in the past suggests that many people and properties are at risk fromthe flood hazard in the future.
It is estimated that Broome County will continue to experience direct and indirect impacts of floodsannually. Table 5.4.1-4 summarizes the occurrences of winter storm events and their annual occurrence(on average).
Table 5.4.1-4. Occurrences of Flood Events in Broome County, 1956 - 2011
Event TypeTotal Number
of Occurrences
Annual Number ofEvents
(average)
Flash Flood 67 1.2
Urban Flood 4 0.07
Flood 61 1.1
SECTION 5.4.1: RISK ASSESSMENT – FLOOD
DMA 2000 Hazard Mitigation Plan Update – Broome County, New York 5.4.1-31February 2013
Event TypeTotal Number
of Occurrences
Annual Number ofEvents
(average)
Total: 132 2.4Source: NOAA-NCDC, 2011Note: On average, Broome County experiences 2.4 flood events each year.
In Section 5.3, the identified hazards of concern for Broome County were ranked. The probability ofoccurrence, or likelihood of the event, is one parameter used for hazard rankings. Based on historicalrecords and input from the Planning Committee, the probability of occurrence for flood in the County isconsidered ‘Frequent’ (likely to occur within 25 years, as presented in Table 5.3-6).
The Role of Global Climate Change on Future Probability
Climate change is beginning to affect both people and resources in New York State, and these impacts areprojected to continue growing. Impacts related to increasing temperatures and sea level rise are alreadybeing felt in the State. ClimAID: the Integrated Assessment for Effective Climate Change in New YorkState (ClimAID) was undertaken to provide decision-makers with information on the State’s vulnerabilityto climate change and to facilitate the development of adaptation strategies informed by both localexperience and scientific knowledge (New York State Energy Research and Development Authority[NYSERDA], 2011).
Each region in New York State, as defined by ClimAID, has attributes that will be affected by climatechange. Broome County is part of Region 3, Southern Tier. Some of the issues in this region, affected byclimate change, include: dairy dominates agricultural economy, milk production losses projected,Susquehanna River flooding increases and Region 3 was one of the first areas of New York State hit byinvasive insects, weeds, and other pests moving north (NYSERDA, 2011).
Temperatures are expected to increase throughout the state, by 1.5 to 3ºF by the 2020s, 3 to 5.5ºF by the2050s and 4 to 9ºF by the 2080s. The lower ends of these ranges are for lower greenhouse gas emissionsscenarios and the higher ends for higher emissions scenarios. Annual average precipitation is projected toincrease by up to five-percent by the 2020s, up to 10-percent by the 2050s and up to 15-percent by the2080s. During the winter months is when this additional precipitation will most likely occur, in the formof rain, and with the possibility of slightly reduced precipitation projected for the late summer and earlyfall. Table 5.4.1-5 displays the projected seasonal precipitation change for the Southern Tier ClimAIDRegion (NYSERDA, 2011).
Table 5.4.1-5. Projected Seasonal Precipitation Change in Region 3, 2050s (% change)
Winter Spring Summer Fall
+5 to +15 0 to +10 -5 to +5 -10 to +5
Source: NYSERDA, 2011
The projected increase in precipitation is expected to fall in heavy downpours and less in light rains. Theincrease in heavy downpours has the potential to affect drinking water; heighten the risk of riverineflooding; flood key rail lines, roadways and transportation hugs; and increase delays and hazards relatedto extreme weather events (NYSERDA, 2011).
Increasing air temperatures intensify the water cycle by increasing evaporation and precipitation. Thiscan cause an increase in rain totals during events with longer dry periods in between those events. Thesechanges can have a variety of effects on the State’s water resources (NYSERDA, 2011).
SECTION 5.4.1: RISK ASSESSMENT – FLOOD
DMA 2000 Hazard Mitigation Plan Update – Broome County, New York 5.4.1-32February 2013
Over the past 50 years, heavy downpours have increased and this trend is projected to continue. This cancause an increase in localized flash flooding in urban areas and hilly regions. Flooding has the potentialto increase pollutants in the water supply and inundate wastewater treatment plants and other vulnerablefacilities located within floodplains. Less frequent rainfall during the summer months may impact theability of water supply systems. Increasing water temperatures in rivers and streams will affect aquatichealth and reduce the capacity of streams to assimilate effluent wastewater treatment plants (NYSERDA,2011).
Figure 5.4.1-5 displays the project rainfall and frequency of extreme storms in New York State. Theamount of rain fall in a 1% annual chance (100-year) event is projected to increase, while the number ofyears between such storms (return period) is projected to decrease. Rainstorms will become more severeand more frequent (NYSERDA, 2011).
Figure 5.4.1-5. Projected Rainfall and Frequency of Extreme Storms
Source: NYSERDA, 2011
Total precipitation amounts have slightly increased in the Northeast U.S., by approximately 3.3 inchesover the last 100 years. There has also been an increase in the number of two-inch rainfall events over a48-hour period since the 1950s (a 67-percent increase). The number and intensity of extremeprecipitation events are increasing in New York State as well. More rain heightens the danger oflocalized flash flooding, streambank erosion and storm damage (DeGaetano et al [Cornell University],2010).
Broome County Early Demonstration Project
This project includes Flood Risk MAP products for Broome County communities that include: the City ofBinghamton, the Towns of Union and Vestal, and the Villages of Johnson City and Endicott. The desiredoutcomes of this project is to improve the community risk understanding, especially after the levee de-accreditation, through the usage of Risk MAP projects; and to engage the community in specific areas ofmitigation interest, focusing in the area that the City of Binghamton has planned for urban development.According to the preliminary maps and re-studied flooding sources, this area is now part of the SpecialFlood Hazard Area (SFHA). The Susquehanna and Chenango Rivers are identified as flooding sources inthis study.
SECTION 5.4.1: RISK ASSESSMENT – FLOOD
DMA 2000 Hazard Mitigation Plan Update – Broome County, New York 5.4.1-33February 2013
SECTION 5.4.1: RISK ASSESSMENT – FLOOD
DMA 2000 Hazard Mitigation Plan Update – Broome County, New York 5.4.1-34February 2013
VULNERABILITY ASSESSMENT
To understand risk, a community must evaluate what assets are exposed or vulnerable in the identifiedhazard area. For the flood hazard, areas identified as hazard areas include the 1% and 0.2% (100- and500-year) floodplains. The following text evaluates and estimates the potential impact of flooding inBroome County including:
Overview of vulnerability Data and methodology used for the evaluation Impact on: (1) life, safety and health, (2) general building stock, (3) critical facilities and
infrastructure, (4) economy and (5) future growth and development Effect of climate change on vulnerability Change of vulnerability as compared to that presented in the 2007 Broome County Hazard Mitigation
Plan Further data collections that will assist understanding of this hazard over time
Overview of Vulnerability
All types of flooding can cause widespread damage throughout rural and urban areas, including but notlimited to: water-related damage to the interior and exterior of buildings; destruction of electrical andother expensive and difficult-to-replace equipment; injury and loss of life; proliferation of disease vectors;disruption of utilities, including water, sewer, electricity, communications networks and facilities; loss ofagricultural crops and livestock; placement of stress on emergency response and healthcare facilities andpersonnel; loss of productivity; and displacement of persons from homes and places of employment(Foster, Date Unknown).
The flood hazard including riverine, dam failure, ice jams, and flash flooding, is a major concern forBroome County. To assess vulnerability, potential losses were calculated for the County for riverineflooding for 1% and 0.2% annual chance flood events. Historic loss data associated with ice jam eventsand dam failures is limited and as such impacts and losses are examined in light of historical informationavailable and are treated similar to flash flood events. The Broome County flood hazard exposure andloss estimate analysis is presented below.
Data and Methodology
The 1- and 0.2-percent annual chance flood events were examined to evaluate Broome County’s risk andvulnerability to the flood hazard. These flood events are generally those considered by planners andevaluated under federal programs such as the NFIP.
The HAZUS-MH version 2.1 riverine flood model was used to estimate Broome County’s estimatedpotential losses. HAZUS-MH applies engineering and scientific risk calculations that have beendeveloped by hazard and information technology experts to provide defensible damage and loss estimates.These methodologies are accepted by FEMA and provide a consistent framework for assessing risk acrossa variety of hazards. The GIS framework also supports the evaluation of hazards and assessment ofinventory and loss estimates for these hazards. HAZUS-MH can serve as a basis to quantify risk and toallocate limited resources for prioritization of mitigation projects. Refer to the Methodology section ofthis Plan for further details on HAZUS-MH.
SECTION 5.4.1: RISK ASSESSMENT – FLOOD
DMA 2000 Hazard Mitigation Plan Update – Broome County, New York 5.4.1-35February 2013
The HAZUS-MH flood model is designed for three levels of analysis. A Level 1 analysis is the simplesttype of analysis based on default data provided with the software. A Level 2 analysis provides a moretailored, accurate result using building attributes provided by the County. A Level 2 HAZUS-MHriverine flood analysis was performed for Broome County. For this update, the default general buildingstock in HAZUS-MH was updated and replaced with a custom inventory at the structure and aggregatelevel. The building inventory generated by FEMA and described in the Flood Risk Report (February2011) for the City of Binghamton, Village of Endicott, Village of Johnson City, Town of Union, andTown of Vestal was used. Tetra Tech updated the replacement cost values (structure and contents) usingRSMeans 2011 data. The inventory for the remainder of the County was developed using parcels and 911address points. The updated building inventory (76,634 buildings) was incorporated into the HAZUS-MH flood model as individual buildings. Examining risk at the individual building level versus runningthe model and reporting results at the aggregate level (Census block level as per the analysis provided inthe original Broome 2007 Hazard Mitigation Plan) provides more accurate potential loss estimates. Anupdated critical facility inventory was used in place of the HAZUS-MH defaults for essential facilitiesand utilities.
Broome County’s Flood Insurance Rate Maps (FIRMs) are currently being updated and the latest versionsare considered preliminary. Their preliminary Digital FIRMS (DFIRMs), considered the best availabledata, were used for analysis. A 3-meter Digital Elevation Model (DEM) and the preliminary DFIRMdatabase, both provided by the County, were used to develop the estimated 1-percent and 0.2-percentannual chance depth grids. The depth grids were integrated into HAZUS-MH and the model was run toestimate potential losses.
The HAZUS-MH model uses 2000 U.S. Census demographic data. This data was not updated for thisanalysis due to technical availability; however, the 2010 U.S. Census data was used to estimatepopulation exposure to provide the best available output. In addition, to estimate exposure, thepreliminary DFIRM flood boundaries were used. HAZUS-MH 2.1 calculated the estimated damages tothe general building stock and critical facilities based on the depth grid generated and the default HAZUSdamage functions in the flood model. Figure 5.4.1-6 illustrates the FEMA DFIRM flood boundaries usedfor this vulnerability assessment.
SECTION 5.4.1: RISK ASSESSMENT – FLOOD
DMA 2000 Hazard Mitigation Plan Update – Broome County, New York 5.4.1-36February 2013
Figure 5.4.1-6. Broome County DFIRM 1-Percent and 0.2-Percent Flood Zones
Source: Broome County GIS; FEMA, 2012
SECTION 5.4.1: RISK ASSESSMENT – FLOOD
DMA 2000 Hazard Mitigation Plan Update – Broome County, New York 5.4.1-37February 2013
Impact on Life, Health and Safety
The impact of flooding on life, health and safety is dependent upon several factors including the severityof the event and whether or not adequate warning time is provided to residents. Exposure represents thepopulation living in or near floodplain areas that could be impacted should a flood event occur.Additionally, exposure should not be limited to only those who reside in a defined hazard zone, buteveryone who may be affected by the effects of a hazard event (e.g., people are at risk while traveling inflooded areas, or their access to emergency services is compromised during an event). The degree of thatimpact will vary and is not strictly measurable.
To estimate the population exposed to the 1-percent and 0.2-percent annual chance flood events, theFEMA DFIRM floodplain boundaries were overlaid upon the 2010 Census population data in GIS (U.S.Census 2010). Census blocks do not follow the boundaries of the floodplain. The Census blocks that‘intersect’ in the flood boundaries were used to calculate the estimated population exposed to this hazard.Table 5.4.1-6 lists the estimated population located within the 1-percent and 0.2-percent flood zones bymunicipality.
Table 5.4.1-6. Estimated Broome County Population Vulnerable to the 1-Percent and 0.2-Percent Flood Hazards(2010 Census)
MunicipalityTotal
Population
Population inSFHA
(1% FloodBoundary)
PercentPopulation in 1%Flood Boundary
Population in0.2% FloodBoundary
PercentPopulation in0.2% FloodBoundary
Barker (T) 2,732 702 25.7 702 25.7
Binghamton (C) 47,376 11,387 24.0 15,043 31.8
Binghamton (T) 4,942 1,431 29.0 1,431 29.0
Chenango (T) 11,252 3,233 28.7 3,584 31.9
Colesville (T) 5,232 2,131 40.7 2,131 40.7
Conklin (T) 5,441 3,387 62.2 3,847 70.7
Deposit (V)* 819 480 58.6 583 71.2
Dickinson (T) 3,637 1,175 32.3 1,281 35.2
Endicott (V) 13,392 4,861 36.3 5,068 37.8
Fenton (T) 6,674 2,371 35.5 2,629 39.4
Johnson City (V) 15,174 2,521 16.6 3,096 20.4
Kirkwood (T) 5,857 2,724 46.5 2,828 48.3
Lisle (T) 2,431 1,378 56.7 1,378 56.7
Lisle (V) 320 149 46.6 149 46.6
Maine (T) 5,377 1,544 28.7 1,544 28.7
Nanticoke (T) 1,672 1,044 62.4 1,044 62.4
Port Dickinson (V) 1,641 1,051 64.0 1,242 75.7
Sanford (T)* 1,588 839 52.8 839 52.8
Triangle (T) 1,982 581 29.3 581 29.3
Union (T) 27,780 9,569 34.4 10,047 36.2
Vestal (T) 28,043 7,876 28.1 8,255 29.4
Whitney Point (V) 964 588 61.0 588 61.0
Windsor (T) 5,358 2,488 46.4 2,597 48.5
Windsor (V) 916 479 52.3 499 54.5
Broome County 200,600 63,989 31.9 70,986 35.4
Source: FEMA, 2012; U.S. Census, 2012Notes: SFHA = Special Flood Hazard Area; *The Town of Sanford population includes the area within the Broome County
boundary excluding the Village of Deposit. The U.S. Census 2010 Village of Deposit population of 1,663
SECTION 5.4.1: RISK ASSESSMENT – FLOOD
DMA 2000 Hazard Mitigation Plan Update – Broome County, New York 5.4.1-38February 2013
includes the area within both Broome and Delaware Counties. The 2010 population of the Village that is located onlyin Broome County is 819.
Of the population exposed, the most vulnerable include the economically disadvantaged and thepopulation over the age of 65. Economically disadvantaged populations are more vulnerable becausethey are likely to evaluate their risk and make decisions to evacuate based on the net economic impact totheir family. The population over the age of 65 is also more vulnerable because they are more likely toseek or need medical attention which may not be available due to isolation during a flood event and theymay have more difficulty evacuating.
Using 2000 U.S. Census data, HAZUS-MH 2.1 estimates the potential sheltering needs as a result of a 1-percent flood event. For the 1-percent flood event, HAZUS-MH 2.1 estimates 20,615 people will bedisplaced and 16,840 people will seek short-term sheltering, representing approximately 10% and 8% ofthe Broome County population, respectively. For the 0.2-percent flood event, HAZUS-MH 2.1 estimates27,232 people will be displaced and 22,909 people will seek short-term sheltering, representingapproximately 13.5% and 11% of the Broome County population, respectively. These statistics, bymunicipality, are presented in Table 5.4.1-7.
Table 5.4.1-7. Estimated Population Displaced or Seeking Short-Term Shelter from the 1% and 0.2% AnnualChance Flood Events
MunicipalityTotal Population
(2010 U.S. Census)
1% Event 0.2% Event
DisplacedPersons
PersonsSeeking Short-
Term ShelteringDisplacedPersons
PersonsSeeking
Short-TermSheltering
Barker (T) 2,732 160 78 170 85
Binghamton (C) 47,376 5,448 4,879 7,982 7,198
Binghamton (T) 4,942 17 0 25 1
Chenango (T) 11,252 727 539 940 709
Colesville (T) 5,232 347 159 380 174
Conklin (T) 5,441 1,723 1,501 2,149 1,877
Deposit (V) 819 186 128 251 191
Dickinson (T) 3,637 184 105 305 200
Endicott (V) 13,392 2,254 2,079 3,303 3,141
Fenton (T) 6,674 317 170 410 232
Johnson City (V) 15,174 631 466 1,101 864
Kirkwood (T) 5,857 467 277 547 357
Lisle (T) 2,431 156 23 163 25
Lisle (V) 320 87 54 87 54
Maine (T) 5,377 451 325 451 325
Nanticoke (T) 1,672 108 26 151 53
Port Dickinson (V) 1,641 410 355 624 557
Sanford (T) 1,588 95 6 103 6
Triangle (T) 1,982 104 41 104 41
Union (T) 27,780 3,194 2,614 3,752 3,159
Vestal (T) 28,043 2,817 2,584 3,479 3,214
Whitney Point (V) 964 322 255 322 255
Windsor (T) 5,358 260 95 275 108
SECTION 5.4.1: RISK ASSESSMENT – FLOOD
DMA 2000 Hazard Mitigation Plan Update – Broome County, New York 5.4.1-39February 2013
MunicipalityTotal Population
(2010 U.S. Census)
1% Event 0.2% Event
DisplacedPersons
PersonsSeeking Short-
Term ShelteringDisplacedPersons
PersonsSeeking
Short-TermSheltering
Windsor (V) 916 150 81 158 83
Broome County 200,600 20,615 16,840 27,232 22,909Source: HAZUS-MH 2.1Note: The population displaced and seeking shelter was calculated using the 2000 U.S. Census data (HAZUS-MH 2.1 default
demographic data). This data is considered appropriate given only the slight increase in population between 2000 and2010 (less than one-percent increase).
The total number of injuries and casualties resulting from typical riverine flooding is generally limitedbased on advance weather forecasting, blockades and warnings. Therefore, injuries and deathsgenerally are not anticipated if proper warning and precautions are in place. Ongoing mitigation effortsshould help to avoid the most likely cause of injury, which results from persons trying to cross floodedroadways or channels during a flood. Mitigation action items addressing this issue are included inSection 9 (Mitigation Strategies) of this plan.
All population in a dam failure inundation zone is considered exposed and vulnerable. Similar toriverine flooding, of the population exposed to dam failure and flash flooding, the most vulnerableinclude the economically disadvantaged and the population over the age of 65.
There is often limited warning time for dam failure and flash flooding. These events are frequentlyassociated with other natural hazard events such as earthquakes, landslides or severe weather, whichlimits their predictability and compounds the hazard. Populations without adequate warning of the eventare highly vulnerable to this hazard. Ongoing mitigation efforts including dissemination and earlywarning systems are noted in Section 9 (Mitigation Strategies) of this plan should help to avoid the mostlikely cause of injury, which results from persons trying to cross flooded roadways or channels during aflood.
Impact on General Building Stock
After considering the population exposed and vulnerable to the flood hazard, the built environment wasevaluated. Exposure in the flood zone includes those buildings located in the flood zone. Potentialdamage is the modeled loss that could occur to the exposed inventory, including structural and contentvalue.
The total land area located in the 1-percent and 0.2-percent a nnu a l c hanc e flood zones created forthis planning effort was calculated using preliminary DFIRM boundaries as noted earlier in this section.Refer to Table 5.4.1-8 below. To provide a general estimate of number of structures, parcels, andstructural/content replacement value exposure, the flood boundaries (1- and 0.2-percent annual chanceflood zones) were overlaid upon the County’s parcel and the updated building stock inventory pointshapefiles. The parcels that intersect the 1-percent and/or 0.2-percent annual chance flood zones weretotaled for each municipality. The total number of buildings with their centroid located in the 1-percentand 0.2-percent flood boundaries was also determined and the estimated building stock replacementvalue (structure and contents) was listed as well. Refer to Table 5.4.1-9 and Table 5.4.1-10 below forexposure estimates for Broome County.
SECTION 5.4.1: RISK ASSESSMENT – FLOOD
DMA 2000 Hazard Mitigation Plan Update – Broome County, New York 5.4.1-40February 2013
Table 5.4.1-8. Area Located in the 1-Percent and 0.2-Percent Annual Chance Flood Boundaries
Source: Broome County, 2012; Tetra Tech, 2012Notes: % = Percent; RCV = Replacement cost value
SECTION 5.4.1: RISK ASSESSMENT – FLOOD
DMA 2000 Hazard Mitigation Plan Update – Broome County, New York 5.4.1-43February 2013
In addition to total building stock modeling, individual data available on flood policies, claims,Repetitive Loss Properties (RLP) and severe RLP (SRLs) were analyzed. FEMA Region 2 provided alist of residential properties with NFIP policies, past claims and multiple claims (RLPs). According tothe metadata provided: “The (sic National Flood Insurance Program) NFIP Repetitive Loss Filecontains losses reported from individuals who have flood insurance through the Federal Government. Aproperty is considered a repetitive loss property when there are two or more losses reported whichwere paid more than $1,000 for each loss. The two losses must be within 10 years of each other & beas least 10 days apart. Only losses from (sic since) 1/1/1978 that are closed are considered.”
SRLs were then examined for the County. According to section 1361A of the National FloodInsurance Act, as amended (NFIA), 42 U.S.C. 4102a, an SRL property is defined as a residentialproperty that is covered under an NFIP flood insurance policy and:
Has at least four NFIP claim payments (including building and contents) over $5,000 each, andthe cumulative amount of such claims payments exceeds $20,000; or
For which at least two separate claims payments (building payments only) have been made withthe cumulative amount of the building portion of such claims exceeding the market value of thebuilding.
For both of the above, at least two of the referenced claims must have occurred within any 10-year period, and must be greater than 10 days apart.
Table 5.4.1-11 and Figure 5.4.1-7 summarize the NFIP policies, claims and repetitive loss statistics forBroome County. According to FEMA, the following summarizes the occupancy classes of the 318repetitive loss properties in Broome County: 232 single-family residences; 20 two-to-four familyresidences; five condominiums; 23 other residential buildings; and 38 non-residential buildings (FEMARegion 2, 2012). This information is current as of May 31, 2012.
The location of the properties with policies, claims and repetitive and severe repetitive flooding weregeocoded by FEMA with the understanding that there are varying tolerances between how closely thelongitude and latitude coordinates correspond to the location of the property address, or that the indicationof some locations are more accurate than others.
Figure 5.4.1-7 indicates the repetitive loss areas within the County. Information regarding the locationsof the NFIP policies and claims is cataloged at the County.
SECTION 5.4.1: RISK ASSESSMENT – FLOOD
DMA 2000 Hazard Mitigation Plan Update – Broome County, New York 5.4.1-44February 2013
Table 5.4.1-11. NFIP Policies, Claims and Repetitive Loss Statistics
Johnson City (V) 322 187 $14,415,601 23 1 157 51 114
Kirkwood (T) 83 196 $7,107,908 11 3 40 14 29
Lisle (T) 11 3 $11,826 0 0 0 0 11
Lisle (V) 4 1 $7,958 0 0 1 0 3
Maine (T) 30 21 $634,263 0 0 11 0 19
Nanticoke (T) 8 2 $54,735 1 0 0 1 7
Port Dickinson (V) 24 13 $363,306 0 0 8 12 4
Sanford (T) 40 13 $179,767 1 0 3 2 35
Triangle (T) 0 0 $0 0 0 0 0 0
Union (T) 493 476 $22,028,465 60 23 274 53 166
Vestal (T) 578 412 $23,254,448 47 4 344 74 160
Whitney Point (V) 11 3 $36,457 0 0 2 2 7
Windsor (T) 42 46 $1,252,712 5 0 5 0 37
Windsor (V) 17 10 $113,624 1 0 1 0 16
Broome County 3,040 2,741 $128,154,915 318 57 626 370 2,044
Source: FEMA Region 2, 2012(1) Policies, claims, repetitive loss and severe repetitive loss statistics provided by FEMA Region 2, and are current as of May 31, 2012.
SECTION 5.4.1: RISK ASSESSMENT – FLOOD
DMA 2000 Hazard Mitigation Plan Update – Broome County, New York 5.4.1-45February 2013
Please note the total number of repetitive loss properties includes the severe repetitive loss properties. The number of claims represents the number of claims closedby May 31, 2012.
(2) Total building and content losses from the claims file provided by FEMA Region 2.(3) The policies inside and outside of the flood zones is based on the latitude and longitude provided by FEMA Region 2 in the policy file.FEMA noted that where there is more than one entry for a property, there may be more than one policy in force or more than one GIS possibility.
SECTION 5.4.1: RISK ASSESSMENT – FLOOD
DMA 2000 Hazard Mitigation Plan Update – Broome County, New York 5.4.1-46February 2013
Figure 5.4.1-7. NFIP Repetitive Loss Areas
Source: Broome County GIS; FEMA Region 2, 2012
SECTION 5.4.1: RISK ASSESSMENT – FLOOD
DMA 2000 Hazard Mitigation Plan Update – Broome County, New York 5.4.1-47February 2013
As discussed in the Previous Occurrences and Losses subsection, Broome County experienced extensivedamages as a result of the September 2011 flood event. NYSEG, a gas and electric company that servicesBroome County, mapped the flood inundation in their service area as a result of the September 2011 event(Figure 5.4.1-9). The flood inundation area exceeded the 100- and 500-year flood boundaries in someareas, specifically along the Susquehanna River and its tributaries in the Villages of Endicott and JohnsonCity, Towns of Chenango, Fenton and Union and City of Binghamton.
According to USDA Farm Service Agency (FSA), the County Executive Director, in conjunction with thepartnering agencies and FSA County Committee, analyzes and files loss reports on behalf of agriculturalproduces after USDA disaster declarations. In addition, FSA provides low-interest emergency loans ifneeded and administers the Emergency Conservation Program (ECP). Specific monetary lossesassociated with the USDA disasters could not be disclosed; however, Table 5.4.1-4 in the PreviousOccurrences and Losses section summarizes these disasters and when crop losses were experienced inBroome County (USDA, 2012).
From 2007 to 2012, the only ECP projects cost-shared by the FSA were following the Tropical Storm Leeflooding. These projects consisted of debris removal or erosion filling on crop fields. In addition, USDAhas assisted farmers with crop insurance claims or issues. In 2011, losses included over 65-acres ofdamaged/destroyed corn and vegetables. Refer to Figure 5.4.1-8 for the locations of the ECP projects andwhere crop losses occurred in the fall of 2011.
Figure 5.4.1-8. 2011 USDA Assistance to Agricultural Producers in Broome County
Source: USDA, 2012
SECTION 5.4.1: RISK ASSESSMENT – FLOOD
DMA 2000 Hazard Mitigation Plan Update – Broome County, New York 5.4.1-48February 2013
Figure 5.4.1-9. Flood Inundation in the NYSEG Service Area from the 2011 Flood Event
Source: Broome County GIS
SECTION 5.4.1: RISK ASSESSMENT – FLOOD
DMA 2000 Hazard Mitigation Plan Update – Broome County, New York 5.4.1-49February 2013
Impact on Critical Facilities
In addition to considering general building stock at risk, the risk of flood to critical facilities, utilities anduser-defined facilities was evaluated. HAZUS-MH was used to estimate the flood loss potential to criticalfacilities exposed to the flood risk. Using depth/damage function curves, HAZUS estimates the percent ofdamage to the building and contents of critical facilities. Table 5.4.1-12 lists the critical facilitiesand utilities located in the FEMA flood zones and the percent damage HAZUS-MH 2.1 estimates tothe facility as a result of the 1% and 0.2% events.
In cases where short-term functionality is impacted by a hazard, other facilities of neighboringmunicipalities may need to increase support response functions during a disaster event. Mitigationplanning should consider means to reduce impact to critical facilities and ensure sufficient emergency andschool services remain when a significant event occurs. Actions addressing shared services agreementsare included in Section 9 (Mitigation Strategies) of this plan.
SECTION 5.4.1: RISK ASSESSMENT – FLOOD
DMA 2000 Hazard Mitigation Plan Update – Broome County, New York 5.4.1-50February 2013
Table 5.4.1-12. Critical Facilities Located in the 1-Percent and 0.2-Percent Annual Chance Flood Boundaries and Estimated Potential Damage
Name Municipality Type
ExposurePotential Loss from
1% Flood EventPotential Loss from0.2% Flood Event
1%Event
0.2%Event
PercentStructureDamage
PercentContentDamage
Days to100-
Percent(2)
PercentStructureDamage
PercentContentDamage
Days to100-
Percent(2)
Chenango Forks Barker (T) Fire Station X - - - 0.0 0.0 NA
Our Lady of Lourdes Hospital Binghamton (C) Medical X - - - 0.0 0.0 NA
City of Binghamton Headquarter Binghamton (C) Fire Station X - - - 1.9 2.2 480
City of Binghamton Engine 4 Binghamton (C) Fire Station X X 10.2 24.4 480 12.7 58.7 630
City Training Center/MechanicsFacility
Binghamton (C) Fire Station X X 24.5 98.8 720 34.2 100.0 720
Macarthur School Binghamton (C) School X X 6.2 33.8 480 9.0 59.8 480
East MS Binghamton (C) School X X 1.1 5.9 480 7.4 41.3 480
American Legion Post 1645 Binghamton (C) Poll X X 0.0 0.0 NA 5.8 37.4 NA
Binghamton City Hall Binghamton (C) Historic X - - NA 0.0 0.0 NA
Catholic Charities Binghamton (C) Poll X X 10.5 66.4 NA 14.0 86.5 NA
Community Center Binghamton (C) Poll X X 0.0 0.0 480 7.9 57.9 NA
Ross Park Carousel Binghamton (C) Historic X X 0.0 0.0 NA 6.7 46.0 NA
South Washington St ParabolicBridge
Binghamton (C) Historic X X 80.3 100.0 NA 88.3 100.0 NA
Southview Post Office Binghamton (C) Post Office X - - NA 1.6 9.6 NA
DOT Facility Govt. Plaza Binghamton (C) DOT X - - NA 0.0 0.0 NA
DOT Facility Frederick St. Binghamton (C) DOT X X 5.4 4.9 NA 32.5 38.0 NA
BC Veterans Memorial Arena Binghamton (C) Shelter X - - NA 0.0 0.0 NA
SUSQUEHANNA RIVER INTAKE Binghamton (C) Potable Water X X 40.0 - NA 40.0 - NA
Kattelville Athletic Chenango (T) Poll X - - NA 3.2 19.3 NA
NORTHGATE WELL Chenango (T) Potable Water X X 1.7 - NA 12.0 - NA
PENNVIEW WELL Chenango (T) Potable Water X X 0.9 - NA 4.6 - NA
ROUTE 12A WELL Chenango (T) Potable Water X X 40.0 - NA 40.0 - NA
Northgate WWTP Chenango (T) WWTF X - - NA 1.8 - NA
SECTION 5.4.1: RISK ASSESSMENT – FLOOD
DMA 2000 Hazard Mitigation Plan Update – Broome County, New York 5.4.1-51February 2013
Name Municipality Type
ExposurePotential Loss from
1% Flood EventPotential Loss from0.2% Flood Event
1%Event
0.2%Event
PercentStructureDamage
PercentContentDamage
Days to100-
Percent(2)
PercentStructureDamage
PercentContentDamage
Days to100-
Percent(2)
Nineveh Post Office Colesville (T) Post Office X X 6.5 44.0 480 13.5 78.3 NA
Nineveh Public Library Colesville (T) Library X X 0.0 0.0 NA 4.7 28.3 NA
Ouaquaga Lenticular Truss Bridge Colesville (T) Historic X X 25.1 100.0 NA 35.6 100.0 NA
WELL #1 Colesville (T) Potable Water X X 0.5 NA 3.6 NA
Conklin Station 1 Conklin (T) Fire Station X 480 4.8 5.5 480
Conklin Community Center Conklin (T) Poll X X 12.2 71.5 NA 14.0 88.8 NA
Conklin Town Hall Conklin (T) Poll X NA 0.0 0.0 NA
Town of Conklin Highway Garage Conklin (T) Public Works X NA 2.8 2.5 NA
Susquehanna Valley High School Conklin (T) Shelter X NA 0.0 0.0 NA
CREEK BRIAR PATCH WELL (#2) Conklin (T) Potable Water X X 3.8 NA 24.2 NA
CREEK ROAD WELL (#3) Conklin (T) Potable Water X X 7.9 NA 32.8 NA
WELL #5 Conklin (T) Potable Water X X 40.0 NA 40.0 NA
WELL #6 Conklin (T) Potable Water X X 40.0 NA 40.0 NA
WELL #1 Conklin (T) Potable Water X NA 0.0 NA
Deposit Fire (1) Deposit (V) Fire Station X NA NA NA NA
Deposit Ambulance (1) Deposit (V) Ambulance X NA NA NA NA
Village of Deposit Police Deposit (V) Police X X 9.3 17.0 480 12.3 56.4 630
Deposit Free Library Deposit (V) Library X X 0.0 0.0 NA 15.6 100.0 NA
Deposit Post Office Deposit (V) Post Office X X 0.0 0.0 NA 18.9 100.0 NA
Deposit Village Hall Deposit (V) Municipal Hall X X 1.0 5.8 NA 11.2 68.7 NA
Sanford Town Hall Deposit (V) Poll X X 0.0 0.0 NA 16.4 100.0 NA
State Theater Deposit (V) Historic X X 0.0 0.0 NA 9.8 64.4 NA
WELL #1 Deposit (V) Potable Water X X 2.5 NA 17.5 NA
WELL #2 Deposit (V) Potable Water X X 1.3 NA 3.0 NA
SECTION 5.4.1: RISK ASSESSMENT – FLOOD
DMA 2000 Hazard Mitigation Plan Update – Broome County, New York 5.4.1-52February 2013
Name Municipality Type
ExposurePotential Loss from
1% Flood EventPotential Loss from0.2% Flood Event
1%Event
0.2%Event
PercentStructureDamage
PercentContentDamage
Days to100-
Percent(2)
PercentStructureDamage
PercentContentDamage
Days to100-
Percent(2)
WELL #4 Deposit (V) Potable Water X X 3.4 NA 15.2 NA
WELL #5 Deposit (V) Potable Water X X 3.0 - NA 12.9 - NA
Village of Deposit WWTP Deposit (V) WWTF X - - NA 26.1 - NA
Sheriff's Office Dickinson (T) Police X - - - 0.0 0.0 NA
Sunrise Terrace Community Center Dickinson (T) Poll X - - - 0.0 0.0 NA
Nimmonsburg United MethodistChurch
Dickinson (T) Shelter X X 6.5 27.1 - 11.8 38.6 -
Union Volunteer ES Endicott (V) Ambulance X X 5.8 6.7 480 11.8 51.8 480
JENNIE F. SNAPP MS Endicott (V) School X X 9.3 65.2 630 11.6 70.6 630
Central Methodist Church Endicott (V) Poll X X 7.1 50.4 NA 13.7 80.3 NA
Endicott Square Deal Arch Endicott (V) Historic X X 11.0 68.0 NA 14.0 87.2 NA
Union Presbyterian ChurchEducation Bldg
Endicott (V) Poll X X 9.9 64.6 NA 14.0 85.6 NA
Central United Methodist Church Endicott (V) Shelter X X 3.6 13.5 NA 6.3 26.2 NA
Holy Nativity Lutheran Church Endicott (V) Shelter X X 6.9 28.8 NA 12.4 39.9 NA
WELL #28 Endicott (V) Potable Water X X 40.0 - NA 40.0 - NA
WELL #32, RANNEY Endicott (V) Potable Water X X 28.5 - NA 40.0 - NA
WELL #5 Endicott (V) Potable Water X X 40.0 - NA 40.0 - NA
Village of Endicott WWTP Endicott (V) WWTF X - - NA 27.1 - NA
DOT Facility Rte 369 Fenton (T) DOT X - - NA 0.0 0.0 NA
WELL #6, BURNS STREET Johnson City (V) Potable Water X - - NA 1.4 - NA
WELL #7, NORTH BROAD ST. Johnson City (V) Potable Water X - - NA 2.4 - NA
Five Mile Point Station 1 Kirkwood (T) Fire Station X X 8.0 12.2 480 11.3 43.9 480
Kirkwood Post Office Kirkwood (T) Post Office X - - NA 0.0 0.0 NA
Kirkwood Town Hall Kirkwood (T) Poll X - - NA 0.0 0.0 NA
Town of Kirkwood Highway Garage Kirkwood (T) Public Works X X 34.5 42.0 NA 45.4 57.8 NA
SECTION 5.4.1: RISK ASSESSMENT – FLOOD
DMA 2000 Hazard Mitigation Plan Update – Broome County, New York 5.4.1-53February 2013
Name Municipality Type
ExposurePotential Loss from
1% Flood EventPotential Loss from0.2% Flood Event
1%Event
0.2%Event
PercentStructureDamage
PercentContentDamage
Days to100-
Percent(2)
PercentStructureDamage
PercentContentDamage
Days to100-
Percent(2)
WELL #1, MIDDLE WELL Kirkwood (T) Potable Water X X 40.0 - NA 40.0 - NA
WELL #2, SOUTH WELL Kirkwood (T) Potable Water X X 2.9 - - 19.3 - NA
WELL #3, NORTH WELL Kirkwood (T) Potable Water X X 40.0 - - 40.0 - NA
Killawog Post Office Lisle (T) Post Office X X 3.5 21.2 - 11.5 69.6 NA
WELL #1 Lisle (T) Potable Water X X 23.7 - 40.0 - NA
Lisle Free Library Lisle (V) Library X X 3.5 21.2 - 11.6 69.7 NA
Lisle Post Office Lisle (V) Post Office X X 0.0 0.0 - 7.7 56.5 NA
SOUTH WELL #1 Maine (T) Potable Water X X 3.4 - - 22.2 - NA
Glen Aubrey Nanticoke (T) Fire Station X X 4.5 5.2 480 10.7 31.7 480
NYS Police Endwell Barracks Union (T) Police X X 0.0 0.0 NA 5.0 5.7 480
Johnson City YMCA Union (T) Poll X X 3.4 20.2 - 11.4 69.1 NA
Washingtonian Hall Union (T) Historic X X 4.6 27.4 - 13.5 78.3 NA
West Endicott Park Carousel Union (T) Historic X X 14.7 96.6 - 20.9 100.0 NA
WELL #2, SOUTH OF PLANT Union (T) Potable Water X - - - 31.2 - NA
WELL #3, NORTH OF PLANT Union (T) Potable Water X - - - 11.4 - NA
WELL #5, FIFTH STREET Union (T) Potable Water X X 9.0 - - 34.0 - NA
Vestal Company 1 Vestal (T) Fire Station X X 21.7 94.0 630 29.2 100.0 720
Vestal Volunteer ES Vestal (T) Ambulance X X 27.8 100.0 720 39.3 100.0 720
Drovers Inn Vestal (T) Historic X X 14.3 93.1 - 17.8 100.0 NA
Rounds House Vestal (T) Historic X X 14.7 97.4 - 18.9 100.0 NA
Vestal Center Methodist Church Vestal (T) Poll X X 0.0 0.0 - 0.0 0.0 NA
Grace Episcopal Church Whitney Point (V) Historic X X 3.0 17.8 - 11.0 67.9 NA
Mary Wilcox Memorial Library Whitney Point (V) Library X X 5.0 30.1 - 13.0 74.0 NA
Triangle Town Hall Whitney Point (V) Poll X X 7.6 54.8 - 13.9 81.8 NA
SECTION 5.4.1: RISK ASSESSMENT – FLOOD
DMA 2000 Hazard Mitigation Plan Update – Broome County, New York 5.4.1-54February 2013
Name Municipality Type
ExposurePotential Loss from
1% Flood EventPotential Loss from0.2% Flood Event
1%Event
0.2%Event
PercentStructureDamage
PercentContentDamage
Days to100-
Percent(2)
PercentStructureDamage
PercentContentDamage
Days to100-
Percent(2)
Whitney Point Post Office Whitney Point (V) Post Office X X 3.8 22.6 - 11.8 70.3 NA
WELL PW-1 Whitney Point (V) Potable Water X X 29.3 - - 40.0 - NA
WELL PW-2 Whitney Point (V) Potable Water X X 27.1 - - 40.0 - NA
WELL PW-3 Whitney Point (V) Potable Water X X 23.4 - - 40.0 - NA
WELL #1, BEHIND GARAGE Windsor (V) Potable Water X X 5.0 - - 29.9 - NA
WELL #2, ACROSS CREEK Windsor (V) Potable Water X X 1.8 - - 13.1 - NA
Source: HAZUS-MH 2.1Note: C = City; NA = Not available; T = Town; V = Village
- = No loss calculated by HAZUS-MH 2.1X = Facility located within the DFIRM boundary.
Please note it is assumed the wells have electrical equipment and openings are three-feet above grade.(1) The Village of Deposit fire and ambulance facilities are located within the 0.2% flood boundary; however these facilities are located outside of the BroomeCounty boundary and therefore estimated potential losses were not calculated.(2) HAZUS-MH 2.1 provides a general indication of the maximum restoration time for 100% operations. Clearly, a great deal of effort is needed to quicklyrestore essential facilities to full functionality; therefore this will be an indication of the maximum downtime (HAZUS-MH 2.1 User Manual).(3) In some cases, a facility may be located in the DFIRM flood hazard boundary; however HAZUS did not calculate potential loss. This may be because thedepth of flooding does not amount to any damages to the structure according to the depth damage function used in HAZUS for that facility type.
SECTION 5.4.1: RISK ASSESSMENT – FLOOD
DMA 2000 Hazard Mitigation Plan Update – Broome County, New York 5.4.1-55February 2013
Impact on the Economy
For impact on economy, estimated losses from a flood event are considered. Losses include but are notlimited to general building stock damages, agricultural losses, business interruption, impacts to tourismand tax base to Broome County. Damages to general building stock can be quantified using HAZUS-MH as discussed above. Other economic components such as loss of facility use, functional downtimeand social economic factors are less measurable with a high degree of certainty. For the purposes of thisanalysis, general building stock damages are discussed further.
Flooding can cause extensive damage to public utilities and disruptions to the delivery of services. Lossof power and communications may occur; and drinking water and wastewater treatment facilities may betemporarily out of operation. Flooded streets and road blocks make it difficult for emergency vehicles torespond to calls for service. Floodwaters can wash out sections of roadway and bridges (Foster, DateUnknown).
Direct building losses are the estimated costs to repair or replace the damage caused to the building. Thepotential damage estimated to the general building stock inventory associated with the 1-percent flood isapproximately $1.3 billion which represents approximately 3-percent of the County’s overall totalgeneral building stock inventory. The potential damage estimated to the general building stockinventory associated with the 0.2-percent flood is approximately $2 billion, or nearly 5-percent of theTown’s total building inventory. These dollar value losses to the County’s total building inventoryreplacement value, in addition to damages to roadways and infrastructure, would greatly impact the localeconomy.
HAZUS-MH estimates the amount of debris generated from the flood events as a result of 1- and 0.2-percent events. The model breaks down debris into three categories: 1) finishes (dry wall, insulation,etc.); 2) structural (wood, brick, etc.) and 3) foundations (concrete slab and block, rebar, etc.). Thedistinction is made because of the different types of equipment needed to handle the debris. Table 5.4.1-13 summarizes the debris HAZUS-MH 2.1 estimates for these events.
Table 5.4.1-13. Estimated Debris Generated from the 1-Percent and 0.2-Percent Flood Events
Broome County 236,615 69,407 95,262 71,946 380,316 97,658 161,972 120,686
Source: HAZUS-MH 2.1
Effect of Climate Change on Vulnerability
Climate is defined not simply as average temperature and precipitation but also by the type, frequencyand intensity of weather events. Both globally and at the local scale, climate change has the potential toalter the prevalence and severity of extremes such as flood events. While predicting changes of floodevents under a changing climate is difficult, understanding vulnerabilities to potential changes is a criticalpart of estimating future climate change impacts on human health, society and the environment (U.S.Environmental Protection Agency [EPA], 2006).
The 2011 ‘Responding to Climate Change in New York State’ report was prepared for New York StateEnergy Research and Development Authority to study the potential impacts of global climate change onNew York State. According to the synthesis report, heavy rains are increasing and are projected toincrease further. Increased frequency and intensity of rainfall may lead to increased flooding and relatedimpacts on water quality, infrastructure, and agriculture in the State as noted earlier in this section(NYSERDA, 2011).
Change of Vulnerability
At the time of the original 2007 HMP, the FEMA Q3 flood zone data was identified as the mostcomprehensive flood polygon data for the study region. U.S. Geologic Survey (USGS) Digital ElevationModel (DEM) data were obtained and used as the base elevation and the hydrology and floodplaindelineation was performed in HAZUS-MH. Potential losses estimates were generated at the Census-blocklevel.
For this plan update, Broome County’s Flood Insurance Rate Maps (FIRMs) are currently being updatedwith the best available flood hazard area being the preliminary DFIRMs which were used for thisvulnerability assessment. A higher-resolution (3-meter) Digital Elevation Model (DEM) and thepreliminary DFIRM database, both provided by the County, were used to develop the estimated 1-percentand 0.2-percent annual chance depth grids. The depth grids were integrated into HAZUS-MH and the
SECTION 5.4.1: RISK ASSESSMENT – FLOOD
DMA 2000 Hazard Mitigation Plan Update – Broome County, New York 5.4.1-57February 2013
model was run to estimate potential losses at the structure level utilizing the custom building inventorydeveloped for this plan update.
Differences in exposure and potential losses estimated from the 2007 HMP and update is mainly due tothe difference in flood hazard boundary data, building stock inventory and methodology used for the riskassessment. For example, the 2007 HMP building inventory structural replacement value (based on 2006RSMeans) is half that of the updated building inventory used for this HMP update (based on 2011RSMeans).
The county-wide 2007 HMP 1-percent flood event building potential loss estimate (all occupancies,structure and contents) was $232,646,500. As noted, this estimate was generated by a Census block-levelanalysis. This HMP update estimates potential losses using individual structures and is reported as suchin Table 5.4.1-10. However, to compare apples to apples, if 1-percent potential losses were generated atthe Census-block level using the updated building inventory, the loss estimate is $2,284,918,000. Figure5.4.1-10 illustrates the difference between the Q3 hazard areas and the preliminary DFIRM flood hazardboundaries.
SECTION 5.4.1: RISK ASSESSMENT – FLOOD
DMA 2000 Hazard Mitigation Plan Update – Broome County, New York 5.4.1-58February 2013
Figure 5.4.1-10. Comparison of the Q3 and Preliminary DFIRM Hazard Areas
Source: Broome GIS
SECTION 5.4.1: RISK ASSESSMENT – FLOOD
DMA 2000 Hazard Mitigation Plan Update – Broome County, New York 5.4.1-59February 2013
Future Growth and Development
As discussed in Section 4, areas targeted for future growth and development have been identified acrossthe County. Any areas of growth could be potentially impacted by the flood hazard if located withinthe identified hazard areas. Figure 5.4.1-11 illustrates the identified areas of potential newdevelopment in relation to the flood boundaries. It is the intention of the County to discouragedevelopment in vulnerable areas or to encourage higher regulatory standards on the local level.
SECTION 5.4.1: RISK ASSESSMENT – FLOOD
DMA 2000 Hazard Mitigation Plan Update – Broome County, New York 5.4.1-60February 2013
Figure 5.4.1-11. Potential New Development and Flood Boundaries
Source: Broome GIS; FEMA Preliminary DFIRMs
SECTION 5.4.1: RISK ASSESSMENT – FLOOD
DMA 2000 Hazard Mitigation Plan Update – Broome County, New York 5.4.1-61February 2013
Additional Data and Next Steps
A HAZUS-MH riverine flood analysis was conducted for Broome County using the most current andbest available data including updated building and critical facility inventories, preliminary DFIRMs andthree- meter DEM. For future plan updates, more accurate exposure and loss estimates can be producedby replacing the national default demographic inventory with 2010 U.S. Census data when it becomesavailable in the HAZUS-MH model. As Assessor databases continue to be updated, the buildinginventory should also be maintained.
FEMA’s Risk Mapping, Assessment, and Planning (Risk MAP) will be providing the flood depth andanalysis grids as part of the publicly available DFIRM deliverable for the entire County and multiplereturn periods. Once these depth grids are available, they can be incorporated into HAZUS and usedto recalculate the potential losses to the County’s inventory for these recurrence intervals.
Specific mitigation actions addressing improved data collection and further vulnerability analysis isincluded in Section 9 (Mitigation Strategies) of this plan