Evaluation of the Ohio PLAY Project August 28, 2015 Marilyn Espe-Sherwindt David Gothard Brianne Buletko Georgie Stoner Abbie McCauley CSP904215 Ohio Department of Developmental Disabilities Family Child Learning Center Akron Children’s Hospital
Transcript
0
Evaluation of the Ohio PLAY Project August 28, 2015
Marilyn Espe-Sherwindt
David Gothard Brianne Buletko Georgie Stoner
Abbie McCauley
CSP904215
Ohio Department
of
Developmental
Disabilities
Family Child Learning Center Akron Children’s Hospital
1
INTRODUCTION TO THE REPORT
The purpose of this evaluation study, as requested by the Ohio Department of Developmental
Disabilities, has been to evaluate the implementation of the PLAY Project training model and its impact
on children and families across the state of Ohio. The original RFP issued in July 2014 defined the
following three areas as the evaluation focus:
1. The context and background of the PLAY Project model and training:
a. Rise of incidence of Autism Spectrum Disorder (ASD) over the last two decades.
b. Summary of the latest research on effective intervention strategies for toddlers diagnosed
with ASD.
c. The history of the PLAY Project and its implementation in Ohio.
d. Factors that impact implementation/adoption of new intervention approaches.
2. Utilization of the PLAY Project model and training:
a. Who was trained?
b. Who continues to use the PLAY Project model and what defining characteristics are
associated with continued utilization?
c. Number of families served and identification of potentially underserved populations.
d. Factors that contribute to ongoing implementation of the PLAY Project model.
e. Factors that inhibit the ongoing implementation of the PLAY Project model.
3. Effectiveness of the PLAY Project model and training per ratings of:
a. Family self-confidence and competence and continuing use of PLAY strategies over time.
b. Early intervention service provider self-confidence and competence and continuing use of
PLAY strategies over time.
c. Administrator perceptions.
Context and background of the
PLAY Model and Training
INCREASING INCIDENCE OF AUTISM SPECTRUM DISORDER
Autism Spectrum Disorder (ASD) is the fastest growing developmental disorder in the United States.
Currently, one out of every 68 children has been identified with ASD (CDC, 2015), and the prevalence
has more than doubled since 2002. Reliability studies of the Autism and Developmental Disabilities
Monitoring (ADDM) Network tracking system found that while reliable, the numbers are likely a bit low
– which suggests the prevalence could be higher than 1 out of 68 (CDC, 2015).
The Centers for Disease Control and Prevention have evaluated the tracking system used to estimate the
prevalence of ASDs. These validation studies have identified some very important findings: (1) The
tracking system is likely not over-estimating the prevalence of ASD; (2) Most children found to have an
ASD by a clinical examination were also detected by the tracking system; (3) Since the CDC tracking
2
system missed 12 of 177 children who were examined and found to have an ASD, it is likely that some
children with ASD are being missed in the count; (4) ASD occurs in all racial, ethnic, and socioeconomic
groups, but is almost five times more common among boys than among girls; and (5) More children than
ever before are being diagnosed with ASD. It is unclear how much of this increase is due to a broader
definition of ASD and better efforts in diagnosis versus an actual increase in incidence; the rising number
of children diagnosed with ASD is likely due to a combination of these factors (CDC, 2015).
Table 1. Prevalence of ASD.
Retrieved July 10, 2015, from http://www.cdc.gov/ncbddd/autism/data.html
The latest research suggests that signs of autism appear early, and that parents of children with ASD
often become concerned before their child’s first birthday (CDC, 2015). A diagnosis of ASD can often be
made before age 2 (even as early as 14 months), and a diagnosis of ASD in toddlers has been shown to
be stable, valid and reliable (Kleinman et al., 2008; Lord et al., 2006).
RESEARCH ON EFFECTIVE INTERVENTION MODELS FOR TODDLERS WITH ASD
In 2001, the US Department of Education asked the National Research Council (NRC) to convene a
group, called the Committee on Educational Interventions for Children with Autism, to look at the
scientific evidence behind effective early educational programs for young children (through age 8) with
ASDs. The Committee reviewed the evidence available at the time and made the following
recommendations for educating young children with ASD:
• Intervention begins early
• Intervention is intensive in hours
• Families are actively involved
• Staff are highly trained and specialized in autism
• Ongoing objective assessment of progress is included
(2) Fidelity. Fidelity refers to the degree to which the model or practice is implemented in the new
setting as intended (Harn, Parisi & Stoolmiller, 2013). The evidence has repeatedly shown that higher
fidelity is associated with better outcomes, and even an evidence-based practice is likely to fail if
implemented without fidelity (Franks, n.d.; Melnyk & Fineout-Overhold, 2012; Welsh, 2012). Important
questions then emerge:
What level of fidelity is high enough?
What components are critical and what components, if any, can be adapted or omitted without
impacting outcomes?
Is there a fidelity threshold beyond which “more” fidelity does not lead to even better
outcomes?
How is fidelity maintained over time in order to prevent “drift”? (Harn et al., 2013; Kelly, 2012;
Welsh, 2012).
(3) Intervention practices v. implementation practices. Dunst and colleagues (2009, 2010, 2012, 2013)
make the distinction between intervention practices and implementation practices. Intervention
practices -- in this case the PLAY model – are the “methods and strategies used by intervention agents
6
(e.g., teachers, clinicians, parent educators, etc.) to produce desired outcomes in a targeted population”
(p. 68). On the other hand, implementation practices include “the methods used to teach or train others
to use evidence-based intervention practices” with fidelity (p. 68). Why is this distinction important?
Dunst and Trivette (2009) emphasize that “no intervention practice, no matter what its evidence base,
is likely to be adopted if the methods and strategies used to teach or train . . . practitioners . . . are not
themselves effective” (p. 164).
In their meta-analysis of implementation research, Dunst and Trivette (2012) identified three
features/six characteristics of effective adult learning methods:
Planning
o Introduce: Engage the learner in a preview of the material, knowledge or practice.
o Illustrate: Demonstrate the use of the practice to the learner.
Application
o Practice: Engage the learner in multiple
opportunities to use the material, knowledge or
practice.
o Evaluate: Engage the learner in a process of
evaluating the consequences of their application
of the practice.
Deep understanding
o Reflection: Engage the learner in self-assessment
of progress as a basis for identifying “next
steps.”
o Mastery: Engage the learner in assessing his experience/strengths/weaknesses
compared to some external set of criteria or conceptual framework.
In other words, effective implementation practices (the methods used to train others in EBP) are
characterized by
o Active learner involvement;
o Demonstrations of the practices;
o Multiple opportunities to use the practices;
o Repeated instructor/coach-learner interactions that
o Provide feedback, guidance and support (the more immediate, the better); and
o Promote learner reflection on and self-assessment of mastery (Dunst et al., 2013).
“The more actively involved learners were in mastering new knowledge and practice, and the more instructors or trainers supported and facilitated the learning process, the better were the learner outcomes” (Dunst & Trivette, 2012,p. 85).
7
The evaluation framework
Kirkpatrick (1994) has proposed a useful four-level training
evaluation model which we have used in previous
program evaluations: 1) Reactions; 2) Learning; 3)
Transfer; and 4) Results. This evaluation model
proposes that evaluation of training should begin with
Level One, and, over time, move sequentially through
the remaining levels. The results of each level in turn
Reaction evaluation is how the participants felt, and their personal reactions to the training or learning experience, for example: Did the trainees like and enjoy the training? Did they consider the training relevant? Was it a good use of their time? Did they like the venue, the style, etc? Level of participation. Ease and comfort of experience. Level of effort required to make the most of the learning. Perceived practicability and potential for applying the learning.
2. LEARNING
Learning evaluation is the measurement of the increase in knowledge or intellectual capability from before to after the learning experience: Did the trainees learn what was intended to be taught? Did the trainee experience what was intended for them to experience? What is the extent of advancement or change in the trainees after the training, in the direction or area that was intended?
3. TRANSFER
Behaviour evaluation is the extent to which the trainees applied the learning and changed their behaviour, and this can be immediately and several months after the training, depending on the situation: Did the trainees put their learning into effect when back on the job? Were the relevant skills and knowledge used? Was there noticeable and measurable change in the activity and performance of the trainees when back in their roles? Was the change in behavior and new level of knowledge sustained? Would the trainee be able to transfer their learning to another person? Is the trainee aware of the change in behavior, knowledge, skill level? To what extent did the trainee implement what was taught with fidelity?
4. RESULTS/ IMPACTS
Results evaluation is the effect on the agency or environment resulting from the improved performance of the trainee - it is the acid test. Measures would typically be organizational key performance indicators and feedback from consumers.
Between October 2014 and December 2014, we scheduled multiple phone calls and meetings with the
Ohio Department of Developmental Disabilities, OCALI, and staff from the PLAY Project in Ann Arbor in
order to:
Understand the history of the Ohio PLAY Project;
Identify the changes in the training itself that have evolved over the four training cohorts;
Locate the various types and sources of data that could be available to us;
Obtain existing data and databases from DODD, OCALI and the PLAY Project in Ann Arbor;
Examine the databases to determine what’s available/missing/nonexistent; and
Finalize our research questions and methodology.
We learned much from this initial exploration:
The PLAY training has been constantly evolving, with changes in certification timelines and
requirements.
Data is housed in three different places (DODD, OCALI, and PLAY in Ann Arbor).
Consistent data collection and data entry have at times been challenging due to the growth and
staffing changes for the PLAY Project staff in Ann Arbor.
Our first step (upon which rested the success of any subsequent step) was to design a master database
that was valid, reliable, and as complete as possible:
Identify the components of the database (independent and dependent variables previously
described).
Reconcile the existing databases (Ann Arbor and OCALI) into the master database.
“Clean up” any data that might be “messy” (for example, a column from an Excel spreadsheet
that contains multiple variables rather than a single variable).
Identify any additional missing current data: Where is it? Can we have access to it?
Our second step was to design the electronic surveys and telephone interview/focus group protocols.
The questions in both the surveys and interview protocols gathered information regarding the relevant
independent and dependent variables. Our target groups included Certified PLAY Consultants,
Consultants-in-Training, Consultants-No-Longer-Active, families, Administrators/Supervisors, and the
10
five Ohio PLAY supervisors. (A copy of each survey and interview protocol can be found in Appendix A.)
The table below describes each target group and how we planned to collect the information.
Target Group Method Description
Certified PLAY Consultants Online survey 52 questions (closed and open-ended)
Consultants-in-Training Online survey 53 questions (closed and open-ended)
Consultants-No-Longer-Active
Online survey Version 1: 53 questions (closed and open-ended) Version 2: 16 questions (closed and open-ended)
Families Telephone interview 36 questions
Administrators/Supervisors Online survey 53 questions (closed and open-ended)
Ohio PLAY Supervisors Telephone interview 15 open-ended questions
Certified and Consultants-in-Training
Virtual focus group as part of June 5 work day
10 open-ended questions
Our third step was data collection.
Online surveys. We identified and contacted via email four groups of training participants (Certified,
In-Training, No-Longer-Active, and Administrators/Supervisors) based on the information/databases
kept by OCALI and the PLAY Project. The email contained a description of the evaluation project, a
description of the online survey, and each group’s specific SurveyMonkey link. We sent an average
of three emails (initial plus follow-up reminders) to each group.
Families. In order to have as unbiased a family sample as possible, we asked
administrators/supervisors (rather than the trainees) to identify and recruit families for us to
interview. Once we received the contact info for the family, we attempted to contact them via their
preferred method (email or phone) to schedule a phone interview and recorded their responses
online in SurveyMonkey.
We sent regular email updates to the Administrators/Supervisors, thanking them for their ongoing
support during the data collection process.
We held a “virtual” focus group with five PLAY Consultants attending the June 5 workday in
Columbus.
We interviewed each of the five Ohio PLAY Supervisors individually by telephone.
By the end of the data collection process, our total sample (surveys, interviews and focus group)
included 159 perspectives:
Ohio professionals: 121
o Surveys: 116 responses
o Focus group: 5 participants
Ohio families: 33
Ohio PLAY Supervisors: 5
11
The information represented PLAY experiences in 47 counties, as can be seen in the figure below.
The typical or “average” response rate to an online survey is approximately 33% (Fincham, 2008; Watt,
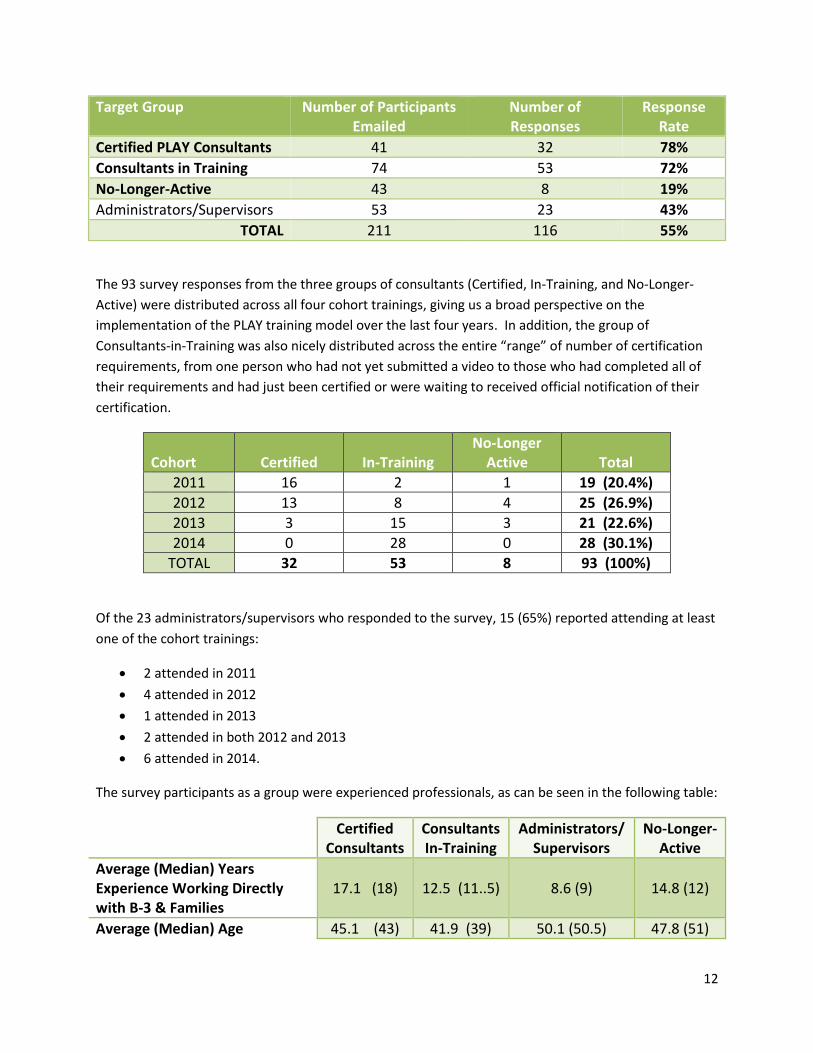
Simpson, McKillop, & Nunn, 2002). In contrast, our response rate to the online surveys (with the
exception of the No-Longer-Active group) was quite strong, ranging from 43% to 78%. Given that the
No-Longer-Active group had either chosen or been asked to leave the certification process, their
comparatively low response rate was not surprising to us. The table on the next page describes each
survey target group, number of potential participants, number of responses, and response rate.
12
Target Group Number of Participants Emailed
Number of Responses
Response Rate
Certified PLAY Consultants 41 32 78%
Consultants in Training 74 53 72%
No-Longer-Active 43 8 19%
Administrators/Supervisors 53 23 43%
TOTAL 211 116 55%
The 93 survey responses from the three groups of consultants (Certified, In-Training, and No-Longer-
Active) were distributed across all four cohort trainings, giving us a broad perspective on the
implementation of the PLAY training model over the last four years. In addition, the group of
Consultants-in-Training was also nicely distributed across the entire “range” of number of certification
requirements, from one person who had not yet submitted a video to those who had completed all of
their requirements and had just been certified or were waiting to received official notification of their
certification.
Cohort Certified In-Training No-Longer
Active Total
2011 16 2 1 19 (20.4%)
2012 13 8 4 25 (26.9%)
2013 3 15 3 21 (22.6%)
2014 0 28 0 28 (30.1%)
TOTAL 32 53 8 93 (100%)
Of the 23 administrators/supervisors who responded to the survey, 15 (65%) reported attending at least
one of the cohort trainings:
2 attended in 2011
4 attended in 2012
1 attended in 2013
2 attended in both 2012 and 2013
6 attended in 2014.
The survey participants as a group were experienced professionals, as can be seen in the following table:
Certified Consultants
Consultants In-Training
Administrators/ Supervisors
No-Longer-Active
Average (Median) Years Experience Working Directly with B-3 & Families
17.1 (18) 12.5 (11..5) 8.6 (9) 14.8 (12)
Average (Median) Age 45.1 (43) 41.9 (39) 50.1 (50.5) 47.8 (51)
13
Certified Consultants
Consultants In-Training
Administrators/ Supervisors
No-Longer-Active
Educational Level
Bachelor’s
Bachelor’s + some graduate
Master’s
Working toward doctorate
Doctorate
16.7% 13.3%
63.3% 6.7%
0.0%
34.8% 13.0%
50.0% 2.2%
25.0% 20.0%
45.0% 10.0%
0.0%
60.0% 0.0%
20.0% 20.0%
0.0%
Discipline
Education
Speech Pathology
Occupational Therapy
Physical Therapy
Social Work
Nursing
Other*
65.5% 10.3% 10.3% 0.0% 3.4% 0.0%
10.3%
66.7% 8.9% 2.2% 0.0% 6.7% 0.0%
15.6%
63.2% 0.0%
10.5% 0.0%
15.8% 5.3% 5.3%
50.0% 16.7% 0.0% 0.0%
33.3% 0.0% 0.0%
*Other primarily included respondents who categorized themselves as Developmental Specialists or Early Intervention Specialists rather than a specific discipline.
In order to identify families to be interviewed, we emailed administrators/supervisors and asked them
to provide us with the names of families who had agreed to be interviewed as part of this evaluation.
We specifically invited the administrators/supervisors to reach out not only to families who were
positive about PLAY, but also to families who might have either declined or chosen to leave PLAY at
some point. We received names and contact information for 39 families, and were able to reach and
interview 35 families, representing 16 counties; due to their own time constraints, one of the 35 families
completed the questions online rather than through the telephone interview. In addition, one of the 35
families had experienced intervention from two different PLAY Consultants, and volunteered to respond
to the questions twice, since her experiences were different between the two consultants.
Twenty-seven of the 35 families, or 77%, reported that their child had received a formal diagnosis prior
to starting PLAY: 74.1% of the children had received a diagnosis of ASD, followed by 11% with a
language delay, 11% with developmental delay, and 4% other.
The family members interviewed were primarily mothers (91.4%), but we also talked with two fathers
and one foster mother. The average age of the interviewees was 34.7 years, and their educational
backgrounds were quite diverse, as can be seen in the table on the next page.
14
Our fourth step was the data analysis itself.
A. Quantitative methods: The data from the online surveys were imported into SPSSv23.0 software for
analysis purposes. Descriptive statistics for numeric measures included mean (SD), median, and
minimum to maximum range values. If interval values were reported, e.g., 2-3 years of supervisory
experience, then the median value was imputed, i.e., 2.5 years of supervisory experience. For
truncated or right-censored numeric data, e.g., age over 60 years, the largest known value was
imputed, i.e., age 60 years. Frequencies and percentages per non-missing data were presented for
categorical measures. Responses were summarized for each survey question both overall and also
by cohort when samples sizes permitted in order to determine consistency of the responses across
the training cohorts. (Complete quantitative results are presented in Appendix B.)
In our initial proposal, we also had planned to look closely at the amount of time needed to
complete submission milestones to determine if the changes being made by the PLAY Project across
cohorts were having an impact on certification completion rate. By applying Kaplan-Meier curves to
the participant/ submissions database provided by the PLAY Project, we hoped to determine
whether or not the rate of video or other submissions counting toward the requirement of 20 total
submissions was progressing more rapidly for the more recently trained cohorts. However, as we
looked more closely at the existing PLAY data, we observed several factors that made that database
unreliable: (1) a number of trainees were regarded as certified but yet were found to have had
fewer than the 20 submissions recorded in the database; (2) inaccuracies or missing data regarding
the order of submissions and the time they were completed made it impossible to determine the
rate of completion; and (3) measurement of the date of certification was recorded only by year
rather than month/year, which made it impossible to determine whether the participants attained
20.1%
17.1%
17.1%
22.8%
5.7%
17.1%
Educational background of family members interviewed
Less than high school degree
Completed high school or GED
Some college or further training
Two-year degree
Four-year degree
Some graduate school
Master's degree or higher
0.0% (Less than high school)
15
certification within the allotted two year interval based on the PLAY database. For these reasons
the effects of recent changes on the format of submissions are unfortunately indeterminable.
B. Qualitative methods were used to analyze responses to the open-ended items from the electronic
surveys and phone interview protocols. Content analysis was used to identify, code and categorize
transcriptions of the interview data to help us understand more deeply the independent variables,
the dependent variables, and the connections among them (Lincoln & Guba, 1985; Patton, 1990).
The critical qualitative issue of trustworthiness was addressed through six methodological strategies
(Brantlinger, et al., 2005; Lincoln & Guba, 1985; Patton, 1990): 1) Triangulation, i.e., collecting data
from multiple sources at multiple times using multiple methods; 2) Investing sufficient time during
data collection; 3) Collaborative work, i.e., more than one person collecting and analyzing; 4) Peer
debriefings between the collaborators; 5) “Thick description,” i.e., presenting solid descriptive data
in the results so that readers can make their own judgments about the transferability of the data;
and 6) Formal member checks, i.e., the process of sharing data, findings and interpretations with the
participants so that they can provide feedback on the credibility and accuracy of the findings and
interpretations (which we did during the June 5 focus group, with some Consultants-in-Training, and
during the telephone interviews with the Ohio PLAY supervisors).
The evaluation findings
THE PROCESS OF BEING TRAINED
Choosing PLAY. Early in the online surveys we asked an open-ended question of participants: I
participated in this PLAY opportunity because . . . As we
analyzed and coded the responses, we saw the same patterns
emerging in both the Certified Consultants and the
Consultants-in-Training groups. The majority of responses
fell into two categories: expand my expertise and better
serve families with children on the spectrum. Less frequently
identified reasons were wanted to know more about PLAY,
the fact that the training was free, and supervisor
suggestion/directive. Several participants explained that they
saw this as a chance to shift their model of early intervention
– a shift from ABA or from an eclectic, less planful approach
to early intervention. The majority of
Administrators/Supervisors reported that they encouraged
their staff to participate in the PLAY Project with the intention of lessening the gap in ASD services in
their community.
Participant evaluations of the four-day training. At the end of the initial four-day PLAY Project training,
participants were asked to complete an evaluation form. The evaluation forms for the 2011-2013
cohorts were almost identical, while the evaluation form for the 2014 cohort changed significantly.
“I WANTED TO PROVIDE A SPECIFIC
INTERVENTION METHOD THAT
WAS A TOTAL PACKAGE. PRIOR TO
THE PLAY PROJECT, I FELT LIKE I
TOOK BITS AND PIECES OF
DIFFERENT INTERVENTION
APPROACHES OR WAS TEACHING
SPECIFIC PLAY SCHEMES.”
16
“I have never been to a seminar in which
the speakers so obviously cared at a human
level and also had mastered research
techniques. This inspired me at the ‘heart’
and ‘head’ level. I feel that I came to this as
a ‘good player’, but now I have a
framework and words to describe my
approach.”
Participants in the 2011, 2012, and 2013 cohorts were asked to rate the training. Evaluation items
focused on participant satisfaction with the overall PLAY Project model, the explanation of PLAY
components, the training materials provided, assessment measures reviewed, and video reviews.
Participants were also asked to rate their perceptions of the overall
training experience e.g., usefulness/relevance to their work, quality
of discussions, etc. Participants rated each of these items on a 1-5
Likert scale. The 2014 participant evaluation form focused to an
even greater extent on participant satisfaction, and the format was
quite different from previous cohorts. Examples of items included:
“How would you rate the quality of the information presented?”,
“Was the training well organized?”, and “Was the presented
material current?” In 2014 the Likert scale responses were not anchored with numbers, but used
statements only (e.g., Excellent, Satisfactory, Unsatisfactory, Poor).
Recommended practice suggests that Likert scale statements be consistent across questions. This was
the case with the evaluation forms for the three 2011-13 cohorts. On the other hand, the 2014 Likert
scale statements varied from question to question (e.g., some questions used an Excellent-Poor
continuum, while other questions used a Strongly Agree-Strongly Disagree continuum). In addition,
some of the questions had responses on a positive-negative continuum (e.g., Excellent as the first point
on the scale), while other questions had responses on a negative-positive continuum (e.g., Strongly
Disagree as the first point on the scale), also inconsistent with recommended practice: although the
questions themselves can be a combination of positive and negative statements, the response options
should consistently remain positivenegative or negativepositive.
Regardless of the changes in the surveys, participant ratings of the individual items remained favorable
across cohorts. Also, when asked if they would recommend the training, 86.5% of participants
responded positively (range 84%-91%), with recommendation rates increasing each year the training
was offered. The high ratings suggest that the majority of
the participants were satisfied with the training. In
addition, participants were asked two open-ended
questions regarding their suggestions/comments and if
they would provide a testimonial. Examination of these
open-ended comments revealed similar themes across
cohorts. Regardless of the training year, the majority of
comments fell into these themes:
The quality of training was excellent and I was
grateful to attend.
The content of the PLAY Project will be applicable
to my work with children and families.
Compliments to the PLAY Project staff.
I’m looking forward to getting started.
17
The information from the four-day participant evaluation forms answers the first question posed by
Kirkpatrick (1994): Did they like it? Clearly the answer is YES, and that they were excited and inspired by
the four-day training. But what did they learn and how well did they learn it? Although we did see
training objectives listed on the PLAY Project website, we are unsure if specific learner objectives were
provided for participants. The participant evaluation forms did not contain any mention or
measurement of participant learning objectives, nor could we find specific learning objectives in the
manual handouts. Learner objectives describe what participants are expected to learn as a result of the
training and are an essential component in thorough evaluation. Without their inclusion in training
evaluation efforts, it is difficult to draw meaningful conclusions about the effectiveness of training
beyond participant satisfaction.
Reflecting back on the four-day training. In the online surveys, participants were asked to think back to
the initial PLAY training and the extent to which the training provided a foundation to be successful in
their PLAY Project knowledge and delivery. Administrators/Supervisors were confident in the
foundation the training provided their staff, as were the Certified Consultants, who were trained
primarily in the first two Ohio cohorts. However, the Consultants-in-Training, trained primarily in the last
two Ohio cohorts, were less sure about the foundation provided in four specific areas: knowing how to
choose families, knowing how to explain PLAY methods/techniques to families, knowing how to
structure a home visit, and knowing what to do between visits.
Looking back, I think the initial training by the PLAY Project gave me the foundation I needed to be successful in . . .
Administrators/Supervisors (N=15) Yes
Knowing how to complete the certification requirements 100%
Knowing how to choose families that are a match for the PLAY model 93.3%
Knowing how to profile a child 100%
Knowing how to choose PLAY methods/techniques to fit a specific child
100%
Knowing how to explain PLAY methods/techniques to families 100%
Knowing how to structure a home visit 93.3%
Knowing what to do between visits 93.3%
Certified Consultants (N=32) Yes
Knowing how to complete the certification requirements 96.9%
Knowing how to choose families that are a match for the PLAY model 90.6%
Knowing how to profile a child 96.9%
Knowing how to choose PLAY methods/techniques to fit a specific child
90.6%
Knowing how to explain PLAY methods/techniques to families 93.8%
Knowing how to structure a home visit 90.6%
Knowing what to do between visits 88%
18
Consultants-in-Training (N=53) Yes
Knowing how to complete the certification requirements 94.3%
Knowing how to choose families that are a match for the PLAY model 81.1%
Knowing how to profile a child 94.3%
Knowing how to choose PLAY methods/techniques to fit a specific child
94.3%
Knowing how to explain PLAY methods/techniques to families 81.1%
Knowing how to structure a home visit 75.5%
Knowing what to do between visits 77.4%
Spending time in the certification process. Given the number of requirements, the PLAY certification
process can be lengthy. We asked questions about the length of time it took/is taking to become
certified, whether or not the participants were given an extension, and their perceptions of how long it
was taking them. The length of time it took for Certified Consultants to complete the process varied
widely, ranging from 8 months to 39 months, with the average being 19.3 months. Almost two-thirds of
them had NOT required an extension in order to finish. The length of time it was taking Consultants-in-
Training naturally varied by cohort. Those trained in the earliest cohorts had been working on their
certification for more than two years, while the 2014 cohort had been working on their certification for
8 months. Whether or not a Consultant-in-Training had received an extension also naturally varied by
date of cohort: the earlier the cohort, the more likely it was that the consultant had been given an
extension. Eight percent of the Consultants-in-Training group were unsure if they had been given an
extension or not.
The table below describes the groups’ perceptions of the length of time they had spent or were
spending in the certification process. Clearly membership in the various cohorts affected the perception
of time. A large proportion of the Certified group and a majority of the Consultants-in-Training reported
a larger time investment than they had anticipated.
How would you describe the length of time it took/is taking?
Certified In-Training
2011 2012 2013 Total 2011-2012
2013 2014 Total
Longer than I expected 38% 54% 41% 100% 73% 37% 60%
About what I expected 62% 38% 100% 56% 27% 41% 29%
Less time than I expected 8% 3% 22% 11%
The administrators/supervisors responded similarly, with 41% perceiving that the certification process
took longer than expected, 54.5% feeling that it was about what they expected, and only one person
thought it was taking less time than expected.
Juggling their time during the certification process. The process of submitting a video/report for review
requires several steps following a home visit: sitting down to review the video, writing the report, and
19
then submitting the video/report to the PLAY supervisor. We were interested in how much time each of
those steps was taking.
Step One: The number of days that passed between the home visit and sitting down to review
the video/write the report. The range reported by both the Certified and the Consultants-in-
Training groups varied from the same or next day up to 30 days. The average number of days
that passed was 10.6 days for the Certified group and 11.8 days for the Consultants-in-Training,
and were similar across cohorts.
Step Two: The number of hours spent reviewing a video and writing the report. Both groups had
participants who reported spending up to 16 hours in this task, with the average being 5.3 hours
per report for the Certified group, and 5.5 hours for the Consultants-in-Training.
Step Three: The time between the visit with the family and submitting the video/report to the
PLAY supervisor. Although the recollection of the Certified group might have been affected by
the passage of time since they were involved in the certification process, overall they appeared
to be “speedier” than the Consultants-in-Training. In some ways, this finding makes sense, as
the longer a consultant is taking to submit each video/report, the longer the certification the
process will take, and the longer the Consultant will be “in training.” Nevertheless, it is clear
that it is unusual for a consultant to be submitting a video/report within two weeks of the home
visit, which then makes it unlikely – given the reported length of time it takes for the PLAY
supervisor to respond – that the consultant will receive feedback prior to the next home visit
with the family. A second area of concern is how long it is taking for the Consultants-in-Training:
a majority of that group report that a month or more elapses between a home visit and
submitting the video/report to the PLAY supervisor.
How much time typically elapsed/elapses between the home visit and submitting the video/report to PLAY?
Certified Consultants-in-Training
Less than one week 3.1% 4.1%
One week 15.6% 2.0%
Two weeks 37.5% 28.6%
Three weeks 18.8% 10.2%
One month 12.5% 28.6%
Six weeks 6.3% 4.1%
Two months 4.1%
More than two months 6.3% 18.4%
What might account for how much time elapses between a home visit and submitting the video/report?
We then asked questions about work hours, caseload and how the participants juggled their time
between workload and PLAY requirements during the certification process. Overall, the majority of both
the Certified and the Consultants-in-Training group were working full-time, with the average hours per
week being 36.3 for the Certified group and 35.2 for the Consultants-in-Training. Including the PLAY
20
“I already have to work several hours on my current job duties outside of my work hours. Adding
more PLAY project time outside work hours while still having a work-life balance is nearly
impossible. It would really help if our supervisors worked with us to adjust our caseload or let us
work on the video review reports during work hours. My caseload the past 4-6 months is the
highest it has ever been, and unfortunately there are just not enough hours in the day for all of it.”
(Consultant-in-Training)
families, the Certified group reported a median of 24 families on their caseload during the certification
process, and the Consultants-in-Training reported a median of 22 families.
How did/do the consultants juggle their time during the certification process? The majority of both the
Certified and the Consultant-in-Training groups were able to fit in at least some of the PLAY-related
activities into their work hours. Nevertheless, approximately 1 in 10 of the participants had to complete
those activities primarily on their own time.
How did/do you fit PLAY-related activities into your work hours?
Mostly at Work Sometimes as Part of Set Work Hours
Mostly on Own Time
Certified 29% 61.3% 9.7%
In-Training 36.7% 51.0% 12.2%
The table below describes the breakdown of hours per week of work, number of PLAY families on their
caseload, the hours spent on PLAY per week, and the number of hours participants spent in PLAY
activities on their own time. The numbers demonstrate that the PLAY certification process requires a
major time commitment, with the average being the equivalent of one work day each week. All the
participants reported spending at least some time working on PLAY-related activities outside their work
hours each week, and some were spending a significant number of hours on their own time.
Total Hours Worked/Week
Average, (Median) # of
PLAY Families on Caseload during
Certification Process
Average, (Median) &
Range of PLAY Project Hours/Week
Average, (Median) &
Range of PLAY Hours on
Own Time
Certified 36.3 6.2 (5)
8.5 (8)
2-20
3.7 (3)
1-10
In-Training 35.2 4.3 (4)
6.8 (5)
2-18
3.4 (2)
1-15
21
Despite the significant time commitment, the groups did not waver in their commitment to PLAY during
the certification process:
During the certification process, were/are you confident that the PLAY model was/is consistent with . . .
Certified Consultants-in-
Training
Your own intervention philosophy? 100% YES 96% YES
Your agency’s intervention philosophy? 93.5% YES 92% YES
Once again, the administrators/supervisors also were committed, with 100% responding that the PLAY
model was consistent with their staff’s intervention philosophy, the agency philosophy, and their own
personal philosophy.
FACTORS THAT SUPPORTED AND/OR HINDERED PROGRESS TOWARD CERTIFICATION
In developing our surveys, we identified the following list of factors that could possibly support progress
toward certification, hinder progress toward certification, or play no role whatsoever:
What I knew about autism and coaching families prior to beginning PLAY
How prepared I felt when I left the initial PLAY training
The amount of time I was given to work on PLAY activities during my regular work hours
My supervisor
The technology
Finding families to work with
The buy-in of families while working with them
The amount of time needed to review the video and write the
report
The amount of time between submitting the video/PLAY report and
receiving feedback from the PLAY supervisor
The amount of time needed to listen to the audio feedback from the PLAY supervisor
What I learned from the feedback
Communication and support from the PLAY project staff
The number of certification requirements
Communication and support from OCALI
The survey results showed that some factors were primarily positive, a few were primarily negative,
some were primarily either neutral or positive, but the majority of factors “worked both ways,” i.e.,
could be either a support or a barrier depending on the situation.
22
23
From the perspective of the participants, the amount of time it took to review the video and write the
report was clearly viewed as the greatest factor that slowed their progress.
The following factors were seen as primarily supportive or supportive/neutral:
what they knew about autism and coaching prior to the training,
how prepared they felt by the four-day initial PLAY training,
what they learned from the PLAY supervisor feedback, and
the communication and support from the PLAY Project staff and OCALI .
In an earlier section of this report we have described the positive perceptions of the four-day training
and the perceptions of how it prepared participants for what was to follow. In response to specific
survey questions about the PLAY supervisor feedback, 84% of the Certified Consultants and 72% of the
Consultants-in-Training rated the helpfulness of the PLAY supervisor feedback on their reports as More
Great Than Not or Usually Great. With regard to the communication and support from PLAY, 100% of
the Certified consultants and 90% of the Consultants-in-Training, rated the overall helpfulness of the
PLAY project staff and PLAY supervisors as More Helpful Than Not or Very Helpful.
Factors such as (1) the technology, (2) support from their administrators, (3) the amount of time they
were given to work on PLAY during work time, (4) finding families, (5) the buy-in of families, (6) the time
it took to receive feedback from the PLAY supervisors, (7) the time it took to listen to the audio
feedback, and (8) the number of certification requirements received mixed reviews: for some
24
participants those factors “tipped the balance” toward completion, and for others those factors either
played no role or slowed the certification process.
The technology. Since the PLAY certification process depends significantly on the use of technology, we
asked specific questions about participant comfort with various aspects of technology, as well as their
perceptions of various sources of support regarding technology. The responses indicated that comfort
with technology increased over time, with each cohort having increasing numbers of those who either
grew very comfortable over time or found the technology easy from beginning to end. Interestingly, the
group of Certified Consultants rated their comfort level with technology more highly than did the
Consultants-in-Training; up to one-fourth of the Consultants-in-Training continued to struggle. For both
groups, the biggest challenges consistently were uploading the video/report to be reviewed and
listening to the audio feedback from the PLAY supervisor; a small group of the Consultants-in-Training
also continued to struggle with downloading the video from the camera to the computer and watching
the video on the computer.
We also saw several trends in the helpfulness of different sources of technology support. In particular,
the perceptions of the helpfulness of what participants were taught in the four-day training increased
with each cohort. The most highly rated source of ongoing support was technology assistance from
colleagues also going through the certification process, followed by help from their own agency
technology staff.
Support from administrators. Given the time and efforts it takes to complete the certification
requirements, support from administrators can work both ways: administrators can not only provide
encouragement, but also allow their staff to be flexible with work hours and caseload – or not. Of the
Certified Consultants and Consultants-in-Training who responded to the specific questions about their
own administrator/supervisor, approximately three-fourths reported that their supervisor checked in
with them, actively encouraged them, allowed them to be flexible with their hours and work schedule,
and helped them find answers to their questions. The item receiving the lowest percentage of “Yes” in
each group (although only a few percentage points lower) was the item about being allowed to be
flexible with or reduce their caseload; this finding is not surprising given the federal Part C mandate
about timely receipt of services, i.e., counties cannot allow children eligible for Part C to wait for
services. The “flip side” to these positive findings is that overall there remained a fourth of the group of
participants who reported that their supervisor did not consistently find ways to support them.
Finding families and the buy-in from families. Finding families proved to be a challenge for
approximately one-third of the participants, regardless of whether they were Certified Consultants or
Consultants-in-Training. Analysis of the 34 comments from the group who had encountered trouble
finding families were grouped into three major categories:
25
Finding families who “fit” the criteria, either due to the size
of the county (small), the ebb and flow in the number of Part
C children with ASD in their county, or having too many
Consultants-in-Training who ended up competing for the
available families who met the PLAY criteria;
Families who weren’t interested at all because ABA had
been recommended at the time of their child’s diagnosis; and
Families who weren’t interested even after having PLAY
explained to them or watching the introductory DVD, primarily due to their concerns about the
time commitment or being videotaped.
Keeping families involved also presented challenges, as approximately half of the entire group (54%
Certified, and 45% In-Training) reported that at least one family had decided that PLAY would not be a
good match for them. By far the most frequent reason given was the amount of time that families
would have to commit. Less frequent reasons included not wanting to be videotaped, choosing to
discontinue in order to pursue ABA, stopping when their child did not receive an ASD diagnosis, and
Even when families started and stayed involved with the PLAY model, family buy-in created ongoing
struggles for the group. We asked the participants to describe their perceptions of four aspects of
family buy-in: willingness to be videotaped, family use of strategies between visits, reviewing the videos
sent to them, and reading the reports.
Certified In-Training
Overall, how would you describe the frequency of family “buy-in” to . . .
Rarely or Sometimes
More often than not or Almost
always
Rarely or Sometimes
More often than not or Almost
always
Being videotaped? 0% 100% 18% 82%
Use of strategies? 29% 71% 31% 69%
Reviewing the video? 52% 48% 37% 63%
Reading the report? 36% 64% 35% 65%
As the data suggests, approximately one-third of the entire group experienced challenges with family
buy-in, and felt that their families were not consistently using the strategies, reviewing the videos or
reading the reports.
Aspects of feedback from the PLAY supervisors. Although the participants strongly felt that the
feedback they received from the PLAY supervisors was a factor that supported their progress toward
certification, they still struggled with certain aspects of the feedback, i.e., the timeliness, the
consistency, and the validity.
“We had three people working on the
certificate and we did not have many children
with autism.”
26
Certified In-Training
Perceptions of feedback from the PLAY supervisors
Not great or Sometimes great
More great than not or Usually
great
Not great or Sometimes great
More great than not or Usually
great
Timeliness – how long participants had to wait
40.6% 59.4% 48.9% 51.1%
Helpfulness of the feedback
15.6% 84.4% 27.7% 72.3%
Consistency of the feedback across supervisors
43.7% 56.3% 54.4% 45.6%
In response to two more questions about feedback, 94% of the entire group of participants reported
that they consistently listened to the audio feedback from the PLAY supervisors. In contrast, slightly
more than half (59%) reported that they felt the scores they received on their reports were consistently
a valid measure of the quality of their submission.
We asked participants to provide additional comments about the feedback from the PLAY supervisors,
and we had 70 participants respond. By far the largest number of comments (almost half) had to do
with inconsistency in feedback across supervisors. For example,
“Very similar reports (of the same child) might receive two different scores from different
supervisors.”
“At times I received contradicting feedback from one
supervisor to the other in seemingly similar play scenarios.
These were not glaring differences in the whole of the
program but still made an impact on my outlook of the
supervisory process.”
“Something more standardized would help so that the
consultant is not apprehensive about what the next
supervisor is going to change.”
“Some supervisors want less and take off for being too
long. Others want more and take off for not having enough.”
“Sometimes I would incorporate one supervisor’s suggestions into a report for another
supervisor, and receive constructive criticism from the second supervisor about that element of
my report. I still received valuable feedback, but it made report writing stressful!”
Another large area of “concern” was the supervisor score given to the reports submitted. Some
participants reported that they had never or rarely received a score. When participants did receive a
score, they really wanted to understand the reasoning behind the score:
27
“Some supervisors referenced using a rubric to come up with a score. Other ones just said
something like ‘I’m going to give you a 3 . . . there wasn’t enough feedback to help me
understand the reason why one report was a 3 and another was a 4 or 5.”
“A 3 just seems to mean that I ‘passed,’ but doesn’t help me know in WHICH AREAS I could do
better.”
“I want them to give me scores like are explained in the fidelity manual. I want to know that in
coaching I got a 5, but in my report I only got a 3 so that I know where to focus my next report
and visit on. Otherwise, it might as well be a pass/fail because we don’t really know where to
bump it up.”
“Sometimes the feedback was very positive in the audio and only one area of improvement
would be noted, but the score would be a 3. Oftentimes supervisors would say ‘I’d like to give
you a 4 but I have to give you a 3+.’”
As part of the comments about the report, several people shared their frustration with the supervisors
basing the score and feedback on a very short video; for example, one Consultant-in-Training wrote,
“The supervisors rate us based on their perspective of what is happening. We have so much
more knowledge regarding the family because we are in the home. All that information may not
be reflected exactly in the report but I feel that the feedback is subjective. I had one supervisor
say, ‘Exactly, you understand this child really well.’ She used words like great and perfect and
then rated me a 3.”
Several comments captured the frustration with the timeliness of the feedback. These comments
reflected the desire to have the feedback before the next visit with the family:
“There were a few occasions that I did not receive feedback within 2 weeks (some as much as a
month). That often made scheduling subsequent visits difficult because I wanted/needed
feedback for families.”
“I wish I could have more often gotten the feedback before my
next visit the families. I took extensive notes on the feedback,
but it would have been better to have the most recent visit’s
feedback to make sure to put the suggestions into play at the
next visit.”
On the other hand, approximately one-fourth of the comments focused
on the helpfulness of the feedback despite the inconsistencies:
“The feedback was great! I appreciated hearing the perspectives
and ideas from professional with varied expertise and experiences.”
“It does vary by individual style and on occasion I have gotten conflicting feedback. However, I
appreciate the diverse feedback and think that it gives me great ideas. In this manner I am able
to take what fits for me and implement it and use it to develop my own style.”
28
“I think it is a great concept and love the feedback, just hard when there are so many different
backgrounds, and their focus may be on different areas of development.”
“In the beginning it was difficult to hear negative feedback and sometimes I knew things that I
was not able to communicate effectively to the PLAY supervisors. With practice I got better at
communicating different challenges that I encountered to the supervisors. Overall I learned a lot
from all of the PLAY supervisors. Each one taught me something new! I also learned to get
thicker skin and take the criticism because it did make me a more effective PLAY consultant.”
Certification requirements. In addition to their perceptions of the length of the certification process
(described earlier), the surveys also included two questions about certification requirements and the
recent alternatives to the video/report submissions. Since most of the Certified Consultants were
certified prior to the alternatives being made available, only 10% of the Certified group had the
opportunity to participate in the alternatives, and they rated the online quizzes and group
supervision/workdays as helpful. In contrast, almost 90% of the Consultants-in-Training indicated they
had chosen the quizzes and/or work days as an option. Their perceptions of the alternatives were, for
the most part, positive.
Group Supervision Workdays Online Quizzes
A waste of my time 1.9% 3.8%
Somewhat helpful 7.5% 13.2%
More helpful than not 20.8% 32.1%
Very helpful 32.1% 30.2%
Didn’t take advantage or skipped question
37.7% 20.8%
Thirteen participants submitted additional comments about the alternatives. The comments were
mixed. Some participants liked the online quizzes. Some people were so close to finishing that they did
not seek out the alternatives. Some people told us that they purposefully chose not to try the
alternatives because they liked the feedback on the videos/reports they submitted to the PLAY
supervisors. Two people tried the alternatives, but wished they hadn’t, as they found the supervisor
feedback far more helpful.
One of the administrators/supervisors described the advantages and disadvantages of the alternatives
to the video/report submissions:
“I would like to comment that, while I think reducing the number of video submissions will
certainly result in certifying more consultants, I believe it is at the detriment of professional
growth. Our staff who submitted 20 videos were more deeply entrenched in the
study/perfection of their techniques over a period of nearly two years than our staff who only
had to submit 10 [videos] and are able to complete their certification within a year. I am not
criticizing our staff's abilities to implement PLAY Project. They have a great collaboration
happening and support one another's learning process so they continue to gain
29
knowledge/skill/insight through collaborative self-training. However, that mentor feedback is
valuable and worthwhile and should not be minimized.”
Support from other colleagues. Although we did not include “support from other colleagues” in the
question that focused specifically on the list of factors that support or hinder progress toward
certification, we did ask two questions about colleagues. Three-fourths of the participants reported that
they had colleagues going through the certification process at the same time, and almost 9 out of 10
respondents indicated that the presence of these colleagues was very helpful and “kept them going.”
The rest of the participants felt that it didn’t make much difference, and none of the participants chose
the option of “not so helpful.”
The perspective of the administrators/supervisors. We asked an open-ended question in the
administrator survey: As you’ve talked with your staff during the certification process, what is their #1
negative comment? The responses, which could be grouped into three themes, were very consistent
with what we heard from the consultants themselves: the time it takes, the struggles with technology,
and difficulties with finding families and getting their buy-in. (We also asked a similar question about the
#1 positive comment, which we include later in the discussion on impacts.)
In summary, many factors impacted progress toward certification. Some were seen as positive supports
(below in green), one factor (below in red) was clearly and consistently seen as a major challenge, and
the majority (below in yellow) could “tip the balance” either way for an individual making his/her way
through the certification process.
30
THE QUESTION OF FIDELITY TO THE PLAY MODEL OF INTERVENTION PRACTICES
Since fidelity of implementation is a critical issue in moving evidence-based
practices from a research setting to the “real world,” we asked several questions
about fidelity in each of the surveys, as well as in the telephone interview with
families. In order to identify the key components making up the PLAY
intervention model, we turned to multiple sources: Solomon et al.
(2014), telephone interviews with PLAY project staff in Ann Arbor, and
the PLAY training manual.
In the 2014 article describing the results of the PLAY RCT research study, the authors described
components of the model in the methods section:
PLAY services consisted of a 3-hour monthly home visit for 12 months . . . One week before the
first visit, parents were encouraged (but not required) to review the PLAY Project DVD and
written orientation materials . . .During the visits, the primary caregiver providing the majority of
play interaction was targeted for instruction, but all caregivers were welcomed to attend
monthly sessions. Consultants trained caregivers/parents through coaching, modeling, and video
feedback. During coaching, consultants helped parents identify their child’s subtle and hard to
detect cues, respond contingently to the child’s intentions, and effectively engage the child in
reciprocal exchanges. Parents were taught to provide appropriate developmental challenges to
promote progress in the child’s FDLs. During modeling, consultants played for 15 to 30 minutes
with the child to demonstrate PLAY methods and techniques. During video feedback, the home
consultant obtained a 10-minute representative sample of parent play, and the parent obtained
a 5-minute representative sample of the home consultant modeling. A written analysis of the
video, sent between visits, reviewed the parent-child and consultant-child video interactions,
summarized the child’s developmental profile, and recommended methods and techniques. The
program was revised to address the child’s evolving developmental profile . . . Consultants were
available between visits as needed by e-mail or phone. Families were encouraged to engage
their child in 15- to 20-minute play sessions and throughout daily for a total of 2 hours/day.
(Solomon et al., 2014, p. 478)
During the study, Solomon and colleagues addressed fidelity by having two PLAY experts independently
conduct blind ratings of a random sample of consultant videos and reports according to the project’s
fidelity manual. Inter-rater reliability was at 100%. The consultants providing the intervention
submitted 138 videos/reports (23% of the visits) for fidelity ratings; 97% of the videos/reports were
rated as meeting the fidelity criteria. However, the specific criteria for fidelity were not described in
detail.
31
The PLAY Training Manual shed additional light on the key elements of the project. In the section that
includes the PLAY Project Home Consultant (PPHC) Fidelity Manual, these key elements are identified as
part of the PLAY Project home visit:
• The video recording of the caregiver playing, the consultant
playing, and the consultant coaching the caregiver;
• The write-up that includes estimated hours of intervention;
• The Video Review Form;
• Describing Comfort Zone activities, Sensory-Motor Profile,
Functional Developmental Levels (FDLs), and
activities/techniques/methods; and
• The Visit Suggestion Report.
In the PLAY Training Manual’s License Agreement, participating agencies must agree to include these
components of a home visit:
• Family receiving and reviewing the PLAY Project DVD;
• Half-day 3-hour monthly home visits or the equivalent;
• Sessions with 1/3 modeling, 1/3 coaching, 1/3 feedback;
• Following the Seven Circles;
• Use of videotape feedback following each session; and
• Written feedback provided following the visits using the specified format.
Based on the sources above, we decided on a final list of key components that would comprise fidelity
to the PLAY model:
Giving the family the PLAY Project DVD to review
Scheduling monthly 3-hour visits or equivalent
Using the assessment tools to create a unique profile for each child
Using the intervention techniques and activities in the PLAY training manual
Spending sessions in 1/3 modeling, 1/3 coaching, 1/3 feedback
Encouraging families to engage their child in short play sessions daily for a total of 2 hours/day,
15-20 hours per week
Completing and leaving the Visit Suggestion Report with the family
Using video feedback following each visit
Providing the family with a written report following each visit
Using the written report format suggested in the PLAY training manual
Periodically reassessing and revising the PLAY plan.
We actually struggled a bit to identify all of the key elements, as each source described different pieces
and parts, and nowhere was there a single complete list of specific fidelity components. As a result, two
components (in italics above) were not included in the first survey we sent out (Certified Consultants)
but were added to the subsequent surveys.
32
In the online surveys, one group of questions addressed how the participants used the key PLAY
components at different points in time: during the training, during certification, and post-certification
(either what the Certified Consultants were doing or what the Consultants-in-Training planned to do
once certified). We also asked participants to rate the importance of using each component in their
work. A final question about fidelity asked participants to describe the reasons why they have not been
able to use all the key elements of the PLAY model in the way that they were trained. (We also asked
families to describe their perceptions of how the key components were implemented; those results will
be discussed later in The Family Experience section.)
The first fidelity question that looked specifically at the key components asked participants to think back
to the original four-day training:
During your initial training, the PLAY model was explained to you. To the best of your memory, were these PLAY components emphasized as critical to include as part of your work with each family? Certified
In-Training
Giving the family the PLAY Project DVD to review? Yes No
Can’t Recall
84.4% 12.5% 3.1%
71.7% 18.9% 9.4%
Scheduling monthly 3-hour visits or equivalent? Yes No
Can’t Recall
90.6% 6.3% 3.1%
92.5% 5.7% 1.9%
Using the assessment tools to create a unique profile for each child?
Yes No
Can’t Recall
90.6% 9.4%
--
86.8% 5.7% 7.5%
Using the intervention techniques and activities in the PLAY training manual?
Yes No
Can’t Recall
96.9% 3.1%
--
100% -- --
Spending sessions in 1/3 modeling, 1/3 coaching, 1/3 feedback?
Yes No
Can’t Recall
81.3% 3.1%
15.6%
63.5% 19.2% 17.3%
Encouraging families to engage their child in short play sessions daily for a total of 2 hours/day, 15-20 hours per week?
Yes No
Can’t Recall
Question not
included
96.2% --
3.8%
Completing and leaving the Visit Suggestion Report with the family?
Yes No
Can’t Recall
Question not
included
96.2% --
3.8%
Using video feedback following each visit? Yes No
Can’t Recall
100% -- --
90.6% 5.7% 3.8%
Providing the family with a written report following each visit?
Yes No
Can’t Recall
100% -- --
98.1% 1.9%
--
33
During your initial training, the PLAY model was explained to you. To the best of your memory, were these PLAY components emphasized as critical to include as part of your work with each family? Certified
In-Training
Using the written report format suggested in the PLAY training manual?
Yes No
Can’t Recall
96.9% 3.1%
--
100.0% -- --
Periodically reassessing and revising the PLAY plan? Yes No
Can’t Recall
78.1% 9.4%
12.5%
75.5% 7.5%
17.0%
For the most part, the participants recalled that these components were stressed as critical during the
four-day introductory training. Nevertheless, no component received a 100% response of Yes, I
remember this from the training as being critical from both groups, and in fact, three components
(giving the family the DVD; spending the visit in 1/3 modeling, 1/3 coaching, 1/3 feedback; and
periodically reassessing and revising the PLAY plan) were strikingly lower than the other components in
terms of percentages of Yes responses.
We then asked participants to describe how often they included (Certified) or were including (In-
Training) each of the elements during the certification process itself. In terms of fidelity, we were most
interested in the percentage of people who answered “Almost always” for each key element.
During the certification process, how often did you include/are you including these components during your visits with your PLAY families? Certified
In-Training
Giving the family the PLAY Project DVD to review? Rarely Sometimes
Often Almost always
19.4% 19.4% 22.6% 38.7%
28.6% 20.4% 16.3% 34.7%
Scheduling monthly 3-hour visits or equivalent? Rarely Sometimes
Often Almost always
6.5% 6.5%
25.8% 61.3%
8.2% 18.4% 30.6% 42.9%
Using the assessment tools to create a unique profile for each child?
Rarely Sometimes
Often Almost always
-- 25.8% 29.0% 45.2%
4.2% 22.9% 25.0% 47.9%
Using the intervention techniques and activities in the PLAY training manual?
Rarely Sometimes
Often Almost always
-- --
9.7% 90.3%
-- --
16.3% 83.7%
Spending sessions in 1/3 modeling, 1/3 coaching, 1/3 feedback?
Rarely Sometimes
Often Almost always
-- 6.5%
45.2% 48.4%
8.2% 8.2%
44.9% 38.9%
34
During the certification process, how often did you include/are you including these components during your visits with your PLAY families? Certified
In-Training
Encouraging families to engage their child in short play sessions daily for a total of 2 hours/day, 15-20 hours per week?
Rarely Sometimes
Often Almost always
Question not
included
-- 6.1%
20.4% 73.5%
Completing and leaving the Visit Suggestion Report with the family?
Rarely Sometimes
Often Almost always
Question not
included
-- 12.2% 32.7% 55.1%
Using video feedback following each visit? Rarely Sometimes
Often Almost always
3.2% --
16.1% 80.6%
4.1% 8,2%
24.5% 63.3%
Providing the family with a written report following each visit?
Rarely Sometimes
Often Almost always
-- --
9.7% 90.3%
4.1% 14.3% 16.3% 65.3%
Using the written report format suggested in the PLAY training manual?
Rarely Sometimes
Often Almost always
-- 3.2%
-- 96.8%
2.0% 4.1%
-- 93.9%
Periodically reassessing and revising the PLAY plan? Rarely Sometimes
Often Almost always
3.2% 12.9% 29.0% 54.8%
6.1% 14.3% 40.8% 38.8%
During the certification process, both groups were most consistent (although not at 100%) in using the
PLAY manual techniques and the written report format. On the other hand, components such as giving
the family the DVD to review, scheduling 3-hour monthly visits or the equivalent, using the assessment
tools to create a unique profile, spending the sessions in 1/3 modeling/coaching/feedback, and leaving
the Visit Suggestion Report were used far less consistently. (The fact that participants were not
consistently periodically reassessing and revising the PLAY plan does make sense, since contact with
families might be short-term in nature during the certification process.) We also saw some differences
between the two groups: compared to the Certified group, the Consultants-in-Training group was less
likely to report that they consistently (a) used video feedback and (b) provided the family with a written
report.
We then asked two key fidelity questions with regard to post-certification practices. The first question
focused on the IMPORTANCE of using the elements during PLAY work with families. The second question
focused on the FREQUENCY of use: we asked the Certified group to describe how often they include the
35
components in their current work with families, and we asked the Consultants-in-Training to describe
how often they planned to include the components once they were certified.
The table on the next two pages contains a side-by-side comparison of each PLAY component in terms of
importance and frequency of use. Once again, no component was rated by 100% of the participants as
either very important or being used consistently (Almost Always). The patterns of responses were very
consistent with the previous fidelity questions on the surveys:
The highest ratings were given to the components of using the PLAY intervention techniques
and activities, encouraging families to engage their child daily, providing the family with a
written report, and using the PLAY written report format.
Giving families the DVD received the lowest ratings in terms of importance and frequency.
The remainder of the components fell somewhere in the middle, with typically 50-75% of the
participants rating the components as very important and/or likely to be used consistently. Of
note is that these “middle” components often received a higher rating of importance than
actual usage.
36
Post-certification fidelity questions: How IMPORTANT is it/will it be to include
these elements in your current/future PLAY work with families?
How OFTEN do you include/plan to include these components during your
visits with your PLAY families?
Element
Certified
In-Training
Certified
In-Training
Giving the family the PLAY Project DVD to review?
Not too important
Somewhat important Very important
35.5% 35.5% 29.0%
22.9% 47.9% 29.2%
Rarely Sometimes
Often Almost always
32.2% 32.2% 3.2%
32.2%
25.0% 20.8% 16.7% 37.5%
Scheduling monthly 3-hour visits or equivalent?
Not too important
Somewhat important Very important
9.7%
19.4% 71.0%
6.3%
29.2% 64.6%
Rarely Sometimes
Often Almost always
9.7% 3.2%
25.8% 61.3%
6.3% 8.3%
20.8% 64.6%
Using the assessment tools to create a unique profile for each child?
Not too important
Somewhat important Very important
6.5%
35.5% 58.1%
2.1%
25.0% 72.9%
Rarely Sometimes
Often Almost always
-- 25.8% 22.6% 51.6%
-- 8.3%
31.3% 60.4%
Using the intervention techniques and activities in the PLAY training manual?
Not too important
Somewhat important Very important
--
3.2% 96.8%
--
2.1% 97.9%
Rarely Sometimes
Often Almost always
-- --
3.2% 96.8%
-- --
10.4% 89.6%
Spending sessions in 1/3 modeling, 1/3 coaching, 1/3 feedback?
Not too important
Somewhat important Very important
--
32.2% 67.7%
--
16.7% 83.3%
Rarely Sometimes
Often Almost always
-- 3.2%
41.9% 54.8%
-- 6.3%
31.3% 62.5%
37
Post-certification fidelity questions: How IMPORTANT is it/will it be to include
these elements in your current/future PLAY work with families?
How OFTEN do you include/plan to include these components during your
visits with your PLAY families?
Element
Certified
In-Training
Certified
In-Training
Encouraging families to engage their child in short play sessions daily for a total of 2 hours/day, 15-20 hours per week?
Not too important
Somewhat important Very important
Question not
included
--
4.2% 95.8%
Rarely Sometimes
Often Almost always
Question not
included
-- --
6.3% 93.7%
Completing and leaving the Visit Suggestion Report with the family?
Not too important
Somewhat important Very important
Question not
included
--
20.8% 79.2%
Rarely Sometimes
Often Almost always
Question not
included
-- --
35.4% 64.6%
Using video feedback following each visit?
Not too important
Somewhat important Very important
--
29.0% 71.0%
2.1%
25.0% 72.9%
Rarely Sometimes
Often Almost always
3.2% 6.5%
19.4% 71.0%
2.1% 10.4% 18.8% 70.2%
Providing the family with a written report following each visit?
Not too important
Somewhat important Very important
--
6.5% 93.5%
--
21.3% 78.7%
Rarely Sometimes
Often Almost always
-- 3.2% 9.7%
87.1%
-- 10.4% 16.7% 72.9%
Using the written report format suggested in the PLAY training manual?
Not too important
Somewhat important Very important
--
16.7% 83.3%
4.2%
14.6% 81.3%
Rarely Sometimes
Often Almost always
-- 3.2% 9.7%
87.1%
-- 4.2%
14.6% 81.3%
Periodically reassessing and revising the PLAY plan?
Not too important
Somewhat important Very important
3.2%
19.4% 77.4%
--
14.6% 85.4%
Rarely Sometimes
Often Almost always
3.2% 3.2%
19.4% 74.2%
-- 6.4%
17.0% 76.6%
38
What might account for the participants viewing certain elements as less important and/or less likely to
be used in their work with families? A first set of factors from Bronfenbrenner’s ecological model might
be related to the participant (individual and microsystem) or the participant’s agency (mesosystem). In
the final fidelity-specific question, we provided a list of these factors, and asked participants to choose
as many reasons as applicable to their situation. As can be seen in the table below, the factor chosen
most frequently by both the Certified Consultants and the Consultants-in-Training was finding enough
time given their hours and caseload. The next two most frequent reasons chosen by both groups
focused on the actual PLAY work with families, i.e., families wanting to talk about other things during
the visit, or families not seeming interested in viewing the videos or reading the reports provided by the
Consultant. Almost one in five respondents in both groups reported that other EI initiatives had taken
priority. Compared to the Certified group, the Consultants-in-Training reported more struggles in
finding children and families, as well as feeling less confident about their use of PLAY. Nevertheless, no
one in either group felt that PLAY was not worth the effort.
43.8%
18.8%
6.3%
12.5%
34.4%
21.9%
0.0%
0.0%
9.4%
3.1%
54.7%
17.0%
20.8%
18.9%
28.3%
41.5%
11.3%
0.0%
3.8%
0.0%
0% 20% 40% 60% 80% 100%
It's difficult to find enough time given myhours and caseload
Other changes have taken priority (e.g.,agency's move to a PSP model)
It's difficult to find children who fit the PLAYcriteria
It's difficult to find interested families
Families don’t seem interested in the videos or written reports
During my visits, families want to talk aboutother things (e.g. toilet training, sleep)
I'm still not totally confident I'm using PLAYas intended
I'm not really sure that PLAY is worth theeffort
My job description has changed
I no longer work in early intervention
If you've not been able/If you're not sure you'll be able to use all of the elements of the PLAY model in the way that you were trained, please tell us why.
In-Training
Certified
39
Twenty-one of the participants provided additional comments to explain their choices. Comments that
focused on difficulties regarding families fell into three groups: (1) families who have so many other
challenges that staying on task during a visit or implementing strategies between visits is difficult, (2)
families who find 3-hour visits to be too long for their child and/or themselves, and (3) families who are
reluctant to either be videotaped or watch themselves on video. The participants also explained that
when they scheduled visits more frequently than once a month, then it was difficult to find the time to
turn around the video reviews and reports before the next visit. Several of the Consultants-in-Training
commented on the difficulty of remembering all the PLAY “pieces and parts.”
“Sometimes I like to think before leaving the visit suggestion report. It is hard
to do right at the appointment and sometimes I just forget.”
“I sometimes forget to leave a visit suggestion report mostly because it is not
a habit that I do with all of my EI families. I often complete it and give it to
them at a later time for their records.”
A second set of factors from the ecological model could be related to the wider culture of Part C early
intervention in Ohio (macrosystem). We heard comments about the macrosystem both during our June
5 focus group and during our individual telephone conversations with the PLAY supervisors. Since both
the focus group and telephone interviews took place at the end of the data collection, we had started to
see the fidelity challenges emerge in the survey responses and so we were able to explore the issue of
fidelity in greater depth with both groups.
During the June 5 focus group, we asked a specific question of the five participants: What, if anything,
would make the PLAY model inconsistent with how we are doing early intervention in Ohio? The
responses summarized the challenges of wearing two hats (PSP working on IFSP goals v. PLAY consultant
working on PLAY goals) and what is perceived as different interpretations of “coaching.”
“I feel like when I’m the PSP (I am for all these families) and when I do PLAY then I do a different
visit. When using the PSP model, it’s two different types of visits. When I do PSP I may be doing
a visit with the OT or PT and focus on feeding or communication and they don’t quite
understand the whole PLAY model – it is confusing for families – it’s fragmented – like a split
personality.”
“The little sheet that I leave with families for regular home visits – what we’re working on and
when I’ll be back – it’s a carbon copy – when I do PLAY I’m using a different sheet so it’s two
different things.”
“Having been in EI a long time, my thought is that the PSP model is really McWilliam’s baby –
the Rush and Shelden model is another take on that – then there’s PLAY. I see McWilliam’s PSP
model as going well enough with PLAY. But R&S use the word coaching but their coaching (find
out what parents know before we say anything) is not PLAY coaching. PLAY is like coaching a
game and we will work with them and do true coaching – R&S is like counseling and exhausting
what parents know & then putting our two cents in.”
40
“As far as inconsistencies we do a lot of the same techniques – but when you have a goal for the
IFSP that the parent wants you to work on, that’s your job. But yet they have other areas to
work on and FDL levels to focus on, so I basically go out 2 times – if I’m working on PLAY I go for
that or IFSP I will go out for that – that’s where I see inconsistencies – the goals don’t always see
eye to eye and I have to explain that to parents – when I come back out next we’ll work on….it’s
a lot for a family.”
The Ohio PLAY supervisors shared that they had heard similar comments during the interactions with
trainees going through the certification process.
“I am not surprised that trainees are not planning to use PLAY with fidelity. They are following
the IFSP and doing a lot more than just PLAY. Some have to do evaluations, redeterminations,
team meetings, they have high caseloads, they are really hit. There are a lot of HMG
requirements, reviews, documentation, progress notes, etc. It takes a lot of their time. I would
be surprised if anybody is ever able, in any situation, with any families, to do the model the way
that it is recommended by Michigan (with a few exceptions, since I have talked to a few people
who are using the model in the correct way). I would be very surprised if it is happening much,
though, just knowing everything that people have to do.”
THE FAMILY EXPERIENCE
During the telephone interviews, we asked families a variety of both open-ended and closed-ended
questions that touched on why they wanted to participate, what their PLAY experience was like, and
what impact PLAY had on their child and family. Two-thirds of the families were still receiving PLAY at
the time of the interviews. Of the 12 families for whom PLAY had ended, slightly more than half (7)
reported that their child had turned 3 and had “aged out.” Two of the families shared that leaving PLAY
had been a mutual decision with their PLAY Consultant: e.g., “we agreed that my daughter had reached
as high as she could go.” Three of the families chose to end the intervention: one parent commented
that “We were doing a lot of early intervention. I had gotten as much out of the PLAY as I could – it had
run its course.” Another parent felt as though her son had not “clicked” with the PLAY Consultant, and
that the strategies were similar to what she was getting from other professionals: “I never felt like we
were getting anything out of it.”
Why they chose to participate. When we looked at the reasons families gave for participating, we saw
14 families said they chose to participate because a professional had recommended it (“M
thought it would be really good”; “It was presented as a way to get feedback from other
professionals about what I was doing right or wrong with my son”);
11 participated because the caregiver wanted to be better able to help his/her child (“I did not
know how to interact with this kind of child and it was my first child”; “I did not know a lot about
autism and I wanted to learn more”;
8 thought it would be helpful to their child (“We started because of his diagnosis and to help get
him out of that little world”; “We thought it would be a good opportunity for him”); and
4 wanted continued support (“Partly because EI had ended. C is amazing and I wanted her to
keep coming”).
What their PLAY experience was like. During the visits, 100% of the caregivers interviewed were present.
In addition, 11 (30.6%) families reported that their spouses were also present, and 10 families (27.8%)
described that the child’s siblings were typically present for the visits. Almost all of the caregivers (34 of
the 35, or 97.1%) reported that they definitely looked forward to their PLAY visits, while the remaining
caregiver acknowledged that sometimes she was exhausted since the visit was after her workday.
As can be seen in the table below, slightly more than half of the families reported that they received
PLAY monthly, with the remainder reporting more frequent visits. When asked about the frequency of
the visits, 83.3% of families felt the frequency was just right and 16.7% said the visits were too far apart;
the majority of those families who felt the visits were too far apart were receiving monthly visits.
Weekly Every Other Week Monthly
8.6% 34.3% 57.1%
Families who felt the frequency was just right felt that it gave them time to try the strategies between
visits as well as, in many cases, time for the other services in which their child was involved:
“Gives us time to work on things we have learned and then get back together.”
“I was able to seek outside therapies. I was overwhelmed with all these appointments.”
Families who wanted visits more frequently typically were ready for more information:
“I know there are constraints for money and time, but the more therapy the better. To have
even more guidance would be awesome.”
“Whatever they show you, you have to do it for four weeks. She introduced a new way to play
and he was interested and then got bored between visits.”
“We would love to have more, but G said he only is allowed 12 or 16 visits in his lifetime. I
would prefer every other week...if they were unlimited. Wish list...every other week and
unlimited in terms of ending.”
Even the families who reported the visits as “just right” wished they could have had more:
“When we first started I wish it could have been every 2 weeks. I was wondering if I could be
doing more in between visits.”
42
“Some weeks I felt like I wish we were doing this more. Other times it was good to have time in
between to do activities and then evaluate.”
Only one family reported that they typically received a three-hour visit. The majority of families (58.3%)
reported that their visit generally was one hour in length, 22.2% said visits were 1.5 hours, and 19.5%
reported having visits that were two hours or longer. Regardless of the length of the visit, almost all
(91.7%) of the families said the length of the visits was just right, especially given their child’s attention
span and ability to stay engaged.
Most of the families we interviewed had extensive experience with PLAY. Almost one-half of the families
had participated in 10 or more PLAY home visits. Another 43% had participated in five to eight visits,
one family had participated in three visits, and two caregivers couldn’t remember for sure.
Family perspectives on the key PLAY components. In addition to asking about the frequency and length
of visits, we asked a series of questions about the key PLAY components. When asked about the
introduction to PLAY DVD, 65.7% of families reported that they received the DVD when they first started
PLAY, 20% of families said they did not receive the DVD, and 14.3% of families could not remember if
they had been given the DVD or not. Within the group of families who did receive the DVD, 87.5%
reported that they had watched it. Additional comments from the families were mixed: either families
really enjoyed the DVD and wished they had a copy to keep, or they felt the DVD was too long and slow-
moving. Nevertheless, the families felt the DVD was beneficial overall.
We then asked a specific question about how often the PLAY Consultants included certain key
components during the home visits.
During each visit, did the PLAY Consultant . . .
Don't remember
Rarely Sometimes Almost always
Video you playing with your child? 0% 0% 11.1% 88.9%
Model PLAY strategies for you? 0% 0% 0% 100%
Watch you play with your child and make comments?
0% 0% 5.6% 94.4%
Give you feedback about your child? 0% 0% 0% 100%
Leave you with ideas and strategies to try before the next visit?
0% 0% 2.8% 97.2%
Encourage you to engage your child in 15-20 minute play sessions daily for a total of 2 hours/day?
5.6% 2.8% 5.6% 86.1%
Complete and leave the Visit Suggestion Report with you?
5.8% 14.7% 8.8% 70.6%
43
We followed that question with a detailed question about the videorecording and written report. As can
be seen in the table below, the families reported receiving both the video and report on a consistent
basis. However, the families were not consistently receiving the video and report PRIOR to the next visit,
and often described that the PLAY Consultant brought the video/report to the next visit and they would
review it together. Although the majority of families viewed the video and read the report, they were
more likely to read the report than view the video. Approximately three-fourths of the families reported
that both the video and report consistently gave them a better understanding of their child.
Interestingly, the video was seen as more helpful than the report in terms of helping them learn how to
play with their child.
Rarely Sometimes Almost always
Did you receive a written REPORT each time you met with your PLAY Consultant?
2.8% 5.6% 91.7%
How often did you receive the report PRIOR to the next visit?
45.7% 11.4% 42.9%
How often did you read the report? 2.9% 11.4% 85.7%
How often did the report give you a better understanding of your child?
2.8% 25% 72.2%
How often did the report help you learn how to play with your child?
5.6% 33.3% 61.1%
Did you receive a VIDEO recording each time you met with your PLAY Consultant?
0% 5.6% 94.4%
How often did you receive the video recording PRIOR to the next visit?
48.6% 8.6% 42.9%
How often did you watch the video recording? 5.6% 25% 69.4%
How often did the video recording give you a better understanding of your child?
2.9% 25.7% 71.4%
How often did the video recording help you learn how to play with your child?
2.9% 20% 77.1%
Parent use of PLAY. We asked the families about two different aspects of their use of the PLAY model.
We first asked families to rate (on a four-point Likert scale) how easy it was to understand the PLAY
strategies and then explain their answer.
1 Difficult
2 3 4 Easy
0.0% 0.0% 34.3% 65.7%
Families described how easy it was to understand the PLAY approach, although at times certain
strategies were more of a challenge:
44
“They made it easy to see different ways of going about it.”
“I understood everything she told me to do.”
“Sometimes I was not entirely sure. She would lead by example.”
“Sometimes I get the basic idea but because specific situations come up, I don't know what to
do with them.”
“Most of the ideas are straight forward overall. When it gets to a specific situation, that is where
it is more difficult to decide on the best strategy to try. Overall concept of PLAY makes sense,
pretty easy.”
“She tried every way to bring me in, to make me feel easy. She explained verbally, acted as role
model. She went through video, practically and verbally, visually. I did practice too with her in
front of me.”
“Sometimes with strategies I would have to ask her explain them on the next visit because I
could not figure it out.”
“It just became a natural way to interact and we do it still today.”
If the strategies were easy to understand, were families using the strategies? We asked the families to
rate (on a four-point Likert scale) how often they used the PLAY strategies between visits and then
explain their answer.
1 Rarely
2 3 4 Every day
0.0% 5.7% 25.7% 68.6%
Families described the process of learning, i.e., “in the beginning it was hard to get out of our normal
routine of doing things and incorporate PLAY.” Seeing results made a difference:
“You pick up on things and it becomes second nature . . . the strategies you know work.”
“Because they worked and I saw the results, my husband and I did everything to use them.”
“I watch the video every day so I keep practicing and adding. My kids watch it with me and we
all laugh. It is kind of fun. Sometimes I watch the one from the past to mix it up. I use them all
the time.”
“It had been drilled into my head that it has to be consistent. I just make time.”
The families were honest, however, that sometimes “life” interferes.
“A lot of it was overwhelming for me and we had other therapists... it would be confusing to me
with all the different therapy strategies.”
“We all have busy days or bad days where we don't feel like doing anything. The strategies are
easy enough to incorporate into our everyday lives, that I am able to use them more often than I
would other interventions. We are huge PLAY project advocates.”
“It's hard to follow and schedule for me. I have to do every household chore, feed him, bathe
him.”
45
“There were times when I forgot to use them.”
“Some days I got busy and I did not have time to do it.”
PLAY and stress. Given the time commitment that PLAY requires not only of the Consultants but also the
families, we were interested in whether or not families felt that PLAY added to their stress levels. We
asked two stress-specific questions during the telephone interviews. The first question asked families to
use a four-point Likert scale to describe the overall stress level in their lives during their PLAY
experience:
1 Rarely felt stressed
2 3 4 Almost
always felt stressed
14% 8% 39% 39%
Families described the stressors that research has shown often go hand in hand with having a child with
ASD (meltdowns, transitions, worrying about the future) as well as the stressors that are part of
relationships and work: schedules, going through a divorce, moving into a new apartment, medical
issues, losing a job. Nevertheless, PLAY rarely added stress to their already stressful lives.
To what extent did the PLAY intervention add to your stress level at the time?
Rarely Sometimes Frequently
89% 11% 0%
When PLAY did add stress, families typically described it as a good stress. One parent commented :
“Good stress. Just another scheduling issue. Another thing to think about.” Another parent noted,
“Making sure the house is clean.”
The families were overwhelmingly positive about the presence of PLAY in their lives during this stressful
time:
“PLAY was a break from stress. M made it very relaxing and part of our everyday life.”
“Never . . . it helped me figure out how to understand him.”
“It doesn’t [add stress]. She actually helps me with my stress.”
“Gave me less stress because someone was trying to walk with my child and me. Gave me hope
every time. Did not add stress to my life.”
“It was another set of ears. It added support for us.”
46
The word cloud below (also on the cover) visually represents the text of the comments from families
about the difference PLAY made in their lives. (The larger the font, the more often the word appeared.)
WHAT WE LEARNED FROM THE CONSULTANTS WHO WERE NO LONGER ACTIVE
As we described earlier, our response rate was low as we reached out to the group of consultants who
were no longer active in the certification process. We began by sending out a survey almost identical to
the survey sent to the Certified and Consultant-in-Training groups. Since we received only 6 responses,
we shortened the survey significantly and re-sent to the group; unfortunately we had only two
additional survey completions, even with the shorter survey. In addition, not everyone completed all
the survey questions. Given the small sample size and response bias (since 80% of the group did not
respond to the survey), we have not included the data in other sections of the report. Nevertheless, we
want to describe what we heard from this particular group, since their responses were almost always
consistent with what we heard from the Certified Consultants and Consultants-in-Training.
The eight people who responded (six to the long survey, two to the short survey) were evenly
split between smaller counties and larger urban counties.
Interestingly, this group rated themselves higher than the other groups in terms of comfort level
(prior to the PLAY training) with parent-child interactions, confidence in coaching families and
confidence in giving feedback to families, but, like the other groups, felt that their work in all
areas had been enhanced by the PLAY training.
The hours they spent on the job, their caseloads, the number of PLAY families, the time spent
working on PLAY inside and outside work hours were similar to the other groups.
Their struggles and perceptions of factors that helped/made no difference/didn’t help were also
similar.
47
Their patterns of responses to the fidelity questions were similar to the other groups surveyed.
Although (1) the length of time that elapsed between the home visit and reviewing the video/
writing the report and (2) the hours spent reviewing the video/writing the report were similar to
(even a bit less than) the other groups, all of the No-Longer-Active group reported at least one
month or more elapsing between the home visit and submitting the video/report to the PLAY
supervisor.
The process of moving from active to no-longer-active.
This group reported that they had been involved in the PLAY certification process for an average
of 18 months, ranging from 4-24 months. The majority of them felt that the process was taking
longer than they had expected, and half of them had received an extension. The average
number of certification requirements completed was 7.2, ranging from 0-14.
How did they describe the point at which they became inactive?
o 3 out of the 7 respondents notified PLAY that they would not be continuing.
o 1 was notified by PLAY that they were being moved to the no-longer-active list.
o Another 3 chose other: retirement, maternity leave, or dissatisfaction with the quality
and length of time it took to receive feedback from the PLAY supervisor.
Only one person expressed regrets about the change in status to inactive.
When we asked the group to choose the #1 reason why they were no
longer actively involved in PLAY, 5 out of the 6 respondents chose “it was
difficult to find enough time to complete the required tasks given my
hours and caseload.” The remaining respondent chose “I became
discouraged about my progress.”
Did this group think the PLAY model is a good intervention for families? Three of the four
responded YES, with the remaining person responding UNSURE.
Would they recommend the PLAY training and certification to others? Four of the six responded
YES, and the remaining two responded NO. However, the two who replied NO did not choose to
explain their answers.
IMPLEMENTATION OF PLAY POST-CERTIFICATION
The various players involved in the Ohio PLAY Project Training – the state, the PLAY Project staff and
supervisors, the families, and the consultants and their administrators/supervisors have invested a
significant amount of time, effort and resources. What happens/will happen once the consultants are
certified?
Current/future use of the PLAY model. We first asked if the consultants had either used (Certified) or
were planning to use (Consultants-in-Training) the PLAY model in their work with families once they
were certified. Almost all (96.8% of the Certified and 100% of the Consultants-in-Training) reported that
they were using or planned to use the PLAY model. Only one Certified Consultant reported that (s)he
does not use the PLAY model: “I have used techniques from PLAY with families, but not the full model.
Again, I have offered, but families decline for one reason or another.”
48
Since fidelity of implementation is important, we asked another question regarding HOW the
participants were using or planned to use the PLAY model. The chart below illustrates how the Certified
Consultants described their current use of the PLAY model with families:
The chart below illustrates a similar pattern in how the Consultants-in-Training plan to use the PLAY
model in the future once they are certified:
3.2%
12.9%
I restrict my use of the PLAY model tocertain families so that I can implementit in the same way that I did during thecertification process
I find myself sharing some PLAYtechniques and activities with manyfamilies that I work with, but I typicallydon't use the full PLAY model in exactlythe same way that I was trained
Both -- I have used the full PLAY modelwith certain families AND I find myselfsharing PLAY techniques and activitieswith many families that I work with
8.3%
8.3%
83.3%
I plan to restrict my use of the PLAYmodel to certain families so that I canimplement it in the same way that I didduring the certification process
I plan to share some PLAY techniquesand activities with many families that Iwork with, but I probably won't use thefull PLAY model in exactly the same waythat I was trained
Both -- I plan to use the full PLAY modelwith certain families AND I plan toshare PLAY techniques and activitieswith many families that I work with
84%
49
Similar to the Certified Consultants and the Consultants-in-Training, the majority of the
Administrators/Supervisors (85.7%) reported that their agency plans to use both the full PLAY model
with certain families as well as parts of the PLAY model (specific strategies and techniques) with many
other families. Only 14.3% reported that their agency planned to restrict the PLAY to certain families so
that the model can be used as intended.
We then asked an open-ended question of all three groups: How do you/How will you decide to offer
PLAY as an intervention model to families? We were able to code the responses into six major categories
(Autism Diagnosis, Red Flags, Autism Diagnosis AND Red Flags, Family Fit and Commitment, Caseload,
and Systematic Protocol). The responses suggested the complexity, county-specificity, and sometimes
uncertainty regarding how and when to offer PLAY. Some counties were focusing primarily on children
who were already diagnosed; other counties were using “red flags” as their criteria since children were
not always getting a diagnosis prior to age three; and yet other counties were using both a diagnosis and
red flags as their primary criteria. Frequently the family “fit” and buy-in were mentioned as additional
criteria. For example,
“Initially I was so excited about the progress I saw with the children who were participating in
the PLAY Project that I was offering to most of the children I served with the diagnosis or who
had ‘red flags.’ Now I am getting to know the family before mentioning it as an intervention
option. I always find the information from the video analysis, etc., as beneficial, but if the family
doesn’t, then it is not worth the time that I have to put into writing the report. It makes me sad,
but it is reality. If they don’t take the time to read the report or watch the video, I can’t justify
spending the time it takes to write the report.” (Certified Consultant)
“Some families who have a history of non-compliance are not eligible.” (Certified Consultant)
“A child with ASD or symptomatology of ASD and their family will be given the option of PLAY
Project as our intervention model when: the family has at least basic reading and
comprehension skills, the family expresses their willingness to follow through with suggestions
and keep appointments, and the family feels comfortable with and eager to learn what is
described to them as the PLAY Project model.” (Consultant-in-Training)
“If a child is identified as potentially benefitting from the PLAY model, then it is discussed with
the family and the DVD is provided. It is then discussed again to see if this is something that the
family feels that they are able to commit to and want to be a part of.”
(Administrator/Supervisor)
Often the issue of availability and juggling caseloads was mentioned as a factor, most frequently by
Administrators/Supervisors:
“We are assigned children from a ‘wait list’ for PLAY. (Certified)
“I feel like our agency may set limits to the number of children served in PLAY while continuing
to offer EI services to children under 3. I think we may have a hierarchy of needs for children
who are more complex with ASD as well as those approaching age 3.” (Consultant-in-Training)
50
“We have developed a referral process for PLAY Project. We also have to be sure we have time
availability/caseload opening. The caseload depends on the number of families/children in
what state of involvement.” (Administrator/Supervisor)
Occasionally, a participant did mention a specific protocol, which often incorporated both child and
family factors in order to address caseload and availability of staff:
“We have developed a referral sheet to be used by our staff . . . we have found that we can best
target our audience and utilize our resources by seeking referrals for children who have the
most to gain. With 600+ children in our EI program, we needed to find a way to pinpoint the
best match for this intervention model.” (Administrator/Supervisor)
Although we saw lots of variability across the comments, it was clear that the participants saw this
decision about when and how to offer PLAY to families as important yet complicated. The complexity
also included deciding on what is PLAY v. what is not:
“I offer them a flyer and see if they are interested. If not, I can use the techniques in their
intervention.” (Certified Consultant)
“I will use the techniques whenever appropriate. Whether I call it PLAY project or not and use
the videotaping and written reviews will depend on the needs of the child, where the family is
in accepting the child’s needs, family’s ‘buy-in’ to early
intervention and their history of following through with
suggestions before PLAY project as well as my schedule/caseload. I
will have to prioritize depending on these things because I could
use the PLAY project with many kids, but those with the most
obvious ASD symptoms will take priority due to my schedule.”
(Consultant-in-Training)
“If a family is not willing to make the time commitment, the PLAY
consultant will use the PLAY strategies. But we do not consider them as participating in the
PLAY Project.” (Administrator/Supervisor)
Finally, one administrator/supervisor commented: “We are working to determine this process now. We
could use some guidance.”
IMPACTS OF THE PLAY PROJECT OHIO TRAINING ON CHILDREN, FAMILIES, AND
PARTICIPANTS
PLAY participants were asked to think back to their work with children and
families PRIOR to the beginning of the PLAY training and certification process,
and to rate their comfort level in a number of areas. The
administrators/supervisors were asked to rate the comfort level of their staff
participating in PLAY. The results in the table below suggest that these early
interventionists, although comfortable with observing and talking about
development, prior to the four-day training were not nearly so self-confident
51
in their abilities to coach and give feedback to families. In addition, approximately a third of them were
even uncomfortable focusing on parent-child interactions or providing parents with strategies.
Certified In-Training
Administrator/Supervisor perceptions of staff
PRIOR to PLAY, how comfortable were you in each of these areas?
Not comfortable
at all or Slightly
Comfortable
More comfortable than Not or
Highly Comfortable
Not comfortable
at all or Slightly
Comfortable
More comfortable than Not or
Highly Comfortable
Not comfortable
at all or Slightly
Comfortable
More comfortable than Not or
Highly Comfortable
My understanding of autism spectrum disorder
37.4% 62.6 39.6% 60.4% 39.1% 60.9%
Talking to families about their child’s development
21.9% 78.1% 22.7% 77.4% 26.1% 73.9%
My child observational skills
25% 75% 20.8% 79.2% 17.4% 82.6%
Focusing on parent-child interactions
37.6% 62.5% 39.5% 60.5% 56.5% 43.5%
Intervention strategies to teach families
38.7% 61.3% 35.8% 64.2% 30.4% 69.6%
Confidence in coaching families
46.9% 53.1% 51% 49% 47.8% 52.2%
Confidence in giving feedback to families
59.4% 40.7% 60.4% 39.6% 63.6% 36.4%
However, those perceptions changed over time. We asked a second question later in the survey in which
the participants were asked to rate the impact of the PLAY training and certification on those same
dimensions. (See the table on the next page.) An overwhelming majority of participants from all groups
reported that the PLAY training and certification either “Somewhat” or “Definitely” enhanced the quality
of their work with children and families. A statistical analysis pairing the pre-post responses showed
that in every dimension, the participants reported themselves as more confident.
52
Certified In-Training
Administrator/ Supervisor
perceptions of staff
Has the PLAY training and certification enhanced your work with children and families in any of these ways?
Somewhat or Definitely
Somewhat or Definitely
Somewhat or Definitely
I understand ASD more clearly 97% 93.6% 100%
It is easier for me to talk with families about their child
97% 93.6% 100%
My observational skills have sharpened
100% 95.7% 100%
I pay more attention to parent-child interactions
100% 95.7% 100%
I have learned new intervention strategies to teach families
100% 97.9% 100%
I am more confident coaching families
100% 89.4% 100%
I am more confident giving feedback to families about their child
100% 89.4% 100%
Administrators/Supervisors commented on these changes:
“They always come back from a visit at some point and say, ‘It works!’ They like that they feel
more successful and have given the parents more control of their own success with their child.”
“PLAY has given them confidence in working with all
of their families and children – not just those officially
in PLAY Project.”
“They have gained coaching skills, intervention skills,
and confidence. They ‘see’ children differently. They
understand family interactions differently. They
approach families differently.”
The virtual focus group conducted in June also provided some
feedback from participants regarding the impact of PLAY on
their intervention efforts:
53
“It has slowed me down into observing/watching/listening to the child and how they say
what they say or do what they’re doing – it has helped me stop talking so much and listen to
what’s going on.”
“It helped me build rapport [with my families] and get them on my side so they take risks -
PLAY gave me a framework to hand that off to the families – I was stuck before – I did my
treatment and handed them [the child] back to their families, but I wasn’t doing the part of
building trust and facilitating engagement.”
“…We’ve talked about this for years, but putting words to strategies – giving definitions to
some of the strategies we’ve been talking about- it’s been nice and I use that with PLAY
families.”
Impacts from the perspective of families. During phone interviews, parents were
asked three open-ended questions about impacts: “How has the PLAY Project
benefited you and your child? Your family? What has been the best part of
PLAY?” Parents could share up to 5 responses per question. Since the parents
commented on the child and/or family across all of the questions, we combined
the responses (N = 178) and used a qualitative approach to organize the total
group of statements into three major categories (Impact on Child, Impact on
Parents, and Impact on Relationships) and subcategories (please see the figure on the next page).
The largest number of statements fell into the “Impact on Parent” category. As one parent described,
“It’s given me more help than it has my child. When it helps me, it helps him more because I can apply it
to him.” Parents clearly felt that they had learned how to interact and play with their child, and that
they understood their child and autism better: “He loves to be played with and we did not realize that,
we thought he was happy playing in the corner.” Decreased stress and a sense of hopefulness were also
described by the families: “It’s helped my stress level go down as I see positive changes and a positive
future for him and our family.”
Additional comments from families about recommending PLAY to other families
summarized their positive feelings about PLAY:
“It changed our lives and we are forever grateful.”
“It gives you a better understanding of your child.”
“Absolutely. It was a wonderful experience.”
“It helped my son more than I could have ever on my own. I tell
everyone about it.”
“Most definitely. It helps us understand, helps us interact with him more and helps him interact with
us…”
54
55
“I thought I understood everything after the training, but once I began I had more questions.”
RECOMMENDATIONS FROM THE PROFESSIONALS AND FAMILIES
We asked two questions of both the professionals and the families that focused
on “recommendations”:
Would you recommend the PLAY training and certification to others in
our field?
What, if anything, would you have changed about the PLAY training and
certification process?
What the professionals recommended. The table below indicates that the professionals who responded
to the online surveys clearly felt comfortable recommending the training and certification to others:
Certified Consultants-In-Training
Administrators/ Supervisors
% YES 100% 95.5% 100%
We received a total of 124 comments from the three groups in response to our request for
recommendations about changes. We categorized these comments into nine themes:
Theme Number of Comments
1. More preparation in the four-day training 33
2. Supervisor feedback 32
3. Certification requirements 18
4. Changes in the PLAY model 12
5. Collaborative support 12
6. Technology 7
7. Administrative support 7
8. Professional credit 2
9. Miscellaneous 1
1. More preparation in the four-day training. The comments in this largest category indicated that the
participants wished for more “nuts and bolts” of PLAY to be included in the four-day training: more
samples of video reviews/reports (along with the corresponding video), clearer guidelines on what
to give families to supplement a verbal explanation of PLAY, more information on what a typical visit
looks like, how to choose families that are a good match for PLAY, what a 1.5 hour visit would look
like compared to a three-hour visit, more examples of how to coach families while the camera is
recording, how to structure a home visit, videos of actual home visits, and/or how to write a report
step by step. Several people mentioned that the amount of information in the four days was
4. Improve the consistency and quality of data collection.
o Without timely, thorough and complete data on the four-day training and trainee progress
toward certification, the PLAY Project will find it difficult to demonstrate the impact of its
implementation practices or engage in thoughtful, data-driven quality improvement.
“Efforts to promote the use of any type of ECI practice require attention to not only the
fidelity of the practice, but also the fidelity of the methods used to promote the use of the
intervention practice” (Dunst et al., 2013, p. 86).
5. Improve the supervision process during certification.
o Improve the consistency in how supervisors are recruited and trained.
o Conduct periodic “fidelity checks” of supervisor feedback.
o Monitor the time lag between trainee video submission and supervisor feedback.
o Explore strategies to improve the immediacy of feedback.
o Provide trainees with more detailed feedback (e.g., the report rubric instead of a single
score) to help them analyze their own practices and “self-correct.”
o Include trainee self-assessment as part of the supervision process.
6. Revisit the certification requirements and the trade-offs between quantity and quality.
o How many video submissions are needed to demonstrate consistent fidelity?
o Are the current alternatives really equivalent to a video submission?
o How can the current alternatives include more opportunities for the trainee to reflect on
his/her own practices?
7. Create a new DVD to help explain the PLAY model to families.
o Shorter in length.
o Consistent with change from DSM-IV to DSM-5.
o Person-first language.
o Video examples that represent a wider range of chronological ages (i.e., toddlers) and
the entire spectrum of autism.
Joint Recommendations for the PLAY Project and the Ohio Department of Developmental
Disabilities
8. Explore how the PLAY model tested in the research “fits” into a statewide early intervention
system.
o Is a monthly three-hour visit the best match for the developmental characteristics of
toddlers and the schedules of families?
o If not, what does “the equivalent” look like? Should the visits be more frequent? If so, how
often should the videotaping/written report occur?
o What other components can and should be adapted and to what extent? For example,
which PLAY assessment tools should be used and how often? How often should the Visit
Suggestion Report be left with the family? How often should the PLAY plan be revised?
63
Recommendations for the Ohio Department of Developmental Disabilities
9. Develop guidance in response to the systems challenges identified by the participants.
o In counties where the PSP model is being implemented, what is the role of the professional
implementing PLAY? Is that person considered the PSP, responsible for implementing PLAY
and the IFSP outcomes? Or should that person focus solely on PLAY? If so, how will the rest
of the IFSP be addressed?
o What, if any, are the differences in “coaching” between PLAY and the primary service
provider approach to learning as taught by Shelden and Rush?
o Are there certain families and children who are a better match for PLAY? Should counties be
developing a protocol? If so, what criteria should they be considering?
o How does the PLAY paperwork fit into HMG and DODD paperwork requirements?
o Would fidelity to PLAY be strengthened by having dedicated PLAY Consultants, either within
a county or shared across counties?
10. Revisit the requirements to participate in the PLAY training and certification process.
o Given the factors that support and/or hinder certification progress, should factors such as
size of the county and/or number of toddlers diagnosed with ASD make a difference?
11. Strengthen local administrative support for Consultants-in-Training and Certified Consultants.
o Continue to recommend administrator/supervisor attendance at the four-day training.
o Consider linking administrators/supervisors new to PLAY with administrators/supervisors
who have been successful in resolving local challenges and supporting their staff.
o Develop and disseminate administrative strategies that have addressed the local “real
world” challenges of PLAY (e.g., caseload guidelines for Consultants-in-Training and for
Certified Consultants that accommodate the additional time required to insure fidelity of
PLAY implementation).
12. Strengthen the ongoing support provided to Certified PLAY Consultants to help them maintain
fidelity.
o Continue and expand the regional meetings.
o Explore strategies to build a mentorship network.
o Consider developing a virtual PLAY Community of Practice.
In closing, the evaluation clearly revealed the many strengths of the Ohio PLAY Project training and
certification process, and we anticipate that it will continue to have an impact on both the professionals
and families who participated. We are confident that these recommendations can lead to an even more
effective Ohio implementation of the PLAY model in the future.
64
The Evaluation Team
Marilyn Espe-Sherwindt, Ph.D., is Director of the Family Child Learning Center (FCLC), a demonstration,
research and training center that focuses exclusively on issues related to young children with disabilities
and their families. As a community-based program of Akron Children’s Hospital (ACH), since its inception
FCLC has been a national model for best practices in early childhood intervention. During her career in
early intervention, Dr. Espe-Sherwindt has directed multiple federal and state-funded personnel
preparation and systems change projects, and has served as the external evaluator for other projects.
Through grants and contracts with various state and local agencies and organizations, she has designed
and implemented program evaluation, written guidance documents, and developed and delivered
inservice training for early intervention providers and preschool special education personnel. Her
research publications, presentations and workshops have focused on collaboration, family-centered
practices, early diagnosis and intervention for toddlers with autism spectrum disorder, and family
engagement in both Part C early intervention and Part B preschool special education. Dr. Espe-
Sherwindt serves as Adjunct Faculty, Institute of Child Study, Universidade do Minho, Braga, Portugal,
and as Adjunct Associate Professor, MAT Program, Rossier School of Education, University of Southern
California.
M. David Gothard, M.S., is President/Biostatistician at Biostats Inc., providing data analysis services
primarily to clinical researchers and healthcare institutions. He has senior level biostatistician
experience working in Research Triangle Park, NC in the field of Phase I-IV drug development and
provided biostatistical support for Synagis® through the FDA approval process. Mr. Gothard previously
worked at Akron Children’s Hospital’s Considine Research Institute as the biostatistician responsible for
supporting resident, fellow, and faculty research and designing/teaching the fellows’ research core
curriculum. He has also taught introductory and advanced level statistics courses at the graduate and
undergraduate levels for over a decade at the University of Kentucky and Ashland University and is
currently an adjunct faculty member at the Consortium of Eastern Ohio Master of Public Health
(CEOMPH) program.
Brianne Buletko, B.S., is a Research Assistant at the Family Child Learning Center. In addition to
overseeing the data collection in FCLC’s Integrated Research Preschool for Children with Autism, she is
also responsible for planning and coordinating the preschool’s intervention component for families. Ms.
Buletko is currently working towards her Master’s in Clinical Mental Health Counseling at Kent State
University. Prior to her current position at FCLC, she worked on several different research and
evaluation projects at The Cleveland Clinic, Nationwide Children’s Hospital, Otterbein University, and the
San Felipe Primary School in Belize.
Georgie Stoner, B.S., is the mother of a 37-year-old son, Andrew, with cerebral palsy and a cognitive
disability. Throughout her years at FCLC, Ms. Stoner has been a recognized leader in providing support
and information to families in Ohio’s early intervention system, both in person and virtually through
statewide webinars. In her role as the Northeast Regional Coordinator for the Family Information
Network (FINof Ohio), she developed and offered workshops for families, oversaw the publication of the
65
award-winning newsletter FINFacts, assisted with program evaluation, and, as a member of the regional
state monitoring team, gathered information from families via interviews and surveys. In her current
role at FCLC, Ms. Stoner continues to welcome, support and educate families, as well as represent the
family perspective in FCLC’s research, program implementation, and graduate training activities.
Abbie Wheeden McCauley, Ph.D., is the Program Director of the Integrated Research Preschool for
Children with Autism at the Family Child Learning Center, Akron Children’s Hospital. The FCLC preschool
provides quality intervention services to young children with ASD, parent support and education, clinical
supervision and training to undergraduate and graduate students from area universities, as well as
conducts program evaluation and research. In addition, Dr. McCauley plays an integral role in the
Autism Diagnostic Education Program (ADEP), a statewide program that facilitates unique partnerships
between community-based primary care practices and professionals providing early intervention
services in order to increase access to local and timely standardized, comprehensive diagnostic
evaluations for children suspected of having an ASD. Dr. McCauley’s presentations and publications
have primarily focused on topics related to the diagnosis of young children with autism spectrum
disorder, preschool special education, as well as the use of the Language Environment Analysis (LENA) in
examining the language development of children with ASD. Dr. McCauley has served as an adjunct
instructor at Kent State University and Case Western Reserve University.
66
References
Boyd, B.,A., Hume, K., McBee, M.T., Alessandri, M., Gutierrez, A., Johnson, L., Sperry, L., & Odom, S.L. (2013). Comparative efficacy of LEAP, TEACCH, and non-model-specific special education programs for preschoolers with autism spectrum disorders. Journal of Autism and Developmental Disorders, DOI 10.1007/s10803-013-1877-9.
Brantlinger, E., Jimenez, R., Klingner, J., Pugach, M., & Richardson, V. (2005). Qualitative studies in special education. Exceptional Children, 71(2), 195-207.
Bronfenbrenner, U. (1979). The ecology of human development: Experiments by nature and design. Cambridge, MA: Harvard University Press.
Centers for Disease Control and Prevention. (2015). Autism Spectrum Disorder (ASD). Retrieved 7/10/15 from http://www.cdc.gov/ncbddd/autism/data.html.
Cook, B.G., & Odom, S.L. (2013). Evidence-based practices and implementation science in special education. Exceptional Children, 79(2), 135-144.
Dawson, G., Rogers, S., Munson, J., Smith, M., Winter, J., Greenson, J., Donaldson, A., & Varley, J. (2010). Randomized, controlled trial of an intervention for toddlers with autism: The Early Start Denver Model. Pediatrics, 125(1), e17-e23.
Dunst, C.J., & Raab, M. (2010). Practitioners’ self-evaluations of contrasting types of professional development. Journal of Early Intervention, 32(4), 239-254.
Dunst, C.J., & Trivette, C.M. (2009). Let’s be PALS: An evidence-based approach to professional development. Infants & Young Children, 22(3), 164-175.
Dunst, C.J., & Trivette, C.M. (2012). Meta-analysis of implementation practice research. In B. Kelly & D.F. Perkins (Eds.), Handbook of implementation science for psychology in education (pp. 68-91). New York, NY: Cambridge University Press.
Dunst, C.J., Trivette, C.M., & Raab, M. (2013). An implementation science framework for conceptualizing and operationalizing fidelity in early childhood intervention studies. Journal of Early Intervention, 35(2), 85-101.
Fincham, J. E. (2008). Response rates and responsiveness for surveys, standards, and the journal. American Journal of Pharmaceutical Education, 72(2), 43.
Franks, R.P. (n.d.) Implementation science: What do we know and where do we go from here? Retrieved 7/1/2015 from http://www.researchconnections.org/files/childcare/pdf/FranksPresentation.pdf
Hardan, A. Y., Gengoux, G. W., Berquist, K. L., Libove, R. A., Ardel, C. M., Phillips, J., Frazier, T. W. & Minjarez, M. B. (2015). A randomized controlled trial of Pivotal Response Treatment Group for parents of children with autism. Journal of Child Psychology and Psychiatry, 56: 884–892. DOI: 10.1111/jcpp.12354
Harn, B., Parisi, D., & Stoolmiller, M. (2013). Balancing fidelity with flexibility and fit: What do we really know about fidelity of implementation in schools? Exceptional Children, 79(2), 181-193.
Kelly, B. (2012). Implementation science for psychology in education. In B. Kelly & D.F. Perkins (Eds.), Handbook of implementation science for psychology in education (pp. 1-12). New York, NY: Cambridge University Press.
Kirkpatrick, D. L. (1994). Evaluating training programs. San Francisco: Berrett-Koehler Publishers, Inc.
Lincoln, Y., & Guba, E. (1985). Naturalistic inquiry. Newbury Park, CA: Sage.
McHugo, G.J., Drake, R.E., Whitley, R., Bond, G.R., Campbell, K., Rapp, C.A., Goldman, H.H., Lutz, W.J., & Finnerty, M.T. (2007). Fidelity outcomes in the national implementing evidence-based practices project. Psychiatric Services, 58(10), 1279-1284.
Melnyk, B.M., & Fineout-Overhold, E. (2012). The state of evidence-based practice in US nurses: Critical implications for nurse leaders and educators. Journal of Nursing Administration, 42(9), 410-417.
Patton, M. Q. (1990). Qualitative evaluation and research methods. Newbury Park, CA: Sage Publications.
Rogers, S.J., Estes, A., Lord, C., Vismara, L., Winter, J., Fitzpatrick, A., Guo, M., & Dawson, G. (2012). Effects of a brief Early Start Denver Model (ESDM)-based parent intervention on toddlers at risk for autism spectrum disorders: A randomized controlled trial. JAACAP, 51(10), 1052-1065.
Solomon, R., Van Egeren, L., Mahoney, G., Quon Huber, M., & Zimmerman, P. (2014). PLAY Project home consultation intervention program for young children with Autism Spectrum Disorders: A randomized controlled trial. Journal of Developmental and Behavioral Pediatrics, 35(8), 475-485.
Sykes, H., & Temple, J. (2012). A systematic review to appraise the evidence relating to the impact and effects of formal continuing professional education on professional practice. Journal of Nursing Education and Practice, 2(4), 194-212.
Vismara, L., Colombi, C., & Rogers, S.J. (2009). Can one hour per week of therapy lead to lasting changes in young children with autism? Autism, 13(1) 93-115.
Watt, S., Simpson, C., McKillop, C., & Nunn, V. (2002). Electronic course surveys: Does automating feedback and reporting give better results? Assessment & Evaluation in Higher Education, 27(4), 325-337.
Welsh, J.A. (2012). Implementation of intervention to promote school readiness. In B. Kelly & D.F. Perkins (Eds.), Handbook of implementation science for psychology in education (pp. 184-203). New York, NY: Cambridge University Press.
Wetherby, A.M., Guthrie, W., Woods, J., Schatschneider, C., Holland, R.d., Morgan, L., & Lord, C. (2014). Parent-implemented social intervention for toddlers with autism: An RCT. Pediatrics, originally published online November 3, 2014. DOI: 10.1542/peds.2014-0757.