1 FUNCTIONAL DESIGN OF THE RESPIRATORY SYSTEM (Comparative aspects) -The dependence on oxygen. Gas diffusion and convection -Mechanisms of gas convection -The design of the mammalian respiratory system -Animal size and metabolic requirements -Respiratory adaptation to changes in body size and metabolic rate 1. Structure of the lungs and respiratory pump 2. Passive mechanical properties 3. Ventilation and dynamics of breathing 4. Distribution of ventilation 5. Transport of gases 6. Aspects of the regulation of the breathing pattern Respiration is gas exchange, specifically the exchange by a living organism of carbon dioxide (CO 2 ), a waste product formed during the oxidation of food molecules, for oxygen (O 2 ), which the organism needs to continue oxidizing its food. At the cellular level, gas exchange occurs by diffusion, according to the partial pressure gradient of the gas. In large cell aggregates and more complex organisms diffusion alone would not fulfill the minimal cellular metabolic requirements. Therefore, gas convection mechanisms are coupled to diffusion in what constitutes the respiratory apparatus. In this chapter, first, the various mechanisms of convection in invertebrates and lower vertebrates are briefly presented. Mammals are then examined in more detail by addressing the question of how changes in body size influence metabolic and ventilatory requirements, and how these requirements are met by modifications in structural design and functional properties of the respiratory system. THE DEPENDENCE ON OXYGEN. GAS DIFFUSION AND CONVECTION The respiratory system is designed to provide gas exchange, i.e. to fulfill the cellular necessity for O 2 and to eliminate the by-product of cellular respiration, CO 2 . Anaerobic mechanisms to generate energy are available but they are much less efficient * [*for example, from 1 molecule of glucose, glycolysis yields only 2 molecules of ATP, since most of the glucose energy remains in the lactic acid; full aerobic combustion of glucose yields 36 ATP] and usually represent emergency or short lasting routes of energy production; when anaerobic means are adopted, then, aerobically produced energy needs to be spent to pay back the oxygen debt [Fig.1]. Because the pressure of O 2 in the environment is much higher than in the cells (and in the cells the
Transcript
1
FUNCTIONAL DESIGN OF THE RESPIRATORY SYSTEM
(Comparative aspects) -The dependence on oxygen. Gas diffusion and convection -Mechanisms of gas convection -The design of the mammalian respiratory system -Animal size and metabolic requirements -Respiratory adaptation to changes in body size and metabolic rate
1. Structure of the lungs and respiratory pump 2. Passive mechanical properties 3. Ventilation and dynamics of breathing 4. Distribution of ventilation 5. Transport of gases 6. Aspects of the regulation of the breathing pattern
Respiration is gas exchange, specifically the exchange by a living organism of carbon dioxide (CO2), a waste product formed during the oxidation of food molecules, for oxygen (O2), which the organism needs to continue oxidizing its food. At the cellular level, gas exchange occurs by diffusion, according to the partial pressure gradient of the gas. In large cell aggregates and more complex organisms diffusion alone would not fulfill the minimal cellular metabolic requirements. Therefore, gas convection mechanisms are coupled to diffusion in what constitutes the respiratory apparatus. In this chapter, first, the various mechanisms of convection in invertebrates and lower vertebrates are briefly presented. Mammals are then examined in more detail by addressing the question of how changes in body size influence metabolic and ventilatory requirements, and how these requirements are met by modifications in structural design and functional properties of the respiratory system. THE DEPENDENCE ON OXYGEN. GAS DIFFUSION AND CONVECTION The respiratory system is designed to provide gas exchange, i.e. to fulfill the cellular necessity for O2 and to eliminate the by-product of cellular respiration, CO2. Anaerobic mechanisms to generate energy are available but they are much less efficient* [*for example, from 1 molecule of glucose, glycolysis yields only 2 molecules of ATP, since most of the glucose energy remains in the lactic acid; full aerobic combustion of glucose yields 36 ATP] and usually represent emergency or short lasting routes of energy production; when anaerobic means are adopted, then, aerobically produced energy needs to be spent to pay back the oxygen debt [Fig.1]. Because the pressure of O2 in the environment is much higher than in the cells (and in the cells the
2
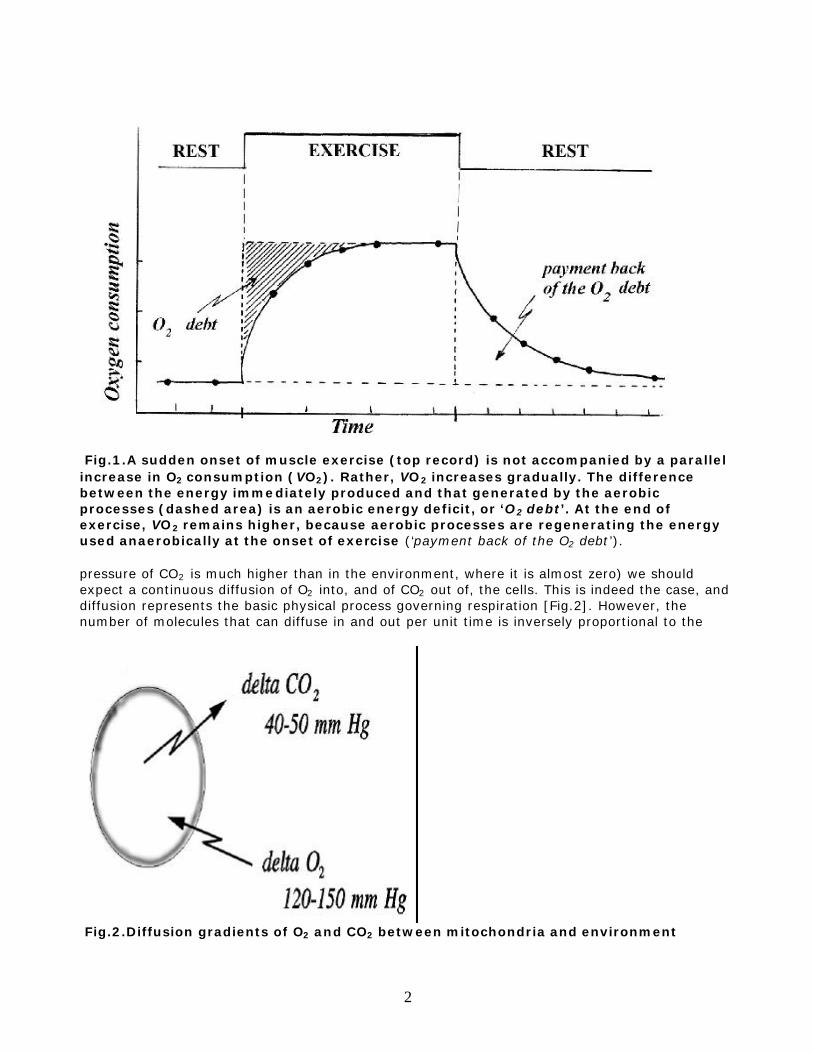
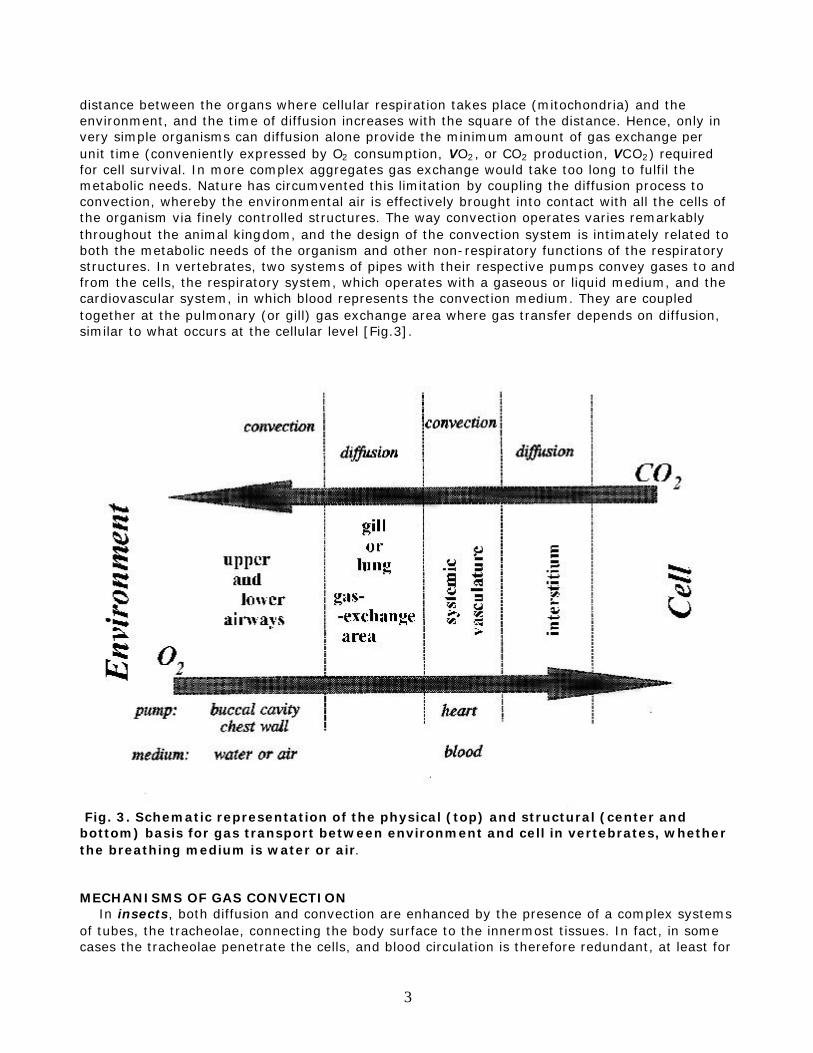
Fig.1.A sudden onset of muscle exercise (top record) is not accompanied by a parallel increase in O2 consumption (VO2). Rather, VO2 increases gradually. The difference between the energy immediately produced and that generated by the aerobic processes (dashed area) is an aerobic energy deficit, or ‘O2 debt’. At the end of exercise, VO2 remains higher, because aerobic processes are regenerating the energy used anaerobically at the onset of exercise (‘payment back of the O2 debt’). pressure of CO2 is much higher than in the environment, where it is almost zero) we should expect a continuous diffusion of O2 into, and of CO2 out of, the cells. This is indeed the case, and diffusion represents the basic physical process governing respiration [Fig.2]. However, the number of molecules that can diffuse in and out per unit time is inversely proportional to the
Fig.2.Diffusion gradients of O2 and CO2 between mitochondria and environment
3
distance between the organs where cellular respiration takes place (mitochondria) and the environment, and the time of diffusion increases with the square of the distance. Hence, only in very simple organisms can diffusion alone provide the minimum amount of gas exchange per unit time (conveniently expressed by O2 consumption, VO2, or CO2 production, VCO2) required for cell survival. In more complex aggregates gas exchange would take too long to fulfil the metabolic needs. Nature has circumvented this limitation by coupling the diffusion process to convection, whereby the environmental air is effectively brought into contact with all the cells of the organism via finely controlled structures. The way convection operates varies remarkably throughout the animal kingdom, and the design of the convection system is intimately related to both the metabolic needs of the organism and other non-respiratory functions of the respiratory structures. In vertebrates, two systems of pipes with their respective pumps convey gases to and from the cells, the respiratory system, which operates with a gaseous or liquid medium, and the cardiovascular system, in which blood represents the convection medium. They are coupled together at the pulmonary (or gill) gas exchange area where gas transfer depends on diffusion, similar to what occurs at the cellular level [Fig.3].
Fig. 3. Schematic representation of the physical (top) and structural (center and bottom) basis for gas transport between environment and cell in vertebrates, whether the breathing medium is water or air. MECHANISMS OF GAS CONVECTION In insects, both diffusion and convection are enhanced by the presence of a complex systems of tubes, the tracheolae, connecting the body surface to the innermost tissues. In fact, in some cases the tracheolae penetrate the cells, and blood circulation is therefore redundant, at least for
4
the purposes of gas convection. In others, tracheolae deliver O2 to the hemolymph, where it is exchanged by diffusion, and the hemolymph delivers to the cells. The quantity of air circulated (Ventilation, VE) is regulated via spiracles [Fig.4], according to control programs which compromise between the metabolic
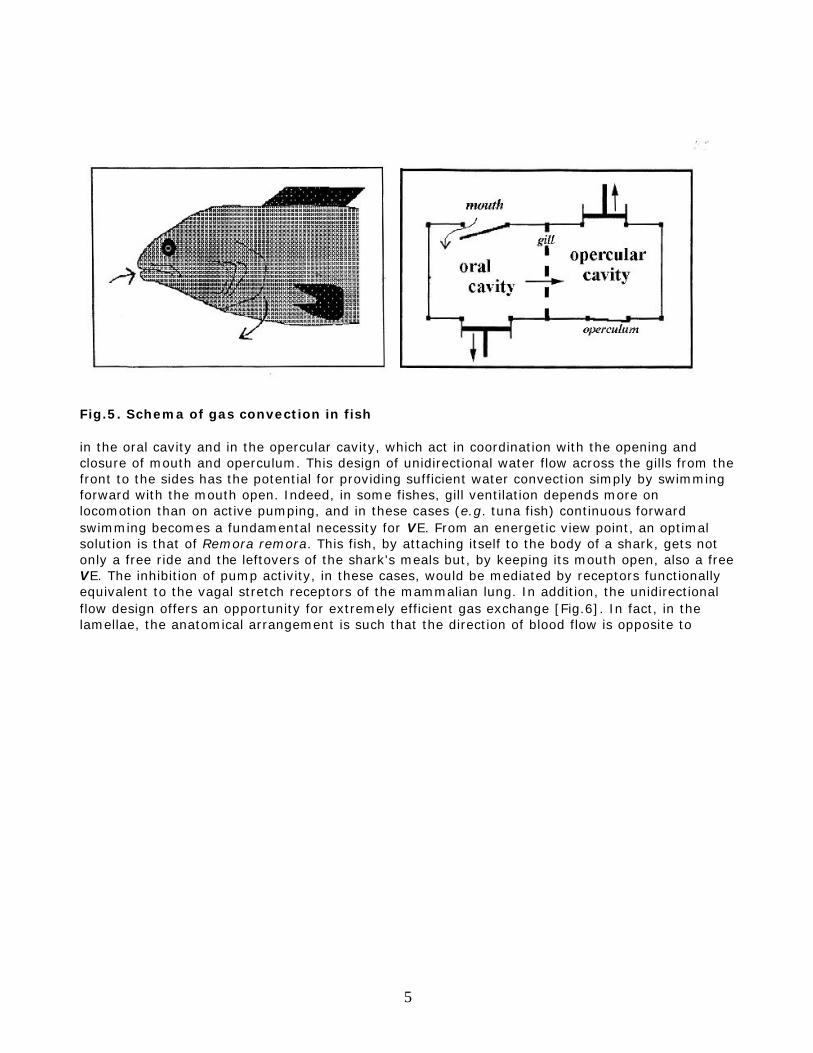
Fig.4. Frequency of spiracles opening in a flea (Xenopsylla cheopis) at 20-22oC, exposed to hypoxic or hyperoxic environments. (Modified from Dejours, Principles of Respiratory Physiology, Elsevier, 1975, based on data from Wigglesworth, Proc.Royal Soc.B, 118:397-419, 1935). necessities of the insect and the problem of water loss which would accompany excessive exposure of inner body surfaces. Enormous increases in gas exchange area can be achieved not only by inward foldings, as in the case of the insects tracheolae, but also by outward protrusions, as in the case of the multiple lamellae of fish gills. In fish, the large diffusion area of the gills is placed along the unidirectional stream of water entering the mouth and exiting via the operculum, behind the gill filaments. The unidirectional flow is usually helped by two aspiration-compression pumps [Fig.5],
5
Fig.5. Schema of gas convection in fish in the oral cavity and in the opercular cavity, which act in coordination with the opening and closure of mouth and operculum. This design of unidirectional water flow across the gills from the front to the sides has the potential for providing sufficient water convection simply by swimming forward with the mouth open. Indeed, in some fishes, gill ventilation depends more on locomotion than on active pumping, and in these cases (e.g. tuna fish) continuous forward swimming becomes a fundamental necessity for VE. From an energetic view point, an optimal solution is that of Remora remora. This fish, by attaching itself to the body of a shark, gets not only a free ride and the leftovers of the shark's meals but, by keeping its mouth open, also a free VE. The inhibition of pump activity, in these cases, would be mediated by receptors functionally equivalent to the vagal stretch receptors of the mammalian lung. In addition, the unidirectional flow design offers an opportunity for extremely efficient gas exchange [Fig.6]. In fact, in the lamellae, the anatomical arrangement is such that the direction of blood flow is opposite to
6
Fig.6. Simplified models of gas exchange. At top, air is conveyed and mixed in a chamber, where the partial pressure of O2 (PO2) is less than inspired (PIO2). The PO2 of ‘arterialised’ blood leaving the chamber at best (i.e. no diffusion limitation) will be as in the chamber, and always less than PIO2. In the concurrent exchange system (middle) the partial pressures of the air and the blood leaving the exchange area will be the same. In the countercurrent exchange system (bottom) the PO2 of the arterialised blood can approach the inspired. (Modified from Dejours, Principles of Respiratory Physiology, Elsevier, 1975)
7
that of the water (counter-current pattern). Hence, the venous blood reaching the gill capillaries is meeting water with progressively higher PO2, and the arterialized blood leaving the gill capillaries can have a PO2 higher than that of the water leaving the gas exchange area. This would never be the case with the back-and-forth design of the mammalian VE, whereby the value of arterial PO2 can approach but never exceed alveolar or expired PO2. Gas convection in some amphibians is a clear example of positive pressure ventilation. The upward lifting of the mouth floor generates a positive pressure which forces air into the lungs [Fig.7]. This mechanism is in many respects simpler than
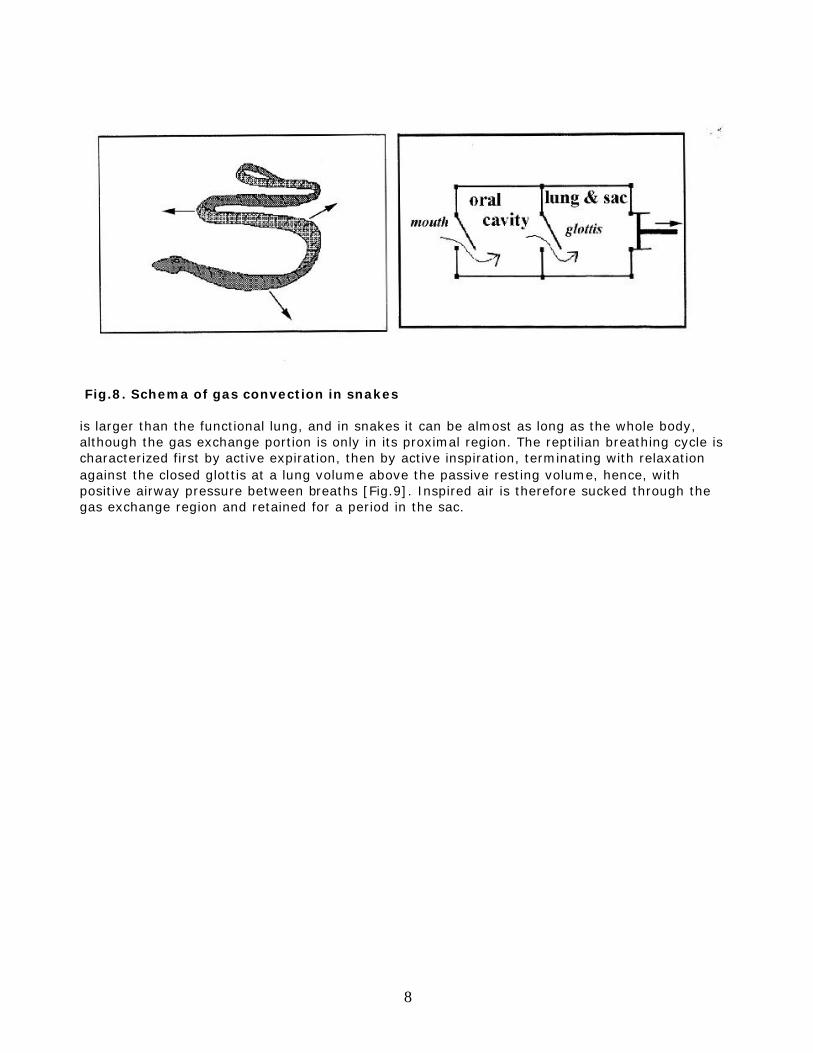
Fig.7. Schema of gas convection in frogs the double pump arrangement of the fish, and is only aided by the valve action of the nares and the glottis. As far as the mechanics of lung inflation, positive pressure 'buccal' ventilation is more effic ient than the mammalian suction pump since chest expansion of the lung by positive pressure eliminates the inefficiency caused by chest distortion. On the other hand, the mouth VE of the amphibians has obvious disadvantages. The inflation volume is limited by the size of the mouth, and VE in amphibians has to compromise with the non-respiratory functions of the upper airways more than it does in reptiles, birds and mammals. Turtles were first thought to breathe with a mechanism similar to that of the amphibians, but it is now clear that they operate by negative pressure ventilation as in other reptiles. Contraction of chest wall muscles, laterally located in the turtle, more circularly placed in lizards and snakes, lowers the pressure inside an air sac generating inspiratory flow [Fig.8]. The sac
8
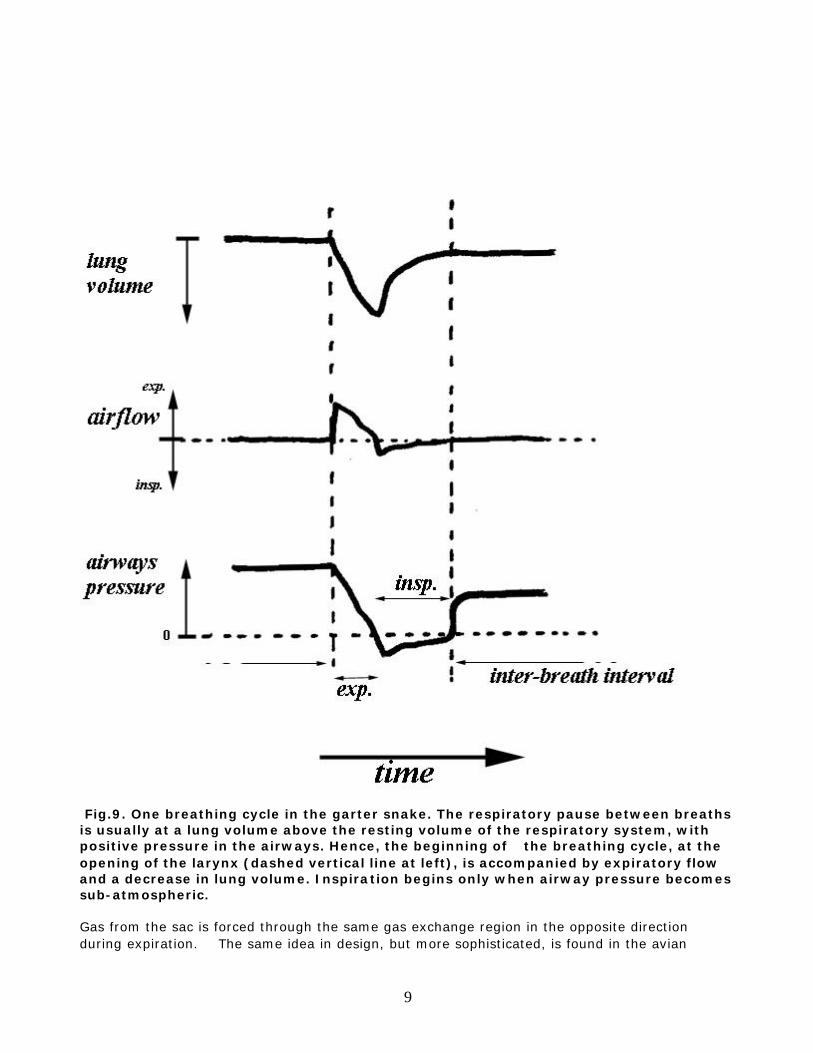
Fig.8. Schema of gas convection in snakes is larger than the functional lung, and in snakes it can be almost as long as the whole body, although the gas exchange portion is only in its proximal region. The reptilian breathing cycle is characterized first by active expiration, then by active inspiration, terminating with relaxation against the closed glottis at a lung volume above the passive resting volume, hence, with positive airway pressure between breaths [Fig.9]. Inspired air is therefore sucked through the gas exchange region and retained for a period in the sac.
9
Fig.9. One breathing cycle in the garter snake. The respiratory pause between breaths is usually at a lung volume above the resting volume of the respiratory system, with positive pressure in the airways. Hence, the beginning of the breathing cycle, at the opening of the larynx (dashed vertical line at left), is accompanied by expiratory flow and a decrease in lung volume. Inspiration begins only when airway pressure becomes sub-atmospheric. Gas from the sac is forced through the same gas exchange region in the opposite direction during expiration. The same idea in design, but more sophisticated, is found in the avian
10
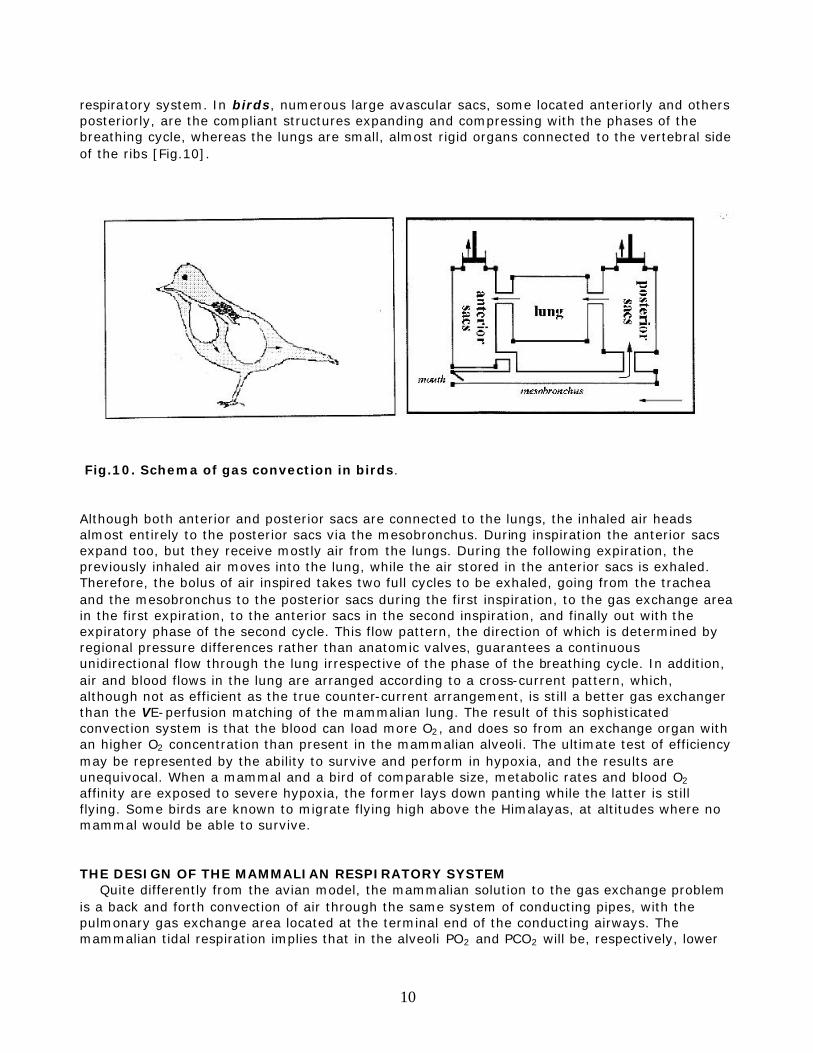
respiratory system. In birds, numerous large avascular sacs, some located anteriorly and others posteriorly, are the compliant structures expanding and compressing with the phases of the breathing cycle, whereas the lungs are small, almost rigid organs connected to the vertebral side of the ribs [Fig.10].
Fig.10. Schema of gas convection in birds. Although both anterior and posterior sacs are connected to the lungs, the inhaled air heads almost entirely to the posterior sacs via the mesobronchus. During inspiration the anterior sacs expand too, but they receive mostly air from the lungs. During the following expiration, the previously inhaled air moves into the lung, while the air stored in the anterior sacs is exhaled. Therefore, the bolus of air inspired takes two full cycles to be exhaled, going from the trachea and the mesobronchus to the posterior sacs during the first inspiration, to the gas exchange area in the first expiration, to the anterior sacs in the second inspiration, and finally out with the expiratory phase of the second cycle. This flow pattern, the direction of which is determined by regional pressure differences rather than anatomic valves, guarantees a continuous unidirectional flow through the lung irrespective of the phase of the breathing cycle. In addition, air and blood flows in the lung are arranged according to a cross-current pattern, which, although not as efficient as the true counter-current arrangement, is still a better gas exchanger than the VE-perfusion matching of the mammalian lung. The result of this sophisticated convection system is that the blood can load more O2, and does so from an exchange organ with an higher O2 concentration than present in the mammalian alveoli. The ultimate test of efficiency may be represented by the ability to survive and perform in hypoxia, and the results are unequivocal. When a mammal and a bird of comparable size, metabolic rates and blood O2 affinity are exposed to severe hypoxia, the former lays down panting while the latter is still flying. Some birds are known to migrate flying high above the Himalayas, at altitudes where no mammal would be able to survive. THE DESIGN OF THE MAMMALIAN RESPIRATORY SYSTEM Quite differently from the avian model, the mammalian solution to the gas exchange problem is a back and forth convection of air through the same system of conducting pipes, with the pulmonary gas exchange area located at the terminal end of the conducting airways. The mammalian tidal respiration implies that in the alveoli PO2 and PCO2 will be, respectively, lower
11
and higher than in the environment [Fig.11]. Because the alveoli are the terminal structures, the blood leaving the pulmonary
12
13
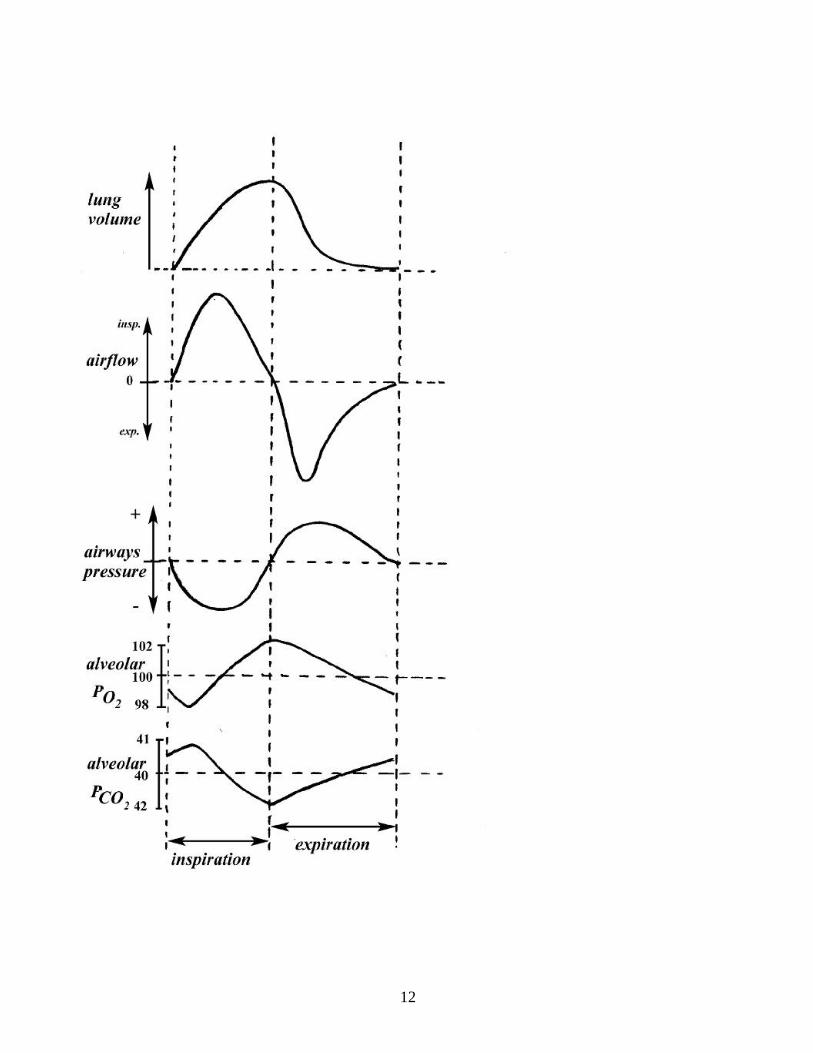
Fig. 11. Mammalian breathing. Changes in lung volume (spirogram), flow (pneumotachogram) and intra-airways pressure during a breathing cycle. During the cycle, alveolar pressure of O2 and CO2 (PAO2, PACO2) oscillate around a mean value, with a profile that depends on the characteristics of the breathing pattern and metabolic rate. At the beginning of inspiration, PAO2 drops and PACO2 increases because the inspired air (of which, at sea level, PO2 is about 150 and PCO2 around 0) is filling the dead space. Gas arterial values follow closely the corresponding alveolar values. capillaries cannot be as well arterialized as with the flow-through system of the avian model. In addition, having a common pathway for inspiration and expiration means that part of the inhaled air will not participate to gas exchange*, [*The larger the volume of the conductive airways (also called anatomical dead space, VD) the smaller the fraction of tidal volume (VT) reaching the gas exchange area, also called alveolar volume (VA). In many adult mammals during resting breathing VD approximates one-third VT, hence, alveolar ventilation VA is about two thirds of VE] reducing the gas exchange efficiency of VE in comparison with the air and blood flow arrangements of fish and birds. On the other hand, that part of the body space which in reptiles and birds is occupied by the sacs in mammals can be used by the lung itself; this results in a gas exchange area which is very large relative to body mass and fully protected inside the body. As in reptiles and birds, the mammalian ventilatory pump operates by a negative pressure suction mechanism. The major difference is the separation of the visceral cavity into a thoracic and an abdominal compartment by a muscular layer, the diaphragm. Contraction of this muscle lowers pleural pressure, which results in lung expansion (caused by the rise in transpulmonary pressure), together with a tendency for the rib cage to collapse (caused by the negative pressure difference between inside and outside of the rib cage) [Fig.12]. To what extent, during diaphragmatic contraction, the inward
14
.Fig.12. Factors determining the motion of the rib cage and abdomen during inspiration. The mechanical arrangement of the mammalian respiratory system is such that, when the diaphragm contracts, the abdominal component of the trans-diaphragmatic pressure (Pdi) expands the abdomen (ab), while the pleural component (Ppl) tends to suck the rib cage inward. movement of the rib cage (i.e. distortion of the chest wall) actually occurs depends on a number of factors which include the relative compliance of lung and chest wall and the action of the extra-diaphragmatic muscles. Therefore, the respiratory pump in mammals is prone to a great deal of deformation, and the intercostal muscles have the important function of stabilizing the rib cage against the distorting action of the diaphragm. A dramatic example of this is offered by those patients with a complete lesion of the upper spinal cord. These patients can breathe because the motor roots of the phrenic nerve, innervating the diaphragm, emerge from the cervical portion of the spine above the lesion. However, thoracic and abdominal muscles, in addition to limb muscles, are paralysed (tetraplegic patients). In these cases, the rib cage distorts during inspiration because the intercostal muscles are not offsetting the action of the pleural pressure on the chest [Fig.13].
15
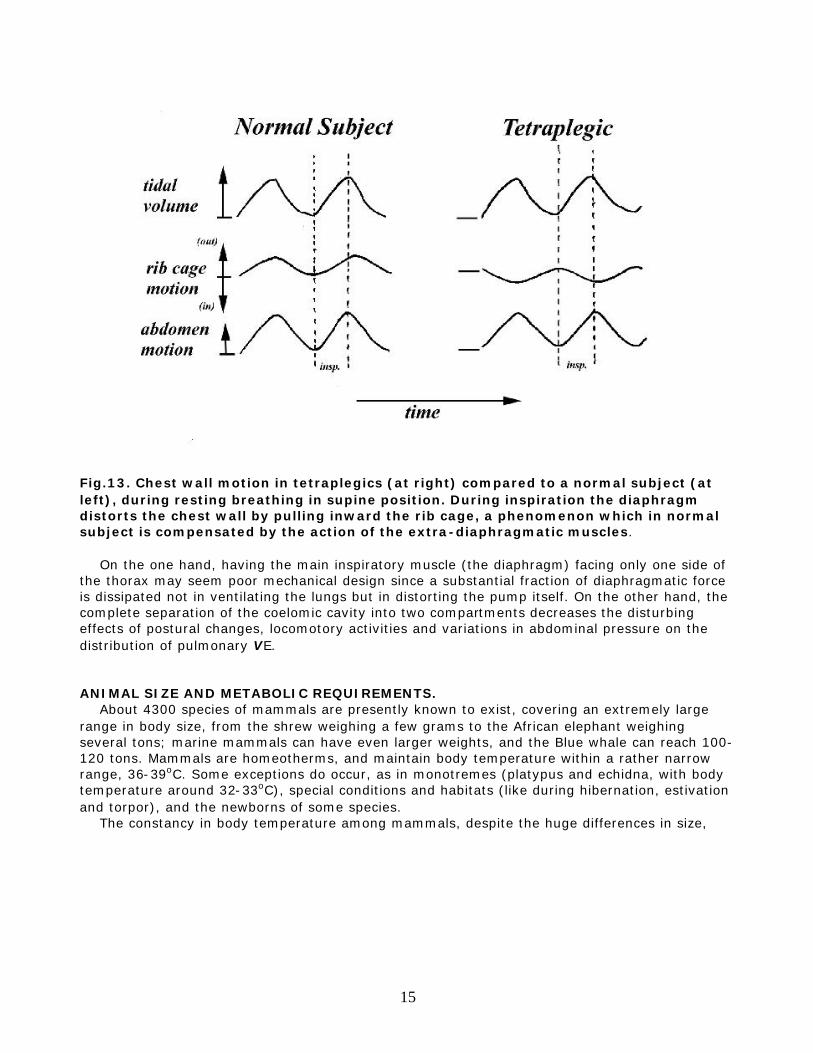
Fig.13. Chest wall motion in tetraplegics (at right) compared to a normal subject (at left), during resting breathing in supine position. During inspiration the diaphragm distorts the chest wall by pulling inward the rib cage, a phenomenon which in normal subject is compensated by the action of the extra-diaphragmatic muscles. On the one hand, having the main inspiratory muscle (the diaphragm) facing only one side of the thorax may seem poor mechanical design since a substantial fraction of diaphragmatic force is dissipated not in ventilating the lungs but in distorting the pump itself. On the other hand, the complete separation of the coelomic cavity into two compartments decreases the disturbing effects of postural changes, locomotory activities and variations in abdominal pressure on the distribution of pulmonary VE. ANIMAL SIZE AND METABOLIC REQUIREMENTS. About 4300 species of mammals are presently known to exist, covering an extremely large range in body size, from the shrew weighing a few grams to the African elephant weighing several tons; marine mammals can have even larger weights, and the Blue whale can reach 100-120 tons. Mammals are homeotherms, and maintain body temperature within a rather narrow range, 36-39oC. Some exceptions do occur, as in monotremes (platypus and echidna, with body temperature around 32-33oC), special conditions and habitats (like during hibernation, estivation and torpor), and the newborns of some species. The constancy in body temperature among mammals, despite the huge differences in size,
16
Allometric relationships of respiratory variables Allometric analysis is a special case of normalization by body weight (BW), in the process of comparing subjects of different body size within the same species, e.g. during growth, or same-age animals of different species. A given structural or functional parameter Y is examined according to the function Y = a . BWb. The log-transformed version of this function, log Y = log a + b.log BW, is particularly useful. When the slope b, which is the exponent of the original exponential function, equals unity, the variable Y increases in direct proportion to animal body weight, the proportionality factor being a. Slopes higher or smaller than unity indicate that the variable under consideration increases, respectively, disproportionately more or less with the increase in body weight. The following is a list of allometric exponents for some parameters pertinent to respiratory physiology of adult mammals: Y b oxygen consumption 0.75 lung weight (or mass) 1.0 pulmonary gas exchange surface area 0.75 pulmonary ventilation 0.75 tidal volume 1.0 breathing rate -0.25 respiratory system compliance 1.0 respiratory system resistance -0.75
suggests that either thermodispersion, or thermoproduction, or both, must vary among species. Thermodispersion is mostly determined by body surface. Heat production is determined by the metabolic activities of the cells and hence is proportional to body mass. If, for simplicity, we think of an animal as a sphere, because sphere surface is proportional to the square of length and sphere volume is proportional to the third power of length, it follows that the larger the animal body the smaller its surface-to-volume ratio. Hence, large animals should be much warmer than smaller animals; the fact that this is not so is because the metabolic activity of the cells of large animals is not as pronounced as it is in the smaller species. Indeed, it has long been recognized that, although the VO2 of the whole organism increases with the size of the species, after normalization by the animal's weight (VO2/kg) the opposite is true: VO2/kg progressively decreases with the increase in animal's weight [Fig.14, bottom]. In other words, if we had 1 g samples of "average" flesh from a 100 g rat, 20 kg dog, 70 kg man and a 5
17
Fig.14. The function relating a species resting oxygen consumption (VO2) to its body mass ( "mouse-to-elephant" curve) indicates a progressive reduction in VO2/kg (at
18
bottom) as species get bigger. This means that when VO2 is plotted against body mass (at top) in double log-scale the slope of the function is less than unity. In fact, the allometric exponent of VO2 is about 0.75, which is less than 1, yet above the value (0.66) expected by geometric similarity. The latter exponent (0.66) is what observed for different size animals within the same species. -ton elephant we would find that VO2 progressively decreases from the rat's sample, to the dog's, man's and elephant's. A similar finding would occur if we were comparing samples from different size animals within the same species. In fact, it turns out that VO2 within a species is proportional to the 2/3 power of body weight (BW0.66), which is the exponent to be expected according to the surface-volume argument presented above. VO2 among species, on the other hand, scales to BW0.75, which is clearly below unity, yet significantly above the expected 0.66 [Fig.14, top]. The reason for this discrepancy is not fully understood, and may relate to the existence of a systematic variation from the simplistic sphere analogy (possibly related to the influence of gravity in shaping the animal's body) and in differences among mechanisms of heat dissipation. RESPIRATORY ADAPTATION TO CHANGES IN BODY SIZE AND METABOLIC RATE. The values of the partial pressures of oxygen and carbon dioxide (PO2 and PCO2) of the alveolar gas and arterial blood essentially reflect the ratio between what is used (O2) or produced (CO2) and what is ventilated, respectively, in or out the lungs. Both PO2 and PCO2 are very similar among species, which may not be surprising since mammalian functions have an optimal operational acid-base range, just as they have an optimal temperature range. Given that VO2/kg is not constant among mammals of different size, the similarity in PO2 and PCO2 implies that also the ventilatory apparatus must vary among species, either in structure, function, or both, to accommodate differences in ventilation. Indeed, size-related modifications in the mammalian design of the respiratory system occur both at the structural and functional level to accommodate the different metabolic needs, and will be examined systematically in the following sections A-F. 1. Structure of the lungs and respiratory pump. Comparison of adult mammalian species over a 104 range in size have indicated that the mass of the lung is a fixed proportion of the total animal's weight, approximately 1%. Also the amount of air present in the lung, at a predetermined transpulmonary pressure, is directly proportional to body and lung mass. This should imply that lung compliance (change in volume per unitary change in transpulmonary pressure), whether compared per unit of lung tissue or per BW, is an interspecies constant. Direct measurements of lung compliance show that this is the case; in addition, the shape of the pressure-volume deflation curve, and derived mathematical parameters describing the transpulmonary pressures during lung deflation, vary little among species [Fig.15].
19
Fig.15. Pressure-volume (P-V) curve of the lungs during deflation from maximal volume (plateau) in several mammals. The shape of the P-V curve is remarkably similar, even if lung volumes differ from a few ml in mice and rats to 800 liters in the whale. The P-V deflation constant K (cm H2O
-1, obtained by exponential fitting of the curve), which is an index of the volume-specific stiffness of the lungs, is essentially independent of body mass. The only exception may be the cat, with unusually high specific compliance. (Modified from Schroter, Respir.Physiol.42:101-107,1980). The gross aspects of the internal architecture of the lungs are similar among mammals. The volume of the conducting airways, which contribute to the anatomical dead space, is a constant fraction of total lung volume*, [*This is essentially true even in the giraffe, in which the trachea is very narrow with respect to its length]
20
implying that the volume of the gas exchange region, at the lung periphery, is a fixed proportion of body and lung size. However, the subdivision of this peripheral volume varies because the radius of the alveoli is smaller in smaller species. It follows that, per unit of lung volume, small species have a larger number of alveoli and also a greater gas exchange surface area. Indeed, among species, lung surface area is not directly proportional to BW or lung volume; rather, it is proportional to the VO2 of the species [Fig.16].
Fig.16. Pulmonary surface area, calculated from morphometric measurements, vs resting oxygen consumption, for several mammalian species. Both axes are in log-scale. Therefore, an important adaptation of the respiratory function to the changes in animal's size is achieved structurally, by varying the internal compartmentalization of the lung. The larger alveoli of the bigger species require slightly longer diffusion times for the gas transfer to and from the pulmonary capillaries; this is manageable since the breathing rates of the large species tend to be low (see below). On the other hand, even in the smallest alveoli of the small species surfactants on the alveolar wall are sufficiently abundant to maintain a low surface tension, therefore avoiding the necessity for large inflatory pressures*.
21
[*According to Young-La Place's relationship, the recoil pressure P generated by an air-liquid spherical interface (as it occurs in the alveoli where the wet surface is in contact with air) is proportional to the ratio between the surface tension T and the radius of curvature r of the interface. Hence, for a given T, the smaller the r the larger is the inflatory pressure required to overcome P] 2. Passive mechanical properties. The fact that larger mammals have bigger lungs than smaller mammals yields the obvious expectations that compliance should increase with size, while resistance (the pressure difference per unitary change in flow) should decrease. The former is in fact mostly determined by the size of the organ, the latter is largely determined by the length and diameter of the airways (i.e. the longer and narrower the conducting airways, the more resistance they offer)*. [*In laminar flow conditions the driving pressure is directly proportional to flow (Poiseuille's Law), the proportionality constant being the resistance R = (8η l) / (π r4) ,where η is viscosity, and l, r represent, respectively, length and radius of the airways] Indeed, both lung compliance and respiratory system compliance are linearly proportional to the animal's body mass*, [*This neglects a trend for the largest and bulkiest mammalian species to have slightly stiffer chests] and the resistance of the respiratory system decreases in bigger animals according to the proportionality BW-0.75 [Fig.17].
22
23
Fig.17. Allometric relationships of respiratory system compliance (Crs) and resistance (Rrs) in adult mammals. With the increase in species mass, Crs increases in proportion, whereas Rrs decreases less than in proportion. Hence, Rrs·kg and the passive time constant of the respiratory system (? rs=Crs·Rrs) are lower in small than in large species. The fact that the exponents relating compliance and resistance to BW do not have the same absolute value indicates that the resistance does not decrease with animal weight exactly in proportion with the increase in compliance. Hence, the product of these two variables, which is the time constant of the respiratory system, is not independent of BW, but it varies among species, gradually increasing in larger animals*. [*Compliance of the respiratory system (Crs) is proportional to BW1, and resistance of the respiratory system, Rrs, to BW-0.75; hence, the time constant of the respiratory system (τ rs) = Crs·Rrs = BW(1-0.75) = BW0.25] This has important functional implications because the time constant of the respiratory system reflects the time of the ventilatory response to a pressure applied: the shorter the time constant, the faster the volume change in response to the pressure generated by the respiratory muscles. Stated differently, for the same muscle pressure generated by a rat or by an elephant, the lungs will inflate more quickly in the rat, because, relatively to BW, the respiratory resistance is not as great, and the time constant not as long, as in the elephant. 3. Ventilation and dynamics of breathing. The amount of air inhaled per unit time is commonly called ventilation (VE)*. [*Inspired pulmonary ventilation is usually slightly larger than expired ventilation (VE) because the ratio between CO2 produced and O2 used is less than 1, but the difference is very small. Because there is no evidence for a systematic change in VCO2/VO2 (respiratory quotient) with animal's size, whether we consider the expired or the inspired ventilation does not modify the reasoning] This is the product of the amount of air inhaled with each breath (tidal volume) and the number of breaths per minute (breathing frequency). Since, in mammals, pulmonary VE represents the only means for the gas exchange of the venous blood, it is not surprising to find a close relationship between VE and VO2 [Fig.18]. If this was not so, then animals with high VE/VO2 would have lower alveolar (and arterial) PCO2 and higher PO2 than animals with low VE/VO2, which, as mentioned earlier, would be contrary to the actual observation that alveolar and arterial blood gases are similar among species.
24
Fig.18. Oxygen consumption (VO2) - ventilation (VE) relationships during resting conditions. In both adults (continuous line) and newborn mammals (dashed line), the mass-related changes in VO2 are accompanied by proportional changes in VE. Because VE α VO2
1 and VO2 α BW0.75, also VE α BW0.75, i.e., relative to animal's size, small animals have higher VE than larger animals do. For example, a rat, relative to its weight, ventilates 10-15 times more than an elephant. It is interesting that this difference is not due to differences in tidal volume/kg, which is approximately 8-10 ml/kg in all mammals, but to breathing frequency, which can be much above 100 breaths/min in the rat, and less than 10/min in the elephant. Why differences in metabolic requirements, and in VE, are met entirely by differences in frequency rather than tidal volume is not immediately obvious, except for the consideration that lung mass is directly proportional to the animal's weight, and it is probably a good design to have the stroke of a pump proportional to its size. On the other hand, it is apparent that the very high values of breathing frequency in the smallest species, possibly above 600 breaths/min in the shrew, require rapid recruitment of the inspiratory motoneurons, and immediate muscle responses to quickly lower the pleural pressure and generate very high inspiratory flows/kg. It is interesting that these dynamic requirements are accommodated by some structural and functional properties of the respiratory pump. First, as mentioned earlier, resistance·kg is lower in small animals, and the time constant, whether measured in passive conditions or during contraction of the inspiratory muscles, is proportional to BW0.25. This is numerically the same exponent, opposite in sign, of that relating breathing rate to BW (frequency α BW-0.25), implying that the product of these two parameters, frequency and time constant, is an interspecies constant (BW-0.25 · BW0.25=BW0). Second, although the mass of the respiratory muscles is directly proportional to the animal's mass, the diaphragm of smaller animals has a greater proportion of
25
fast twitch fibers, higher activity of enzymes involved in muscle contraction, and faster rate of pressure development than in larger species. 4. Distribution of ventilation. The distribution of tidal volume in the lung is not uniform, since it is subjected to the direction of the gravitational vector with respect to the thorax. In a standing subject breathing quietly from functional residual capacity most of the inspired air, per unit of lung tissue, is directed into the middle-lower lobes, and relatively less air reaches the top portions of the lungs. In supine position, the areas less ventilated would become those located more ventrally, while those relatively more ventilated are the gravity dependent regions of the back. The factors responsible for these major differences in inspired air distribution are essentially two, the curvilinearity of the lung pressure-volume relationship, and the gravity-related variation in pleural pressure. In fact, in a standing subject, pleural pressure is more negative (i.e. more subatmospheric) around the upper lobes of the lung than in the dependent regions of the lower lobes, implying that the lung top is more distended than the bottom. Because, due to the shape of the pressure-volume curve, lung compliance decreases with increased distention, the overdistended top lung regions are less ventilated than the less inflated regions of the lower lobes. The magnitude of the unevenness in VE distribution depends therefore on the curvilinearity of the pressure-volume curve and on the pleural pressure inequalities along the pleural space. The shape of the pressure-volume curve is relatively similar among mammals (see Fig.15). On the other hand, thoracic dimensions clearly differ, and if the pleural pressure value at the lung surface was strictly determined by the gravitational field, one should expect the presence of huge top-to-bottom pleural pressure differences in the largest mammals and almost no inequalities among regional pleural pressure values in tiny animals of the size of the shrew or the mouse. This is not the case; large mammals do not have a distribution of the inspired air much worse than small mammals do because the pleural pressure gradient (which is the change in pleural pressure per unitary change in lung height) is smaller the bigger the animal. The precise reasons for why this is so are not clear, since it is not clear how gravity determines the regional differences in pleural pressure, but the end result is interesting: small and large mammals have relatively similar absolute differences in pleural pressure among lung regions despite the enormous differences in size. Hence, one would expect tidal volume to be unevenly distributed within the lung in just about the same way in all species, and the measurements available support this prediction. In the elephant, and possibly in some other large mammals with very heavy lungs, some direct attachments between the two pleuras (thoracic and visceral) have been described. This limits the lung configurational freedom within the chest, but represents an additional mechanism for adequate ventilation of all lung regions. 5. Transport of gases. Although gases dissolve in blood, neither O2 nor CO2 are primarily transported in the dissolved form. O2 is almost entirely carried by the hemoglobin, and CO2 is carried predominantly in the form of bicarbonate ions HCO3
-. Since the solubility of CO2 in the blood by far exceeds that of O2, the transport of O2 from the lungs to the peripheral tissues is more critical than the elimination of CO2 from the tissues. Because red blood cells are very similar among mammals with respect to size and hemoglobin content, the amount of O2 which can be loaded in the blood essentially depends upon two parameters, a) the total mass of circulating blood, and b) the blood concentration of hemoglobin. In addition, because the amount of O2 that binds to, and is released from, hemoglobin depends on the affinity of this molecule for the gas, it is important to consider also c) the O2-hemoglobin affinity curve. The total mass of circulating blood per unit of animal's weight and the hemoglobin concentration are almost constant in all mammals. Blood mass is about 60-70 ml/kg, and the value of hemoglobin concentration oscillates among species around the value of 15 g per 100 ml of blood, which, fully saturated, corresponds to an O2 concentration of about 20 ml per 100 ml of blood* [*When fully saturated, 1 g Hb binds approximately 1.34 ml of oxygen].
26
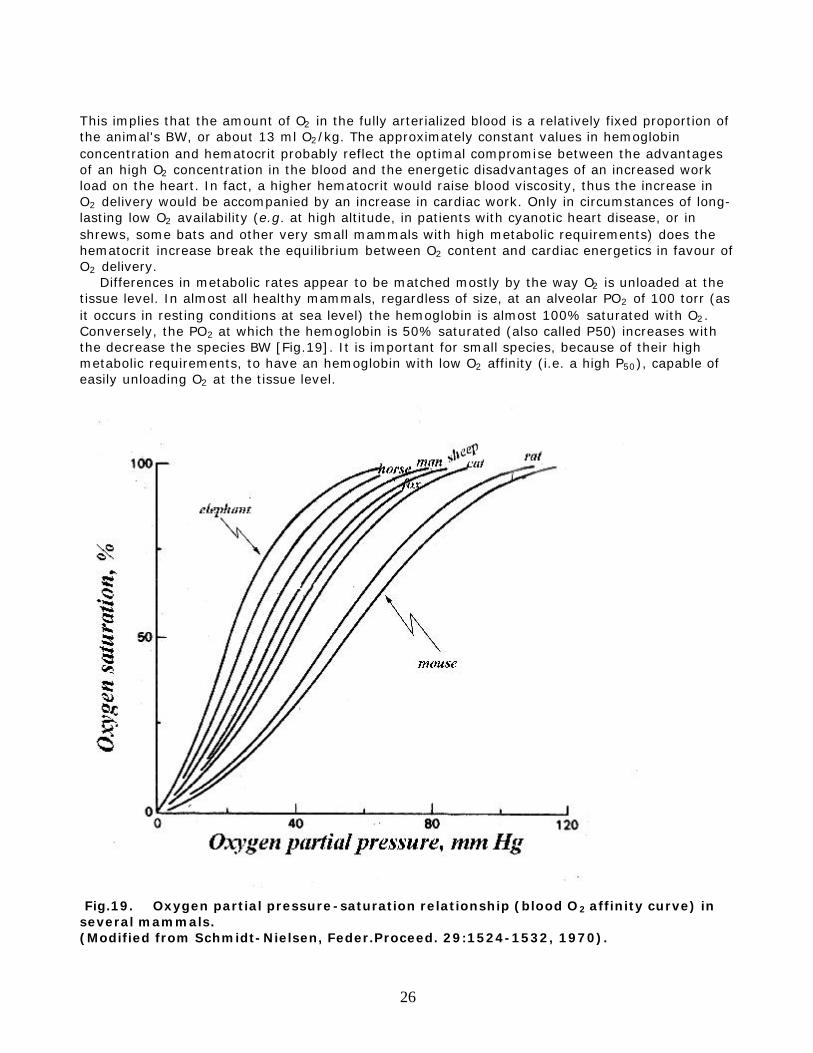
This implies that the amount of O2 in the fully arterialized blood is a relatively fixed proportion of the animal's BW, or about 13 ml O2/kg. The approximately constant values in hemoglobin concentration and hematocrit probably reflect the optimal compromise between the advantages of an high O2 concentration in the blood and the energetic disadvantages of an increased work load on the heart. In fact, a higher hematocrit would raise blood viscosity, thus the increase in O2 delivery would be accompanied by an increase in cardiac work. Only in circumstances of long-lasting low O2 availability (e.g. at high altitude, in patients with cyanotic heart disease, or in shrews, some bats and other very small mammals with high metabolic requirements) does the hematocrit increase break the equilibrium between O2 content and cardiac energetics in favour of O2 delivery. Differences in metabolic rates appear to be matched mostly by the way O2 is unloaded at the tissue level. In almost all healthy mammals, regardless of size, at an alveolar PO2 of 100 torr (as it occurs in resting conditions at sea level) the hemoglobin is almost 100% saturated with O2. Conversely, the PO2 at which the hemoglobin is 50% saturated (also called P50) increases with the decrease the species BW [Fig.19]. It is important for small species, because of their high metabolic requirements, to have an hemoglobin with low O2 affinity (i.e. a high P50), capable of easily unloading O2 at the tissue level.
Fig.19. Oxygen partial pressure-saturation relationship (blood O2 affinity curve) in several mammals. (Modified from Schmidt-Nielsen, Feder.Proceed. 29:1524-1532, 1970).
27
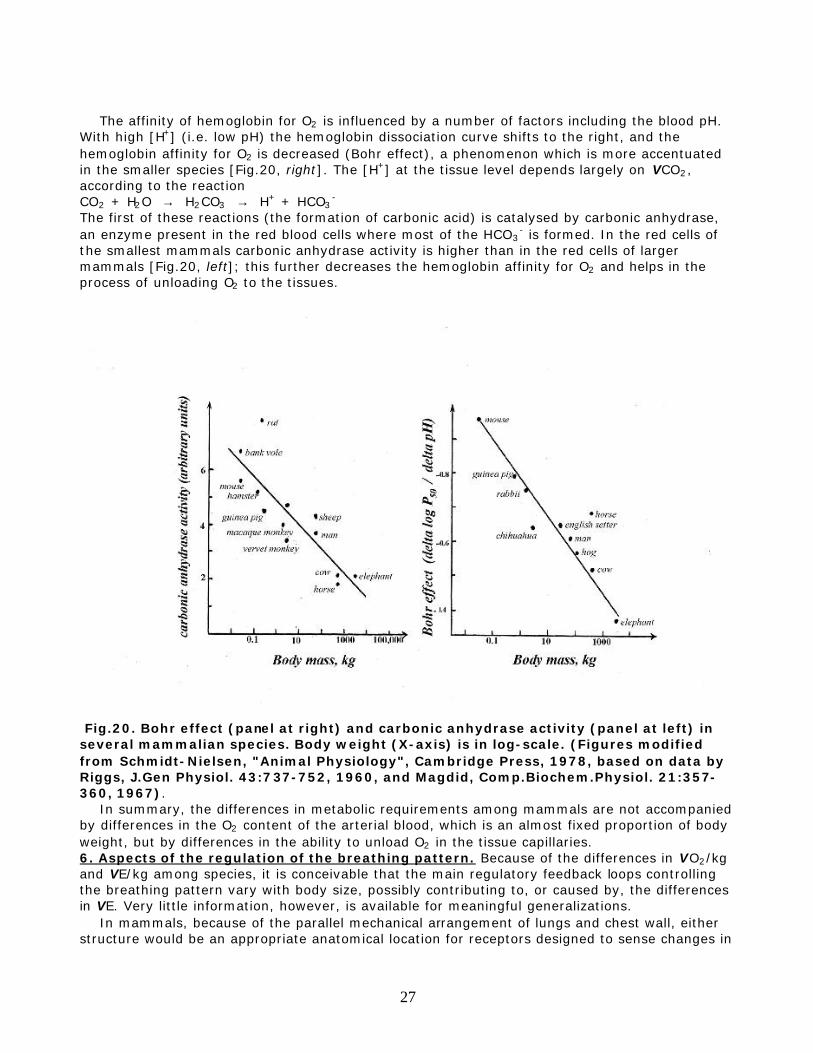
The affinity of hemoglobin for O2 is influenced by a number of factors including the blood pH. With high [H+] (i.e. low pH) the hemoglobin dissociation curve shifts to the right, and the hemoglobin affinity for O2 is decreased (Bohr effect), a phenomenon which is more accentuated in the smaller species [Fig.20, right]. The [H+] at the tissue level depends largely on VCO2, according to the reaction CO2 + H2O → H2CO3 → H+ + HCO3
- The first of these reactions (the formation of carbonic acid) is catalysed by carbonic anhydrase, an enzyme present in the red blood cells where most of the HCO3
- is formed. In the red cells of the smallest mammals carbonic anhydrase activity is higher than in the red cells of larger mammals [Fig.20, left]; this further decreases the hemoglobin affinity for O2 and helps in the process of unloading O2 to the tissues.
Fig.20. Bohr effect (panel at right) and carbonic anhydrase activity (panel at left) in several mammalian species. Body weight (X-axis) is in log-scale. (Figures modified from Schmidt-Nielsen, "Animal Physiology", Cambridge Press, 1978, based on data by Riggs, J.Gen Physiol. 43:737-752, 1960, and Magdid, Comp.Biochem.Physiol. 21:357-360, 1967). In summary, the differences in metabolic requirements among mammals are not accompanied by differences in the O2 content of the arterial blood, which is an almost fixed proportion of body weight, but by differences in the ability to unload O2 in the tissue capillaries. 6. Aspects of the regulation of the breathing pattern. Because of the differences in VO2/kg and VE/kg among species, it is conceivable that the main regulatory feedback loops controlling the breathing pattern vary with body size, possibly contributing to, or caused by, the differences in VE. Very little information, however, is available for meaningful generalizations. In mammals, because of the parallel mechanical arrangement of lungs and chest wall, either structure would be an appropriate anatomical location for receptors designed to sense changes in
28
lung volume. Mechanoreceptors are indeed located both on the chest wall and in the airways, and both sets project to the respiratory centers and influence the breathing pattern. The former group, however, is mostly concerned with the reflex control of the respiratory muscles and the integration of their respiratory activity with non-respiratory functions, including postural control during locomotion. The mechanoreceptors in the airways, and specifically the slowly adapting subgroup, send information via the vagus nerve, which is part of a system designed to regulate the depth and frequency of breathing. As far as it is known, all mammals have both sets of receptors with similar general properties. Whether or not their reflex contribution is also similar is difficult to conclude on the basis of the scattered data. The Hering-Breüer inflation reflex is often interpreted as an index of the reflex effect of the stimulation of the vagal slowly adapting pulmonary receptors. This reflex is particularly pronounced in small species, such as the mouse, rat, guinea pig and rabbit, whereas it is weaker in cats, dogs and humans [Fig.21]. Because, as previously mentioned, both tidal volume/kg and the pleural pressure swing are similar among species, a more powerful Hering-Breüer reflex would cut off inspiratory activity at an earlier time, possibly contributing to the higher breathing rates of the smallest species.
29
Fig.21. The higher the lung volume (and transpulmonary pressure), the greater the inspiratory inhibition (Hering Breüer inflation reflex), here quantified in arbitrary units (log-scale). Humans appear to have a week reflex, whereas the reflex is very strong in rabbits. The VE responses to changes in inspired concentrations of O2 or CO2 have been studied in many species. Once exposed to hypoxia, VE increases, relative to metabolic rate, in almost all animals tested, and the degree of this hyperventilation, for the same level of hypoxia, is fairly uniform across species. However, in some the hyperventilation is entirely, or almost entirely, due to an increase in the absolute value of VE (hyperpnea); in others, it is predominantly due to a decrease in metabolic rate [Fig.22]. The latter is particularly pronounced in newborn animals, or in adults which have high metabolic rates because of high thermogenic requirements. Therefore, among adult mammals, the hypometabolic contribution to hypoxic hyperventilation occurs
30
mostly in the smallest species, which have high VO2/kg and thermogenic needs (see above), or when metabolic rate is increased because of exposure to cold. The VE response to CO2 (hypercapnic ventilatory response) is simpler to compare among species, because, at least for modest hypercapnic levels, the metabolic changes are minimal. From the studies available, it would seem that the hypercapnic ventilatory response is slightly less in the smallest species, and this would be true for both adults and newborns. Whether this represents a difference at the level of the chemoreceptors, or a difference in the multiple factors participating to the central integration of their inputs is not known. Nevertheless, the notion that the ventilatory response to CO2 may differ among species further complicates the inter-species comparison of the ventilatory response to hypoxia. In fact, as the hypoxic animal hyperventilates, alveolar and arterial PCO2 decrease. Decreased PCO2 tends to decrease VE and thus counteracts the response to hypoxia by a factor which depends on the level of hyperventilation and the animal's sensitivity to changes in PCO2.
Fig.22. Ventilatory response to hypoxia (inspired O2 =10%) in several adult and newborn mammals. Each data point is the average value of one species, expressed in percent of the normoxic value. Although during hypoxia VE/VO2 increases in almost all cases, not all animals increase VE above normoxia; rather, they decrease VO2.