Korea-World Bank High Level Conference on Post-Crisis Growth and Development June 3, 2010 – June 4, 2010 Busan, Korea Draft for comments only Infrastructure and Sustainable Development Presenters: Marianne Fay and Michael Toman Paper presented at the Korea-World Bank High Level Conference on Post-Crisis Growth and Development, co-organized by the Presidential Committee for the G-20 Summit and the World Bank with the support of the Korea Institute for International Economic Policy (KIEP). The findings, interpretations, and conclusions expressed in this paper are entirely those of the authors. They do not necessarily represent the views of the World Bank Group or those of the Executive Directors of the World Bank or the governments they represent.
Transcript
Korea-World Bank High Level Conference on Post-Crisis Growth and Development
June 3, 2010 – June 4, 2010 Busan, Korea
Draft for comments only
Infrastructure and Sustainable Development
Presenters: Marianne Fay and Michael Toman
Paper presented at the Korea-World Bank High Level Conference on Post-Crisis Growth and Development, co-organized by the Presidential Committee for the G-20 Summit and the World Bank with the support of the Korea Institute for International Economic Policy (KIEP).
The findings, interpretations, and conclusions expressed in this paper are entirely those of the authors. They do not necessarily represent the views of the World Bank Group or those of the Executive Directors of the World Bank or the governments they represent.
Not for Circulation or Referencing
i
Infrastructure and Sustainable Development
Marianne Fay, Mike Toman, Daniel Benitez and Stefan Csordas
World Bank, Washington DC
Paper prepared for Korea-World Bank Conference on Post-Crisis Economic Development, Busan, June 4 2010
The authors thank Antonio Estache for his contribution to infrastructure research which is drawn upon extensively in this paper, as well as a number of others who offered advice and comments. Responsibility for the content of the paper is the authors’ alone.
Infrastructure and Growth ................................................................................................................... 3
Leaps and bounds - network effects ................................................................................................ 4
Apples and oranges - heterogeneity in the quality of infrastructure investments ................... 4
Which came first - endogeneity of infrastructure investments ................................................... 5
Infrastructure and Poverty Reduction ................................................................................................ 6
Infrastructure and Environmental Sustainability .............................................................................. 7
Infrastructure Achievements to Date Are Far From Sufficient ........................................................... 9 Factors Explaining Slow Progress in Infrastructure Provision .......................................................... 11
Infrastructure is costly ......................................................................................................................... 12
Infrastructure investments are not always efficient ........................................................................ 13
What does not get measured does not get done .............................................................................. 14
The Private Sector can only do so much ........................................................................................... 14
PPI has grown steadily even in low- income countries .............................................................. 14
PPI brings efficiency improvements but also can be costly ....................................................... 18
Summing Up: How Large Might Future Infrastructure Expenditures Be? How Might the Needed Increases Be Accomplished? ................................................................................................ 19
Infrastructure Investment and Other Actions for Green Growth ..................................................... 21 Policies for Addressing Environmental Externalities ..................................................................... 21
Green Technology Innovation Green Investment Cost and Green Growth ................................ 23
Summing Up: What is the Case for Green Investment to Induce Green Growth? .................... 25
The Way Forward: Proposals for Further G20 Attention .................................................................. 25 Annex 1. A Heroic Attempt at “Guess-timating” Future Infrastructure Financing Needs and
financing gap ...................................................................................................................................... 28 References ................................................................................................................................................. 30
Not for Circulation or Referencing
1
Executive Summary
Despite some progress, most developing countries still suffer from insufficient infrastructure access, quality and reliability. While more infrastructure need not mean more growth, since other constraints also may be binding, poor infrastructure performance is affecting competitiveness, slowing achievements in health and education and disproportionately harming the poor. There are several causes of the generally disappointing infrastructure investments. Infrastructure is expensive – in Africa some 15% of GDP would be needed to achieve even relatively modest improvements. Infrastructure spending is often inefficient – suffering from many of the shortcomings associated with public management. The private sector has contributed a lot through PPPs, helping increase both efficiency and access, but it cannot be an alternative to public involvement and financing. In addition, data are limited to monitor what is being spent, how effectively, or what condition infrastructure is in – the sector is characterized by a remarkable paucity of data. This in turn reduces the impetus to improve upon the status quo. Environmental concerns only complicate this picture. Addressing them can increase the cost and complexity of infrastructure investment, even though the additional societal benefits can well offset these costs. Improved energy efficiency in infrastructure design also can return higher longer-term benefits from lower costs. Striking the appropriate balance between environmental benefits and costs in planning infrastructure investments depends on a number of complementary policy issues. These include establishment of sound environmental performance standards, and removal of environmentally damaging subsidies that affect infrastructure demands (especially in energy and water). The challenge is greater still when weighing infrastructure options in the context of concerns for mitigating longer-tem threats of climate change. Many of the needed reforms and efforts need to be done domestically. Attracting PPPs also requires a good investment climate framework. To encourage such efforts, there are a number of measures that could be promoted through the G-20. These include:
• Promoting collaborative efforts to collect and share data on infrastructure investments and its impacts. An excellent opportunity is presented by the fact that a detailed methodology has been developed and field-tested in the context of the Africa Infrastructure Country Diagnostics that was launched after the G8 Gleneagles summit of 2005. In addition, the IMF’s Government Financial Statistics are being revised and could be modified to include information relevant to infrastructure concerns.
• Developing an action plan for increasing public and private financing of infrastructure,
as well as improving its efficiency.
• Developing an action plan for providing increased technical and financial assistance to developing countries in their efforts to improve infrastructure efficiency, enhance investment climate and integrate environmental with economic concerns. A platform for enhanced collaboration among developing countries could be part of this effort.
Not for Circulation or Referencing
2
Introduction Infrastructure is essential for increasing economic progress and reducing poverty. The choices made in the type and scale of infrastructure investment also have major implications for environmental sustainability. To date, however, limited progress has been made in expanding infrastructure access in the vast majority of developing countries, with the notable exception of the East-Asian NICs and other countries in the region such as China and Viet-Nam. Moreover, infrastructure expansion often has come at the expense of the local environment, as well as complicating responses to the longer-term challenge of climate change. These observations underscore the difficulty in planning, building, and maintaining infrastructure for both socio-economic progress and environmental sustainability.
Several factors explain why there has been such limited progress in addressing the economic and environmental challenges of infrastructure service provision. Economically, infrastructure is expensive, requires substantial upfront capital for benefits that are spread over time, and is plagued with difficulties with cost-recovery. For many countries, especially the poorer ones, the amount of investments needed is staggering. Moreover, like many others services dominated by the public sector, infrastructure has often been mismanaged. And since the consequences of under-investment are only felt with a lag, infrastructure has often borne the brunt of fiscal adjustments. Compounding this problem is the fact that data on infrastructure availability and infrastructure spending is very limited. What does not get measured often does not get done.
As to environmental sustainability, in many cases it is not that well integrated into countries’ general strategies for development. Incorporation of the environment into public sector infrastructure expenditures may give way to concerns about investment costs and more immediately pressing needs. Price signals and enforceable regulatory standards also may fall short of what is necessary to adequately incorporate environmental concerns in private sector infrastructure investment.
Private participation has an important role to play in infrastructure expansion. Indeed flows of capital associated with private participation in infrastructure (PPI) amount to about 1.2% of developing countries GDP today.1
The threat of future climate change adds to challenge of increasing infrastructure services while addressing more local environmental concerns. Substantial inertia in both the natural climate system and the built environment means that today’s infrastructure investment decisions heavily influence both future climatic conditions and the cost of deeply cutting global greenhouse gas (GHG) emissions. Layered on top of these factors is an international system for establishing long-term GHG mitigation objectives that currently places the locus of responsibility within already developed countries. This leaves open questions regarding how climate change threats can and should affect investment decisions in developing countries, and what already developed
PPI is also generally associated with fairly substantial increases in efficiency. However, historically PPI has been most relevant for telecom and, to a lesser extent, energy, with a limited role in water, sanitation and transport. Even under the most favorable of conditions, moreover, PPI has represented only about one sixth of needed investments in infrastructure. So while PPI is important, and is likely to continue increasing, it is by no means a magic bullet.
1 PPIAF and World Bank (2010). In this paper PPI includes outright privatization (hence divestiture payments), while a related concept, private public partnerships (PPP), does not.
Not for Circulation or Referencing
3
countries can and should do to support lower-carbon investment. Climate change also introduces a need to adapt infrastructure to the new, changing and uncertain climatic conditions, which adds further to the challenges of development planning.
The types and scale of infrastructure investment and its ongoing management constitute a key part of achieving “green growth” – growth that reduces poverty and is environmentally sustainable. Other factors also have decisive influences on green growth, notably the nature of regulatory standards and economic incentives for reducing environmental degradation; availability and affordability of technologies with lower environmental impact; availability of complementary knowledge and skills; and broader issues of institutional capacity and governance. Since these factors in turn affect infrastructure decisions, there is strong interdependence among the various influences on green growth.
This paper begins with an overview of what we know about infrastructure’s importance for growth, poverty reduction, and environmental sustainability. We then turn to the disappointing achievements to date in infrastructure provision across most of the developing world. We discuss reasons for weak performance including scarcity of financial resources and inefficient management. This is followed by a discussion of the role of the private sector. We next review the challenge of addressing environmental sustainability in infrastructure planning and investment. The final section of the paper concludes with concrete proposals for G20 follow-up.
Infrastructure Matters
In this section we examine why infrastructure choices matter for economic growth, poverty reduction, and environmental sustainability. We also discuss the complexity of the relationships between infrastructure and growth, pointing out that more infrastructure does not always mean more growth and more growth does not necessarily require more infrastructure.
Infrastructure and Growth2
Common sense suggests that modern economies cannot function without infrastructure, which provides a variety of critical services in determining any economy’s production and consumption possibilities. Even if infrastructure is necessary for modern economies to function, however, more infrastructure may not necessarily cause more growth. The binding constraints may lie elsewhere than simply in the total quantity of infrastructure investment—in poor managerial incentives or externalities from missing markets, for example. The effect of infrastructure may also vary as changes in the economy influence firms’ ability to take advantage of it. Thus in Chile, infrastructure’s productive impact became much more pronounced after 1973, when the economy was liberalized (Albala-Bertrand and Mamatzakis 2004).
Infrastructure can affect growth through many channels (see Agénor and Moreno-Dodson 2006 for an overview). In addition to the conventional productivity effect, infrastructure is likely to affect the costs of investment adjustment, the durability of private capital, and both demand for and supply of health and education services. Many of these channels have been tested empirically. This is reflected in the wide variety of findings in the abundant empirical literature on infrastructure and growth or productivity. Indeed exhaustive reviews of the literature
2 This section is largely reproduced from Estache and Fay (2010).
Not for Circulation or Referencing
4
(Briceño-Garmendia et al. 2004; Gramlich 1994; Romp and de Haan 2005; Straub and Vellutini 2006) show that, while some authors find negative or zero returns, others find a high impact of infrastructure on growth.
Careful analysis of the literature shows broad agreement with the idea that infrastructure generally matters for growth and productivity, although some studies suggest its impact seems higher at lower levels of income (Romp and de Haan 2005; Calderon and Servén 2010, Briceño-Garmendia et al. 2004). Nevertheless, there remains tremendous variety in the findings, particularly as to the magnitude of the effect, with studies reporting widely varying returns and elasticities. In other words, the literature supports the notion that infrastructure matters, but it cannot serve to unequivocally argue in favor of more or less infrastructure investments in specific instances.
The variety of findings is, in fact, not surprising. There is no reason to expect the effect of infrastructure to be constant (or systematically positive), either over time or across regions or countries. Furthermore, estimating the impact of infrastructure on growth is a complicated endeavor, and papers vary in how carefully they navigate the empirical and econometric pitfalls posed by network effects, heterogeneity, and endogeneity.
Leaps and bounds - network effects Infrastructure services are mostly provided through networks, a fact that implies a nonlinear relation with output. Telecommunications and electricity transmission exhibit strong network effects, whereby returns to users increase with the number of users. Roads, rail, and water/sanitation are also networked services, so the impact of new investments on growth, output, or firm costs will depend on the overall state and extent of the network (see Romp and de Haan 2005 for a discussion).3
A few authors have explicitly modeled the nonlinearity of infrastructure’s impact on output, growth, or production costs. Röller and Waverman (2001) find that the impact of telecommunications infrastructure on output is substantially higher in countries where penetration approaches universal coverage. In the case of roads in the United States, Fernald (1999) finds that returns to investments were very high up to the point when the basic interstate network was completed. He argues that the completion of that network provided a one-time boost in U.S. productivity. This is consistent with Hurlin (2006), who concludes that returns to infrastructure exhibit threshold effects and that the highest marginal productivity of investments is found when a network is sufficiently developed, but not completely achieved.
With increasing returns, the marginal productivity of investments will rise with the scale and “spread” of the network and thus will exceed the average productivity of investment until the market is saturated.
Apples and oranges - heterogeneity in the quality of infrastructure investments Heterogeneity is a problem with measuring infrastructure stocks and services (a km of one lane road counts as much as a km of five-lane highway). Of even greater concern in interpreting findings in the infrastructure-growth literature is heterogeneity in the quality or purpose of infrastructure investment. Infrastructure investment generally is not faced with a real market test, and we should therefore expect differences in rates of return across different projects.
3 The public health value of safe water and sanitation systems also is likely to increase the more individuals are served, in a kind of herd-immunity effect.
Not for Circulation or Referencing
5
Politically or socially motivated projects are likely to exhibit lower rates of return, as their objectives are to bring in the votes or satisfy some social objective rather than to maximize growth.4
More generally, public infrastructure spending and thus the return on investment can be affected by public sector spending inefficiency. As a result, although financial estimates of investment may be a good proxy for increases in private physical capital and may serve as the basis for constructing a stock figure through a perpetual inventory method, this is much less appropriate with infrastructure.
Which came first - endogeneity of infrastructure investments Causality runs both ways between income and infrastructure. Indeed, most infrastructure services are both consumption and intermediate goods, and many studies have documented that electricity consumption and demand for telephones and cars increase along with disposable income (Chen et al. 2007; Ingram and Liu 1999; Röller and Waverman 2001).5
Calderón and Servén (2010) are amongst the researchers who take pains to deal with endogeneity and reverse causation effects through their choice of econometric techniques and by looking at the effect of cross-country differences in the level of infrastructure (not its change) on subsequent growth. They find that both infrastructure quantity and quality are significant influences on growth (figure 1).
6
Average growth increased by 1.6 percent across the sample during 2001-5 compared to 1991-5 due to infrastructure development—1.1 percent due increased quantity of infrastructure stocks, and 0.5 percent due to improved infrastructure quality. In South Asia the total contribution to the growth rate was 2.7 percent per annum—1.6 percent due to increased quantity and 1.1 percent per year due to quality improvement. In Sub-Saharan Africa, in contrast, expansion in infrastructure stocks raised the growth rate by 1.2 percent per annum, but deterioration of infrastructure services reduced the growth rate by 0.5 percent per annum, implying only 0.7 percent per annum net contribution to growth rates.
4 Papers on the political economy guiding infrastructure investment decisions include Alesina et al. (1999); Rauch (1995); Robinson and Torvik (2005), De la Fuente and Vives (1995), and Cadot et al. (2006). 5 The extent of reverse causation may vary across types and measures of infrastructure. For example, road networks that are long lived and slow to change are perhaps less likely to respond to changes in income (particularly in countries that already have a large network and where changes to cope with congestion—such as more lanes, better traffic management, and ring roads—will not substantially affect aggregate measures such as kilometers of roads per capita). This is not the case with telephones or electricity-generating capacity (which responds to energy demand whose income elasticity has been around 0.5 since 1990, according to International Energy Agency 2006). 6 Calderón and Servén’s analyses also show that other factors also contribute to growth, including human capital and macro-economic stability.
Not for Circulation or Referencing
6
Figure 1. Impact of infrastructure quantity and quality on growth
Source: Calderón and Servén (2010), Figure 2. Bars show changes in average per capita growth for 2001-5 versus 1991-5 due to changes in infrastructure quantity and quality.
Infrastructure and Poverty Reduction The implications for the poor of limited access or low quality infrastructure are substantial (Fay et al. 2005). It affects their health, with unsafe water and sanitation responsible for some 1.6 million deaths in 2003, 90% of which were children under 5 mostly in developing countries (Hutton and Haller 2004). Richer people can also be affected, but the impacts are much greater for individuals already suffering from malnutrition or less likely to receive quality medical attention. Similarly, long-term exposure to indoor air-pollution associated with the use of biomass for cooking by those who do not have access to modern sources of energy causes 2 million premature deaths every year.7
Limited infrastructure access also affects the poor’s productivity. Electricity access is associated with improved educational outcome, while access to reliable transportation determines access to job and markets to sell goods.
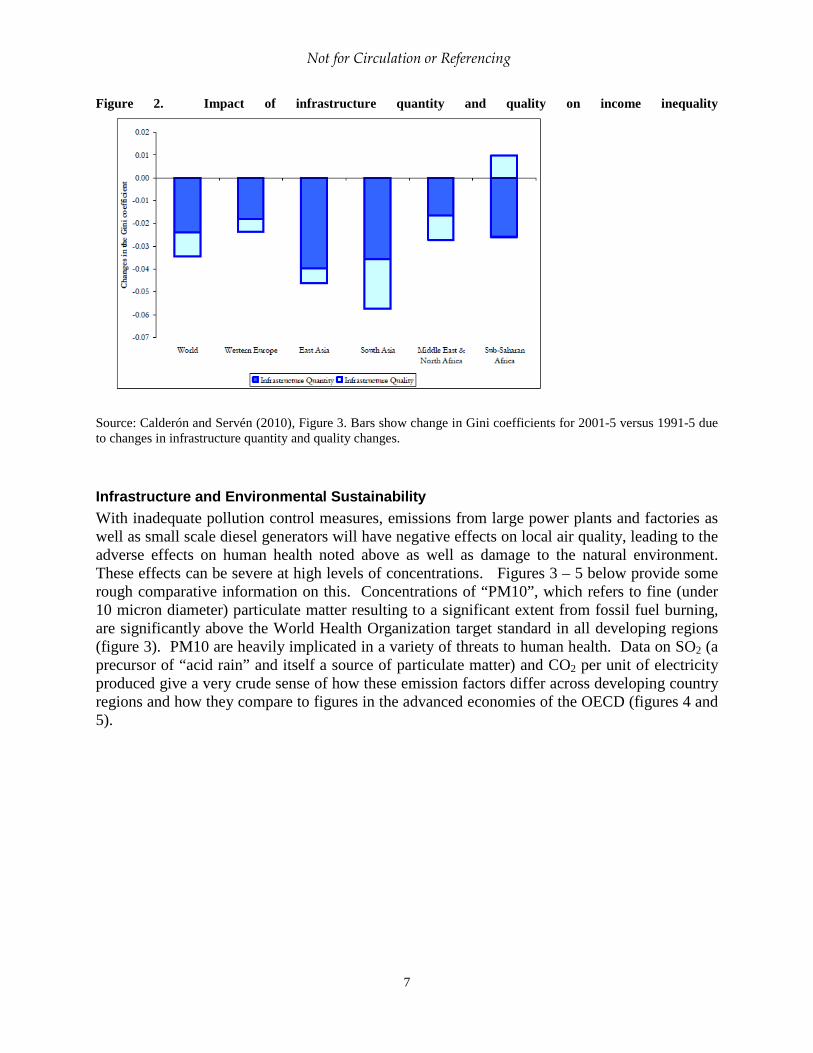
For all these reasons, Calderón and Servén’s finding that increased infrastructure quantity and quality reduces inequality (figure 2) is hardly surprising. Once again, however, we see a sharp contrast between the experiences of South Asia and Sub-Saharan Africa in the contribution of quality changes.
7 Based on 2004 WHO data available at http://www.who.int/indoorair/health_impacts/burden/en/index.html. See Lvovsky 2001 for a review of the environmental health issues associated with infrastructure.
Not for Circulation or Referencing
7
Figure 2. Impact of infrastructure quantity and quality on income inequality
Source: Calderón and Servén (2010), Figure 3. Bars show change in Gini coefficients for 2001-5 versus 1991-5 due to changes in infrastructure quantity and quality changes.
Infrastructure and Environmental Sustainability With inadequate pollution control measures, emissions from large power plants and factories as well as small scale diesel generators will have negative effects on local air quality, leading to the adverse effects on human health noted above as well as damage to the natural environment. These effects can be severe at high levels of concentrations. Figures 3 – 5 below provide some rough comparative information on this. Concentrations of “PM10”, which refers to fine (under 10 micron diameter) particulate matter resulting to a significant extent from fossil fuel burning, are significantly above the World Health Organization target standard in all developing regions (figure 3). PM10 are heavily implicated in a variety of threats to human health. Data on SO2 (a precursor of “acid rain” and itself a source of particulate matter) and CO2 per unit of electricity produced give a very crude sense of how these emission factors differ across developing country regions and how they compare to figures in the advanced economies of the OECD (figures 4 and 5).
Not for Circulation or Referencing
8
Figure 3. PM10 ambient concentration by region in 2006 (μg/m3)
Source: World Development Indicators 2009
Figure 4. Average SO2 emissions relative to electricity production by region in 2000 (tons per GWh)
Source: Stern (2006) for SO2 data; World Development Indicators 2009 for electricity data
Figure 5. Average CO2 emissions relative to electricity production by region in 2006 (tons per MWh)
Source: World Development Indicators 2009
0
20
40
60
80
100
20 μg/m3 (WHO guideline)
0
5
10
15
OECD MNA ECA SAS LAC EAP SSA
0
0.5
1
1.5
2
2.5
OECD LAC SSA ECA SAS EAP MNA
Not for Circulation or Referencing
9
Infrastructure improvements, both large and small-scale, also can provide significant economic development benefits. Access to even limited electricity for lighting can have profound livelihood benefits, particularly for the more than 1.5 billion people worldwide still lacking such energy access. Transportation infrastructure improvements can lower costs of production and improve market access; improved surface water management infrastructure can help mitigate costly shortages. While the direct effects of these improvements are economic, they also can help facilitate more sustainable development (e.g., less depletion of land and water resources).
Management and upkeep of infrastructure affect not only the quality of services but also the environmental consequences of its use. The benefits of expanded electricity transmission grids that can provide greater system-wide energy efficiency and potentially improve access to renewable sources will not be realized if the grid is poorly maintained, or if regulations limit access by cost-effective and lower-emitting generators. Likewise, substantial investments in improved water management and congestion-reducing road capacity will not produce economic or environmental benefits without proper maintenance.
Climate change adds new complexity to infrastructure planning and implementation. Globally, CO2 emissions from coal combustion in 2008 were about 43%, much of this attributable to electricity generation. Emissions from oil constitute another 37% of the total, reflecting both electricity generation and transportation.8
Infrastructure Achievements to Date Are Far From Sufficient
Both types of infrastructure have long economic lives. They also have strong indirect (induced) impacts on other long-lived factors such as settlement patterns and investment in energy-using equipment, as well as consumption habits. The induced effects of infrastructure choices are a substantial part of the total carbon footprint (Lecocq and Shalizi 2009). While such investment at present usually is more cost-effective considering only investment and operating costs, the “lock-in” effects imply a potentially very large cost in moving later to lower-carbon patterns of production and consumption. The prospect of bearing such costs in the future should be part of the calculus in evaluating infrastructure investment options, as discussed below.
Here we summarize evidence on how slow progress has been in expanding infrastructure availability, and the impact this is having on both households and businesses.
Slow progress affects households, particularly the poorer ones and those in poor countries. More than a quarter of developing country households have no access to electricity (table 1). The situation is particularly dire in Africa where nearly 70% of the population is unconnected. Access to water has improved (and the world is on track to meet Millennium Development Goal of halving the proportion of people without access to improved water), yet 884 million people are still without access to an improved water source. The situation with respect to sanitation is much worse, with 2.6 billion without access to improved sanitation and the developing world unlikely to achieve the MDG sanitation goal.9
8 U.S. Energy Information Administration (http://www.eia.doe.gov/emeu/international/contents.html).
Connectivity also remains low, particularly in the rural population where only 70% have access to an all weather road (33% in Africa).
9 The WHO/UNICEF Joint Monitoring Programme for Water Supply and Sanitation’s Progress on Sanitation and drinking water 2010 projects that that by 2015 the share of people without improved water will have fallen to 9%
Not for Circulation or Referencing
10
Table 1. Household access to infrastructure remains insufficient, particularly in Africa
All developing countries
Africa Non-Africa low income countries
% of households with access: • to electricity (1) 63 29 56 • to improved water source (2) 84 60 79 • to improved sanitation facilities (2) 52 31 48
% of rural population with access to an all weather road (3) 70 33 49
Telecom: mobile and fixed lines per 100 inhab. (4) 64 36 42
Source: (1) Cieslekowski (2008), (2) WHO/UNICEF Joint Monitoring Program for Water Supply and Sanitation 2010, (3) Roberts et al. (2006), (4) World Development Indicators, 2009. Note: Electricity and road access are for 2006 or the latest year available up to that date except for telecoms, water and sanitation which is available for 2008. Figures are weighted by country population. Road access indicator measures the share of rural population that lives within two kilometers of an all-season road. The infrastructure deficit also affects productivity and firms’ ability to compete. Enterprise surveys reveal that delays of 30 days are the norm for connections to electricity, telephone, and water in developing countries. And unreliability affects the bottom line, with some 4% of inventory value lost to power outages (figure 6). Indeed, electricity generating capacity per capita remains very low in developing countries (figure 7), a serious constraint to growth in many fast-growing low- and middle-income countries.
on current trends, or less than the target of 12%. In contrast, it expects that the share of individuals without access to improved sanitation will be around 36% much above the 23% target.
Not for Circulation or Referencing
11
Figure 6. Connection delays are substantial in developing countries
Figure 7. Electricity generating capacity per person remains very low in developing countries, 2005
Source: International Energy Agency (2005) and World Development Indicators 2009. Data are for 2005 and show electricity generation capacity (KW) per capita.
Factors Explaining Slow Progress in Infrastructure Provision
Slow progress reflects a combination of insufficient and inefficient spending – both in capital expenditures and in operations and maintenance. Significant increases in infrastructure require very large, often lumpy, upfront investments. Many governments, faced with competing priorities or difficult fiscal situations, simply do not or cannot chose to allocate the resources needed to reach desirable levels of access or quality. In addition, infrastructure services are public goods and/or natural monopolies. As such they are either run or regulated by public entities and thus suffer from some common inefficiencies of public services. But a lack of data on spending, stocks and services makes it difficult to evaluate the extent of the problem or its source. Private participation in infrastructure has brought additional financing, and in many cases
05
101520253035
Electricity connection delay
(days
Mainline telephone
connection delay (days)
Water connection delay (days)
Value lost to power outages
(%sales)
OECD Developing countries
-
500
1,000
1,500
2,000
2,500
High-income Middle-income Low-income
KW p
er c
apit
a
Not for Circulation or Referencing
12
has contributed to improvements in productivity. However, PPI is determined by cost recovery potential and the quality of the regulatory framework.
Infrastructure is costly One approach for assessing infrastructure investment needs, laid out by Fay and Yepes (2003), estimates how much investment may be needed to satisfy firm and consumer demand as a consequence of predicted GDP growth (see also Briceño-Garmendia et al. 2004). It does not measure the level of infrastructure needed to achieve a particular level of growth or well-being. The relationship between income level and demand for infrastructure services is established on the basis of past observed behavior in a sample of countries and extrapolated to the future using predicted income growth.10
Estimates generated from an update of the original model suggest that the needs are large, particularly within low-income countries (table 2).
Although it has serious limitations, the approach forms the basis for many of the current estimates of multi-country investment needs. Important caveats are that it relies on standardized unit costs; ignores many country and regional specificities; and assumes that what happened in some countries in the past is a good predictor of what might happen in some other countries in the future.
Table 2. Investment and maintenance expenditure needs associated with projected increases in income are highest in low-income countries (percent GDP; average 2008–2015)
Country Income Investment Maintenance Total Low Income 7.0 5.5 12.5 Lower-middle income 4.9 3.3 8.2 Upper-middle income 1.3 1.0 2.3 Total developing 2.7 4.1 6.6
Source: Yepes (2008). Note: Infrastructure includes water, sanitation, transport and telecom.
The inclusion of maintenance needs is essential. Countries tend to underspend on maintenance (Rioja 2003; Kalaitzidakis and Kalyvitis 2004), a fact that substantially reduces the useful life of infrastructure assets and hence their rate of return. Maintenance expenditure standards are well known and result in predictable annual expenditure outlays when averaged over an entire network.11
In the absence of data on public spending on infrastructure (see below for a discussion), it is impossible to contrast these estimates with what is actually spent. The one exception is Africa, where detailed country-specific studies were conducted under the Africa Infrastructure Country Diagnostic (AICD) study (Foster and Briceño-Garmendia 2010). This study is an unprecedented effort to analyze both the state of infrastructure and how to address the
Yet, no country (that the authors know of) makes automatic provision for an increase in current expenditures when a new asset is built or acquired. The implication is that in most countries, maintenance is suboptimal leading to additional costs.
10 The model only identifies potential demand given expected growth, not the level of infrastructure that would maximize growth or some other social goal. 11 Appropriate, but by no means generous, standards are approximately 2 percent of the replacement cost of capital for electricity, roads, and rail; 3 percent for water and sanitation; and about 8 percent for mobile and fixed lines.
Not for Circulation or Referencing
13
challenges of providing and financing the infrastructure services. The AICD findings suggest that expenditure needs are higher than estimated by Yepes (2008) and that they fall short of what is currently spent (table 3). Whether a similar finding would apply to other regions is unclear.
Infrastructure investments are not always efficient Estimating the efficiency with which infrastructure is designed, built and operated requires a great deal more analysis than identifying infrastructure spending, difficult as that can be. Such in-depth work was carried out for the AICD study. The conclusion was that Africa’s large infrastructure finance gap could be reduced by a third through efficiency gains (table 3). Table 3. Infrastructure spending needs and the funding gap are very large in Africa
Percentage GDP
African country grouping Needs Spending Efficiency gap Funding gap
Middle income (10) 6 2 (2)
Resource rich (12) 5 3 (4)
Low income (22) 10 3 (9)
Fragile states (36) 6 5 (25)
All Africa (15) 7 3 (5)
Source: AICD study (Foster and Briceño-Garmendia 2010). Note: Table includes only African countries.
There are a variety of causes to this efficiency gap. Countries may spend more on some types of infrastructure than they need to, particularly where the expenditure is crowding out private investment (e.g. in telecom). Reducing institutional bottlenecks to capital expenditure, improving maintenance and reducing backlogs in infrastructure rehabilitation also would improve services at lower cost.
Other sources of efficiency improvement are more challenging to address in political economy terms. According to the AICD analysis, Africa’s power and water utilities have high distribution losses and under-collection of revenues, as well as overstaffing. Moreover, although African infrastructure charges are high by international standards, so are the infrastructure costs; consequently, underpricing of infrastructure services is substantial. Many other studies confirm that spending efficiency is a chronic problem. A recent report on energy subsidies estimates that they add up to some $X billion across developing countries, the vast majority poorly targeted and doing little to help the poor.12
Similarly, work on Eastern European and Central Asian countries found that technical and commercial inefficiencies cost the region some 6-7% of GDP in 2003 and continue to be significant, despite improvements (Ebinger, 2006). And the key conclusion of a report on infrastructure in Latin America was to “spend better” (Fay and Morrison 2007).
12 [IEA work for the IEA/OECD/OPEC/World Bank report on energy subsidies being prepared for the G20 summit]. Numbers to be released in June 2010 .
Not for Circulation or Referencing
14
A word of caution is needed however. Efficiency gains are neither easy to achieve, nor always free. Substantial efforts and political will are usually needed for the needed reforms. Significant up-front investments may also be needed, even if those eventually pay for themselves.
What does not get measured does not get done The claim that slow progress in public infrastructure reflects a combination of insufficient and inefficient spending, while very plausible in light of the information available, is based on partial evidence as there is no systematic way of monitoring spending on infrastructure. Very few countries collect and report data on infrastructure investments, and the IMF’s Government Financial Statistics does not include such information (see Box 1). The situation is only slightly better for private participation in infrastructure (PPI), as noted below. This poses challenges not just for analysis but even more importantly informing decision makers and other stakeholders. One aphorism sums up the problem: “What does not get measured does not get done.”
Box 1. The IMF’s Government Finance Statistics does not compile information on public infrastructure spending
The Government Finance Statistics (GFS) compiled by the International Monetary Fund (IMF) constitutes the main source of cross-country data on public finance. However, its information on infrastructure presents a number of problems, particularly for Africa. First, the GFS focuses on tracking general government expenditure, whereas a large share of infrastructure spending passes through nonfinancial public corporations (parastatals). Second, even within the category of general government spending, the GFS is limited in practice to central government spending, with little reporting of subnational and special funds—two other important channels of infrastructure spending. Lastly, the GFS does not break down infrastructure spending by subsector or expense category. As such it provides no insight into how much is being spent on infrastructure, whether overall or by sector.
The format in which the GFS is structured is undergoing revisions and may therefore be improved to include [functional] classifications that are relevant for infrastructure. However, there is no plan to expand data collection beyond the central government accounts. This implies that the substantial amount of infrastructure spending that is done by state owned enterprises or decentralized government agencies (e.g. municipalities or provinces) will not be included.13
Source: Briceño-Garmendia et al. 2010
The Private Sector can only do so much No data are available on actual disbursements by private investors in infrastructure. However, an international database developed and maintained by the World Bank compiles data on investment commitments associated with management, concession, greenfield, and divestiture contracts that have reached financial closure (http://ppi.worldbank.org/).
PPI has grown steadily even in low- income countries PPI has increased steadily since the 1990s – at an average pace of 13% per annum (figure 8). The Asian crisis led to a 5 year hiatus, during which PPI slowed down quite substantially. PPI flows eventually recovered, reaching a peak of $160 billion in 2007.
13 The GFS actually does report consolidated public spending for one region -Latin America- for reasons that probably have to do with the subnational crisis of the 1990s.
Not for Circulation or Referencing
15
Figure 8. PPI has grown steadily over the last 20 years and appears relatively unaffected by the financial crisis (investment commitments to PPI projects reaching closure in developing countries, 1990–2008 )
Source: PPIAF and World Bank.
Overall PPI volumes have remained relatively steady in the face of the financial crisis, although this masks a flight to quality that appears to be hurting poorer countries most. Flows barely changed between 2007 and 2008 and new data confirms that total flows remain high, with investment commitments to new projects grew by 15% in 2009 (Izaguirre 2010). However, the number of project has shrunk as investments grew selectively, concentrated in a few large projects in a few countries such as Brazil, India, and Turkey (Izaguirre 2010). If these five countries were excluded investments in developing countries would have fallen by 39% in 2009 relative to 2008. Among sectors, only energy has had investment growth in 2009. And while overall PPI fell by only 2% between 2007 and 2008, they dropped by nearly 10% in low-income and lower-middle income countries and increased by 7% in upper-middle income countries.
More generally, new projects are facing more difficult market conditions (Izaguirre 2010). Deals take longer to close and conditions are more stringent. Financing usually involves lower debt/equity ratios, higher costs and shorter debt tenors. The favorable credit conditions that prevailed before the financial crisis are not expected to return. Tougher financial conditions, including higher borrowing costs, are expected to become the norm due to increased risk aversion and competition with borrowing from high-income governments, and the backlog of deferred or un-financed projects (Izaguirre 2010).
Sectorally, PPI has been concentrated in telecom which has accounted for about half of all investment commitment of the last 20 years (figure 9). Energy is a distant second (30% of total), followed by transport (17%) while water and sanitation never represented a large share.
0
50
100
150
200
250
300
350
400
-
20
40
60
80
100
120
140
160
180
1990 1995 2000 2005
Proj
ects
2008
US$
bill
ions
2008 US$ billions Number of projects
Not for Circulation or Referencing
16
Figure 9. PPI projects have been heavily concentrated in telecom
Source: PPIAF and World Bank. Note: data shows investment commitments to PPI projects reaching closure in developing countries.
PPI has also been concentrated geographically, with the top 6 countries accounting for about half of PPI in the last few years (increasing to 60% in 2008) (figure 10). Historically, it represented a fairly even share of GDP for all regions but the Middle East and North Africa and East Asia. But this changed in recent years, with Europe and Central Asia, South Asia, and Sub-Saharan Africa seeing PPI gain in importance and reaching some 2% of GDP. In contrast, PPI became relatively less important for East Asia and Latin America (figure 11).
0%
20%
40%
60%
80%
100%
1990 1995 2000 2005
Telecoms EnergyTransport Water and sewerage
Not for Circulation or Referencing
17
Figure 10. PPI is heavily concentrated geographically with 60% of PPI going to 6 countries in 2008
Source: PPIAF and World Bank. Note: data shows investment commitments to PPI projects reaching closure in developing countries.
Figure 11. PPI has gained in importance in Eastern Europe and Central Asia, South Asia and Sub-Saharan Africa
PPI has amounted to a striking 4% of low income countries’ GDP in recent years -much higher than in richer developing countries where it averaged 1.2-1.3% of GDP (figure 11b). This is contrary to the widespread belief that low-income countries have not benefitted from PPI. The concentration of PPI flows in upper-middle income countries (55% of PPI flows since 1990) declined in recent years as low-income countries nearly doubled their share from 7 to 12%. More generally the concentration of PPI is roughly in line with global GDP concentration (figure 11a). Three-quarters of low-income country PPI have been in telecom, as opposed to a bit less than half for middle-income countries.
India15%
Brazil11%
Russian Federation
10%
China6%Turkey
5%Mexico
5%
Rest of the developing
world48%
0.0%
0.5%
1.0%
1.5%
2.0%
2.5%
East Asia & Pacific
Europe & Central Asia
Latin America & Caribbean
Middle East & North Africa
South Asia Sub-Saharan Africa
ALL
1990-2008 average 2005-08 average
Not for Circulation or Referencing
18
Figure 12. The bulk of PPI goes to upper-middle income countries, but PPI represents a much larger share of GDP for low-income countries
(a) Group PPI as share of total PPI (b) PPI as share of GDP, by income group
Given the lack of data on public investments, it is unclear what share of overall investments this represents, although various authors have estimated it to be 20–25 percent (Estache and Fay 2010). In Africa, AICD data allow us to estimate that PPI has contributed some 10-15% of needs in recent years, but much of it concentrated in South Africa, and to a lesser extent Kenya.
Behind these overall measures, large-scale operators from OECD countries increasingly are being replaced by developing-country investors who have emerged as a major source of investment finance for infrastructure projects with private participation. Schur et al. (2008) show that during 1998–2006, developing-country investors contributed more than half the private investment in concessions (55 percent), half in greenfield projects (50 percent), and a smaller share in divestitures (29 percent). The large majority came from local companies investing in projects in their own country (“developing local” investors); almost all the rest came from investors from nearby countries.
PPI brings efficiency improvements but also can be costly14
In all sectors, with the exception perhaps of the water sector, there has been a difference in efficiency between public and private operators.
15
Exchange rate risks, commercial or demand risks, regulatory risks, and political instability all act as strong disincentives for the participation of the private sector, and increase the cost of PPI. These risks are typically accounted for in estimates of the minimum rate of return that private
In general, private operators have been more efficient, which implies that users and the taxpayers can potentially benefit from private operation of the services. However, the level of efficiency and the distribution of the gains achieved from these more efficient levels have been driven by the quality of the economic and regulatory environment, and these often fall short.
14 This section is reproduced from Estache and Fay (2010). 15 For a recent overview, see Gassner et al. (2007) and Andres et al. 2008.
0%
10%
20%
30%
40%
50%
60%
LICs LMICs UMICs
Average 1990-2008 Average 2005-08
0.0%
1.0%
2.0%
3.0%
4.0%
5.0%
LIC LMIC UMIC ALL
Average 1990-2008 Average 2005-08
Not for Circulation or Referencing
19
operators want from a deal in a given country. Ultimately these risks reflect problems of governance that go beyond infrastructure. Until and unless these risks are reduced, minimum rates of return on private investment will be raised.
The estimated cost of capital associated with a transaction can be a good approximation of the expected minimum return. Estimates of the cost of capital for various infrastructure subsectors suggest that the returns required to start a project have to be at least 2–3 percentage points higher in lower-income countries than in richer developing countries—more than twice what is generally expected in developed countries in infrastructure activities.16
The average ex post rates of return for the large OECD operators who have led many of the privatizations of the last 15 years often have been below this cost of capital, particularly in Eastern Europe and in Latin America.
Box 2. Some suggestions to reduce the costs of PPPs
Appropriate allocation of various risks between the parties (e.g. public, private or third party such as a guarantee facility) best placed to shoulder them can lead to net reductions in cost. Thus, having a broad range of instruments available to deploy flexibly for allocating risks should lead to efficiencies, that in turn will reduce the costs of PPPs. The first few PPPs in a particular investment program involve experimentation and significant uncertainty for the private sector. As such, they inevitably tend to be costly in terms of using scarce planning and oversight resources in the government, as well as typically seeing a higher return demanded to compensate for risk. However, if these go well subsequent PPPs are likely to be easier to prepare and benefit from the improved familiarity of private investors with the structure and sector. As the program expands with additional projects in the same sector, costs should then drop. India had this experience with its national highways program. Governments also may benefit from focusing on PPPs of a scale that the local private sector can undertake and finance, which may mean smaller scale investments. Source: Contributed by Clive Harris
Summing Up: How Large Might Future Infrastructure Expenditures Be? How Might the Needed Increases Be Accomplished? The basic equation of infrastructure finance is that funding can only come from two sources: users or taxpayers (see Figure 13 below).17 The willingness of users and taxpayers to accept payment obligations determines the extent of financing available. This financing which can be provided by national budgets, international assistance and the private sector. At the same time, efficiency gains can help reduce the overall funding—hence financing—needs.18
16 See Estache and Pinglo (2005) for all developing countries. Sirtaine et al. (2005) provide a detailed analysis of the evolution of the cost of capital in Latin America and compare it to the rate of return that can be estimated from the balance sheet of the main infrastructure operators in the region.
The private sector will get involved only to the extent it can recover its costs (including its desired risk premium) and obtain a reasonable profit from user charges or some public subsidies funded by taxpayers. Public financing is constrained by the willingness of users and domestic taxpayers to contribute, while ODA depends on foreign taxpayers.
17 Many argue that capital depletion (cutting maintenance) is another source of funding, but that is equivalent to funding by future users and taxpayers. 18 Potential efficiency gains can be related to the way that infrastructure services are run (technical or managerial efficiency) or in the way that infrastructure expenditures are allocated. They can also be found PPI contract designs and regulation.
Not for Circulation or Referencing
20
Figure 13. The Balance of Infrastructure Financing and Funding
This picture helps structure thinking about how to move forward on improving infrastructure access and quality. In Annex 1 we describe a set of calculations, based on heroic assumptions, which suggest that infrastructure investment needs in developing countries could be on the order of $1 trillion per annum in 2013, or some 6-7% of developing country GDP (and much higher, possibly around 15% of GDP in the poorer countries). This does not include any additional expenditures related to GHG mitigation and adaptation to climate change that could add some $170-$220 billion per annum to the cost of developing country infrastructure.19
Not all developing countries have the fiscal space to spend the needed amount on infrastructure – this is the case not just for the poorest but also for most Latin American countries, and countries in Eastern Europe and Central Asia whose fiscal positions have been heavily affected by the consequences of the financial crisis.
International assistance to infrastructure has been substantial in recent years, but is likely to decline. Much aid has been directed to support stimulus packages in which infrastructure was often prominent. World Bank group lending for example reached some $22 billion in 2009, leveraging another $55 billion from bilateral and multilateral ODA. However, such high levels of crisis-induced lending are unlikely to be sustained. Expectations are that World Bank lending, as well as other ODA, will substantially decrease overall in the next few years. This is a consequence of the need to readjust balance sheets after the peak in lending around the crisis and of donor countries' own fiscal woes. A very likely scenario is that infrastructure lending by the World Bank could be cut by half, even if it remains around 40% of overall lending.
If the growth in PPI continues as it has over the last 20 years, financing would reach some $250 billion by 2013. Such growth is possible; but the binding constraint, again, will be the attractiveness of the market for private firms as determined by the potential for cost recovery. The ability of countries to keep the costs of PPI down, through better regulation and contract management and a focus on the truly promising sectors will also be critical.
The figures developed in the Appendix indicate that even under fairly optimistic assumptions, an expenditure gap – perhaps on the order of 10% – could arise even as the absolute amount of investments increases quite substantially. A more pessimistic scenario, one in which developing
19 This includes some $30-40 billion for adaptation in infrastructure (World Bank 2009a) and some $140-175 billion associated with mitigation in the energy sector (World Bank 2009b).
Not for Circulation or Referencing
21
countries decrease public investments, PPI grows at only 7% per annum and ODA declines by half could result in a massive shortfall (perhaps on the order of 30%). Further, the gap is likely to be larger in poorer countries that face infrastructure expenditure needs of 15% of GDP or more. Success in minimizing or even closing the gap will require very substantial, though feasible, improvements in investment efficiency, in resource allocation and in the climate for public and private financing.
Infrastructure Investment and Other Actions for Green Growth
The incorporation of environmental sustainability in planning and implementing infrastructure investment adds additional complexities. The challenge is that environmental sustainability is a form of public good that markets cannot adequately provide on their own. Thus, as with environmental and natural resources policies more generally, we must consider how to incorporate into public policies and private sector decisions the social benefits of environmental sustainability, both at present and for the future.
These are problems that go well beyond infrastructure investment and maintenance costs, and the estimation of infrastructure services’ benefits to individual users. Policies are needed to internalize environmental externalities and impacts on social equity into a variety of consumption and investment decisions.20
This in turn requires public education and debate to achieve acceptance of proposed policies that very often impose costs on private actors, even if they generate larger benefits for society as a whole.
Policies for Addressing Environmental Externalities With respect to internalizing environmental externalities, there has been a profound shift over the past few decades toward the use of economic incentive or market-like mechanisms to limit harmful environmental impacts. These include taxes on emissions or tradable emission allowances. These policies create strong incentives not only to curb damages cost-effectively with existing technologies, but also to induce innovations that lower the cost of avoiding future environmental harm.
Market-like environmental policies are more difficult to use in practice when infrastructure is owned and operated by the public sector or parastatal enterprises. In addition, coordination problems involving significant fixed investments can pose difficulties in relying solely on a pricing approach.21
20 While this may seem less difficult in the case of public sector investment; there still the need for sometimes difficult coordination to get environmental considerations adequately represented in evaluations of projects. Development partners and financial institutions are in principle a source of information and technical support for accomplishing this; in practice, however, assessment of environmental benefits and costs often is done heuristically, subjectively, or not at all.
Whatever mix of instruments might be applied to increase the environmental
21 Another example directly relevant to infrastructure investment is the conversion of all public vehicles in Delhi (and now in many other Indian cities) to compressed natural gas (CNG) in order to replace much more polluting diesel fuel. Economic incentives would have required a longer time to have an effect, in part because of the need to coordinate retrofit of vehicles with greatly increased capacity to supply CNG.
Not for Circulation or Referencing
22
sustainability of infrastructure, it is also necessary to ensure that appropriate regulatory standards are put in place and enforced.
In addition, there is need for a suite of other efficiency-enhancing but often politically difficult policy reforms including reducing environmentally harmful subsidies (e.g. of energy and water), lowering market barriers to environmentally better-performing technology, and increasing both global environmental R&D and diffusion of improved technologies. Thus, while infrastructure investment is a major influence on nearer-term and longer-term environmental conditions, changing those conditions requires a variety of measures of which infrastructure policy itself is only one part.22
Setting Environmental Standards
Deciding at what level environmental and natural resource protection standards should be set is at least as important, and difficult, as the design of the policies to implement the standards. The considerable literature on environmental cost-benefit analysis is outside the scope of this paper (for a compact review of this topic see OECD 2006). Nor do we address the challenges to application of conventional cost-benefit analysis to climate change mitigation, when long time lines and high levels of uncertainty greatly complicate the valuation of future benefits (avoided climate change damages and less need for high coping costs) relative to current costs of mitigation. There is, however, a general point related to the nature of the anticipated social benefits from environmental and natural resource policies that is highly germane to the green growth discussion, including its infrastructure component.
Advocates for a “green economy” often state that stronger policies also can deliver higher incomes and jobs. It is crucial in evaluating opportunities for green growth to separate such claims from the broader potential contributions of environmental protection to individual welfare and socio-economic well-being. Individuals can be better off from stronger environmental policies even though they are costly, if the value of total benefits – pecuniary and non-pecuniary – they gain exceeds the costs incurred.
The strength of win-win arguments related to environmental protection and income growth from green investment in developing countries depends on the extent to which environmental policies can increase overall economic productivity as well as to stem environmental damages. The prospects for this in developing countries especially are difficult to gauge, in no small measure because data are so limited. Studies in developed countries indicate that for many pollution problems, non-market benefits of reduced pollution exceed direct economic benefits, often by a significant amount.23
22 While infrastructure (and other larger-scale, capital intensive projects) may be easier from a technical perspective to regulate than other sources, focusing environmental measures disproportionately on infrastructure can have unintended consequences. High water and sanitation tariffs could induce some users to drop off the system in order to self-supply, reducing the efficiency of water management and increasing the challenge of environmental quality enforcement. Similarly, passing forward high pollution charges in electricity rates could induce less economically efficient and more environmentally harmful auto-generation. Policies for inducing or requiring environmentally sustainable infrastructure are most effective when made a part of a more comprehensive and cost-effective environmental management system.
For developing countries facing very different economic and
23 For example, reduced concern about premature mortality from long-term pollutant exposure, or subjective benefits from improved environmental quality for recreation and intrinsic existence values, often are larger than the direct economic benefits of avoided medical costs or reduced land and forest degradation.
Not for Circulation or Referencing
23
environmental conditions, the contributions of pollution reduction to improving human health, productivity, and access to better land and water resources may be proportionately much greater, thus increasing the scope for win-win environmental and economic benefits.24
One case very relevant to infrastructure investment is improved energy efficiency, for which there are significant low-cost opportunities in both developed and developing countries. These improvements can free up resources that would have been devoted to energy production of purchase for more productive uses in the economy, thus providing a positive effect on national product and income. Energy efficiency also has the potential to provide significant environmental co-benefits due to lower local pollution and reduced GHGs.
Another important case is anticipatory adaptation to climate change. It is likely that the Infrastructure financing needs have been estimated at $30-40 billion annually, starting right away, to improve resilience (World Bank 2009a). However these and other adaptation measures often blend seamlessly into what would be good economic development plans and investments in the sense that they can deliver significant benefits even without climate change. It is thus likely that significant win-win opportunities exist with increased investment to enhance adaptation – if the needed finance can be generated.
Incentives for more environmentally sustainable investment also depend on their costs, and the costs of different green investments vary considerably. The costs of conventional air and water pollution controls, for example, are by and large relatively affordable because of prior advances in technologies and improved economies of scale. As noted, there are likely a number of energy efficiency investments, once in place the resulting cost savings complement environmental benefits. In contrast, renewable energy resources still are cost-competitive only in certain market niches, and cannot yet be scaled to make deep cuts in GHG emissions without substantial costs.
Green Technology Innovation Green Investment Cost and Green Growth The relatively high cost of measures to sharply curtail GHG emissions, and the continuing need to make other forms of environmental and natural resource protection more affordable for lower-income countries, highlights again the importance of stronger R&D programs to make environmentally sustainable technologies more affordable, and measures to lower the cost of their diffusion and adoption. These technology supply-side measures complement measures to increase the incentives for environmentally sustainable infrastructure and other investment. The practical financial consequences in the case of GHG mitigation are brought into stark relief by the 2010 WDR. That report gauges that substantial progress in GHG mitigation would require on the order of $140-175 billion investment annually by 2030, with a need for significant investment well before then to mitigate lock-in concerns noted previously. A very significant part of that investment inherently would be in infrastructure. Lowering that significant cost while maintaining the targeted progress in GHG mitigation would be possible only with major advances over current low-carbon technology.
24 The “Porter Hypothesis” (Porter and van der Linde 1995) holds that under a very broad range of circumstances, a variety of environmentally oriented policies and investments also can improve the corporate bottom line by increasing productivity. However, there is no evidence that this hypothesis is generally applicable in developed economies, though examples of it have been proffered (Albrecht 1998, Marty and Kumar 2003). In developing country economies with greater distortions, there could be more scope for environmental improvement investments with significant economic co-benefits.
Not for Circulation or Referencing
24
A number of the general impediments to private sector investment in infrastructure mentioned previously also can impede adoption of newer, less tested green technologies – essentially low effective rates of return because of market distortions, fiscal and trade policies, and uncertainties arising in particular from economic and other types of governance. One area of active debate in the technology literature is the role that the public sector should play in reducing the technologically related risks of initial technology diffusion (e.g. through partial investment risk guarantees or minimum purchase commitments). Aside from the fact that the relevance of this is more limited for many developing countries because of their limited means, it may well be that such efforts – even if co-funded by international assistance – will have limited benefits unless more fundamental policy related barriers to economically sustainable diffusion can be reduced.
The issues with R&D are somewhat more complex. It is well understood that the private sector inherently under-invests in R&D (because not all benefits can be appropriated back through e.g. licensing agreements), so increased public support for R&D generally certainly is warranted. In the case of environmentally related technology innovation, moreover, policies need to influence the allocation of R&D support across different lines of research, as well the total size of R&D expenditure. Acemoglu et al. (2009) illustrate one important reason for this: the returns to innovation activity may be higher in better established but less environmentally sustainable lines of technology development, even if policies limiting emissions are boosting demand for more green technology.
Since many environmental problems exist across international borders, and regional problems or global climate change necessarily transcend such borders, the potential markets for greener technology are global in scale. Correspondingly, there is need for international cooperation to increase green R&D innovation to respond to that global demand; otherwise we end up with the same problem of under-investment. The need for global cooperation is only amplified by the differences in means to fund R&D between developed and middle-income developing countries on the one hand, and least developed countries on the other. To obtain a desirable level of international support for GHG-reducing R&D in particular, and a desirable rate of diffusion of the technology, there is need to recognize explicitly the public goods nature of basic R&D in this equation, while still finding ways to reward applied innovators in the private sector who play a key role in developing marketable new technology.
One alternative view toward heavy national-level public investment in green R&D, and subsequent economic support for development of environmentally sustainable products and processes including infrastructure services, is to see it as part of larger industrial policy used to gain international leadership and thus market competitiveness in the production and provision of new and improved green technology. This approach has been used by some countries, notably in East Asia, to gain a strong position in markets for a number of consumer goods that depended on technology innovation (Rodrik et al. 1995, Mowery and Oxley 1995). Success in such an endeavor could convey global benefits by lowering the cost of environmentally sustainable investment in the same way as with international cooperation in supporting R&D, though the acquisition cost for diffusion of the technology could be quite different. Given the scale and diversity of innovation needed to bring down the economic cost of achieving a much lower-carbon future, it is uncertain whether the national industrial approach would be adequate environmentally or sufficiently attractive economically. In any event, achieving success in such an endeavor would seem to be an opportunity only for a limited number of countries.
Not for Circulation or Referencing
25
Summing Up: What is the Case for Green Investment to Induce Green Growth? When local and global environmental “goods” are being under-valued and over-used, there is always a case for policies to correct such externalities. The aim of the policies is to change investment decisions, as well as consumption behavior, toward patterns that do less to deplete “natural capital.” As a major source of environmental stresses and as a central mechanism for lowering those stresses, the size and composition of infrastructure investment is at the heart of the interactions of environmental and socio-economic goals. In no area is this truer than in GHG mitigation, given the long time lines and lock-in risks involved.
Nevertheless, there is a genuine risk of overselling the potential for low-cost “green growth” in policy debates. While green infrastructure certainly have a major role in lowering environmental harm, the direct productivity benefits depend on the degree of other market distortions in the economy. Green investments may “create jobs” in some sectors, but jobs also contract because investment moves from dirtier to cleaner sectors, and because environmental protection (in particular, cutting GHG emissions) almost inevitably entails some costs that get passed throughout the economy. Again, while these costs may represent an extremely valuable societal investment, they do not automatically imply a double benefit in terms of net job and income growth as well as environmental protection.
In developing countries the scope for win-win likely is greater than in more developed countries because of the presence of various other distortions. Perhaps ironically, however, these countries also have less financial means and thus less scope for purchasing or building greener infrastructure and other forms of capital, especially when such investment is costlier than less green options and the countries already are falling short in meeting needs for basic infrastructure services. Such investments may also face additional barriers because of environmentally negative subsidies that are nonetheless challenging socially to reduce, and challenges in the investment climate. Facing these circumstances, key steps forward for developed and developing countries would then by improvements in the conditions for infrastructure investment and environmental management in the latter; and greatly expanded funding for cost-reducing green innovation and support for its diffusion, led by the former. Until progress along these lines is accomplished, the prospective size of win-win green growth benefits is uncertain, and sweeping claims should be avoided.
The Way Forward: Proposals for Further G20 Attention
The key message of the paper for infrastructure investment can be summed up in three words: More, Better, Cleaner. The key caveats are summed up by observing that none of these is easy to achieve. More infrastructure investment and better-quality infrastructure services requires overcoming a number of obstacles related to cost and governance, as well as refining how public and private sector participation interact in practice. Cleaner infrastructure faces obstacles related to under-valuation of environmental benefits at country level, costs of current investment options, and the need for achieving complicated international agreements for addressing climate change.
While these challenges are real, so are opportunities for reducing them – especially if political will can be enhanced and, for developing countries, affordability can be improved. We briefly summarize the important follow-up actions below.
Not for Circulation or Referencing
26
Action 1: Promote collaborative efforts to greatly increase and improve collection and sharing of data on infrastructure investment and its impacts. Without improved information, it will remain difficult to diagnose the nature and extent of problems, design effective response mechanisms, and assess their post-implementation effectiveness (including with respect to the environment) so that mechanisms can continue to improve. Improved information also is crucial for getting “buy-in” from the most important constituencies: those taxpayers and infrastructure service users who ultimately are responsible for the financing.
The methodology and practical experience accumulated during the Africa Infrastructure Country Diagnostics could be used. An excellent opportunity is being offered by the proposed revision of the Government Financial Statistics. The World Bank and the IMF, along with relevant partners, could be tasked with developing a common methodology as well as the practical means to collect this information in a systematic and regular manner.
Action 2: Develop an action plan for increasing public and private financing of infrastructure, as well as improving its efficiency. Initial steps would include:
(a) Assessing the potential for increasing fiscal space in developing countries. This should be broadly understood as ranging from efforts at improved revenue collection and reduction of poorly targeted subsidies, to a review of investment planning and disbursement. It could also include a review of which sectors and sub-sectors are likely to benefit from PPPs. South-South collaboration could be one driver of such a review.
(b) Assessing the potential for increasing private investment and reducing its costs. This will require more efficient investment climates, more effective integration of public and private resources, and greater access to instruments for risk-sharing to induce more investment in riskier contexts. One proposal that has received attention in this context is to tap the investment potential of sovereign wealth funds.
(c) Assessing how to more cost-effectively integrate environmental considerations into infrastructure investments. This will require, in addition to increased information about costs and impacts of environmental components of investments, further attention to the complementary policy reforms needed to improve environmental outcomes generally. Thus, the environmental component of the action plan should include further consideration of policy reforms for improving private sector environmental performance, including more effective environmental measures and reform of environmentally damaging subsidies. In addition, the action plan should include identification of needs for improving the capacity for public sector decision makers to assess the benefits and costs of alternative infrastructure investment plans.
Action 3: Develop an action plan for providing increased technical and financial assistance to developing countries in their efforts to improve infrastructure efficiency, enhance the investment climate, and integrate environmental with economic concerns. The action plan would need to (a) highlight priority needs; (b) pool knowledge based on prior experience, and analyze how to lower barriers to achieving the stated objectives; and (c) identify adequate and reliable donor financing for developing countries to be able to make significant progress toward those objectives. Again one particular emphasis could be on South-South cooperation.
Not for Circulation or Referencing
27
Not for Circulation or Referencing
28
Annex 1. A Heroic Attempt at “Guess-timating” Future Infrastructure Financing Needs and financing gap
Estimated infrastructure needs in 2013
Financing sources
Estimated current In 2013
Pessimistic
Scenario
Optimistic
scenario
($ billions)
Infrastructure 900- 1,100 Public spending 550-600 450 700
ODA 50-100 40 60
PPI 138 190 250
Total 900- 1,100 700-800 700 1,000
Financing gap 100-300 200-300 0-100
Note: the financing gap is not likely to be evenly distributed across regions. It is likely minimal in East Asia (at least in China) whereas it has been estimated at 8% of GDP in Africa where detailed micro level analysis has been conducted (Foster and Briceño-Garmendia 2010).
Hypothesis and sources: Infrastructure spending estimated needs: from Yepes (2008) assuming developing countries grow at 4% per annum between 2008 and 2013. Includes both capital ($400 billion) and maintenance ($600 billion) spending. This does not represent ideal levels of spending, just what is likely to be needed to respond to increased demand for infrastructure services brought about by income growth. It does not include rehabilitation expenditures.
Current public spending estimate: For capital spending we relied on the shares of GDP reported in Yepes 2008 for East Asia and the Pacific (6.8% ; original source: Gill and Kharas 2007); for South Asia (4.2%) we used estimates of India’s public infrastructure spending from L. Andres (Pers. Com.); for LAC (1.2%) from original data collection efforts. These shares were applied to 2007 GDP figures from the World Development Indicators. Figures for Sub-Saharan Africa are from Foster and Briceño-Garmendia (2010). For ECA we assumed investments share was similar to that of Latin America; for MENA, where no data was available either, we used the weighted sample average (4.2%).
No data are available on how much is spent on maintenance except in Africa where O&M represents 45% of total expenditure on infrastructure (Foster and Briceño-Garmendia 2010). If a similar proportion applied to other developing countries, and our estimates of spending shares are correct, then developing countries could actually be spending close to a trillion on infrastructure – $500 billion to $600 billion on investments and $400 billion to $500 billion on O&M. If that is the case and our estimates of need are correct, then a financing gap is only
Not for Circulation or Referencing
29
likely to exist for specific countries (likely the poorest) with most other countries in need of increased spending efficiency.
ODA estimate: based on World Bank 2010 (“Infra”report); includes World Bank infrastructure lending, plus an additional associated $55 billion of other donor lending. PPI: PPIAF database. Flow is net of divestiture payments, so include only new investments.
Pessimistic scenario assumes a 20% decline in public spending on infrastructure; a halving of ODA and a decline in the rate of growth of PPI to 7% per annum (as opposed to the 13% yearly average growth of the last 20 years)
Optimistic scenario assumes future public spending increases by 20%; ODA only declines by 25%; PPI continues to grow at 13% per annum.
Not for Circulation or Referencing
30
References
Acemoglu, Daron, Philippe Aghion, Leonardo Bursztyn, and David Hemous. 2009. “The Environment and Directed Technical Change.” NBER Working Paper No. 15451.
Agénor, Pierre-Richard, and Blanca Moreno-Dodson. 2006. “Public Infrastructure and Growth: New Channels and Policy Implications.” Policy Research Working Paper 4064. The World Bank, Washington, DC.
Albala-Bertrand, José, and Emmanuel Mamatzakis. 2004. “The Impact of Public Infrastructure on the Productivity of the Chilean Economy.” Review of Development Economics 8 (2): 266–78.
Albrecht, Johan A. E. 1998. “Environmental Costs and Competitiveness. A Product-Specific Test of the Porter Hypothesis.” Working Paper Nr. 98/50, University of Ghent.
Alesina, Alberto, Reza Baqir, and William Easterly. 1999. “Public Goods and Ethnic Divisions.” Quarterly Journal of Economics 114 (4): 1243–84.
Andres, Luis, José Luis Guasch, Thomas Haven and Vivien Foster. 2008. The impact of Private Sector Participation in Infrastructure: Lights, shadows and the road ahead. The World Bank, Washington, DC.
Andres, Luis, José Luis Guasch, and Stéphane Straub. 2007. “Does Regulation and Institutional Design Matter for Infrastructure Sector Performance?” Policy Research Working Paper 4378. The World Bank, Washington, DC.
Briceño-Garmendia, Cecilia, Antonio Estache, and Nemat Shafik. 2004. “Infrastructure Services in Developing Countries: Access, Quality, Costs, and Policy Reform.” Policy Research Working Paper 3468. The World Bank, Washington, DC.
Briceño-Garmendia, Cecilia, Karlis Smits, and Vivien Foster. 2008. “Financing Public Infrastructure in Sub-Saharan Africa: Patterns and Emerging Issues” , Background Paper No 15. Africa Infrastructure Country Diagnostics www.infrastructureafrica.org. Cadot, Olivier, Lars-Hendrik Röller, and Andreas Stephan. 2006. “Contribution to Productivity or Pork Barrel? The Two Faces of Infrastructure Investment.” Journal of Public Economics 90 (6-7): 1133–53.
Calderon, César, and Luis Servén. 2010. “Infrastructure in Latin America”. Draft prepared for the Handbook of Latin American Economies. Chen, Sheng-Tung, Hsiao-I Kuo, and Chi-Chung Chen. 2007. “The Relationship between GDP and Electricity Consumption in 10 Asian Countries.” Energy Policy 35 (44): 2611–21. Cieslekowski, D., 2008. “Focus on Results: The IDA 14 Results Measurement System and Directions for IDA 15.” IDA RMS Report. Washington, DC: The World Bank.
de la Fuente, Angel, and Xavier Vives. 1995. “Infrastructure and Education as Instruments of Economic Policy: Evidence from Spain.” Economic Policy 20 (April): 11–54.
Ebinger, Jane. 2006. “Measuring Financial Performance in Infrastructure: An Application to Europe and Central Asia.” Policy Research Working Paper 3992. The World Bank, Washington, DC.
Not for Circulation or Referencing
31
Estache, Antonio, and Marianne Fay. 1997. “Ensuring Regional Growth Convergence in Argentina and Brazil: How Can Governments Help?” The World Bank, Washington, DC.
Estache, Antonio, and Marianne Fay. 2010. “Current debates on infrastructure Policy,” in Globalization and Growth: Implications for a Post-Crisis World. M. Spence and D. Leipziger Eds. The World Bank, Washington, DC.
Estache, Antonio, and Maria Elena Pinglo. 2005. “Are Returns to Public-Private Infrastructure Partnerships in Developing Countries Consistent with Risks since the Asian Crisis?” Journal of Network Industries 6 (1): 47–71.
Fay, Marianne, and Mary Morrison. 2007. Infrastructure in Latin America and the Caribbean: Recent Development and Key Challenges. The World Bank, Washington, DC.
Fay, Marianne, and Tito Yepes. 2003. “Investing in Infrastructure: What Is Needed from 2000–2010.” Policy Research Working Paper 3102. The World Bank, Washington, DC.
Fay, Marianne, Danny Leipziger, Quentin Wodon, and Tito Yepes. 2005. “Achieving Child-Health-Related Millennium Development Goals: The Role of Infrastructure”. World Development 33 (8): 1267-84.
Fernald, John. 1999. “Roads to Prosperity? Assessing the Link between Public Capital and Productivity.” American Economic Review 89 (3): 619–38.
Foster, Vivien and Cecilia Briceño-Garmendia, Eds. 2010. Africa’s Infrastructure: A Time for Transformation. The World Bank, Washington, DC. http://www.infrastructureafrica.org/.
Gill, Indermit, and Homi Kharas. 2007. An East Asian Renaissance : Ideas for Economic Growth. The World Bank, Washington, DC.
Gassner, Katherina, Alexander Popov, and Nataliya Pushak. 2007. “An Empirical Assessment of Private Participation in Electricity and Water Distribution in Developing and Transition Economies.” The World Bank, Washington, DC.
Gramlich, Edward M. 1994. “Infrastructure Investment: A Review Essay.” Journal of Economic Literature 32 (3): 1176–96.
Hurlin, Christophe. 2006. “Network Effects of the Productivity of Infrastructure in Developing Countries.” Policy Research Working Paper 3808. The World Bank, Washington, DC.
Hutton, Guy, and Laurence Haller. 2004. “Evaluation of the Costs and Benefits of Water and Sanitation Improvements at the Global Level.” WHO, Geneva.
Ingram, Gregory, and Zhi Liu. 1999. “Determinants of Motorization and Road Provision.” Policy Research Working Paper 2042. The World Bank, Washington, DC.
International Energy Agency (IEA). 2006. World Energy Outlook. Paris: International Energy Agency.
Izaguirre, Ada Karina. 2010. “Assessment of the impact of the crisis on new PPI projects”
Kalaitzidakis, Pantelis, and Sarantis Kalyvitis. 2004. “On the Macroeconomic Implications of Maintenance in Public Capital.” Journal of Public Economics 88 (3–4): 695–712.
Kamps, Christophe. 2005. “Is There a Lack of Public Capital in the European Union?” European Investment Bank Papers 10 (1): 72-93.
Komives, Kristin, Vivien Foster, Jonathan Halpern, and Quentin Wodon. 2005. “Water, Electricity, and the Poor: Who Benefits from Utility Subsidies?” The World Bank, Washington, DC.
Lvovsky, Kseniya. 2001. “Health and Environment.” World Bank Environment Strategy Papers 1. The World Bank, Washington, DC.
Mowery, David C., and Joanne E. Oxley, 1995. “Inward technology transfer and competitiveness: the role of national innovation systems.” Cambridge Journal of Economics 19 (1): 67-93.
Murty, M. N., and Surender Kumar. 2003. “Win-Win Opportunities and Environmental Regulation: Testing of Porter Hypothesis for Indian Manufacturing Industries.” Journal of Environmental Management 67 (2): 139-44.
OECD. 2006. Cost-Benefit Analysis and the Environment: Recent Developments. Paris: OECD.
PPIAF and World Bank. Database available at http://ppi.worldbank.org/
PPI data update note No. 36, May 2010. The World Bank/PPIAF, Washington, DC. http://ppi.worldbank.org/features/April2010/Impact-of-the-financial-crisis-05-04-10.pdf
Porter, Michael E., and Claas van der Linde, 1995. “Toward a New Conception of the Environment-Competitiveness Relationship.” Journal of Economic Perspectives 9 (4): 97-118.
Rauch, James. 1995. “Bureaucracy, Infrastructure, and Economic Growth: Evidence from U.S. Cities during the Progressive Era.” American Economic Review 85 (4): 968–79.
Rioja, Felix K. 2003. “Filling Potholes: Macroeconomic Effects of Maintenance vs. New Investments in Public Infrastructure.” Journal of Public Economics 87 (9–10): 2281–304.
Roberts, Peter, KC Shyam and Cordula Rastogi. 2006. Rural Access Index: A Key Development Indicator Tranport Sector Board Technical Paper No. 10. The World Bank, Washington DC.
Robinson, James, and Ragnar Torvik. 2005. “White Elephants.” Journal of Public Economics 89 (2-3): 197–210.
Rodrik, Dani, Gene Grossman and Victor Norman. 1995. “Getting Interventions Right: How South Korea and Taiwan Grew Rich.” Economic Policy 10 (20): 55–107.
Röller, Lars-Hendrik, and Leonard Waverman. 2001. “Telecommunications Infrastructure and Economic Development: A Simultaneous Approach.” American Economic Review 91 (4): 909–23.
Romp, Ward, and Jakob de Haan. 2005. “Public Capital and Economic Growth: A Critical Survey.” EIB Papers 2/2005. European Investment Bank, Luxemburg.
Schur, Michael, Stephan von Klaudy, Georgina Dellacha, Apurva Sanghi, and Nataliya Pushak. 2006. “The Role of Developing-Country Firms in Infrastructure: A New Class of Investors Emerges.” Gridlines Note 2 (May). Shalizi, Zmarak and Franck Lecocq. 2009. “Climate Change and the Economics of Targeted Mitigation in Sectors with Long-Lived Capital Stock.” Policy Research Working Paper 5063. The World Bank, Washington, DC.
Sirtaine, Sophie, Maria Elena Pinglo, Vivien Foster, and José Luis Guasch. 2005. “How Profitable Are Private Infrastructure Concessions in Latin America? Empirical Evidence and Regulatory Implications.” Quarterly Review of Economics and Finance 45 (2-3): 380–402.
Stern, David I. 2006. “Reversal of the trend in global anthropogenic sulfur emissions. ” Global Environmental Change 16 (2): 207-20.
Straub, Stéphane, and Charles Vellutini. 2006. “Assessment of the Effect of Infrastructure on Economic Growth in the East Asia and Pacific Region.” The World Bank, Washington, DC. Processed.
Yepes, Tito. 2008. “Investment Needs for Infrastructure in Developing Countries 2008–15.” The World Bank, Washington DC. Processed. WHO/UNICEF Joint Monitoring Program for Water Supply and Sanitation. 2010. Progress on Sanitation and drinking water 2010 update. WHO, Geneva. http://www.wssinfo.org/
World Bank. 2009a. Economics of Adaptation to Climate Change. The World Bank, Washington, DC.
Word Bank. 2009b. World Development Report 2010: Development and Climate Change. The World Bank, Washington DC.