55
M ld l ti S d Myelodysplastic Syndromes Ayalew Tefferi, MD Professor of Medicine Mayo Clinic Rochester MN Mayo Clinic, Rochester , MN 1
M l d l ti S dMyelodysplastic Syndromes
Ayalew Tefferi, MDProfessor of Medicine
Mayo Clinic Rochester MNMayo Clinic, Rochester, MN
1

DisclosureDisclosureI have nothing to disclose.I have nothing to disclose.
Pg 2

Incidence and Demographicsof Myelodysplastic Syndromeof Myelodysplastic Syndrome
Incidence after age 70 years >20/100,000
Median age at diagnosis is close to 70 years
No gender preference
Ab t 15 000 di d l i th US About 15,000 cases diagnosed yearly in the US
4540at
e xMenWomen40
35302520ic
inci
denc
e ra
xx
x Women
151050Age
-spe
cifi
xxxxxxxx
Pg 3Aul et al. Br J Haematol. 1992;82:358.Maynadie et al. Br J Cancer. 1996;74:288.
0-24 25-49 50-54 55-59 60-64 65-70 70-74 75-79 80-84 >85Age in 5-year blocks

HematopoiesisHematopoiesis

Stem cell mutation
Altered immune response
Altered stromal
response
Clonal myelopoiesis
HaploinsufficiencyE i ti h
Altered cytokineresponse
Epigenetic changesp
Ineffective hematopoiesis and increased apoptosis
Cl l l ti
Additional mutations
Leukemic transformation
Clonal evolution
Tefferi A, Vardiman JW. N Engl J Med 2009;361:1872

2016 WHO classification of myeloid malignancies
Acute myeloid leukemia (AML) and related neoplasms Chronic myeloid neoplasms
1 AML with recurrent genetic abnormalitiesAML with t(8;21)(q22;q22.1);RUNX1-RUNX1T1AML with inv(16)(p13.1q22) or t(16;16)(p13.1;q22);CBFB-MYH11APL with PML-RARAAML with t(9;11)(p21.3;q23.3);MLLT3-KMT2A
1 Myeloproliferative neoplasms (MPN)Chronic myeloid leukemia (CML), BCR-ABL1+
Chronic neutrophilic leukemia (CNL)Polycythemia vera (PV)Primary myelofibrosis (PMF)
AML with t(6;9)(p23;q34.1);DEK-NUP214
AML with inv(3)(q21.3q26.2) or t(3;3)(q21.3;q26.2); GATA2, MECOM
AML (megakaryoblastic) with t(1;22)(p13.3;q13.3);RBM15-MKL1Provisional entity: AML with BCR-ABL1AML with mutated NPM1AML with biallelic mutations of CEBPA
PMF, prefibrotic/early stagePMF, overt fibrotic stage
Essential thrombocythemia (ET)
Chronic eosinophilic leukemia, not otherwise specified (NOS)
MPN, unclassifiable
2 MastocytosisProvisional entity: AML with mutated RUNX1
2 AML with myelodysplasia-related changes3 Therapy-related myeloid neoplasms4 AML, not otherwise specified (NOS)
AML with minimal differentiationAML without maturationAML ith t ti
3 Myeloid/lymphoid neoplasms with eosinophilia and rearrangement ofPDGFRA, PDGFRB, or FGFR1, or withPCM1-JAK2
Myeloid/lymphoid neoplasms with PDGFRA rearrangement
Myeloid/lymphoid neoplasms with PDGFRB rearrangement
Myeloid/lymphoid neoplasms with FGFR1 rearrangement
Provisional entity: Myeloid/lymphoid neoplasms with PCM1 JAK2AML with maturationAcute myelomonocytic leukemiaAcute monoblastic/monocytic leukemiaPure erythroid leukemiaAcute megakaryoblastic leukemiaAcute basophilic leukemiaAcute panmyelosis with myelofibrosis
Provisional entity: Myeloid/lymphoid neoplasms with PCM1-JAK2
4 Myelodysplastic/myeloproliferative neoplasms (MDS/MPN)Chronic myelomonocytic leukemia (CMML)
Atypical chronic myeloid leukemia (aCML), BCR-ABL1−
Juvenile myelomonocytic leukemia (JMML)
MDS/MPN with ring sideroblasts and thrombocytosis (MDS/MPN-RS-T)5 Myeloid sarcoma6 Myeloid proliferations related to Down syndrome
Transient abnormal myelopoiesis (TAM)Myeloid leukemia associated with Down syndrome
MDS/MPN, unclassifiable
5 Myelodysplastic syndromes (MDS)MDS with single lineage dysplasiaMDS with ring sideroblasts (MDS-RS)
MDS-RS and single lineage dysplasiaMDS-RS and multilineage dysplasia
MDS ith ltili d l i
11/10/2016 6
MDS with multilineage dysplasiaMDS with excess blastsMDS with isolated del(5q)MDS, unclassifiable
Provisional entity: Refractory cytopenia of childhood
6 Myeloid neoplasms with germ line predisposition

Myeloid Disorders
Acute MyeloidLeukemia
Chronic MyeloidDisorders
≥20% blasts <20% blasts≥20% blastsIn bone marrow or blood
OrPresence of t(8;21)(q22;q22), inv(16)(p13;q22),
<20% blasts
t(16;16)(p13;q22), or t(15;17)(q22;q12)
Vardiman et al. Blood. 2002;100:2292.

Chronic Myeloid MalignanciesChronic Myeloid Malignancies1. Molecularly-defined
i Chronic myelogenous leukemiai. Chronic myelogenous leukemia BCR-ABL1
ii. Eosinophilia-associated myeloid/lymphoid malignancy PDGFRA-rearranged PDGFRB-rearranged FGFR1 d FGFR1-rearranged
2. Molecularly-undefined
MyelodysplasticSyndromes
Myelodysplastic/Myeloproliferative
overlap
MyeloproliferativeNeoplasms
ErythrocytosisGranulocytosisThrombocytosis
EosinophiliaDyserythropoiesisDysgranulopoiesisAbsence of cytosis
Monocytosis
Mastocytosis
Tefferi A. Leukemia Research, in press

DyserythropoiesisDyserythropoiesisy y py y p
Nuclear dysplasia and multinuclearityABN.CELL DIVISION
Pg 9Megaloblastoid maturation

Ringed SideroblastsRinged Sideroblasts
Pg 10

DysgranulopoiesisDysgranulopoiesisy g py g p
Pseudo Pelger cell
Hypogranular neutrophilsypog a u a eut op s
Pg 11

DysmegakaryopoiesisDysmegakaryopoiesis
Large mononuclearBinucleated
Micromegakaryocyte
Pg 12Multinucleated
Courtesy of Dr. T. VallespiCourtesy of Dr. T. Vallespi

2016 WHO classification of myeloid malignancies
Acute myeloid leukemia (AML) and related neoplasms Chronic myeloid neoplasms
1 AML with recurrent genetic abnormalitiesAML with t(8;21)(q22;q22.1);RUNX1-RUNX1T1AML with inv(16)(p13.1q22) or t(16;16)(p13.1;q22);CBFB-MYH11APL with PML-RARAAML with t(9;11)(p21.3;q23.3);MLLT3-KMT2A
1 Myeloproliferative neoplasms (MPN)Chronic myeloid leukemia (CML), BCR-ABL1+
Chronic neutrophilic leukemia (CNL)Polycythemia vera (PV)Primary myelofibrosis (PMF)
AML with t(6;9)(p23;q34.1);DEK-NUP214
AML with inv(3)(q21.3q26.2) or t(3;3)(q21.3;q26.2); GATA2, MECOM
AML (megakaryoblastic) with t(1;22)(p13.3;q13.3);RBM15-MKL1Provisional entity: AML with BCR-ABL1AML with mutated NPM1AML with biallelic mutations of CEBPA
PMF, prefibrotic/early stagePMF, overt fibrotic stage
Essential thrombocythemia (ET)
Chronic eosinophilic leukemia, not otherwise specified (NOS)
MPN, unclassifiable
2 MastocytosisProvisional entity: AML with mutated RUNX1
2 AML with myelodysplasia-related changes3 Therapy-related myeloid neoplasms4 AML, not otherwise specified (NOS)
AML with minimal differentiationAML without maturationAML ith t ti
3 Myeloid/lymphoid neoplasms with eosinophilia and rearrangement ofPDGFRA, PDGFRB, or FGFR1, or withPCM1-JAK2
Myeloid/lymphoid neoplasms with PDGFRA rearrangement
Myeloid/lymphoid neoplasms with PDGFRB rearrangement
Myeloid/lymphoid neoplasms with FGFR1 rearrangement
Provisional entity: Myeloid/lymphoid neoplasms with PCM1 JAK2AML with maturationAcute myelomonocytic leukemiaAcute monoblastic/monocytic leukemiaPure erythroid leukemiaAcute megakaryoblastic leukemiaAcute basophilic leukemiaAcute panmyelosis with myelofibrosis
Provisional entity: Myeloid/lymphoid neoplasms with PCM1-JAK2
4 Myelodysplastic/myeloproliferative neoplasms (MDS/MPN)Chronic myelomonocytic leukemia (CMML)
Atypical chronic myeloid leukemia (aCML), BCR-ABL1−
Juvenile myelomonocytic leukemia (JMML)
MDS/MPN with ring sideroblasts and thrombocytosis (MDS/MPN-RS-T)5 Myeloid sarcoma6 Myeloid proliferations related to Down syndrome
Transient abnormal myelopoiesis (TAM)Myeloid leukemia associated with Down syndrome
MDS/MPN, unclassifiable
5 Myelodysplastic syndromes (MDS)MDS with single lineage dysplasiaMDS with ring sideroblasts (MDS-RS)
MDS-RS and single lineage dysplasiaMDS-RS and multilineage dysplasia
MDS ith ltili d l i
11/10/2016 13
MDS with multilineage dysplasiaMDS with excess blastsMDS with isolated del(5q)MDS, unclassifiable
Provisional entity: Refractory cytopenia of childhood
6 Myeloid neoplasms with germ line predisposition

AMLAMLCMMLCMMLMDS/MPNMDS/MPN
PB or BMPB or BMblasts blasts ≥≥20%20%
PB monocytesPB monocytes≥≥ 1 x 101 x 1099/L/L
BM minimal criteria for MDS:BM minimal criteria for MDS:Dyserythropoiesis,Dyserythropoiesis,
Dysgranulopoiesis Dysgranulopoiesis ororDysmegakaryopoiesisDysmegakaryopoiesis
in in ≥≥ 10% of specific lineage cells10% of specific lineage cells
Tefferi A, Vardiman JW. N Engl J Med 2009;361:1872
Yes
No
Auer rods RAEB-2
Yes
No
PBblasts 1%
2-4%
5-19%
5-9%Yes
No
BMblasts 5%
RAEB-1 10-19%
Yes
No
Isolated del(5q) MDS-del(5q)
No
YesNoMultilineagedysplasia
Not fitting elsewhere
UnilineagedysplasiaRCMD
15% ringsideroblasts RARS
NoNot fitting elsewhere
MDS-U RCUD

Retrospective Analysis of the WHO Classification
1.0
p<0.000050.8
0 6urvi
val
0.6
0 4ulat
ive
su
0.4
0 2
cum
u
RCMD del(5q)0.2
0 0
RCMDRSRAEB I
RAEB II
RA
RARS
Pg 15
3603002401801206000.0
monthsGerming, U. Leukemia Research, 2001

Karyotype and prognosis in MDS
(A) Overall survival (n = 1,893) and(B) Risk of acute myeloid leukemia transformation (n = 1,691)
Schanz J, et al. J Clin Oncol 2012;30:820-9.

New cytogenetic risk categories in MDS
1. Very good: 11q- and −Y 2. Good: normal, 5q-, 12p-, 20q- and double including 5q-3. Intermediate:7q-, +8, i(17), +19, +21, other single abnormality, double without 5q- or −7/7q-4. Poor: inv(3)/t(3q)/del(3q), −7, double including −7/del(7q), and three abnormalities 5. Very poor: More than three abnormalities
Schanz J, et al. J Clin Oncol 2012;30:820-9.


Mutations and Cytogenetic Abnormalities in 223 Samples with at Least One Mutation.
Bejar R et al. N Engl J Med 2011;364:2496-2506.

Hazard Ratios for Death from Any Cause, According to Presence (vs. Absence) of Mutation in Each of Seven
Genes.
Bejar R et al. N Engl J Med 2011;364:2496-2506.

Overall Survival, According to International Prognostic Scoring System (IPSS) Risk Category and Mutational
Status.
Bejar R et al. N Engl J Med 2011;364:2496-2506.

Allogeneic Transplant in Patients With MDS
Disease Free SurvivalDisease-Free Survival
Who Is the Best Donor? HLA-ID (N=885)100AUTO (N=173)
VUD (N=198)
FAMNID (N=91)75
FAMNID (N 91)
(N=1378)50
Perc
ent
25
P
de Witte et al. Br J Haematol. 2000;110:620.
00
12 24 36 48 60M th
Pg 24
Months
Identical twin transplant had similar relapse rate and better survivalKroger et al. 2005 BMT 35: 37.

Management of MDSManagement of MDS Non-Transplant Treatment OptionsNon Transplant Treatment Options
– AML-like induction chemotherapyTreatment with growth factors– Treatment with growth factors
– Drug therapyS ti– Supportive care
Pg 25

Survival trends among 1000 patients with primary MDS stratified by year of diagnosis.Gangat et al. Blood Cancer J. 2016 Apr; 6(4): e414

Effect of Age and Blast Count on DFS in MDS After
TransplantationTransplantation
Age Disease stage
1 0<18 y (n=66) <5% (n=195)
Probability of DFSaccording to age
Probability of DFS according to blasts in BM
1 0
Bone marrow blast influence
1.0
0.8
0 6ity
y ( )18-30 y (n=84)31-45 y (n=165)>45 y (n=137)
( )5-20% (n=131)>20% (n=35)
1.0
0.8
0 6ity 0.6
0.4
Prob
abil0.6
0.4
Prob
abil
0 1 2 3 4 5
0.2
00 1 2 3 4 5
P<0.0001 P<0.00010.2
0
Pg 27Sierra et al. Blood. 2002,100:1997.
Years Years

de Lima et al. Blood 2004;104:857, fludara/busulfan IV, n=96, 22 MDS, 30 age > 50 years.
Pg 28

Actuarial Survival Curve of MDS Patients Age <60 YearsActuarial Survival Curve of MDS Patients Age <60 Years
100(%
)
Not transplanted(n=184)
Low50
75
all s
urvi
val
High Int-2 Int-1
0 25 50 75 100 125 150 175 200 225
0
25
Ove
ra
Transplanted(n=260)
BMT and HLA-
Months
75
100
rviv
al (%
)
Low BMT and HLA-identical siblings
only25
50
Ove
rall
sur
High
Int-2
Int-1Low
Pg 29Cutler et al. Blood. 2004;104:579.
0 25 50 75 100 125 150 175 200 225Months
0O

AZA-001
Log-Rank p=0.0001HR = 0.58 [95% CI: 0.43, 0.77]1.0
CR = 17%; ORR = 35%
0.7
0.8
0.9
ving
0 4
0.5
0.6
rtion
Sur
viv
24.4 months
15 th
50.8%
0.2
0.3
0.4
Pro
por
CCRAZA
15 months 26.2%
0 5 10 15 20 25 30 35 400.0
0.1
©2012 MFMER | slide-30
Time (months) from Randomization
Fenaux P, et al. Lancet Oncology 2009;10:223-232.

Randomized Study of Azacitidine in Patients With MDS: SurvivalPatients With MDS: Survival
1 01.0
0.8 Azacitidine
bilit
y
Supportive Care
• CR = 7%• PR = 16%• Improved 37%
(N=191)
0.4
0.6
al P
roba
b Supportive Care p
ECOG/SWOG randomized study of low-dose Ara-C in 141 high-risk MDS0.2Su
rviv
a
• CR = 11%• PR = 21%
Months
0 6 12 18 24 30 36 42 48 540.0
Pg 31
75 mg/m2/d SC x 7 days every month.Silverman et al. J Clin Oncol. 2002;20:2429.Miller et al. Ann Hematol. 1993;65:162.

D it biDecitabine.• MDACC phase III study - 15 mg/m2 Q 8 hrs for
3 d d i d BSC3 days randomized to BSC.
• CR-9% & overall response rate 17%.
• ADOPT study 20 mg/m2 D1-5 IV Median
Kantarjian et al. Cancer 2006.
• ADOPT study 20 mg/m2 D1-5 IV. Median survival of 19.4 months and CR of 17%.Steensma DP et al. JCO 2009
• EORTC-LG study randomized to 3 day schedule had no survival benefit
Steensma DP et al. JCO 2009
schedule had no survival benefit.Lubbert M et al. JCO 2011

33

MDS-001: follow-up at 4.9 yearsp y
• At 4.9 years, follow-up available for 20 responders– 9 (45%) del(5q) and 11 (55%) non-del(5q)
– median duration of major erythroid response or RBC-TI was 61 weeks (95% CI 19–119 weeks)61 weeks (95% CI, 19 119 weeks)
• Among 6 case reports of lower-risk patients with del(5q) and non-del(5q) who maintained long-term therapy, median RBC-TI was 5.6 years (mean 5.5 years; SD 0.81 years)
• Lenalidomide can induce durable erythroid responsesLenalidomide can induce durable erythroid responses with sustained RBC-TI in patients with lower-risk non-del(5q) and del(5q) MDS
Kurtin SE, List AF. Clin Lymphoma Myeloma 2009;9:E10–13.CI, confidence interval; RBC, red blood cell; SD, standard deviation; TI, transfusion independence.

Erythropoietin and Darbepoetin in MDSErythropoietin and Darbepoetin in MDS
Darbepoetin in 37 patients with MDSWeekly dose of 150 µg SC
Responders Nonresponders
Epoetin response in randomized study by FAB subgroups
Responders Nonresponders
Serum EPO <100 IU/l 11/13 (84.6%) 6/21 (28.5%)
Epoetin α Placebo P value
RA 50 5.9 0.0072
RBC transfusions <2/month 13/15 (86.6%) 11/22 (50%)RAS 37.5 18.2 0.6
RAEB 16.7 11.1 1.0Marrow blasts <5% 14/15 (93.3%) 7/22 (31.8%)
Hypoplastic bone marrow 4/15 (26.6%) 2/22 (9%)
RAEB 16.7 11.1 1.0
Pg 35
RA = refractory anemia; RAS = RA with ringed sideroblasts; RAEB = RA with excess blasts.Musto et al. Br J Haematol. 2005;128:204.Italian Cooperative Study Group. Br J Haematol. 1998;103:1070.

MDS treatment algorithmMDS treatment algorithm
Is 5q- present?
Symptomatic Asymptomatic
Watch and waitq p
No
Watch and wait
What is the IPSS score?Yes
Favorable UnfavorableEPOETIN
E i t l
> 50 < 50
Pg 36
LenalidomideExperimental
therapy RIC Myeloablativetransplant

N A t f MDSNewer Agents for MDSDeacetylase Inhibitors and Kinase InhibitorsDNMT Inhibitors:
- Oral 5-AZA (CC-486)- INCB –JAK inhibitor
- LGH447- Pim kinase - Oral DAC + cytidine
deaminase inhibitor (E7772).
- MEK162- MEK1/2
- Volasertib- PLK1( )
- SGI-110
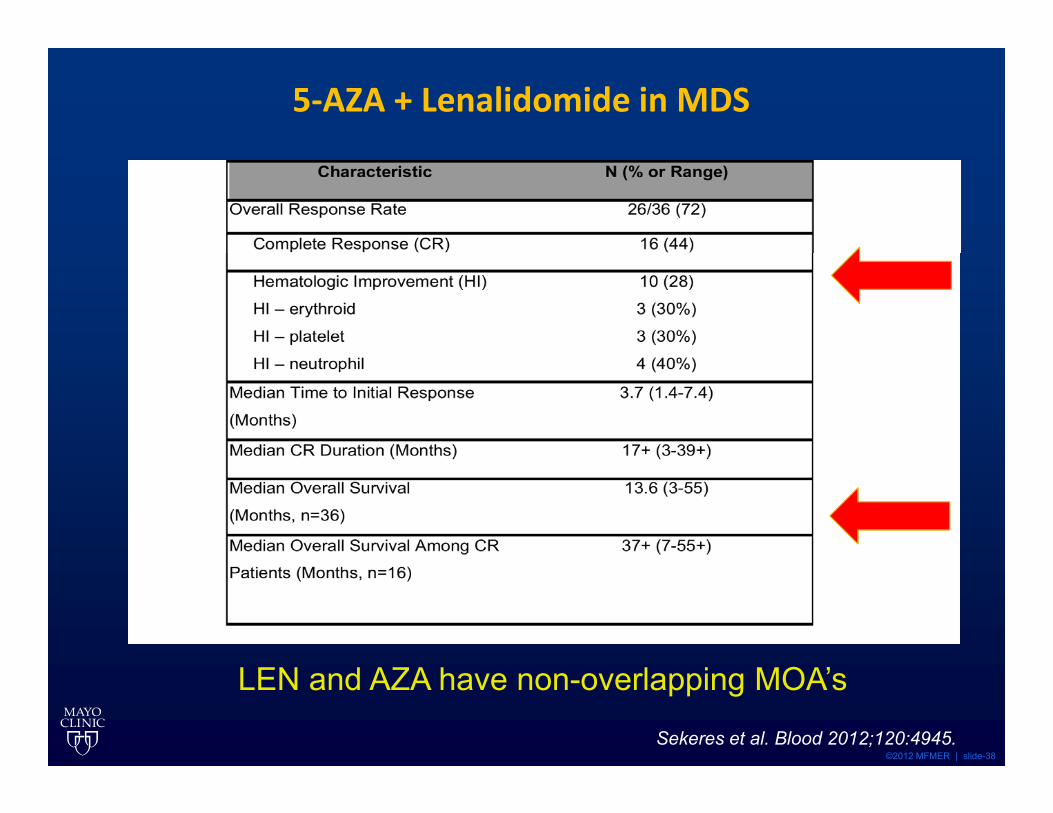
5‐AZA + Lenalidomide in MDS
©2012 MFMER | slide-38Sekeres et al. Blood 2012;120:4945.
LEN and AZA have non-overlapping MOA’s

5- AZA + Vorinostat in MDS- Study 6898 of th N Y k C C tithe New York Cancer Consortium
C h t N A C D V i t t D I t 1 I t 2 Hi h Ri k U l RCohort No Aza Cmg/m2 Subcutaneous (SC)
Days(azaC)
VorinostatMg dailyPO
Days(Vorinostat)
Int-1 Int-2 High Risk Unclassified
Response
1 13 55 1-7 400 3-16 3 3 5 2 70
2 13 75 1-7 600 3-9 3 4 4 2 73
3 14 55 1-7 400 3-9 2 5 3 3 67
N=40Response rates- CR- 10, CR (i)-4, HI – 9, SD – 5, NR -5.
Median time to response – 2 cycles/ 2 months.
N 40
©2012 MFMER | slide-39
p y
Silverman LR et. al ASH 2013

Questions About Iron Chelation in MDSIron Chelation in MDS
Does iron overload affect survival? Which risk group? Does iron overload affect QoL? Does iron chelation affect either survival
Q L?or QoL? Could iron chelation improve cytopenias? Could iron chelation increase infection risk? Could iron chelation increase infection risk? What would be the cost of “benefit” from
iron chelation? What is the best way to monitor efficacy of iron chelators?
Serum ferritin? T2* MRI (heart)? Magnetic susceptometry by superconduction quantum-interference device (SQUID;
Pg 40
by superconduction quantum-interference device (SQUID; liver)? Liver biopsy?

MDS treatment algorithmGangat et al; MCP

HMA Cli i l P lHMA – Clinical Pearls• 5-AZA and DAC FDA approved for higher risk pp g
MDS.
• HMA Overall response rates- 45-50%.p
• CR rates 7-17%.
• Time to response 3 4 cycles/ months• Time to response 3-4 cycles/ months.
• Median duration of response 12-18 months.
• Survival after progression 3-6 months.
Silverman L et al, JCO 2002Fenaux P et al, Lancet Oncology 2009Garcia- Manero, G et al, Blood 2006

ASH 2015- Oral
A Randomized Phase II Study of Azacitidine Combined with Lenalidomide or with Vorinostat vs. Azacitidine MonotherapyLenalidomide or with Vorinostat vs. Azacitidine Monotherapy in Higher-Risk Myelodysplastic Syndromes (MDS) and Chronic Myelomonocytic Leukemia (CMML): North American Intergroup Study SWOG S1117
Mikkael A Sekeres MD MS Megan Othus PhD Alan F List MD OlatoyosiMikkael A. Sekeres, MD, MS, Megan Othus, PhD, Alan F. List, MD, Olatoyosi Odenike, MD, Richard M. Stone, MD., Steven D. Gore, MD, Mark R. Litzow, MD, Rena Buckstein, MD, Mario R. Velasco, MD, Rakesh Gaur, MD, MPH, Ehab Atallah, MD, Eyal C. Attar, MD, Frederick R. Appelbaum, MD, Harry P. Erba, MD, PhDPhD

North American Intergroup Randomized Phase 2 MDS Study S1117: Study DesignPhase 2 MDS Study S1117: Study Design
AZA (IV/SC) Groups: SWOG, ECOG,AZA (IV/SC)75 mg/m2/d (d1-7)
N=92Higher-risk MDS or
Groups: SWOG, ECOG,Alliance, NCIC
Total Sample Size: 276
AZA (IV/SC) + LEN (PO)75 mg/m2/d (d1-7) + 10mg/d x 21d
N=93
MDS or CMML Primary Objective: 20%
improvement of ORR (CR/PR/HI) based on N=93
AZA (IV/SC) + Vorin (PO)(IPSS >1.5 and/or
( )2006 IWG Criteria
Secondary Objectives: OS,RFS LFS( ) ( )
75 mg/m2/d (d1-7) + 300mg BID (d3-9)N=91
and/or blasts >5%)
RFS, LFS
Power 81%, alpha 0.05 for each combo arm vs. AZA
03/2012 – 06/2014Sekeres et al. ASH 2014: LBA - 5

S1117 Relapse Free SurvivalS1117- Relapse Free SurvivalRelapse−free survival for patients on therapy > 6 months
0.8
1.0AzaAza+LenAza+Vor 0.8
1.0AzaAza+LenAza+Vor
0.4
0.6
Surv
ival
pro
babi
lity
0.4
0.6
Sur
viva
l pro
babi
lity
0.0
0.2
0 5 10 15 20
Aza vs Aza+Len log−rank p = 0.45Aza vs Aza+Vor log−rank = 0.29Aza vs Combo arms log−rank p = 0.3 0.0
0.2
0 5 10 15 20
Aza vs Aza+Len log−rank p = 0.74Aza vs Aza+Vor log−rank p = 0.11Aza vs Combo arms log−rank p = 0.6
0 5 10 15 20Months since response
AzaAza+LenAza+Vor
33 19 7 4 134 23 8 5 120 13 9 5 1
N at risk0 5 10 15 20
Months since response
AzaAza+LenAza+Vor
21 14 5 228 19 6 3 115 13 9 5 1
N at risk
Sekeres et al. ASH 2014: LBA - 5
All study patients Patients who had been on study for > 6 months

ASH 2015- Oral
A Randomized, Placebo-Controlled, Phase II Study of Pracinostat in Combination withStudy of Pracinostat in Combination with Azacitidine (AZA) in Patients with Previously Untreated Myelodysplastic Syndrome (MDS)
Guillermo Garcia-Manero, MD1, Jesus G. Berdeja, MD2, Rami S. Komrokji, MD3, James Essell, MD4, Roger M Lyons MD5 Michael Maris MD6 Amy E DeZern MD MHS7 Mikkael A Sekeres MD MS8 andRoger M. Lyons, MD , Michael Maris, MD , Amy E. DeZern, MD, MHS , Mikkael A. Sekeres, MD, MS and Gail J Roboz, MD9

Results:Characteristic AZA +Pracinostat AZA P
value
CR i hi 6 l 18% 31%CR within 6 cycles 18% 31%
Hematologicalimprovement
35% 55%
PFS (months) 10.7 9.7 NS
EFS (months) 8.6 9.0 NS
OS (months) 15.7 18.8 NS
Discontinuation rate 26% 10%
Grade III febrile 33% 18%Grade III febrile neutropenia
33% 18%
Grade III fatigue 24% 0%
N = 102

ASH 2015- Oral
Telomerase Inhibitor Imetelstat Therapy in Refractory Anemia with Ring Sideroblasts with or without Thrombocytosis
Ayalew Tefferi, MD,1* Aref Al‐Kali, MD,1 Kebede H. Begna, MD,1 Mrinal M. Patnaik, MBBS,1T L L h PhD 1 Xi li W S D 2 Yi W PhD 3 d C ti A H MD4Terra L. Lasho, PhD,1 Xiaolin Wang, ScD,2 Ying Wan, PhD,3 and Curtis A. Hanson, MD4
1Division of Hematology, Mayo Clinic, Rochester, MN; 2Geron Corporation, Menlo Park, CA; 3Janssen Research & Development, LLC, Raritan, NJ; 4Division of Hematopathology, Mayo Clinic, Rochester, MN

@(hTR(hTERT)
MF (n=60)
MF Pilot Study (n=33)@(hTR)
Screening
Exploratory Cohorts (n=27)
Screening RARS/RARS-T (n=9)
Blast-Phase MF (n=9)
@Dose: Imetelstat, 2-hour intravenous infusion of 9.4 mg/kg every 3 weeks for Arm A and 9 4 mg/kg every week x 4 and then every 3weeks for Arm A and 9.4 mg/kg every week x 4 and then every 3 weeks for Arm B.
Tefferi A. et al ASH 2015


ASH-2015
Eltrombopag for the Treatment of Thrombocytopenia of Low and Intermediate-1 IPSS Risk Myelodysplastic Syndromes:
Aristoteles Giagounidis, MD, PhD1, Uwe Platzbecker, MD2, Ulrich Germing, MD3, Katharina Götze, MD4, g , , , , , g, , , ,Philipp Kiewe, MD5, Karin Mayer, MD6, Oliver Ottmann, MD7, Markus Radsak, MD8, Thomas Wolff, MD9,
Detlef Haase, MD10, Monty Hankin11, Dawn Wilson11, Xiaosha Zhang11, Adberrahmane Laadem, MD12, Matthew L. Sherman, MD11 and Kenneth M. Attie, MD11

Thrombopoietin receptor (TPOR) o bopo et ecepto ( O )agonists
Molecule
Eltrombopag Romiplostim
Oral, non-peptide agonist Peptide S.C. agonistMolecule
Binding site
Transmembrane domain of the TPOR and of c-MPL
different from TPO bindingExtracellular domain, same as endogenous TPO binding sitedifferent from TPO binding
siteendogenous TPO binding site
Endogenous No yesgTPO competitor No yes
Signal Different than that of Similar pathway of endogenous gtransduction endogenous TPO
p y gTPO

Study design
R d i ti
Eltrombopag
Wk 24Randomization 2:1
Patients
Eltrombopag+ Standard care
(n = 116)Eltrombopag
+ Standard careCR and R
(N = 174)
Placebo+ Standard care
(n = 58)Standard Care
Dose start: 50 mg with increases every 2 weeks up to 300 mg daily.

Mean changes in PLT counts at 8 and 24 weeksweeks
8 weeks 24 weeks8 weeks 24 weeks
Placebo PlaceboEltrombopag Eltrombopag
At 8 weeks median PLT counts increased from 18 (IQR 10-25) Gi/L to 44 (IQR (18-70) Gi/L in the eltrombopag arm vs no significant change in the placebo arm.


![Untitled-6 [] · tis 1227-2539 (1996) tis 1390-2539 (1996) tis 1227-2539 (1996) tis 1390-2539 (1996) tis 1227-2539 (1996)](https://static.documents.pub/doc/80x56/5e1a6a0f6b8d9f48bd19bcad/untitled-6-tis-1227-2539-1996-tis-1390-2539-1996-tis-1227-2539-1996-tis.jpg)


