20
Parks and Public Health in Los Angeles County A Cities and Communities Report May 2016

Parks and Public Health in Los Angeles CountyA Cities and Communities Report
May 2016

2 Los Angeles County Department of Public Health
EXECUTIVE SUMMARY
The availability of parks and associated recreational programs
can have important public health benefits, including increased
physical activity and reduced obesity and chronic disease as well
as other positive health and environmental impacts. Unfortunately,
Los Angeles County is relatively park poor compared with many
other urban jurisdictions in the United States. The objective of this
study was to assess park space per capita in relation to premature
mortality from cardiovascular disease (heart disease and stroke)
and diabetes, childhood obesity prevalence, community level
economic hardship, and race/ethnicity in cities and unincorporated
communities across Los Angeles County. Large geographic
disparities in park space per capita were observed. Cities and
communities with less park space per capita on average had
higher rates of premature mortality from cardiovascular disease
and diabetes, higher prevalence of childhood obesity, and greater
economic hardship compared with cities and communities with
more park space per capita. African Americans and Latinos were
more likely than Asians and Whites to live in cities and communities
with less park space per capita. The findings highlight current
socioeconomic and racial/ethnic inequities in park space availability
across Los Angeles County and suggest that prioritization of
resources for park expansion in communities with less park space
could help reduce health disparities in the county.

Parks and Public Health in Los Angeles County: A Cities and Communities Report 3
INTRODUCTION
The availability of parks and associated recreational programs impacts the public’s health. Parks can be a focal point for promoting physical activity among both children and adults through recreational programs and structured activities such as walking groups.1 Evidence also suggests that people who live close to park and recreation facilities have lower rates of obesity, and engage in more physical activity than those who do not. For example, a ten-year study of over 3,000 children in southern California found that those living near parks and recreational programs had lower rates of obesity at 18 years of age than comparable children who lived further away.2
Regular physical activity, even at moderate levels (e.g., brisk walking or dancing), has profound health benefits, protecting against heart disease, stroke, diabetes, depression, and many types of cancer. These health benefits also accrue among persons who are overweight or obese, even when they are unable to lose weight. Because of these health benefits, physical activity can improve quality of life, increase productivity, and reduce health care costs.
Parks can also contribute to improved health in other important ways. For example, in communities beset by violence, parks can serve as a platform for violence prevention efforts. This is exemplified both by the City of Los Angeles’ Summer Night Lights Program and the County’s Parks After Dark (PAD) initiative, which provide expanded youth and adult programming at parks on summer evenings. These parks-related interventions have had documented success in reducing serious and violent crime in surrounding neighborhoods.3 In addition, evaluation of the PAD initiative has found it to be immensely popular among community members, having increased perceptions of safety, improved relations between law enforcement and community members, and increased community cohesion, which leads to stronger social support networks that further improve health.
Parks can also serve as locations for outreach to increase access to and enrollment in health and social services, youth development programs, employment events/job fairs, and nutrition assistance programs. Park facilities can serve as meeting places for local residents to address health and social issues in their communities. Parks can also provide space for community gardens and farmers’ markets, thereby increasing community access to fresh produce, a major issue in many economically disadvantaged neighborhoods with high rates of obesity and diabetes.

4 Los Angeles County Department of Public Health
Parks also have environmental benefits that can protect and improve health. For example, parks can reduce the impacts of heat waves by providing shade and ameliorating the “heat island effect” experienced in urban settings where asphalt and other hard surfaces reflect and intensify the heat.4 Trees in parks, in particular, can mitigate urban heat islands directly by shading heat-absorbing surfaces.5 Further, parks can be designed in ways that increase sustainability by creating permeable surfaces that absorb rain water and replenish groundwater; capturing rain water through cisterns or rain barrels so water can be used for grounds maintenance; allowing for habitat restoration; and reducing storm water run-off.6, 7
Despite these abundant health and environmental benefits, Los Angeles County is relatively park poor compared to many other urban settings in the United States.8 Across the county, marked disparities have been reported in the amount of park space available for local residents.9 In addition, relatively little is known about the quality of facilities and availability of recreational programs in parks and how these may vary across cities and communities.
In 2015, the County of Los Angeles Department of Parks and Recreation initiated a countywide assessment of the need for parks and recreational facilities (Parks Needs Assessment) in both cities and unincorporated areas. The goal of the Parks Needs Assessment was to engage all communities within the county in a collaborative process to gather data and input for future decision-making on parks and recreation. The results of the assessment provide valuable information on existing park and recreation assets, and will help determine how to best improve and expand these assets and make them more accessible. The Parks Needs Assessment final report (May 2016) identifies, prioritizes, and provides estimated costs for potential park projects within each of the county’s study areas.
The County Department of Public Health has prepared this additional report to provide further information on the important relationships between parks and public health. The report provides data on selected health outcomes, demographic characteristics, and socioeconomic conditions in cities and communities across the county in relation to park space per capita. The report is intended as a complement to the Parks Needs Assessment Report. However, because different methodologies were used to calculate park space per capita, some results may not be directly comparable across the two reports.
Parks and Public Health in Los Angeles County: A Cities and Communities Report 5
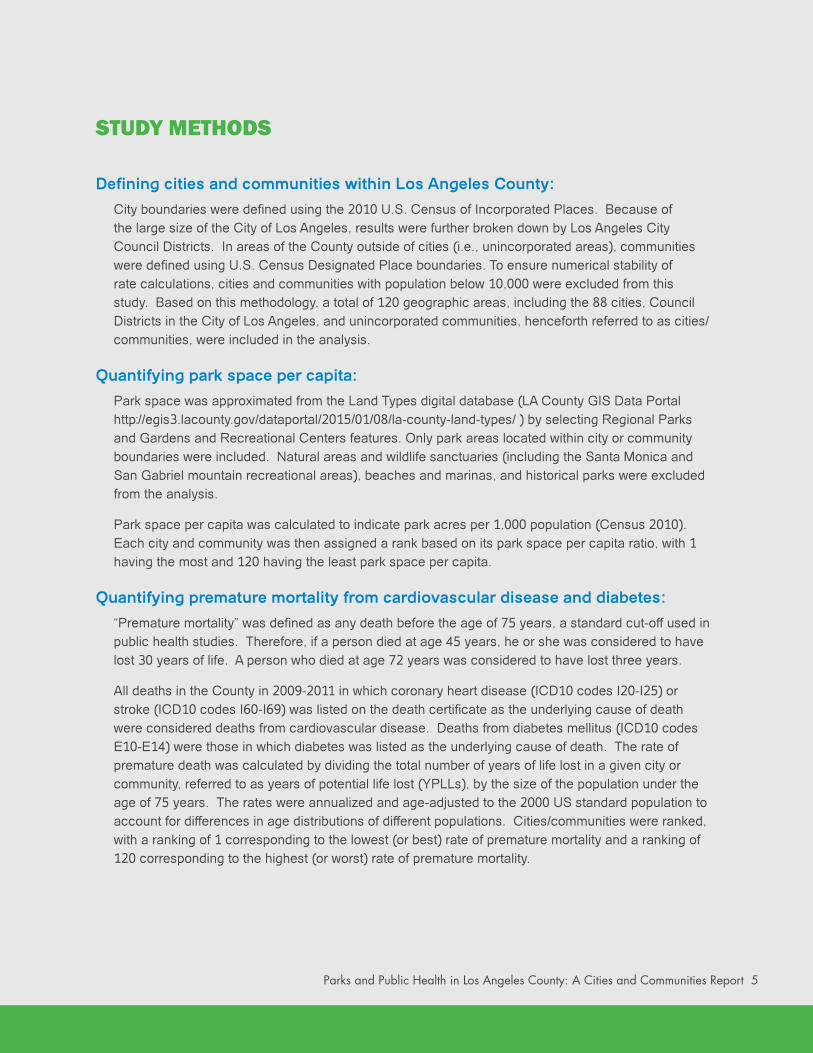
STUDY METHODS
Defining cities and communities within Los Angeles County:
City boundaries were defined using the 2010 U.S. Census of Incorporated Places. Because of the large size of the City of Los Angeles, results were further broken down by Los Angeles City Council Districts. In areas of the County outside of cities (i.e., unincorporated areas), communities were defined using U.S. Census Designated Place boundaries. To ensure numerical stability of rate calculations, cities and communities with population below 10,000 were excluded from this study. Based on this methodology, a total of 120 geographic areas, including the 88 cities, Council Districts in the City of Los Angeles, and unincorporated communities, henceforth referred to as cities/communities, were included in the analysis.
Quantifying park space per capita:
Park space was approximated from the Land Types digital database (LA County GIS Data Portal http://egis3.lacounty.gov/dataportal/2015/01/08/la-county-land-types/ ) by selecting Regional Parks and Gardens and Recreational Centers features. Only park areas located within city or community boundaries were included. Natural areas and wildlife sanctuaries (including the Santa Monica and San Gabriel mountain recreational areas), beaches and marinas, and historical parks were excluded from the analysis.
Park space per capita was calculated to indicate park acres per 1,000 population (Census 2010). Each city and community was then assigned a rank based on its park space per capita ratio, with 1 having the most and 120 having the least park space per capita.
Quantifying premature mortality from cardiovascular disease and diabetes:
“Premature mortality” was defined as any death before the age of 75 years, a standard cut-off used in public health studies. Therefore, if a person died at age 45 years, he or she was considered to have lost 30 years of life. A person who died at age 72 years was considered to have lost three years.
All deaths in the County in 2009-2011 in which coronary heart disease (ICD10 codes I20-I25) or stroke (ICD10 codes I60-I69) was listed on the death certificate as the underlying cause of death were considered deaths from cardiovascular disease. Deaths from diabetes mellitus (ICD10 codes E10-E14) were those in which diabetes was listed as the underlying cause of death. The rate of premature death was calculated by dividing the total number of years of life lost in a given city or community, referred to as years of potential life lost (YPLLs), by the size of the population under the age of 75 years. The rates were annualized and age-adjusted to the 2000 US standard population to account for differences in age distributions of different populations. Cities/communities were ranked, with a ranking of 1 corresponding to the lowest (or best) rate of premature mortality and a ranking of 120 corresponding to the highest (or worst) rate of premature mortality.
Parks and Public Health in Los Angeles County: A Cities and Communities Report 5

6 Los Angeles County Department of Public Health
Quantifying the prevalence of childhood obesity:
The prevalence of childhood obesity was estimated using 2009-2010 school year data from the California Physical Fitness Testing Program on measured height and weight in 5th graders attending public schools in Los Angeles County. This data was obtained from the California Department of Education, and the location of the public school where the child was in attendance was used to determine the prevalence of obesity for a city or community. Body mass index (BMI) was calculated from the height and weight measurements. Children were classified as obese if their BMI was at or above the 95th percentile for their gender and age using growth charts from the Centers for Disease Control and Prevention. In cities or communities with less than 50 students with BMI data, results on childhood obesity prevalence were not considered reliable and are therefore not presented. Cities/communities were ranked in the same manner as was done with premature mortality described above.
Quantifying community economic hardship:
Social and economic conditions in a community have been shown to be a powerful influence on health. Therefore, to assess this potential health vulnerability, a measure called the Economic Hardship Index was used for the analysis. The Index is scored by combining six indicators:
1) crowded housing, defined as the percent of occupied housing units with more than one person per room
2) percent of population living below the federal poverty level3) percent of persons over the age of 16 years that are unemployed4) percent of persons over the age of 25 years with less than a high school education5) dependency, defined as the percent of the population under 18 or over 64 years of age6) income per capita.
The Index score represents the average of the standardized ratios of all six component variables. Data for these indicators were obtained from the U.S. Census’ American Community Survey, 2008-2012 5-year estimates. Scores on the index can range from 1 to 100, with a higher index number representing a greater level of economic hardship. In the present analysis, scores for this compilation ranged from 13 to 83.
Estimating racial/ethnic variation in park space proximity:
Racial and ethnic groups display marked differences in life expectancy, disease burden, and health risks. To examine how racial/ethnic groups (White, African American, Asian, and Latino) may be disproportionately impacted by greater or lesser proximity to park space, cities/communities were aggregated into quartiles based on park space per capita (quartile 1 included cities/communities with the most park space per capita and quartile 4 included cities/communities with the least park space per capita). The percentage of each racial/ethnic population that resided in cities/communities within each quartile was then calculated and compared across racial/ethnic groups.
6 Los Angeles County Department of Public Health

Parks and Public Health in Los Angeles County: A Cities and Communities Report 7
RESULTS
A negative correlation was found between city/community economic hardship and park space per capita (i.e., as economic hardship increased, park space per capita decreased).11 The maps presented in Figure 1a and 1b provide a spatial representation of this correlation.
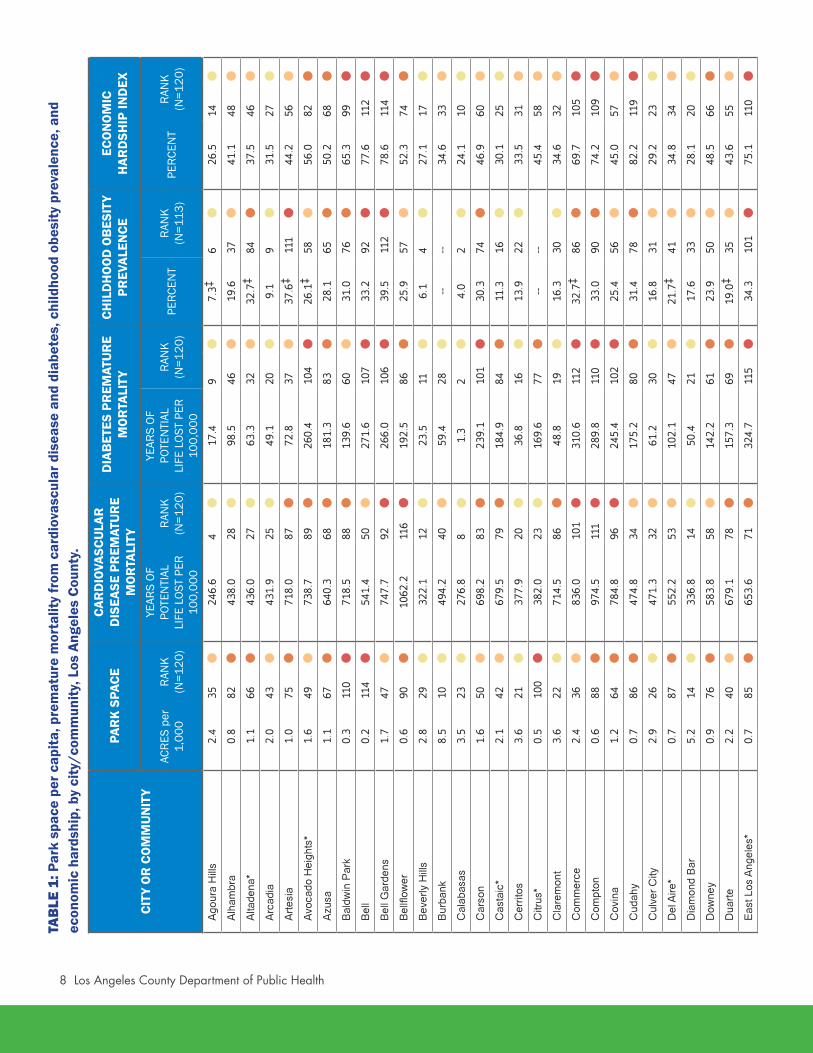
Rates of premature mortality from cardiovascular disease and diabetes and prevalence of childhood obesity were inversely related to park space per capita (i.e., as park space per capita decreased, premature mortality from cardiovascular disease and diabetes and prevalence of childhood obesity increased; Table 2). This relationship was most pronounced for diabetes premature mortality, with those living in cities/communities with the least park space per capita having nearly double the rate of premature mortality (189 years of potential life lost per 100,000 population) as those living in cities/communities with the most park space per capita (96 years of potential life lost per 100,000 population).
Park space per capita was also associated with race/ethnicity (Figure 2). African Americans
Park space per capita varied widely across the cities/communities, with San Dimas and Malibu having the most park space (56.0 and 55.5 acres per 1,000 population, respectively), and 17 cities/communities having less than 0.5 acres per 1,000 population (Table 1). Within the City of Los Angeles, Council Districts 11 and 4 had the most park space per capita (35.1 and 16.8 acres per 1,000, respectively), while Council Districts 5, 8, 9, 10, and 13 all had less than 1.0 acre per 1,000 population.
and Latinos were more likely to reside in cities/communities with less park space per capita (56% and 50%, respectively, resided in cities/communities in quartiles 3 and 4) compared to Whites and Asians (27% and 36%, respectively, resided in cities/communities in quartiles 3 and 4).
8 Los Angeles County Department of Public Health
TABL
E 1:
Par
k sp
ace
per c
apita
, pre
mat
ure
mor
talit
y fr
om c
ardi
ovas
cula
r dis
ease
and
dia
bete
s, c
hild
hood
obe
sity
pre
vale
nce,
and
ec
onom
ic h
ards
hip,
by
city
/com
mun
ity, L
os A
ngel
es C
ount
y.
CITY
OR
CO
MM
UN
ITY
PAR
K S
PACE
CAR
DIO
VASC
ULA
R
DIS
EASE
PR
EMAT
UR
E M
OR
TALI
TY
DIA
BET
ES P
REM
ATU
RE
MO
RTA
LITY
CHIL
DH
OO
D O
BES
ITY
PREV
ALEN
CEEC
ON
OM
IC
HAR
DSH
IP IN
DEX
ACRE
S pe
r 1,
000
RAN
K (N
=120
)
YEAR
S OF
PO
TEN
TIAL
LI
FE L
OST
PER
100,
000
RAN
K (N
=120
)
YEAR
S OF
PO
TEN
TIAL
LI
FE L
OST
PER
100,
000
RAN
K (N
=120
)PE
RCEN
TRA
NK
(N=1
13)
PERC
ENT
RAN
K (N
=120
)
Ago
ura
Hill
s2.
435
246.
64
17.4
97.
3‡6
26.5
14
Alh
ambr
a0.
882
438.
028
98.5
4619
.637
41.1
48
Alta
dena
* 1.
166
436.
027
63.3
3232
.7‡
8437
.546
Arc
adia
2.0
4343
1.9
2549
.120
9.1
931
.527
Art
esia
1.0
7571
8.0
8772
.837
37.6
‡11
144
.256
Avo
cado
Hei
ghts
*1.
649
738.
789
260.
410
426
.1‡
5856
.082
Azu
sa1.
167
640.
368
181.
383
28.1
6550
.268
Bal
dwin
Par
k0.
311
071
8.5
8813
9.6
6031
.076
65.3
99
Bel
l0.
211
454
1.4
5027
1.6
107
33.2
9277
.611
2
Bel
l Gar
dens
1.7
4774
7.7
9226
6.0
106
39.5
112
78.6
114
Bel
lflow
er0.
690
1062
.211
619
2.5
8625
.957
52.3
74
Bev
erly
Hill
s2.
829
322.
112
23.5
116.
14
27.1
17
Bur
bank
8.5
1049
4.2
4059
.428
----
34.6
33
Cal
abas
as3.
523
276.
88
1.3
24.
02
24.1
10
Car
son
1.6
5069
8.2
8323
9.1
101
30.3
7446
.960
Cas
taic
*2.
142
679.
579
184.
984
11.3
1630
.125
Cer
ritos
3.6
2137
7.9
2036
.816
13.9
2233
.531
Citr
us*
0.5
100
382.
023
169.
677
----
45.4
58
Cla
rem
ont
3.6
2271
4.5
8648
.819
16.3
3034
.632
Com
mer
ce2.
436
836.
010
131
0.6
112
32.7
‡86
69.7
105
Com
pton
0.6
8897
4.5
111
289.
811
033
.090
74.2
109
Cov
ina
1.2
6478
4.8
9624
5.4
102
25.4
5645
.057
Cud
ahy
0.7
8647
4.8
3417
5.2
8031
.478
82.2
119
Cul
ver
City
2.9
2647
1.3
3261
.230
16.8
3129
.223
Del
Aire
*0.
787
552.
253
102.
147
21.7
‡41
34.8
34
Dia
mon
d B
ar5.
214
336.
814
50.4
2117
.633
28.1
20
Dow
ney
0.9
7658
3.8
5814
2.2
6123
.950
48.5
66
Dua
rte
2.2
4067
9.1
7815
7.3
6919
.0‡
3543
.655
Eas
t Los
Ang
eles
*0.
785
653.
671
324.
711
534
.310
175
.111
0
Eas
t Ran
cho
Dom
ingu
ez*
0.4
108
993.
211
240
8.1
117
----
73.1
107
Eas
t San
Gab
riel*
011
943
3.7
2610
3.0
4911
.6‡
1832
.729
El M
onte
0.4
105
771.
694
171.
578
33.5
9667
.510
1
El S
egun
do2.
533
366.
919
5.0
414
.4‡
2423
.59
Flo
renc
e-G
raha
m*
1.1
7080
0.5
9815
7.9
7036
.110
578
.211
3
Gar
dena
0.9
7787
0.0
103
166.
176
28.0
6448
.064
Gle
ndal
e8.
87
488.
338
48.0
1825
.355
41.5
50
Gle
ndor
a1.
457
340.
215
116.
952
15.7
2835
.436
Hac
iend
a H
eigh
ts*
5.4
1328
7.4
912
7.4
5722
.444
36.3
38
Haw
aiia
n G
arde
ns0.
111
549
5.5
4143
6.6
119
27.4
‡63
61.5
92
Haw
thor
ne0.
410
277
3.7
9516
0.8
7331
.579
51.5
72
Her
mos
a B
each
2.4
3832
9.4
1377
.939
11.0
‡15
13.2
1
Hun
tingt
on P
ark
0.9
8054
6.3
5119
0.1
8531
.277
81.8
118
Ingl
ewoo
d0.
881
914.
810
617
2.9
7930
.172
55.2
80
La C
anad
a F
lintr
idge
7.4
1127
5.1
628
.913
8.8
821
.26
La C
resc
enta
-Mon
tros
e*0.
410
361
4.6
6118
.310
12.0
1929
.022
La M
irada
4.0
1862
5.4
6360
.929
23.1
4538
.847
La P
uent
e0.
694
513.
742
232.
298
28.4
6856
.183
La V
erne
2.9
2756
6.2
5516
0.0
7214
.525
35.4
35
Lake
Los
Ang
eles
*8.
88
1128
.111
821
2.9
91--
--63
.198
Lake
woo
d2.
339
645.
870
126.
056
23.4
4736
.841
Lanc
aste
r1.
555
966.
711
028
9.7
109
25.1
5350
.570
Law
ndal
e0.
410
952
8.0
4620
6.7
9026
.861
55.1
79
Lenn
ox*
0.2
113
663.
273
180.
282
----
76.1
111
Lom
ita0.
597
558.
654
96.9
4530
.475
36.5
40
Long
Bea
ch2.
830
937.
410
915
5.7
6526
.459
50.1
67
Los
Ang
eles
City
, All
Dis
tric
ts
LAC
D 1
2.9
2564
0.2
6615
1.3
6233
.088
72.5
106
LAC
D 2
1.5
5266
5.2
7410
2.8
4834
.310
047
.561
LAC
D 3
2.5
3453
1.4
4784
.943
23.7
4843
.454
LAC
D 4
16.8
447
3.0
3366
.734
22.2
4327
.719
* in
dica
tes
unin
corp
orat
ed c
ity a
s de
fined
by
the
US
Cen
sus
Des
igna
ted
Pla
ce b
ound
arie
s
-- in
dica
tes
the
data
wer
e no
t ava
ilabl
e, o
r re
sults
wer
e su
ppre
ssed
due
to n
umbe
r of
stu
dent
s w
ith B
MI-
rela
ted
info
rmat
ion
bein
g <5
0‡
Est
imat
e m
ay b
e un
stab
le a
nd s
houl
d be
inte
rpre
ted
with
cau
tion
due
to s
mal
l num
ber
of s
tude
nts
with
BM
I-re
late
d
info
rmat
ion
in th
is s
trat
um.
NO
TE
: YP
LL-7
5 ra
tes
are
deriv
ed fr
om m
ulti-
year
200
9-20
11 d
eath
dat
a, a
nd 2
010
popu
latio
n es
timat
es.
1s
t qua
rtile
(ra
nk 1
-30)
2
nd q
uart
ile (
rank
31-
60)
3rd
qua
rtile
(ra
nk 6
1-90
)
4th
quar
tile
(ran
k 91
-120
)

Parks and Public Health in Los Angeles County: A Cities and Communities Report 9
CITY
OR
CO
MM
UN
ITY
PAR
K S
PACE
CAR
DIO
VASC
ULA
R
DIS
EASE
PR
EMAT
UR
E M
OR
TALI
TY
DIA
BET
ES P
REM
ATU
RE
MO
RTA
LITY
CHIL
DH
OO
D O
BES
ITY
PREV
ALEN
CEEC
ON
OM
IC
HAR
DSH
IP IN
DEX
ACRE
S pe
r 1,
000
RAN
K (N
=120
)
YEAR
S OF
PO
TEN
TIAL
LI
FE L
OST
PER
100,
000
RAN
K (N
=120
)
YEAR
S OF
PO
TEN
TIAL
LI
FE L
OST
PER
100,
000
RAN
K (N
=120
)PE
RCEN
TRA
NK
(N=1
13)
PERC
ENT
RAN
K (N
=120
)
Ago
ura
Hill
s2.
435
246.
64
17.4
97.
3‡6
26.5
14
Alh
ambr
a0.
882
438.
028
98.5
4619
.637
41.1
48
Alta
dena
* 1.
166
436.
027
63.3
3232
.7‡
8437
.546
Arc
adia
2.0
4343
1.9
2549
.120
9.1
931
.527
Art
esia
1.0
7571
8.0
8772
.837
37.6
‡11
144
.256
Avo
cado
Hei
ghts
*1.
649
738.
789
260.
410
426
.1‡
5856
.082
Azu
sa1.
167
640.
368
181.
383
28.1
6550
.268
Bal
dwin
Par
k0.
311
071
8.5
8813
9.6
6031
.076
65.3
99
Bel
l0.
211
454
1.4
5027
1.6
107
33.2
9277
.611
2
Bel
l Gar
dens
1.7
4774
7.7
9226
6.0
106
39.5
112
78.6
114
Bel
lflow
er0.
690
1062
.211
619
2.5
8625
.957
52.3
74
Bev
erly
Hill
s2.
829
322.
112
23.5
116.
14
27.1
17
Bur
bank
8.5
1049
4.2
4059
.428
----
34.6
33
Cal
abas
as3.
523
276.
88
1.3
24.
02
24.1
10
Car
son
1.6
5069
8.2
8323
9.1
101
30.3
7446
.960
Cas
taic
*2.
142
679.
579
184.
984
11.3
1630
.125
Cer
ritos
3.6
2137
7.9
2036
.816
13.9
2233
.531
Citr
us*
0.5
100
382.
023
169.
677
----
45.4
58
Cla
rem
ont
3.6
2271
4.5
8648
.819
16.3
3034
.632
Com
mer
ce2.
436
836.
010
131
0.6
112
32.7
‡86
69.7
105
Com
pton
0.6
8897
4.5
111
289.
811
033
.090
74.2
109
Cov
ina
1.2
6478
4.8
9624
5.4
102
25.4
5645
.057
Cud
ahy
0.7
8647
4.8
3417
5.2
8031
.478
82.2
119
Cul
ver
City
2.9
2647
1.3
3261
.230
16.8
3129
.223
Del
Aire
*0.
787
552.
253
102.
147
21.7
‡41
34.8
34
Dia
mon
d B
ar5.
214
336.
814
50.4
2117
.633
28.1
20
Dow
ney
0.9
7658
3.8
5814
2.2
6123
.950
48.5
66
Dua
rte
2.2
4067
9.1
7815
7.3
6919
.0‡
3543
.655
Eas
t Los
Ang
eles
*0.
785
653.
671
324.
711
534
.310
175
.111
0
Eas
t Ran
cho
Dom
ingu
ez*
0.4
108
993.
211
240
8.1
117
----
73.1
107
Eas
t San
Gab
riel*
011
943
3.7
2610
3.0
4911
.6‡
1832
.729
El M
onte
0.4
105
771.
694
171.
578
33.5
9667
.510
1
El S
egun
do2.
533
366.
919
5.0
414
.4‡
2423
.59
Flo
renc
e-G
raha
m*
1.1
7080
0.5
9815
7.9
7036
.110
578
.211
3
Gar
dena
0.9
7787
0.0
103
166.
176
28.0
6448
.064
Gle
ndal
e8.
87
488.
338
48.0
1825
.355
41.5
50
Gle
ndor
a1.
457
340.
215
116.
952
15.7
2835
.436
Hac
iend
a H
eigh
ts*
5.4
1328
7.4
912
7.4
5722
.444
36.3
38
Haw
aiia
n G
arde
ns0.
111
549
5.5
4143
6.6
119
27.4
‡63
61.5
92
Haw
thor
ne0.
410
277
3.7
9516
0.8
7331
.579
51.5
72
Her
mos
a B
each
2.4
3832
9.4
1377
.939
11.0
‡15
13.2
1
Hun
tingt
on P
ark
0.9
8054
6.3
5119
0.1
8531
.277
81.8
118
Ingl
ewoo
d0.
881
914.
810
617
2.9
7930
.172
55.2
80
La C
anad
a F
lintr
idge
7.4
1127
5.1
628
.913
8.8
821
.26
La C
resc
enta
-Mon
tros
e*0.
410
361
4.6
6118
.310
12.0
1929
.022
La M
irada
4.0
1862
5.4
6360
.929
23.1
4538
.847
La P
uent
e0.
694
513.
742
232.
298
28.4
6856
.183
La V
erne
2.9
2756
6.2
5516
0.0
7214
.525
35.4
35
Lake
Los
Ang
eles
*8.
88
1128
.111
821
2.9
91--
--63
.198
Lake
woo
d2.
339
645.
870
126.
056
23.4
4736
.841
Lanc
aste
r1.
555
966.
711
028
9.7
109
25.1
5350
.570
Law
ndal
e0.
410
952
8.0
4620
6.7
9026
.861
55.1
79
Lenn
ox*
0.2
113
663.
273
180.
282
----
76.1
111
Lom
ita0.
597
558.
654
96.9
4530
.475
36.5
40
Long
Bea
ch2.
830
937.
410
915
5.7
6526
.459
50.1
67
Los
Ang
eles
City
, All
Dis
tric
ts
LAC
D 1
2.9
2564
0.2
6615
1.3
6233
.088
72.5
106
LAC
D 2
1.5
5266
5.2
7410
2.8
4834
.310
047
.561
LAC
D 3
2.5
3453
1.4
4784
.943
23.7
4843
.454
LAC
D 4
16.8
447
3.0
3366
.734
22.2
4327
.719
* in
dica
tes
unin
corp
orat
ed c
ity a
s de
fined
by
the
US
Cen
sus
Des
igna
ted
Pla
ce b
ound
arie
s
-- in
dica
tes
the
data
wer
e no
t ava
ilabl
e, o
r re
sults
wer
e su
ppre
ssed
due
to n
umbe
r of
stu
dent
s w
ith B
MI-
rela
ted
info
rmat
ion
bein
g <5
0‡
Est
imat
e m
ay b
e un
stab
le a
nd s
houl
d be
inte
rpre
ted
with
cau
tion
due
to s
mal
l num
ber
of s
tude
nts
with
BM
I-re
late
d
info
rmat
ion
in th
is s
trat
um.
NO
TE
: YP
LL-7
5 ra
tes
are
deriv
ed fr
om m
ulti-
year
200
9-20
11 d
eath
dat
a, a
nd 2
010
popu
latio
n es
timat
es.
1s
t qua
rtile
(ra
nk 1
-30)
2
nd q
uart
ile (
rank
31-
60)
3rd
qua
rtile
(ra
nk 6
1-90
)
4th
quar
tile
(ran
k 91
-120
)

10 Los Angeles County Department of Public Health
TABL
E 1:
Par
k sp
ace
per c
apita
, pre
mat
ure
mor
talit
y fr
om c
ardi
ovas
cula
r dis
ease
and
dia
bete
s, c
hild
hood
obe
sity
pre
vale
nce,
and
ec
onom
ic h
ards
hip,
by
city
/com
mun
ity, L
os A
ngel
es C
ount
y.
CITY
OR
CO
MM
UN
ITY
PAR
K S
PACE
CAR
DIO
VASC
ULA
R
DIS
EASE
PR
EMAT
UR
E M
OR
TALI
TY
DIA
BET
ES P
REM
ATU
RE
MO
RTA
LITY
CHIL
DH
OO
D O
BES
ITY
PREV
ALEN
CEEC
ON
OM
IC
HAR
DSH
IP IN
DEX
ACRE
S pe
r 1,
000
RAN
K (N
=120
)
YEAR
S OF
PO
TEN
TIAL
LI
FE L
OST
PER
100,
000
RAN
K (N
=120
)
YEAR
S OF
PO
TEN
TIAL
LI
FE L
OST
PER
100,
000
RAN
K (N
=120
)PE
RCEN
TRA
NK
(N=1
13)
PERC
ENT
RAN
K (N
=120
)
LAC
D 5
0.6
9334
1.0
1651
.324
12.5
2026
.716
LAC
D 6
1.9
4583
5.2
100
123.
755
34.4
102
62.6
95
LAC
D 7
2.9
2467
2.2
7515
1.5
6332
.582
56.1
84
LAC
D 8
0.5
9611
99.1
119
318.
111
435
.510
467
.310
0
LAC
D 9
0.4
107
1027
.311
423
5.7
9933
.393
82.9
120
LAC
D 1
00.
689
893.
310
415
7.2
6832
.481
58.1
88
LAC
D 1
135
.13
379.
522
54.3
2719
.938
25.8
11
LAC
D 1
22.
632
551.
152
109.
950
23.2
4636
.539
LAC
D 1
30.
978
740.
290
153.
664
34.2
9957
.186
LAC
D 1
41.
168
787.
097
216.
193
33.4
9561
.191
LAC
D 1
52.
437
841.
310
217
9.4
8132
.683
61.6
94
Lynw
ood
0.6
9191
9.6
107
165.
574
----
73.9
108
Mal
ibu
55.5
235
4.7
180
18.
3‡7
20.5
4
Man
hatta
n B
each
2.1
4129
1.6
102.
63
2.9
115
.92
May
woo
d0.
311
249
1.3
3933
4.1
116
33.3
9479
.311
6
Mon
rovi
a1.
072
644.
669
95.6
4424
.952
35.5
37
Mon
tebe
llo1.
358
640.
267
197.
487
29.2
6952
.273
Mon
tere
y P
ark
1.5
5444
4.3
2962
.131
14.8
2748
.465
Nor
wal
k0.
979
750.
393
165.
875
29.3
7054
.177
Pal
mda
le1.
748
694.
881
236.
210
024
.451
56.9
85
Pal
os V
erde
s E
stat
es0.
111
714
6.7
111
.87
5.5
318
.33
Par
amou
nt1.
074
805.
599
301.
011
131
.880
68.5
103
Pas
aden
a2.
828
567.
456
51.3
2528
.466
37.2
44
Pic
o R
iver
a1.
360
620.
962
112.
651
29.4
7154
.076
Pom
ona
1.5
5390
2.4
105
159.
271
32.8
8761
.693
Qua
rtz
Hill
*1.
363
1062
.711
722
8.7
969.
6‡10
47.6
62
Ran
cho
Pal
os V
erde
s10
.05
295.
311
10.8
611
.617
26.3
13
Red
ondo
Bea
ch1.
362
483.
437
46.3
1716
.029
21.7
7
Ros
emea
d1.
169
569.
557
33.8
1521
.139
57.4
87
Row
land
Hei
ghts
*9.
56
350.
517
79.8
4121
.240
37.4
45
San
Dim
as56
.01
694.
780
50.9
2319
.636
32.0
28
San
Fer
nand
o1.
071
527.
145
131.
258
36.9
109
62.7
97
San
Gab
riel
0.4
106
635.
165
79.8
4017
.432
42.5
53
San
Mar
ino
2.0
4426
1.3
59.
35
6.6‡
521
.05
San
ta C
larit
a4.
416
480.
936
53.5
2614
.223
37.1
43
San
ta F
e S
prin
gs4.
217
743.
291
213.
392
33.9
9754
.178
San
ta M
onic
a1.
361
515.
043
84.6
429.
811
25.9
12
Sie
rra
Mad
re3.
919
193.
72
28.1
1213
.1‡
2130
.526
Sig
nal H
ill4.
515
936.
310
80
123
.9‡
4941
.249
Sou
th E
l Mon
te1.
165
625.
664
318.
111
333
.998
62.7
96
Sou
th G
ate
1.3
5967
5.5
7715
5.7
6636
.510
769
.010
4
Sou
th P
asad
ena
1.6
5145
0.3
3013
.08
10.7
1326
.615
Sou
th S
an J
ose
Hill
s*0.
311
171
4.1
8512
3.1
5326
.860
59.8
90
Sou
th W
hitti
er*
0.6
9565
7.9
7219
8.0
8933
.191
51.2
71
Ste
vens
on R
anch
*2.
631
201.
43
31.1
1410
.112
28.4
21
Sun
Vill
age*
0.8
8310
33.9
115
280.
010
825
.2‡
5455
.481
Tem
ple
City
0.5
9837
8.0
2168
.735
19.0
3436
.942
Torr
ance
1.9
4647
6.4
3576
.938
10.9
1432
.930
Val
inda
*0.
410
459
7.2
6069
.136
37.5
110
52.8
75
Vie
w P
ark-
Win
dsor
Hill
s*8.
79
536.
648
197.
988
21.8
4229
.924
Vin
cent
*0.
692
526.
644
64.5
3336
.9‡
108
47.7
63
Wal
nut
7.0
1227
5.4
750
.622
14.6
2627
.718
Wal
nut P
ark*
0.1
116
420.
724
247.
710
335
.0‡
103
79.2
115
Wes
t Car
son*
011
954
0.1
4915
5.8
6741
.4‡
113
42.1
52
Wes
t Cov
ina
1.4
5670
9.4
8422
6.9
9427
.062
45.5
59
Wes
t Hol
lyw
ood
0.5
9945
1.7
3113
1.6
59--
--22
.28
Wes
t Pue
nte
Val
ley*
0.7
8469
6.2
8223
0.0
9730
.273
58.4
89
Wes
t Whi
ttier
-Los
Nie
tos*
0.5
101
591.
859
227.
895
36.2
106
50.5
69
Wes
tmon
t*0.
111
813
68.1
120
417.
611
833
.089
68.2
102
Whi
ttier
1.0
7367
4.5
7612
3.5
5428
.467
41.6
51
Will
owbr
ook*
3.9
2010
22.7
113
265.
110
532
.785
81.6
117
* in
dica
tes
unin
corp
orat
ed c
ity a
s de
fined
by
the
US
Cen
sus
Des
igna
ted
Pla
ce b
ound
arie
s
-- in
dica
tes
the
data
wer
e no
t ava
ilabl
e, o
r re
sults
wer
e su
ppre
ssed
due
to n
umbe
r of
stu
dent
s w
ith B
MI-
rela
ted
info
rmat
ion
bein
g <5
0‡
Est
imat
e m
ay b
e un
stab
le a
nd s
houl
d be
inte
rpre
ted
with
cau
tion
due
to s
mal
l num
ber
of s
tude
nts
with
BM
I-re
late
d
info
rmat
ion
in th
is s
trat
um.
NO
TE
: YP
LL-7
5 ra
tes
are
deriv
ed fr
om m
ulti-
year
200
9-20
11 d
eath
dat
a, a
nd 2
010
popu
latio
n es
timat
es.
1s
t qua
rtile
(ra
nk 1
-30)
2
nd q
uart
ile (
rank
31-
60)
3rd
qua
rtile
(ra
nk 6
1-90
)
4th
quar
tile
(ran
k 91
-120
)

Parks and Public Health in Los Angeles County: A Cities and Communities Report 11
CITY
OR
CO
MM
UN
ITY
PAR
K S
PACE
CAR
DIO
VASC
ULA
R
DIS
EASE
PR
EMAT
UR
E M
OR
TALI
TY
DIA
BET
ES P
REM
ATU
RE
MO
RTA
LITY
CHIL
DH
OO
D O
BES
ITY
PREV
ALEN
CEEC
ON
OM
IC
HAR
DSH
IP IN
DEX
ACRE
S pe
r 1,
000
RAN
K (N
=120
)
YEAR
S OF
PO
TEN
TIAL
LI
FE L
OST
PER
100,
000
RAN
K (N
=120
)
YEAR
S OF
PO
TEN
TIAL
LI
FE L
OST
PER
100,
000
RAN
K (N
=120
)PE
RCEN
TRA
NK
(N=1
13)
PERC
ENT
RAN
K (N
=120
)
LAC
D 5
0.6
9334
1.0
1651
.324
12.5
2026
.716
LAC
D 6
1.9
4583
5.2
100
123.
755
34.4
102
62.6
95
LAC
D 7
2.9
2467
2.2
7515
1.5
6332
.582
56.1
84
LAC
D 8
0.5
9611
99.1
119
318.
111
435
.510
467
.310
0
LAC
D 9
0.4
107
1027
.311
423
5.7
9933
.393
82.9
120
LAC
D 1
00.
689
893.
310
415
7.2
6832
.481
58.1
88
LAC
D 1
135
.13
379.
522
54.3
2719
.938
25.8
11
LAC
D 1
22.
632
551.
152
109.
950
23.2
4636
.539
LAC
D 1
30.
978
740.
290
153.
664
34.2
9957
.186
LAC
D 1
41.
168
787.
097
216.
193
33.4
9561
.191
LAC
D 1
52.
437
841.
310
217
9.4
8132
.683
61.6
94
Lynw
ood
0.6
9191
9.6
107
165.
574
----
73.9
108
Mal
ibu
55.5
235
4.7
180
18.
3‡7
20.5
4
Man
hatta
n B
each
2.1
4129
1.6
102.
63
2.9
115
.92
May
woo
d0.
311
249
1.3
3933
4.1
116
33.3
9479
.311
6
Mon
rovi
a1.
072
644.
669
95.6
4424
.952
35.5
37
Mon
tebe
llo1.
358
640.
267
197.
487
29.2
6952
.273
Mon
tere
y P
ark
1.5
5444
4.3
2962
.131
14.8
2748
.465
Nor
wal
k0.
979
750.
393
165.
875
29.3
7054
.177
Pal
mda
le1.
748
694.
881
236.
210
024
.451
56.9
85
Pal
os V
erde
s E
stat
es0.
111
714
6.7
111
.87
5.5
318
.33
Par
amou
nt1.
074
805.
599
301.
011
131
.880
68.5
103
Pas
aden
a2.
828
567.
456
51.3
2528
.466
37.2
44
Pic
o R
iver
a1.
360
620.
962
112.
651
29.4
7154
.076
Pom
ona
1.5
5390
2.4
105
159.
271
32.8
8761
.693
Qua
rtz
Hill
*1.
363
1062
.711
722
8.7
969.
6‡10
47.6
62
Ran
cho
Pal
os V
erde
s10
.05
295.
311
10.8
611
.617
26.3
13
Red
ondo
Bea
ch1.
362
483.
437
46.3
1716
.029
21.7
7
Ros
emea
d1.
169
569.
557
33.8
1521
.139
57.4
87
Row
land
Hei
ghts
*9.
56
350.
517
79.8
4121
.240
37.4
45
San
Dim
as56
.01
694.
780
50.9
2319
.636
32.0
28
San
Fer
nand
o1.
071
527.
145
131.
258
36.9
109
62.7
97
San
Gab
riel
0.4
106
635.
165
79.8
4017
.432
42.5
53
San
Mar
ino
2.0
4426
1.3
59.
35
6.6‡
521
.05
San
ta C
larit
a4.
416
480.
936
53.5
2614
.223
37.1
43
San
ta F
e S
prin
gs4.
217
743.
291
213.
392
33.9
9754
.178
San
ta M
onic
a1.
361
515.
043
84.6
429.
811
25.9
12
Sie
rra
Mad
re3.
919
193.
72
28.1
1213
.1‡
2130
.526
Sig
nal H
ill4.
515
936.
310
80
123
.9‡
4941
.249
Sou
th E
l Mon
te1.
165
625.
664
318.
111
333
.998
62.7
96
Sou
th G
ate
1.3
5967
5.5
7715
5.7
6636
.510
769
.010
4
Sou
th P
asad
ena
1.6
5145
0.3
3013
.08
10.7
1326
.615
Sou
th S
an J
ose
Hill
s*0.
311
171
4.1
8512
3.1
5326
.860
59.8
90
Sou
th W
hitti
er*
0.6
9565
7.9
7219
8.0
8933
.191
51.2
71
Ste
vens
on R
anch
*2.
631
201.
43
31.1
1410
.112
28.4
21
Sun
Vill
age*
0.8
8310
33.9
115
280.
010
825
.2‡
5455
.481
Tem
ple
City
0.5
9837
8.0
2168
.735
19.0
3436
.942
Torr
ance
1.9
4647
6.4
3576
.938
10.9
1432
.930
Val
inda
*0.
410
459
7.2
6069
.136
37.5
110
52.8
75
Vie
w P
ark-
Win
dsor
Hill
s*8.
79
536.
648
197.
988
21.8
4229
.924
Vin
cent
*0.
692
526.
644
64.5
3336
.9‡
108
47.7
63
Wal
nut
7.0
1227
5.4
750
.622
14.6
2627
.718
Wal
nut P
ark*
0.1
116
420.
724
247.
710
335
.0‡
103
79.2
115
Wes
t Car
son*
011
954
0.1
4915
5.8
6741
.4‡
113
42.1
52
Wes
t Cov
ina
1.4
5670
9.4
8422
6.9
9427
.062
45.5
59
Wes
t Hol
lyw
ood
0.5
9945
1.7
3113
1.6
59--
--22
.28
Wes
t Pue
nte
Val
ley*
0.7
8469
6.2
8223
0.0
9730
.273
58.4
89
Wes
t Whi
ttier
-Los
Nie
tos*
0.5
101
591.
859
227.
895
36.2
106
50.5
69
Wes
tmon
t*0.
111
813
68.1
120
417.
611
833
.089
68.2
102
Whi
ttier
1.0
7367
4.5
7612
3.5
5428
.467
41.6
51
Will
owbr
ook*
3.9
2010
22.7
113
265.
110
532
.785
81.6
117
* in
dica
tes
unin
corp
orat
ed c
ity a
s de
fined
by
the
US
Cen
sus
Des
igna
ted
Pla
ce b
ound
arie
s
-- in
dica
tes
the
data
wer
e no
t ava
ilabl
e, o
r re
sults
wer
e su
ppre
ssed
due
to n
umbe
r of
stu
dent
s w
ith B
MI-
rela
ted
info
rmat
ion
bein
g <5
0‡
Est
imat
e m
ay b
e un
stab
le a
nd s
houl
d be
inte
rpre
ted
with
cau
tion
due
to s
mal
l num
ber
of s
tude
nts
with
BM
I-re
late
d
info
rmat
ion
in th
is s
trat
um.
NO
TE
: YP
LL-7
5 ra
tes
are
deriv
ed fr
om m
ulti-
year
200
9-20
11 d
eath
dat
a, a
nd 2
010
popu
latio
n es
timat
es.
1s
t qua
rtile
(ra
nk 1
-30)
2
nd q
uart
ile (
rank
31-
60)
3rd
qua
rtile
(ra
nk 6
1-90
)
4th
quar
tile
(ran
k 91
-120
)

12 Los Angeles County Department of Public Health
FIGURE 1A. Map of park space* per capita by city and community, Los Angeles County.

Parks and Public Health in Los Angeles County: A Cities and Communities Report 13
FIGURE 1B. Map of economic hardship index* by city and community, Los Angeles County.

14 Los Angeles County Department of Public Health
Cities/Communities with Most Park Space
Cities/Communities with Least Park Space
Whites
Asians
LatinosAfrican
Americans
Whites
Asians
LatinosAfrican
Americans
12%
14%
21%
26%
30%
23%
21%
29%
29%
21%
22%
30%
34%
15%
32%
41%
Group1
Group2
Group3
Group4
FIGURE 2: Race/ethnicity and park space per capita
* Cities/communities were divided into four groups (also referred to as quartiles) based on the amount of park space per capita. Group 1 included cities/communities with the most park space per capita, and group 4 included cities/communities with the least park space per capita.
PARK AREA PER CAPITA (QUARTILES)
CARDIOVASCULAR DISEASE PREMATURE MORTALITY
(YPLLs* PER 100,000)
DIABETES PREMATURE MORTALITY
(YPLLs* PER 100,000)
CHILDHOOD OBESITY PREVALENCE
(Most Park Space per Capita) Quartile 1
588 96 24%
Quartile 2 667 144 26%
Quartile 3 735 174 30%
Quartile 4 (Least Park Space per Capita)
752 189 31%
TABLE 2: Rates of premature mortality from cardiovascular disease and diabetes and prevalence of childhood obesity, by park area per capita, Los Angeles County.
*YPLLs - Years of Potential Life Lost
Group 1
Group 2
Group 3
Group 4
Cities/Communities with Most Park Space*
Cities/Communities with Least Park Space*
56% of African Americans and 50% of Latinos reside in cities/
communities with less park space per capita (in groups 3 and 4)
compared to 27% of Whites and 30% of Asians (in groups 3 and 4).

Parks and Public Health in Los Angeles County: A Cities and Communities Report 15
DISCUSSION
Recent studies indicate that access to parks and recreational resources is more limited in poor and minority communities, and have highlighted park disparities by class, race, and ethnicity.9,12 Our study findings are consistent with this literature. We found large disparities in park space per capita across cities and communities in Los Angeles County. Cities and communities with less park space are in many cases further disadvantaged by high levels of economic hardship and high rates of childhood obesity and premature mortality from cardiovascular disease and diabetes.
Further, a disproportionately high percentage of African Americans and Latinos live in cities and communities with less park space per capita.
These findings have significant public health implications given the high rates of chronic disease in low income communities and communities of color. Increasing levels of physical activity is an important public health strategy for preventing and managing chronic conditions. Hence, prioritization of park space that provides additional opportunities for physical activity in these communities would address a critical public health need. Expansion of parks in these cities and communities in coordination with other health promotion and disease prevention efforts could help improve the health of these populations and help reduce health inequities. In addition, given the contribution of parks programming in reducing violent crime in communities around parks, expansion of parks programming could also help reduce violence-related trauma.
This study has the following limitations. First, the analysis did not include the quality of existing park space or the availability of associated programming. These factors are clearly important in considering park equity and the potential for parks to improve the public’s health. Second, indicators of community safety or measures of public perceptions of community safety were not assessed in the study. Safety is a major factor influencing the likelihood that parks will be accessible and utilized by those in the community. Third, the study did not measure

16 Los Angeles County Department of Public Health
distances from individual residences to park space but, rather, used park area per capita at the city/community level as a proxy for park proximity.
Lastly, the study was ecologic and cross-sectional in design and, therefore, the associations found between park space per capita and the health conditions included in the study should not be viewed as evidence that limited park space caused these conditions. Rather, these findings may reflect a constellation of conditions in these communities that give rise to health inequities.
16 Los Angeles County Department of Public Health
RECOMMENDATIONS
For this reason, some cities and communities were found to have inconsistent results for park space per capita and the health conditions (e.g., some cities/communities had relatively large amounts of park space per capita but nonetheless had high rates of childhood obesity and premature mortality from cardiovascular disease and diabetes).
These limitations notwithstanding, the study highlights the presence of large inequities in park space across cities and unincorporated communities in Los Angeles County. The findings further underscore the importance of considering these inequities, as well as the burden of chronic disease, local economic conditions, and racial/ethnic population mix in prioritizing future park development and recreational programming.
Prioritize parks resources in the highest need areas
Differences in park distribution are driven, in part, by limited resources for parks in many municipal budgets as well as a dearth of state and federal funding sources for municipal park infrastructure, operations and maintenance, including programming. For example, a 2010 study in the Los Angeles region found that the poorest, most densely populated cities allocated the lowest levels of parks and recreation funding in the region, highlighting the importance of identifying additional funding for these cities.13 To address inequities, parks funding allocated via grant applications could forego requirements for matching funds from low income communities and technical assistance could be provided to increase the likelihood of success.
16 Los Angeles County Department of Public Health

Parks and Public Health in Los Angeles County: A Cities and Communities Report 17
Provide recreational programming and include only healthy food and beverages at local parks
The presence of recreational programming has been shown to greatly increase the numbers of persons engaging in moderate to vigorous physical activity in parks and other recreational settings.14 In addition, by activating outdoor spaces via walking clubs, soccer games, youth sports, and other organized activities, programming can help parks feel safer in communities where the
Parks and Public Health in Los Angeles County: A Cities and Communities Report 17
presence of violence and crime are a deterrent to recreational activity. Programming can therefore increase social cohesion as well as increase physical activity. In parks that have vending machines or snack shops, or serve food as part of their programming, provision of foods and beverages meeting specified nutrition standards can help promote healthy diets.15
Design parks for safety
The design of parks and recreation facilities can have a direct impact on people’s perceptions of safety and their willingness to use a space. Park design should take advantage of opportunities for informal surveillance by people in the area and should reduce the number of isolated places where crime can take place unseen. For example, activity areas can be clustered together with clear sightlines between areas and with washrooms located nearby. The layout of the park should be easily understood, with
entrances and exits clearly marked and pathways well connected to destinations. Lighting should help direct pedestrian movement along well-illuminated and frequently-used routes at night. The park perimeter should be inviting so that people can observe pleasing activities visible from the street and are encouraged to enter. Vegetation should be selected so as to not block sightlines once mature.

18 Los Angeles County Department of Public Health
Provide safe bike and pedestrian access to and between parks
Parks and the streets around them should be designed to encourage easy and comfortable access for all types of users, including those without a car. Bike and pedestrian paths within the park should connect and integrate with public transit stations and the transportation patterns of the surrounding community to encourage maximum use. Primary access routes should be clearly identifiable from the street. Access routes should follow “desire lines,” e.g., easy and safe bike and pedestrian access where people want to walk and bike. If possible, the park should function as a shortcut between major destination points to increase visible activity and informal surveillance.
Design parks to increase sustainability
When designing new parks or retrofitting existing parks, every opportunity should be taken to integrate multiple benefits associated with green infrastructure. For example, parks should be designed in ways that increase sustainability by creating permeable surfaces that replenish groundwater sources and reduce storm water run-off or capture rainfall to be used for maintenance. Park design should also reduce greenhouse gas emissions; increase carbon sequestration; reduce the heat island effect; protect habitat and biodiversity; and promote urban agriculture.
Use best-practice mitigation for parks in proximity to freeways and high-volume roadways
Placing parks and active recreational facilities near freeways and high volume roadways may increase health risks associated with exposure to traffic-related pollution. However, there are also substantial health benefits associated with the physical activity that can be undertaken in parks. To address exposure concerns, new parks with playgrounds, athletic fields, courts, and other outdoor facilities designed for moderate to vigorous physical activity, should be sited as far as possible from freeways and high-traffic roads. Parks within 1,500 feet of freeways should adhere to best-practice mitigation measures that minimize exposure to air pollution. These include placing playgrounds, athletic fields, and other outdoor active recreation venues as far as possible from traffic, and planting trees and other vegetation between these venues and traffic sources.
18 Los Angeles County Department of Public Health

Parks and Public Health in Los Angeles County: A Cities and Communities Report 19
REFERENCES
1. Cohen D, et al. Contribution of public parks to physical activity. Am J Public Health 2007;97:509-514.
2. Wolch J, et al. Childhood obesity and proximity to urban parks and recreational resources: A longitudinal cohort
study. Health and Place 2010;16(3):137-57.
3. Los Angeles County Department of Public Health. The potential costs and health benefits of Parks After Dark: rapid
health impact assessment (executive summary). September, 2014 (available at: http://publichealth.lacounty.gov/pa/
reports/PAD_Policy_Brief.pdf).
4. American Planning Association. How cities use parks for climate change management (executive summary). 2007
(available at: https://www.planning.org/cityparks/briefingpapers/pdf/climatechangemanagement.pdf).
5. McPherson, EG. Cooling urban heat islands with sustainable landscapes. In: Platt, Rutherford H.; Rowntree, Rowan
A.; Muick, Pamela C.; eds. The ecological city: preserving and restoring urban biodiversity. Amherst, MA: University
of Massachusetts Press 1994;151-171.
6. Sayre, JM, et al. Green Visions Plan for 21st Century Southern California: A Guide for Habitat Conservation,
Watershed Health, and Recreational Open Space. 11. Best Management Practices (BMP) for the Treatment of
Stormwater Runoff, University of Southern California GIS Research Laboratory and Center for Sustainable Cities,
Los Angeles, California, 2006.
7. Pincetl, S & Gearin, E. The Reinvention of Public Green Space. Urban Geography, 2005;26, 5:365–384.
8. The Trust for Public Land. No place to play: a comparative analysis of park access in seven major cities. November,
2004.
9. Wolch J R et al. Parks and park funding in Los Angeles: an equity mapping approach. Urban Geography 2005;26:4-
25.
10. Los Angeles Countywide Parks and Recreation Needs Assessment (see http://lacountyparkneeds.org/).
11. Correlation coefficient 0.45; p-value < 0.001.
12. Lindsey J et al. Access, equity, and urban greenways: an exploratory investigation. Professional Geographer 2001;
53:332-346.
13. Joassart-Marcelli P. Leveling the playing field? Urban disparities in funding for local parks and recreation in the Los
Angeles region. Environment and Planning 2010;42:1171-1192.
14. Lafleur M, Gonzalez E, Schwarte L, Banthia R, Kuo T, Verderber J, Simon P. Increasing physical activity in under-
resourced communities through school-based, joint use agreements, Los Angeles County, 2010-2012. Prev Chron
Dis 2013;10:120270. http://dx.doi.org/10.5888/pcd10.120270.
15. Los Angeles County Department of Public Health. Creating healthy food environments: healthy food procurement
practices in the County of Los Angeles. Available at: http://publichealth.lacounty.gov/chronic/docs/20131227_
Creating_Health_Food.pdf.

Los Angeles County Department of Public HealthDivision of Chronic Disease and Injury Prevention3530 Wilshire Blvd, Suite 800Los Angeles, CA 90010(213) 351 - 7825
Los Angeles County Department of Public Health
Cynthia Harding, MPH Interim Director
Jeffrey Gunzenhauser, MD, MPH Interim Health Officer
Los Angeles County Board of Supervisors
Hilda L. Solis First District
Mark Ridley-Thomas Second District
Sheila Kuehl Third District
Don Knabe Fourth District
Michael D. Antonovich Fifth District
Suggested Citation: Los Angeles County Department of Public Health. Parks and Public Health in Los Angeles County: A Cities and Communities Report; May 2016.
Division of Assessment, Quality, and Planning
Paul Simon, MD, MPH, Division Director and Chief Science Officer
Douglas Frye, MD, MPH, Interim Director, Office of Health Assessment and Epidemiology
Alex Ho, MD, MPH, Supervising EpidemiologistAida Angelescu, MS, Senior Geographic Information
Systems AnalystLouise Rollin-Alamillo, MS, Research AnalystHeena Hameed, MPH, Research Analyst
Division of Chronic Disease and Injury Prevention
Tony Kuo, MD, MSHS, Acting Division DirectorLinda Aragon, MPH, Director of Policy and ProgramsJean Armbruster, MA, Director, PLACE ProgramAndrea Welsing, MPH, Director, Injury and Violence
Prevention ProgramJocelyn Estiandan, MPH, Policy Analyst, PLACE ProgramRachel Tyree, MPH, Director of CommunicationsAmy Truong, Graphic Artist, Communications
The following staff contributed to this report:


