36
November 2 - 4,1999 alternatives packet SALTON SEA SALTON SEA RESTORATION

November 2 - 4,1999
alternatives packet
SALTON SEASALTON SEAR E S T O R AT I O N

For Additional information Contact:
Salton Sea Authority
Tom KirkExecutive Director
78-035 Calle EstadoLa Quinta, CA 92253
760-564-4888
Bureau of Reclamation
Bill SteeleSalton Sea Project Manager
P.O. Box 61470Boulder City, NV 89006
702-293-8129
“www.lc.usbr.gov”

SALTON SEA RESTORATION PROJECT OVERVIEW
I. SUMMARY OF PROCESS
EIS/EIR PROCESS 18 Month Time frame
Final Draft Alternative Report September 1997Secretary visits Salton Sea Announces Joint Effort with the Salton Sea Authority - December 1997Current EIS/EIR Effort Initiated - June 1998 Notice of Intent/Notice of Preparation Published - June 1998Public Scoping Workshops - July 1998Public Comment Period - July 1998 - September 1998Additional Public Workshops - October 1998Pre-appraisal Level Alternatives developed - March 1998 - September 1998Alternative Screening Process - September 1998 - November 1998Alternatives Selected for further Study - December 1998 - April 1999Public Workshops on Alternatives - May 1999Completed Draft Biological Assessment - September 1999 Completed Appraisal LevelEffort work on five selected alternatives - October 1999Finalize Appraisal Report - December 1999
Next Steps
Selection of Preferred Alternative - November 1999Finalize Biological Assessment - December 1999Prepare draft EIS/EIR - November 1999 - January 2000Release Draft EIS/EIR to Public and Congress - January 2000Install and operate selected demonstration projects - January 2000 - October 2002Send Preferred Alternative Report to Congress - January 2000Finalize feasibility design - June 2000File final EIS/EIR - June 2000Seek Congressional Authorization for Project - January 2000 - July 2000Obtain permits for construction - January 2001Complete detailed specification designs - December 2002
SCIENCE PROCESS
Initial 18 months
Secretary establishes the Research Management Committee - December 1997Secretary establishes the Salton Sea Science Subcommittee - December 1997Identified scientific data gaps and established collection priorities -January/May1998 Initiated data gathering, synthesis , and evaluation process - August 1998Contracted for issue specific synthesis documents - October - December 1998
Avifauna of the SeaFish and fisheries of the Sea
1

Chemical and Physical Analyses of the SeaBiological Limnology of the SeaSurvey of Algal Toxins in the SeaReconnaissance of Microbial Pathogens in the SeaSediment, Physical Characteristics of the SeaImpact of Rising Salinity on the Ecosystem of the SeaA Brief History and Biology of the SeaAvian Disease at the SeaLiterature Synthesis Bibliographic Reports
Contracted for Reconnaissance InvestigationsSurvey of Algal Toxins in the SeaAvifauna of the Sea, Annual Phenology, Numbers, and DistributionFish Ecology and fisheries biology of the SeaSalton Sea Desert Pup fish InvestigationsBiological Limnology of the SeaLimnology of the Sea - Chemical and Physical Analyses of the SeaSurvey of Selected Microbial Pathogens in the SeaEnvironmental Reconnaissance - Sediment Contaminants
Contracted Bird Mortality InvestigationsAvian BotulismTilapia Food HabitsIdentification and Ecology of Disease-Causing Agents for Eared GrebesIdentification of Natural Toxins Investigation of the Cause of Eared Grebe Mortality-Algal Blooms and Biotoxins
Next Step
* Preparation and Submittal of the Strategic Science Plan to Congress - January 2000
2

II. SUMMARY OF GOALS AND OBJECTIVES
The Salton Sea Reclamation act of 1998 (Public Law [PL] 105-372) directs the Secretary ofInterior to "complete all studies...of various options that permit the continual use of theSalton Sea as a reservoir for irrigation drainage and:
reduce and stabilize the overall salinity of the Salton Sea; (ii) stabilize the surface elevation of the Salton Sea; (iii) reclaim, in the long term, healthy fish and wildlife resources and their habitats, and (iv) enhance the potential for recreational uses and economic developments of the Salton sea."
Development of such a restoration project requires compliance with the NationalEnvironmental Policy Act (NEPA) and the California Environmental Quality Act (CEQA)through the preparation of an environmental impact statement/environmental impactreport (EIS/EIR). The Salton Sea Authority and the Bureau of Reclamation, working jointlywith stakeholders and members of the public, developed five goals that comply with thedirection contained in PL. 105-372 and provide guidance for the preparation of the EIS/EIR.
In order to measure the effectiveness of any actions designed and implemented to achievethe five goals, objectives were developed to further define each goal. In many cases,objectives overlap and result in mutual benefits. The goals and objectives have been usedto guide the development of alternatives for this project. The same objectives ultimatelywould be used to guide efforts to monitor and evaluate the effectiveness of any restora-tion actions that are implemented.
GOAL 1: Maintain the Sea as a Repository for Agricultural Drainage
Objectives:
Stabilize water surface elevation within a range allowing for climate and drainage-induced annual fluctuations (preferably +/- -230 m.s.l); and
Maintain agricultural drainage accessibility to the Sea.
GOAL 2: Provide a Safe, Productive Environment at the Sea for Resident andMigratory Birds and Endangered Species
Objectives: Typical Species Affected
Enhance fresh water marsh habitat Yuma clapper rail
Maintain of open water habitat and American white pelicana food base for fish-eating birds California brown pelican
3

Protect/provide appropriate habitat double-crested cormorantsfor roosting and nesting great blue heron
Maintain a broad array of black-necked stiltavian foraging habitat ruddy ducks
Enhance stability of shoreline pools desert pupfishand creeks western snowy plover
Sustain water levels suitable for desert pupfishdesert pupfish
Minimize losses from disease pelicans, eared grebes
GOAL 3: Restore Recreational Uses of the Sea
Objectives:
Stabilize water surface elevation within a range, allowing for climate and drainage-induced annual fluctuations (preferably +/- -230 m.s.l);
Address selenium health advisory on eating fish;
Improve aesthetics by minimizing odor
Reduce occurrence of algal blooms; and
Maintain State Class I recreational quality status
GOAL 4: Maintain a Viable Sport Fishery at the Sea
Maintain a healthy habitat for orange mouth corvina;
Reduce and maintain salinity at 40,000 milligrams per liter (mg/L) or lower;
Reduce fish die-offs
GOAL 5: Identify Opportunities for Economic Development around the Sea
Implement objectives for sport fisheries
Implement objectives for fish and wildlife
Implement and maintain a clean shoreline
4

III. SUMMARY OF ALTERNATIVES
Salton Sea Alternative Evaluation Final Draft Report - September 1997Considered 54 alternative ways to reduce the Sea's SalinityFive alternatives were identified for further studyAll alternatives were rated and evaluation criteria applied
Pre-appraisal Report - September 1998Considered 74 alternative ways to reduce the Sea's salinityEach alternative evaluated at the pre-appraisal levelBalance of alternatives were screened out based upon unproven technology, inability to control salinity and/or elevation39 alternatives were considered for further evaluation
Alternatives Screening Process - November 1998Participated in by Bureau of Reclamation, Salton Sea Authority, Salton Sea Authority Technical Advisory Committee members, Corps of Engineers, Environmental Protection Agency, Fish and Wildlife Service, and Tetra TechDescribed "No Project" AlternativeDeveloped specific scoring levels for each criterion39 Alternatives were evaluated based on screening criteriaScored each alternative for each criterionIdentified areas for further refinement of alternativesDirected Engineers to focus on five specific alternatives for further refinement
Highest Rated Alternatives - November 1998Reclaimed Water from Yuma/Pump-out to Gulf of CaliforniaReclaimed Water from Yuma/Pump-out to Pacific OceanSouth Half of Sea Evaporation PondDesalinization with brine pump-out to Gulf of CaliforniaDesalinization/solar pond with brine pump-out to Gulf of California
Three No Action Levels of Average Inflows - November 19981.36 million acre-feet/year1.06 million acre-feet/year0.80 million acre-feet/year
At 1.36 million acre-feet/year average in-flow level Salinity increases from 44,000 PPM to 90,000 PPM in 100 yearsWater surface elevation varies from -227 to -226 m.s.l.Surface area of the Sea varies between 240,000 to 245,000 acresExisting wetlands continue to exist but with higher salinityHabitat will change from what exists today
5

At 1.06 million acre-feet/year average in-flow levelSalinity increases from 44,000 PPM to 142,000 PPM in 100 yearsWater surface elevation varies from -227 to -240 m.s.l.Surface area of the Sea reduced from 240,000 to 201,000 acresExisting wetlands lostHabitat will change from what exists today
At 0.80 million acre-feet/year average in-flow level Salinity increases from 44,000 PPM to 202,000 PPM in 100 yearsWater surface elevation varies from -227 to -250 m.s.l.Surface area of the Sea reduced from 240,000 to 170,000 acresExisting wetlands lostHabitat will change from what exists today
Adopted a Phased Approach to the Project - March 1999Phase 1 - Project Level AnalysisPhase 2 - Programmatic Level analysis
Phase 1 AlternativesConstruct two Evaporation Ponds - near Salton Sea Test BaseConstruct Enhanced Evaporation System (EES) - Bombay BeachConstruct EES - Salton Sea Test Base Construct Evaporation Pond and an EES - Salton Sea Test BaseConstruct In-Sea EES within an Evaporation Pond near the Salton Sea Test Base
Phase 1 Common Components of All AlternativesFish HarvestIntegrated Wildlife Disease Control ProgramImproved Recreational facilitiesShoreline cleanupStrategic Science ProgramLong-term Management PlanShorebird Habitat AreasColorado River Flood Flows as available
Phase 2 Alternatives
Displacement Options for elevation controlConstruction of displacement dike Construction of an islandImportation of additional water
Central Arizona Salinity Interceptor waterExchanges with San Bernardino, California
6

Export Options to Reduce SalinityGulf of CaliforniaLarger Enhanced Evaporation System - Bombay Beach areaLarger Enhanced Evaporation System - Salton Sea Test Base areaPacific OceanDry lake Bed
Import Options to Reduce SalinityCentral Arizona Salinity Interceptor waterExchanges with San Bernardino, California
7

-224
-275
-275
-250
-242
No ActionSalton Sea Alternatives
Inflow 1.36 Million af/yr
-224 below sea level
Inflow 1.06 Million af/yr
-242 below sea level
Inflow .8 million af/yr
-251 below sea level
af/yr=acre feet per year
Current Shoreline
-227
Sea, Elevation after
100 years
White Water River
Alamo River
New
River
San
Felip
e Cr
eek

NO ACTION
Environmental Impacts
Significant impact to fisheries would result from increases in salinity
Bird species would be threatened by loss of fisheries
A significant drop in Sea elevation and decrease in surface area could occur if inflows to the Sea decrease in the future
Local economic conditions and recreational opportunities would continue to decline
9

No-Action AlternativeElevation
-250
-245
-240
-235
-230
-225
-22020
00
2010
2020
2030
2040
2050
2060
2070
2080
2090
2100
Year
Ele
vati
on
(fe
et)
1.363 maf/yr
1.063 maf/yr
.800 maf/yr

40000
60000
80000
100000
120000
140000
160000
180000
200000
220000
2000
2010
2020
2030
2040
2050
2060
2070
2080
2090
2100
Year
Sal
init
y (m
g/l)
1.363 maf/yr
1.063 maf/yr
.800 maf/yr
No-Action Alternative

SALTON SEA RESTORATION PROJECTPhase 1 and 2 Alternatives
November 2, 1999
1 of 2
Phase 1 Phase 2AnnualInflow(maf) 2003 2008 2015 2030 2060
Alternative 11.36 - Fish Harvesting
- Improve RecreationalFacilities
- Shoreline Cleanup- Wildlife Disease
Control
- Two Ponds at 98 kaf/yrUntil Year 2038
- Southwest (SW)Shorebird/PupfishProtection Pond
- Accelerated Export – 150kaf/yr1
- Southeast (SE) ShorebirdPond/Island ProtectionWith Deep Water Habitat
- North (N) Shorebird Pond
1.06 Same as above Same as above Same as above, plus- Accelerated SE Shorebird
Pond/Island ProtectionWith Deep Water Habitat
- Accelerated N ShorebirdPond
- Displacement Dike
Same as above, plus- Import Central Arizona
Salinity Interceptor (CASI)Water (up to 304.8 kaf/yr,as required)
0.8 Same as above Same as above Same as above Same as above, plus- Import Flood Flows2
Alternatives 2 and 31.36 - Fish Harvesting
- Improve RecreationalFacilities
- Shoreline Cleanup- Wildlife Disease
Control
- 150 kaf/yr EnhancedEvaporation System(EES) (ShowerlineTechnology)
- SE ShorebirdPond/Island ProtectionWith Deep WaterHabitat
1.06 Same as above Same as above Same as above, plus
- Displacement Dike
- Import Flood Flows
- SW Shorebird/PupfishProtection Pond
- N Shorebird Pond
- Import CASI Water (up to304.8 kaf/yr, as required)
0.8 Same as above Same as above Same as above Same as above - AdditionalDisplacement orInflow
Alternative 41.36 - Fish Harvesting
- Improve RecreationalFacilities
- Shoreline Cleanup- Wildlife Disease
Control
- 100 kaf/yr EES(ShowerlineTechnology)
- One Evaporation Pond(SW) at 68 kaf/yr UntilYear 2038
- SW Shorebird/PupfishProtection Pond
- SE ShorebirdPond/Island ProtectionWith Deep WaterHabitat
- Increase EES capacity to150 kaf/yr
- N Shorebird Pond
1.06 Same as above Same as above Same as above, plus- Displacement Dike- Import Flood Flows- Accelerated N Shorebird
Pond
Same as above, plus- Import CASI Water (up to
304.8 kaf/yr, as required)- Reduce EES to or
maintain EES at 100kaf/yr EES
0.8 Same as above Same as above Same as above Same as above
1 Accelerated export implemented as a Phase 2 action2 Flood flow diversions implemented as a Phase 2 action

SALTON SEA RESTORATION PROJECTPhase 1 and 2 Alternatives
November 2, 1999
2 of 2
Phase 1 Phase 2AnnualInflow(maf) 2003 2008 2015 2030 2060
Alternative 51.36 - Fish Harvesting
- Improve RecreationalFacilities
- Shoreline Cleanup- Wildlife Disease
Control
- 150 kaf/yr EES in SeaNW Evaporation Pond(23 years Using GroundBased EES Tech withSalt Stockpiling inPond)
- SE ShorebirdPond/Island ProtectionWith Deep WaterHabitat
- N Shorebird Pond- SW Shorebird/Pupfish
Protection Pond
- Export 150 kaf/yr
1.06 Same as above Same as above Same as above, plus- Displacement Dike- Import Flood Flows
Same as above, plus- Import CASI Water (up to
304.8 kaf/yr, as required)0.8 Same as above Same as above Same as above Same as above - Additional
Displacement orInflow

13
AcceleratedExport
150,000 AFY
Alternative 1Salton Sea Alternatives
Major Actions inthe First 30 Years
Inflow 1.36 MAFY
Inflow 1.06 & 0.8 MAFY
Evaporation Pond 1 N
Evaporation Pond & Shorebird PondAccelerated Export
Accelerated SE Shorebird PondAccelerated N. Shorebird PondDisplacement Dike
SW
Common Elements
Improve Recreation
Fish Harvest
Wildlife Disease Program
Shoreline Clean up
Strategic Science Plan
Long-Term Management Plan
White Water River
DisplacementDike
Alamo River
New
River
SouthwestShorebird
Pond
NorthShorebirdPond
SoutheastShorebirdPond
Salton
SeaComponents on line at:
San
Felip
e Cr
eek
MAFY - million acre-feet per year
AFY - acre-feet per year
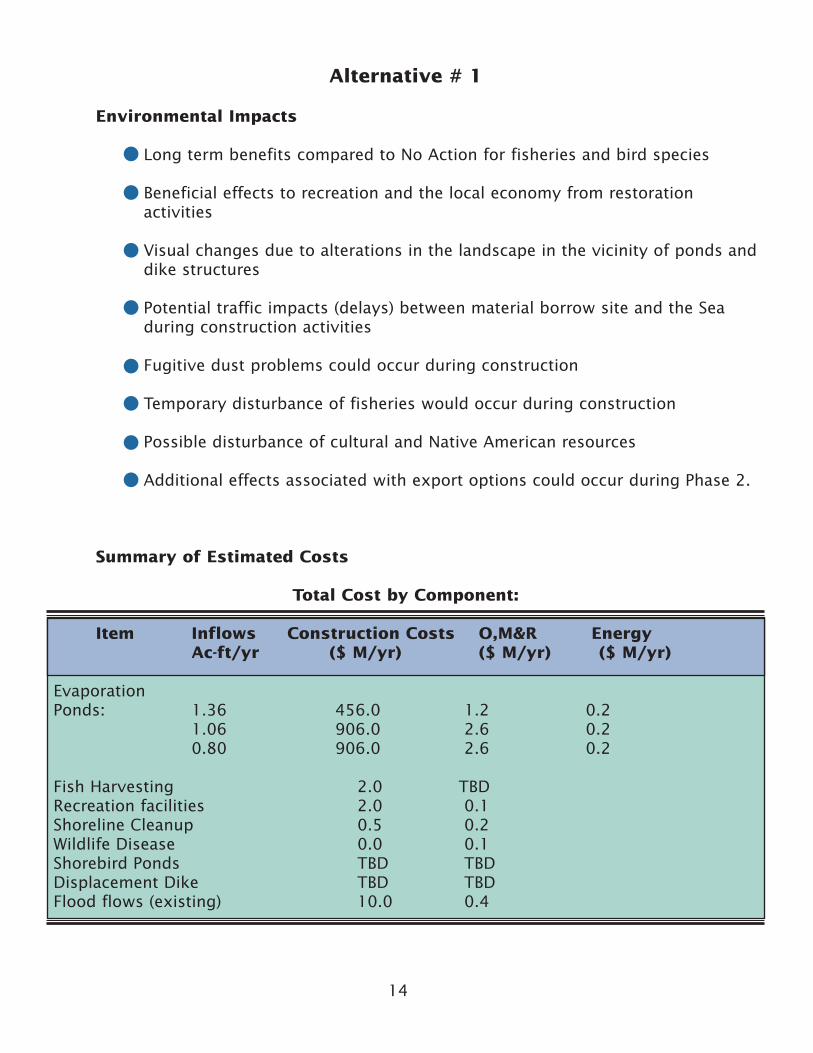
Alternative # 1
Environmental Impacts
Long term benefits compared to No Action for fisheries and bird species
Beneficial effects to recreation and the local economy from restoration activities
Visual changes due to alterations in the landscape in the vicinity of ponds and dike structures
Potential traffic impacts (delays) between material borrow site and the Sea during construction activities
Fugitive dust problems could occur during construction
Temporary disturbance of fisheries would occur during construction
Possible disturbance of cultural and Native American resources
Additional effects associated with export options could occur during Phase 2.
Summary of Estimated Costs
Total Cost by Component:
Item Inflows Construction Costs O,M&R EnergyAc-ft/yr ($ M/yr) ($ M/yr) ($ M/yr)
Evaporation Ponds: 1.36 456.0 1.2 0.2
1.06 906.0 2.6 0.20.80 906.0 2.6 0.2
Fish Harvesting 2.0 TBDRecreation facilities 2.0 0.1Shoreline Cleanup 0.5 0.2Wildlife Disease 0.0 0.1Shorebird Ponds TBD TBDDisplacement Dike TBD TBDFlood flows (existing) 10.0 0.4
14
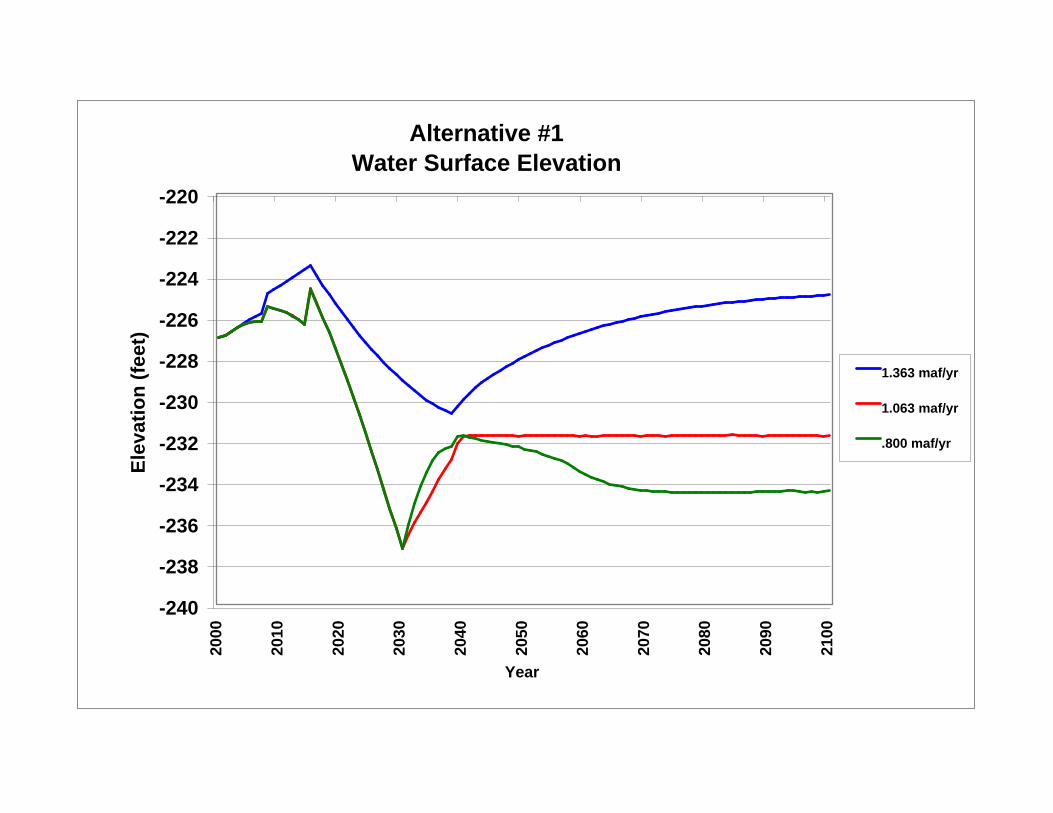
Alternative #1Water Surface Elevation
-240
-238
-236
-234
-232
-230
-228
-226
-224
-222
-22020
00
2010
2020
2030
2040
2050
2060
2070
2080
2090
2100
Year
Ele
vati
on
(fe
et)
1.363 maf/yr
1.063 maf/yr
.800 maf/yr

Alternative #1Salinity
20000
25000
30000
35000
40000
45000
50000
55000
60000
2000
2010
2020
2030
2040
2050
2060
2070
2080
2090
2100
Year
Sal
init
y (m
g/l)
1.363 maf/yr
1.063 maf/yr
.800 maf/yr

17
Enhanced Evaporation Systemat Bombay Beach
Periodic Flood Flows
150,000 AFY
Alternative 2Salton Sea Alternatives
Major Actions inthe First 30 Years
Inflow 1.36 MAFY
Inflow 1.06 & 0.8 MAFY
Enhanced Evaporation System
SE Shorebird Habitat
SW Shorebird PondNorth Shorebird PondDisplacement DikePeriodic Flood Flows
Common Elements
Improve Recreation
Fish Harvest
Wildlife Disease Program
Shoreline Clean up
Strategic Science Plan
Long-Term Management Plan
White Water River
DisplacementDike
Alamo River
New
River
SouthwestShorebird
Pond
NorthShorebirdPond
SoutheastShorebirdPond
Salton
SeaComponents on line at:
San
Felip
e Cr
eek
MAFY - million acre-feet per year
AFY - acre-feet per year

Alternative #2
Environmental Impacts
Long term benefits compared to the No Action for fisheries and bird species
Beneficial effects to recreation and the local economy from restoration activities
Fugitive dust problems could occur during constructio
Possible disturbance of cultural and Native American resources
Loss of desert habitat and possible salt drift at and near Enhanced EvaporationSystem sites
Visual changes due to alterations in the landscape in the vicinity of ponds, dike structures, and Enhanced Evaporation System towers at the Bombay Beach site
Potential adverse impacts to migrating birds due to tower configuration and height, and salt mist
Summary of Estimated Costs
Total Cost by Component:
Item Inflows Construction Costs O,M&R EnergyAc-ft/yr ($ M/yr) ($ M/yr) ($ M/yr)
Enhanced Evaporation System 1.36 303.0 8.7 3.0
1.06 787.0 10.1 3.00.80 787.0 10.1 3.0
Fish Harvesting 2.0 TBDRecreation facilities 2.0 0.1Shoreline Cleanup 0.5 0.2Wildlife Disease 0.0 0.1Shorebird Ponds TBD TBDDisplacement Dike TBD TBDFlood flows (existing) 10.0 0.4
18

Alternative #2Elevation
-240
-238
-236
-234
-232
-230
-228
-226
-224
-222
-22020
00
2010
2020
2030
2040
2050
2060
2070
2080
2090
2100
Year
Ele
vati
on
(fe
et)
1.363 maf/yr
1.063 maf/yr
.800 maf/yr

Alternative #2Salinity
20000
25000
30000
35000
40000
45000
50000
55000
60000
2000
2010
2020
2030
2040
2050
2060
2070
2080
2090
2100
Year
Sal
init
y (m
g/l)
1.363 maf/yr
1.063 maf/yr
.800 maf/yr

21
150,000
Periodic Flood Flows
Alternative 3Salton Sea Alternatives
Major Actions inthe First 30 Years
Inflow 1.36 MAFY
Inflow 1.06 & 0.8 MAFY
Enhanced Evaporation System
SE Shorebird Pond
SW Shorebird PondNorth Shorebird PondDisplacement DikePeriodic Flood Flows
Common Elements
Improve Recreation
Fish Harvest
Wildlife Disease Program
Shoreline Clean up
Strategic Science Plan
Long-Term Management Plan
DisplacementDike
Alamo River
SouthwestShorebird
Pond
NorthShorebirdPond
SoutheastShorebirdPond
Salton
SeaComponents on line at:
San
Felip
e Cr
eek
MAFY - million acre-feet per year
AFY - acre-feet per year
Enhanced Evaporation System at Salton Sea Test Base
White Water
River
New River

Alternative #3
Environmental Impacts
Long term benefits compared to the No Action for fisheries and bird species
Beneficial effects to recreation and the local economy from restoration activities
Fugitive dust problems could occur during construction
Possible disturbance of cultural and Native American resources
Loss of desert habitat and possible salt drift at and near Enhanced Evaporation System sites
Visual changes due to alterations in the landscape in the vicinity of ponds, dike structures, and Enhanced Evaporation System towers at the Salton Sea Test Base Site
Potential adverse impacts to migrating birds due to tower configuration and height, and salt mist
Summary of Estimated Costs
Total Cost by Component:
Item Inflows Construction Costs O,M&R EnergyAc-ft/yr ($ M/yr) ($ M/yr) ($ M/yr)
Enhanced EvaporationSystem 1.36 427.0 9.1 3.0
1.06 910.0 10.5 3.00.80 910.0 10.5 3.0
Fish Harvesting 2.0 TBDRecreation facilities 2.0 0.1Shoreline Cleanup 0.5 0.2Wildlife Disease 0.0 0.1Shorebird Ponds TBD TBDDisplacement Dike TBD TBDFlood flows (existing) 10.0 0.4
22

Alternative #3Elevation
-240
-238
-236
-234
-232
-230
-228
-226
-224
-222
-22020
00
2010
2020
2030
2040
2050
2060
2070
2080
2090
2100
Year
Ele
vati
on
(fe
et)
1.363 maf/yr
1.063 maf/yr
.800 maf/yr

Alternative #3Salinity
20000
25000
30000
35000
40000
45000
50000
55000
60000
2000
2010
2020
2030
2040
2050
2060
2070
2080
2090
2100
Year
Sal
init
y (m
g/l)
1.363 maf/yr
1.063 maf/yr
.800 maf/yr

25
100,000
Periodic Flood Flows
Alternative 4Salton Sea Alternatives
Major Actions inthe First 30 Years
Inflow 1.36 MAFY
Inflow 1.06 & 0.8 MAFY
Enhanced Evaporation System
Evaporation Pond
SW Shorebird Pond
SE Shorebird Pond
Displacement DikePeriodic Flood FlowsAccelerated N Shorebird Pond
Common Elements
Improve Recreation
Fish Harvest
Wildlife Disease Program
Shoreline Clean up
Strategic Science Plan
Long-Term Management Plan
DisplacementDike
Alamo River
SouthwestShorebird
Pond
NorthShorebirdPond
SoutheastShorebirdPond
Salton
SeaComponents on line at:
San
Felip
e Cr
eek
MAFY - million acre-feet per year
AFY - acre-feet per year
Enhanced Evaporation System at Salton Sea Test Base
Evaporation Pond
68 kaf/yr
White Water
River
New River

Alternative #4
Environmental Impacts
Long term benefits compared to the No Action for fisheries and bird species
Fugitive dust problems could occur during construction
Loss of desert habitat and possible salt drift at and near Enhanced EvaporationSystem sites
Possible disturbance of cultural and Native American resources
Beneficial effects to recreation and the local economy from restoration activities
Visual changes due to alterations in the landscape in the vicinity of ponds, dike structures, and Enhanced Evaporation System towers at the Salton Sea Test Base Site
Potential traffic impacts (delays) between material borrow site and the Sea during construction activities
Summary of Estimated Costs
Total Cost by Component:
Item Inflows Construction Costs O,M&R EnergyAc-ft/yr ($ M/yr) ($ M/yr) ($ M/yr)
Evaporation Pond And EES 1.36 574.0 6.7 2.1
1.06 1024.0 8.1 2.10.80 1024.0 8.1 2.1
Fish Harvesting 2.0 TBDRecreation facilities 2.0 0.1Shoreline Cleanup 0.5 0.2Wildlife Disease 0.0 0.1Shorebird Ponds TBD TBDDisplacement Dike TBD TBDFlood flows (existing) 10.0 0.4
26

Alternative #4Elevation
-240
-238
-236
-234
-232
-230
-228
-226
-224
-222
-22020
00
2010
2020
2030
2040
2050
2060
2070
2080
2090
2100
Year
Ele
vati
on
(fe
et)
1.363 maf/yr
1.063 maf/yr
.800 maf/yr

20000
25000
30000
35000
40000
45000
50000
55000
6000020
00
2010
2020
2030
2040
2050
2060
2070
2080
2090
2100
Year
Sal
init
y (m
g/l)
1.363 maf/yr
1.063 maf/yr
.800 maf/yr
Alternative #4

29
Periodic Flood Flows
Alternative 5Salton Sea Alternatives
Major Actions inthe First 30 Years
Inflow 1.36 MAFY
Inflow 1.06 & 0.8 MAFY
In-Sea Enhanced Evaporation System
Evaporation Pond
SW Shorebird Pond
SE Shorebird Pond
N Shorebird Pond
Displacement DikePeriodic Flood Flows
Common Elements
Improve Recreation
Fish Harvest
Wildlife Disease Program
Shoreline Clean up
Strategic Science Plan
Long-Term Management Plan
DisplacementDike
Alamo River
SouthwestShorebird
Pond
NorthShorebirdPond
SoutheastShorebirdPond
Salton
SeaComponents on line at:
San
Felip
e Cr
eek
MAFY - million acre-feet per year
AFY - acre-feet per year
In Sea Enhanced Evaporation System 150,000 AFY in pond
White Water
River
New River

Alternative #5
Environmental Impacts
Long term benefits compared to the No Action for fisheries and bird species
Fugitive dust problems could occur during construction
Temporary disturbance of fisheries would occur during construction
Possible disturbance of cultural and Native American resources
Beneficial effects to recreation and the local economy from restoration activities
Additional effects associated with export options could occur during Phase 2.
Visual changes due to alterations in the landscape in the vicinity of ponds, dike structures, and Enhanced Evaporation System towers at the Salton Sea Test Base Site
Potential traffic impacts (delays) between material borrow site and the Sea during construction activities
Summary of Estimated Costs
Total Cost by Component:
Item Inflows Construction Costs O,M&R EnergyAc-ft/yr ($ M/yr) ($ M/yr) ($ M/yr)
In-Sea Evaporation Pond/EES 1.36 400.0 6.0 16.4
1.06 850.0 7.4 16.40.80 850.0 7.4 16.4
Fish Harvesting 2.0 TBDRecreation facilities 2.0 0.1Shoreline Cleanup 0.5 0.2Wildlife Disease 0.1 0.1Shorebird Ponds TBD TBDDisplacement Dike TBD TBDFlood flows (existing) 10.0 0.4
30

Alternative #5Elevation
-240
-238
-236
-234
-232
-230
-228
-226
-224
-222
-22020
00
2010
2020
2030
2040
2050
2060
2070
2080
2090
2100
Year
Ele
vati
on
(fe
et)
1.363 maf/yr
1.063 maf/yr
.800 maf/yr

20000
25000
30000
35000
40000
45000
50000
55000
6000020
00
2010
2020
2030
2040
2050
2060
2070
2080
2090
2100
Year
Sal
init
y (m
g/l)
1.363 maf/yr
1.063 maf/yr
.800 maf/yr
Alternative #5

33
Salton Sea Alternatives
Other Possible Long Term Actions
Export to Dry Lake Bed
Import from Central Arizona SalinityInterceptorWater
Export to Gulf of Mexico
DisplacementDike
Alamo River
Salton
Sea
San
Felip
e
Cree
k
ImportFrom San Bernardino
Export to Pacific
New River
White Water
River


