25
Supporting Information (SI) Appendix Supplemental Materials and Methods Supplemental Figures S1-S5 Supplemental Tables S1-S7 Supplemental References Datasets S1 and S2
Supporting Information (SI) Appendix
Supplemental Materials and Methods Supplemental Figures S1-S5
Supplemental Tables S1-S7 Supplemental References
Datasets S1 and S2
Supplemental Materials and Methods Plasmids. cDNA fragments containing the reading frames of ERG, FLI1, FEV, ETV1, ETV4, ETV5 and USP9X were amplified by PCR using primers appended with restriction site sequences and cloned into the pCMV-TnT vector (Promega) that had been modified with a C-terminal V5, HA or 3xFLAG tag or the pGEX6P-2 vector (GE Healthcare Life Sciences). The USP9X-mut-FLAG mutant (C1556S) was generated from the wildtype USP9X-FLAG construct by targeted mutagenesis (Phusion® Site-Directed Mutagenesis Kit). pRK5-HA-Ubiquitin, pRK5-HA-K48-Ubiquitin and pRK5-HA-K63-Ubiquitin were obtained from Addgene. All primer sequences are listed in Table S6.
siRNAs. ON-TARGET plus siRNAs were obtained from Dharmacon. All siRNA sequences are listed in Table S6.
Cell culture and transfection. VCaP cells were cultured in DMEM with 2% charcoal-stripped FBS or 10% FBS. HeLa cells, 22RV1 cells and HEK293T cells were cultured in DMEM with 10% FBS. PC3, and Du-145 cells were cultured in RPMI with 10% FBS. Plasmids were transfected with Effectene Transfection Reagent (Qiagen); for siRNA transfection Lipofectamine RNAiMax (Invitrogen) was used for HeLa and HEK293T cells, HiPerFect Transfection Reagent (Qiagen) and Stemfect RNA Transfection Reagent (Stemgent) were used for VCaP cells. To generate stable ERG overexpressing cells, 22Rv1 cells were transfected with pIRESneo3-ERG-V5 plasmids or pIRESneo3 (empty vector) and cells stably expressing the IRES-neo transcripts were selected with geneticin (600 µg/ml).
Antibodies and reagents. The following antibodies were used for immunoprecipitation: ERG (Epitomics, 5115), V5 (Genscript, A01724) and HA (Santa Cruz Biotechnology, sc-7392); Western blot analysis: MCL1 (Abcam, ab3208), USP9X (Bethyl Laboratories, A301-351A, or Abcam, ab56461), PARP (9532, Cell Signaling), USP5 (ab155993, Abcam), USP14 (11931, Abcam), UCHL5(ab133508), HA (Bethyl Laboratories, A190-108A, or Sigma, H3663, or Cell Signaling Technology, 3724), V5 (Bethyl Laboratories, A190-120A), ERG (Epitomics, 2805, or Santa Cruz, sc-271048), GAPDH (Cell Signaling Technology, 2118), Cox IV (Cell Signaling Technology, 5247), Flag M2 (Sigma, F3165) and β-actin (Cell Signaling Technology, 4970); Immunohistochemistry: USP9X (Bethyl Laboratories, A301-351A), ERG (Biocare Medical, CM421), endomucin (custom monoclonal antibody, clone V.7C7)(1). Immunofluorescence: anti-γ-H2A.X monoclonal antibody (05-636, Millipore), anti-ERG antibody (2805, Epitomics), Alexa Fluor 488-anti-mouse IgG and Alexa Fluor 555-anti-rabbit IgG (Invitrogen). The following reagents were used: MG132 (EMD Biosciences); cycloheximide (Sigma); WP1130 (customly synthesized by Dalton Chemical Laboratories); recombinant USP9X-His, AMC-ubiquitin (BostonBiochem)

Protein purification and GST Pulldown; ERG immunoprecipitation. GST-ERG-His protein was expressed in E. coli BL21(DE3). After induction for 3 hours with 0.2 mM IPTG at 25 °C, the cells were harvested by centrifugation. The obtained cell pellets were resuspended in lysis buffer (50 mM NaH2PO4 [pH 8.0], 500 mM NaCl, 20 mM imidazole, 0.5% IGEPAL CA-630, 5% glycerol, 1 mg/ml Lysozyme, 1 mM PMSF, 15 mM β-mercaptoethanol). After incubating the resuspended cells on ice for 30 minutes, lysis was performed by sonication, and the lysate was cleared by centrifugation. Ni-NTA beads (Qiagen) were added to the supernatant and incubated with gentle agitation at 4 °C for 90 minutes. The beads were washed twice with 60 mM imidazole, and GST-ERG-His was subsequently eluted with 250 mM imidazole. The eluted proteins were then bound to glutathione sepharose 4B beads (GE Healthcare). For the GST pulldown, VCaP cells were lysed in high salt buffer (20 mM Tris [pH 8.0], 1.5 mM MgCl2, 0.2 mM EDTA, 0.5 mM DTT, 400 mM NaCl, 0.5% IGEPAL CA-630, Halt Protease Inhibitor Cocktail [Thermo Scientific Pierce]). Extracts were diluted to decrease the NaCl concentration to 100 mM and IGEPAL CA-630 to 0.125%, and subjected to pre-clearing with GST beads. Pre-cleared supernatant was incubated with 30 µl GST or GST-ERG beads for 2 hours at 4 °C. The beads were then washed with washing buffer (20 mM Tris [pH 8.0], 1.5 mM MgCl2, 0.2 mM EDTA, 0.5 mM DTT, 100 mM NaCl, 0.1% IGEPAL CA-630) four times, boiled in 2X Laemmli buffer and the eluted proteins were separated on a 4-20% SDS–PAGE gel and visualized by Coomassie blue staining. GST-ERG-ETS protein was purified by using with the same protocol with the following modifications: The lysis buffer did not contain imidazole, and after sonication/centrifugation the pre-clearing of the lysate was performed with sepharose beads, followed by binding to glutathione sepharose 4B beads. For immunoprecipitation of endogenous ERG, cells were lysed in lysis buffer (25mM HEPES [pH7.5], 400 mM NaCl, 0.5% IGEPAL CA-630, 1mM DTT, 5% glycerol and protease inhibitors). The soluble fraction of the lysate was diluted to adjust NaCl concentration and IGEPAL CA-630 concentration to 100 mM and 0.125%, respectively, and then pre-cleared with GammaBind G Sepharose (GE Healthcare). Pre-cleared lysates were incubated with a rabbit monoclonal anti-ERG antibody (Epitomics, 5115) at 4°C for 3 hours, followed by immunoprecipitation to the sepharose beads at 4 °C for 1 hour. Beads were washed four times with 100 mM NaCl and 0.1% IGEPAL CA-630, boiled in Laemmli buffer for PAGE.
Mass spectrometry. PAGE gel slices with bands of interest were digested with trypsin and desalted with C18 ZipTips (Millipore) according to the manufacturer’s instructions. An integrated system that includes an Agilent 1100 series nanoflow LC system (Agilent) and a LTQ 2D trap mass spectrometer (Thermo Electron) equipped with a nanoelectrospray ionization (NSI) source was used to perform high performance liquid chromatography tandem mass spectrometry (HPLC/MS/MS) analysis: Tryptic peptides were separated by a capillary HPLC column packed in-house with Luna C18 resin (Phenomenex). The eluted peptides were directly electrosprayed into the LTQ ion trap mass spectrometer, with a data-dependent mode. Mascot (version 2.3, Matrix Science) database was used to map peptides to proteins.
Immunohistochemistry. This study was conducted with the approval of the UT Southwestern Institutional Review Board. Standard immunohistochemistry staining procedure for ERG and USP9X was performed using the Benchmark XT automated stainer (Ventana) for ERG, and Dako Autostainer (DakoCytomation - Carpinteria, CA) for USP9X. Briefly, formalin-fixed,
paraffin-embedded tissue sections were cut at 3-4 micron and air-dried overnight. The sections were deparaffinized, rehydrated, and subjected to heat-induced epitope retrieval. Sections were then incubated with appropriate primary antibody. For signal detection, UltraView universal detection system (Ventana) or Envision polyclonal probe (DAKO) was used. The slides were developed using 3-3'-diaminobenzidine chromogen and counterstained with hematoxylin. Appropriate positive and negative controls were utilized for each run of immunostains.
Immunohistochemical stains were performed on tissue microarray sections from 35 or 97 prostate cancer patients, and 37 patients with benign prostatic hyperplasia as described previously(2). The evaluation of the immunostaining was carried out by a genitourinary pathologist without knowledge of clinicopathologic data. An H score was assigned as the product of intensity of staining (0 for negative, 1 for weakly positive, 2 for moderately positive, and 3 for strongly positive) and extent of immunoexpression (0-100% percentage of cells staining) for the 35 sample TMA. The average H score over the 2-3 cores was used for further analysis. For the analysis of the TMA for 37 benign prostate and 97 prostate tumor samples an expression score was defined as 0 for negative, 1 for weakly positive, 2 for moderately positive, and 3 for strongly positive.
For endomucin staining monoclonal rat anti-endomucin (clone V.7C7)(1) was kindly provided by Dietmar Vestweber (Max Planck Institute for Molecular Biomedicine) and used for immunohistochemical staining of tumor vasculature in 5µm paraffin sections at a dilution of 1:50. Bound primary antibody was detected by immunoperoxidase amplification methods using secondaries adsorbed free of mouse-crossreacting IgGs (Vector BA-4001, biotinylated rabbit anti-rat, 1:200; Vector SA-5004; streptavidin-peroxidase, 1:500; DAKO DAB chromagen).
Co-immunoprecipitation. USP9X-FLAG, ERG-V5, ERG-HA, truncated ERG-HA, FLI1-HA, FEV-HA, ETV1-HA, ETV4-HA, ETV5-HA and/or HA-ubiquitin expression plasmids were transfected into HeLa cells. Twenty-four hours after transfection cells were lysed in lysis buffer (25mM HEPES [pH7.5], 400 mM NaCl, 0.5% IGEPAL CA-630, 1mM DTT, 5% glycerol and protease inhibitors). The soluble fraction of the lysate was diluted to adjust NaCl concentration and IGEPAL CA-630 concentration to 100 mM and 0.125%, respectively, and then pre-cleared with GammaBind G Sepharose (GE Healthcare). Pre-cleared lysates were incubated with V5, FLAG or HA antibodies at 4°C for 3 hours, followed by immunoprecipitation to the sepharose beads at 4 °C for 1 hour. Beads were washed four times with 100 mM NaCl and 0.1% IGEPAL CA-630, boiled in Laemmli buffer for Western blot analysis. For the analysis of the interaction between endogenous ERG and USP9X, VCaP cells protein extract was used for immunoprecipitation as described above with a rabbit monoclonal anti-ERG antibody (Epitomics, 5115).
Analysis of ERG protein levels in VCaP cells. VCaP cells were treated or co-treated with MG132, cycloheximide, or DMSO; or were transfected with siRNAs against USP9X or a non-targeting siRNA. For Western blot analysis antibodies against USP9X, ERG, AND GAPDH.
Analysis of ERG ubiquitination in HeLa cells. Hela cells grown in DMEM with 10% FBS were co-transfected with ERG-V5 and HA-ubiquitin or HA-K48-ubiquitin expression plasmids.

For the analysis of the effects of USP9X knockdown, the cells were transfected with siRNAs against USP9X or a non-targeting siRNA 72 hours before plasmid transfection. For the analysis of the effects of WP1130, HeLa cells were treated with 5 µM WP1130 starting 24 hours after plasmid transfection. Immunoprecipitation with a V5 antibody was performed as described above. For Western blot analysis antibodies against USP9X, HA, V5, and GAPDH were used.
In vitro deubiquitination. To obtain purified USP9X and USP9X catalytically inactive mutant proteins, plasmids encoding FLAG-tagged USP9X and USP9X mutant were transfected into HEK293T cells for 48 hours. The cells were lysed in USP9X lysis buffer (50mM HEPES [pH7.5], 300 mM NaCl, 0.2% Triton X-100, 1mM DTT, 5% glycerol) without protease inhibitor, and cell lysates were immunoprecipitated with anti-FLAG M2 affinity gel (Sigma) for 3h at 4 °C and eluted with FLAG buffer (50mM HEPES [pH7.5], 300 mM NaCl, 1mM DTT, 5% glycerol and 500 µg/ml FLAG peptide). Eluted protein was then dialyzed overnight against DUB buffer (50mM HEPES (pH7.5), 100 mM NaCl, 1mM DTT, 5% glycerol). For purification of ubiquitinated ERG, ERG-V5 and HA-ubiquitin co-transfected HEK293T cells were lysed in lysis buffer (50mM HEPES [pH7.5], 400 mM NaCl, 0.2% Triton X-100, 1mM DTT, 5% glycerol and protease inhibitor). Ubiquitinated ERG was immunoprecipitated with V5-antibody agarose beads (Bethyl) for 3 hours at 4 °C, followed by elution with V5 peptide (Sigma) (50mM HEPES [pH7.5], 400 mM NaCl, 0.05% Triton X-100, 1mM DTT, 5% glycerol and 500 µg/ml V5 peptide) and dialyzed overnight. Activity of USP9X-FLAG and USP9X-mut-FLAG was measured using the fluorometric AMC-ubiquitin assay (BostonBiochem) with a fluorometer (Hitachi).
For the in vitro deubiquitination assay, purified USP9X-FLAG, USP9X-mut-FLAG or mock were pre-treated with 10 mM DTT for 15 minutes at room temperature, and subsequently incubated with the same amounts of purified ubiquitinated ERG overnight at 30 °C in DUB buffer at a DTT concentration of 2.5 mM, freshly supplemented with 5 mM MgCl2 and 1 mM ATP.
For in vitro inhibition of ERG deubiquitination by WP1130, USP9X-His (BostonBiochem) was dialyzed overnight in 50mM HEPES (pH7.5), 100 mM NaCl, 5% glycerol. 10 nM USP9X-His and ubiquitinated ERG-V5 was incubated in DUB buffer (with 5mM MgCl2, no DTT) in the presence or absence of WP1130 at room temperature for 60 minutes, and subsequently boiled in Laemmli buffer for Western blot analysis.
USP9X RNAi rescue. A pool of siRNAs targeting the 3’UTR of USP9X was generated as previously reported(3). HeLa cells were transfected with the siRNAs for 48 hours and were then transfected with the USP9X-Δ3’UTR-FLAG, USP9X-mut-Δ3’UTR-FLAG, pCMV-TnT vectors (empty vector) for another 48 hours. Cells were harvested and ERG/USP9X protein levels were analyzed by SDS-PAGE.
Explant experiments. Fresh prostate cancer tissues (n=12) were obtained with informed consent from men undergoing radical prostatectomy at the Hospitals of the University of Texas Southwestern Medical Center (Dallas, TX). The tissues were dissected into 1 mm3 pieces and randomly placed in triplicates on a pre-soaked 1 cm3 veterinary dental sponge (Novartis, East
Hanover, NJ) inside the wells of a 12-well plate containing 600 ml RPMI 1640 with 5% heat inactivated FBS, 100 units/mL penicillin-streptomycin and vehicle (DMSO) alone or 10 µM WP1140. Tissues were cultured at 37oC for 24 hours and then formalin-fixed and paraffin embedded for immunohistochemistical analyses. Number of positive tumor cells in relation to the total number of cells encountered and the intensity of nuclear staining (weak or strong) for each of the markers (ERG and Ki-67) were quantified manually per tissue core by a staff pathologist, who was blinded from the clinical data. The percentage of positively staining tumor cells was assessed.
Caspase-3/7 activity assay. Cells (10,000 for VCaP, and 5,000 for Du-145 or PC3) were seeded in 96 well culture plates. Cells were allowed to adhere overnight and were treated with 2 µM, or 5 µM WP1130 or DMSO. After 24 hours Caspase-3/7 activity was measured using the Caspase-Glo® 3/7 Assay Kit (Promega) according to the manufacturer's instructions.
Cell proliferation assay. 10,000 VCaP cells were seeded in 96 well culture plates. Cells were allowed to adhere overnight and were treated with 2 µM WP1130 or DMSO, or transfected with siNT or siUSP9X-2. Relative cell proliferation was quantified over seven days after the treatments with the CellTiter 96® AQueous One Solution Cell Proliferation Assay (Promega).
Immunofluorescence analysis of γH2AX foci. Cells were seeded on BD BiocoatTM 12 mm round coverslips in a 24-well plate or Lab TekTM 4-well chamber slide after performing siRNA knockdown or 24 hours prior to the addition of WP1130/Vehicle. Cells were fixed for 15 minutes in 4% paraformaldehyde/PBS, washed three times in PBS, permeabilized for 10 minutes in PBS containing 0.2% Triton-X, washed three times in PBS, blocked for 30 minutes in PBST (0.1% Tween-20 in PBS) with 2% BSA, incubated with mouse anti-γ-H2AX monoclonal antibody (Millipore Cat #05-636) in blocking buffer for 1 hour at room temperature, washed three times with PBST, incubated for one hour with Alexa Fluor 488-anti-mouse IgG (Invitrogen) in blocking buffer, and washed three times with PBST. Next, cells were sequentially incubated with rabbit anti-ERG antibody (Epitomics, 2805) and Alexa Fluor 555-anti-rabbit IgG (Invitrogen). Cells were then incubated with DAPI for five minutes, and the slides were finally mounted with Shandon™ Immu-Mount™ (Thermo Scientific). Images acquisition was performed with a Leica DM5500B microscope. For quantification of γH2AX foci a minimum of ten fields each containing at least 20 cells were manually counted.
Migration assay. For the migration assay, VCaP cells were transfected with USP9X siRNA(#2) or ERG siRNA or non-targeting siRNA for 48 hours. Cells were then reseeded on the outer surface of an 8.0-mm 24-well plate Transwell® insert (Corning Costar) with serum-free medium and complete medium in the lower chamber. For drug treatment of VCaP, Du-145 and PC3 cells, WP1130 (2µM) or DMSO was added to the medium. After 24 hours of incubation at 37 °C with 5% CO2, cells remaining on the outer surface of the Transwell insert were gently removed with a cotton swab. Migrated cells (adherent to the inner surface of the insert) were stained with 1.0% crystal violet and air-dried. To quantify the migration, inserts were incubated with 200 µl of 10%

acetic acid (v/v), the OD at 560 nm of the resulting solution was measured with a spectrophotometer (BMG Labtech).
Quantitative PCR and microarray analysis. Total RNA was isolated using the RNeasy Mini Kit (Qiagen) including an on-column DNase digestion (Qiagen) step. For quantitative PCR cDNA was synthesized using the iScriptTM Reverse Transcription Supermix (Bio-Rad). Expression levels were determined by quantitative PCR using iTaqTM SYBR® Green Supermix with ROX (Bio-Rad) on a StepOnePlusTM Real-Time PCR Systems (Applied Biosystems). The specific primers used in this study were listed in Table S6. GAPDH was used as a calibrator in the comparative CT method (ΔΔCT). All experiments were performed in triplicate.
For microarray analyses, the quality of the isolated RNA was analyzed using the Bio-Rad Experion System. RNA was then biotin labeled using the Illumina Total Prep kit (Ambion, AMIL-1791). The obtained cRNA was quality-checked again on the Experion System for labeling efficieny. Seven hundred and fifty ng cRNA was loaded onto the Illumina Human HT12v4.0 Expression Beadchip according to Illumina’s protocol. The array was hybridized and washed according to Illumina’s protocol, and subsequently scanned on the HiScan SQ (Illumina).
Bioinformatic analysis of WP1130 and ERG knockdown gene expression profiles. Following data extraction and normalization of the microarray data using GenomeStudio (Illumina), linear models for microarray data (LIMMA) (4) was used to identify genes that showed significant expression changes between the WP1130 or ERG knockdown samples and their corresponding controls. We used the following cut-offs to define significant transcript changes: adjusted p < 0.05 for ERG knockdown; adjusted p < 0.05 and log fold change of ≥1 and ≤-1 for WP1130-treated samples. Since there was a very significant overlap between the expression changes caused by ERG knockdown with two independent siRNAs (p-value < 8.62e-262), we used the union of these gene sets for further analyses. To explore the effects of WP1130-treatment on ERG-regulated gene expression, we identified genes whose expression changes were concordant in the ERG knockdown and WP1130-treatment experiments. We identified 103 commonly upregulated (p=1.86e-22, hypergeometric test) and 46 downregulated genes (p=9.25e-10, hypergeometric test).
To assess the enrichment of ERG and WP1130-regulated genes in VCaP cells in prostate cancer and ERG-relevant expression signatures we calculated the significance of the enrichment between all pairs of gene sets generated from our expression analyses and published expression data using Fisher’s exact test adjusted for multiple testing. Enrichment of gene sets enriched with p<0.001 were used for generating the concept map (Table S4). For the analysis of the expression data from Lapointe et al., we used 26 prostate tumor samples expressing high levels of ERG, which are shown in Table S5. We classified 5,153 genes whose expression was found to be significantly changed by Lapointe et al. as up- or downregulated genes based on the comparison between the ERG-expressing tumors and normal tissue samples. For the expression data of LaTulippe et al., we performed LIMMA and selected the differentially regulated genes with adjusted p < 0.05 and log fold change of ≥1 and ≤-1 between 9 metastatic prostate cancers and 23 primary prostate carcinomas. For Brenner et al., we used the gene lists provided by the authors. For the expression data of Chng et al., we performed LIMMA and selected the

differentially regulated genes with adjusted p < 0.05 between DHT treated ERG knock down samples and DHT-treated normal cells.
Cytoscape v2.8.2 (5) was used to visualize the overlap between WP1130-regulated genes and sets of genes relevant to prostate cancer or ERG function. The size of nodes in the concept map is proportional to the number of genes in a given gene set. The width of edges is proportional to the negative logarithm (base 10) of the adjusted p value for testing the enrichment between two gene sets.
Xenograft experiments. Male athymic nude mice were purchased from Harlan Laboratories, Inc. Prostate cancer cells were suspended in complete DMEM medium and mixed 1:1 (v/v) with Matrigel (BD Biosciences). One hundred microliter of VCaP cell (3x10⁶ cells/site, 2 sites/animal), PC3 cell (3x10⁵ cells/site, 2 sites/animal), Du-145 cell (2x10⁶ cells/site, 2 sites/animal), 22Rv1-vector cell and 22Rv1-ERG cells (4x10⁶ cells/site, 2 sites per animal) suspension were then injected subcutaneously into both flank regions of the mice. For LuCAP 86.2 xenografts, 6- to 8-week-old male SCID mice were orchiectomized for 1 week, then animals were implanted subcutaneously with tumor bits (20-30 mm3) of LuCaP 86.2 (ref). When tumor volume reached 60-90 mm3, animals were randomly divided into two groups, i.e. treatment vs. control. Tumor-bearing mice were injected with 100 µl of WP1130 suspension (40mg/kg) or vehicle (1:1[v/v], DMSO/PEG300) every other day for a total of four or five injections.
We tested the statistical significance between the normalized tumor volumes measured for WP1130- and vehicle-treated mice bearing VCaP, PC3, DU145, 22Rv1-vector or 22Rv1-ERG tumors, respectively. P values were calculated for 10,000 permutations with the compareGrowthCurves function from the Statistical Modeling package, statmod, available from the R Project (http://www.r-project.org).


Fig. S1. Analysis of the interaction of ERG and USP9X.
(A-D) Validation of the interaction of ERG with USP9X. (A) Bacterial GST or GST-ERG-His was purified. Pulldown was performed with VCaP cell extract and GST or GST-ERG-His beads. Eluted samples were analyzed by SDS-PAGE and probed for USP9X. The Asterisk indicates recombinant GST-ERG-His protein. Co-immunoprecipitation of ectopically expressed USP9X-FLAG with ERG-V5 (B), ERG-HA (C) or ERG-V5 (D) with USP9X-FLAG in HeLa cells with antibodies directed against V5 (B) FLAG (C,D). Immunoblotting was performed with antibodies against HA or V5 and FLAG. (E-G) Mapping of the interaction domain of ERG with USP9X. Co-immunoprecipitation of USP9X with HA-tagged ERG deletion mutants (E) in HeLa cells with an antibody against HA (F). Immunoblotting was performed with antibodies against HA and USP9X. (G) Pulldown of USP9X with ERG-ETS-GST. Bacterial GST or ERG-ETS-GST was purified. Pulldown was performed with VCaP cell extract and GST or ERG-ETS-GST beads. Eluted samples were analyzed by SDS-PAGE and probed for USP9X. (H) Interaction of USP9X with ETS transcription factors. Co-immunoprecipitation of endogenous USP9X with ectopically expressed ERG-ΔE-HA, ERG-HA, FLI1-HA, FEV-HA, ETV1-HA, ETV4-HA and ETV5-HA in HeLa cells using an HA antibody. Immunoblotting was performed with antibodies against HA or USP9X.

Fig. S2. USP9X protein expression in prostate cancer.
(A-C) Analysis of USP9X protein expression by IHC in a TMA of 35 prostate tumor samples. (A) Specificity of USP9X staining. Slides where stained for USP9X and hematoxylin in the presence or absence of the USP9X blocking peptide BP301-351 (1 µg/ml, Bethyl Laboratories). (B) USP9X protein levels are significantly higher in the 20 ERG-positive samples than in the 15 ERG-negative samples (p=0.0051, Sudent’s t test). (C) Representative images for USP9X staining and ERG staining in ERG-positive and ERG-negative samples. Scale bars are 100 µm. (D,E) Analysis of USP9X protein levels in 45 prostate tumor samples by immunoblotting. (D) USP9X protein levels are significantly higher in the 25 ERG-positive samples than in the 20 ERG-negative samples (p=0.0012, Student’s t test). Quantification was performed for the tumor samples by immunoblotting with antibodies against USP9X, ERG and GAPDH (E).

Fig. S3. USP9X stabilizes ERG by deubiquitination, which is inhibited by WP1130.
(A) K48-linked ubiquitination of ERG. HeLa cells were co-transfected with ERG-V5 and HA-K8- and HA-K63 ubiquitin expression constructs. After 24 hours ERG-V5 was immunoprecipitated, and immunoblotting was performed with antibodies against V5 and HA to detect ubiquitinated ERG (ub-ERG). (B) Expression of recombinant USP9X-FLAG and USP9X-mut-FLAG. FLAG-tagged USP9X and USP9X catalytically inactive mutant (C1566S) were expressed in HEK293T cells and immunoprecipitated with anti-FLAG M2 affinity gel. The quality and purity of the proteins were checked by SDS-PAGE and detection by Coomassie blue staining. (C) Analysis of USP9X deubiquitinase activity. Aliquots containing the same amounts of purified USP9X-FLAG or USP9X-mut-FLAG based on Coomassie blue staining (B) were incubated with 500 nM Ubquitin-AMC in deubiquitinase assay buffer for 1 hour at 37°C. After incubation, the AMC-fluorescence emission spectra were measured with a fluorometer. The emission maximum of released AMC is ~ 440 nm. (D) USP9X RNAi rescue experiment. Endogenous USP9X expression was knocked down with USP9X siRNA targeting the USP9X 3'UTR in HeLa cells. After 48 hours, USP9X-FLAG, USP9X-mut-FLAG or the empty vector were transfected, after another 48 hours immunoblot analysis was performed for USP9X, FLAG, ERG and GAPDH. (E) Cycloheximide (CHX) chase assay for ERG protein levels following USP9X knockdown in VCaP cells. VCaP cells were transfected with USP9X siRNA #2 or non-targeting siRNA (siNT) for 64 hours. Cells were then treated with CHX (20 µg/ml). ERG and GAPDH immunoblots were quantified with Image J using GAPDH intensity for normalization (n=3, error bars represent s.e.m.). (F) Analysis of USP9X inhibition by WP1130 in vitro. Reactions containing 10 nM USP9X-His and ubiquitinated ERG-V5 were incubated in the absence or presence of various concentrations of WP1130 for 1 hour at room temperature. Immunoblotting was performed with antibodies against V5, USP9X, and HA. (G) ERG depletion time course for WP1130 treatment of VCaP cells. VCaP cells were treated with 5 µM WP1130. Immunoblotting was performed with antibodies against ERG and GAPDH. (H) WP1130-mediated ERG depletion is mitigated by proteasome inhibition. VCaP cells were cultured in the presence or absence of WP1130 (5 µM) and MG132 (10 µM). Immunoblotting was performed with antibodies against ERG and GAPDH. (I) Effect of USP5, USP14 and UCHL5 knockdown on ERG protein levels in VCaP cells. Knockdown of USP5, USP14 and UCHL5 protein with specific siRNAs in VCaP cells. Deubiquitinase and ERG protein levels were determined in VCaP cells after 72 hours of USP5, USP14 and UCHL5 knockdown. Immunoblotting was performed with antibodies against ERG and GAPDH, USP5, USP15 or UCHL5. Quantification of triplicate immunoblot analysis for (D, G, H and I) is shown in Table S7.
!
!"#$
!%&'()
*+,*
-+*!.
/*''01!"#$
/*''01*20
!"#$/*''01
324*
!"#$
/*''0156758"9
-+*!.
:,-
"
#
$ ;4<=>?@A:,-5*245!=B?5
/*''015C<
;4D%E><<A"FG*5!=B?5
!.D5H5:,-,I+>5C<
:,-5,I+>5C<
!I+&*JKG5H*+,*'5,I+>5C<
:,-5,I+>5!=B?
;4<=>?@A:,-5*245C<
;4D%E><<A"FG*5C<
/*''015!=B?
!.D5H5:,-5,I+>5!=B?
%
&
'
!4LG' 0 ) M N
1
'
7
0
(
)
O G>ID
G>C#*NP
!4LG
,AE4@>FA5KAEE5<Q=E>RAQ4@>=?
' 0 ) M N1
'
7
0
(
)
O
M
S !"#$
/*''01
'SO1()M '10
/*''015C<
:,-5,I+>5C<
0S0 ''ON(O
/*''015!=B?
:,-5,I+>5!=B?
,AE4@>FA5K4G<4GA&0TM54K@>F>@L
6/*''01T!"#$9
*20 324*1
7
(
O
S
'1 758" )58"
!%&'()
,AE4@>FA5KAEE5<Q=E>RAQ4@>=?
"2;'
-+*!.
!"#$ /*''01
"2;'
-+*!.
"2;'
-+*!.324*
!%&'()
*20
(
)
*
+
,
U5=R5KAEE5V>WQ4@>=?56+)M15?V9
!"#$ /*''011
7)
)1
M)
'11
<X1Y111'
G>ID G>C#*NP G>:,-1
7)
)1
M)
'11<X1Y10MN
<X1Y11'7
U5=R5KAEE5V>WQ4@>=?56+)M15?V9
!"#$ /*''011
7)
)1
M)
'11
<X1Y'7SN
!"#$ /*''011
7)
)1
M)
'11
<X1YMNMO
U5=R5KAEE5V>WQ4@>=?56+)M15?V9
U5=R5KAEE5V>WQ4@>=?56+)M15?V9
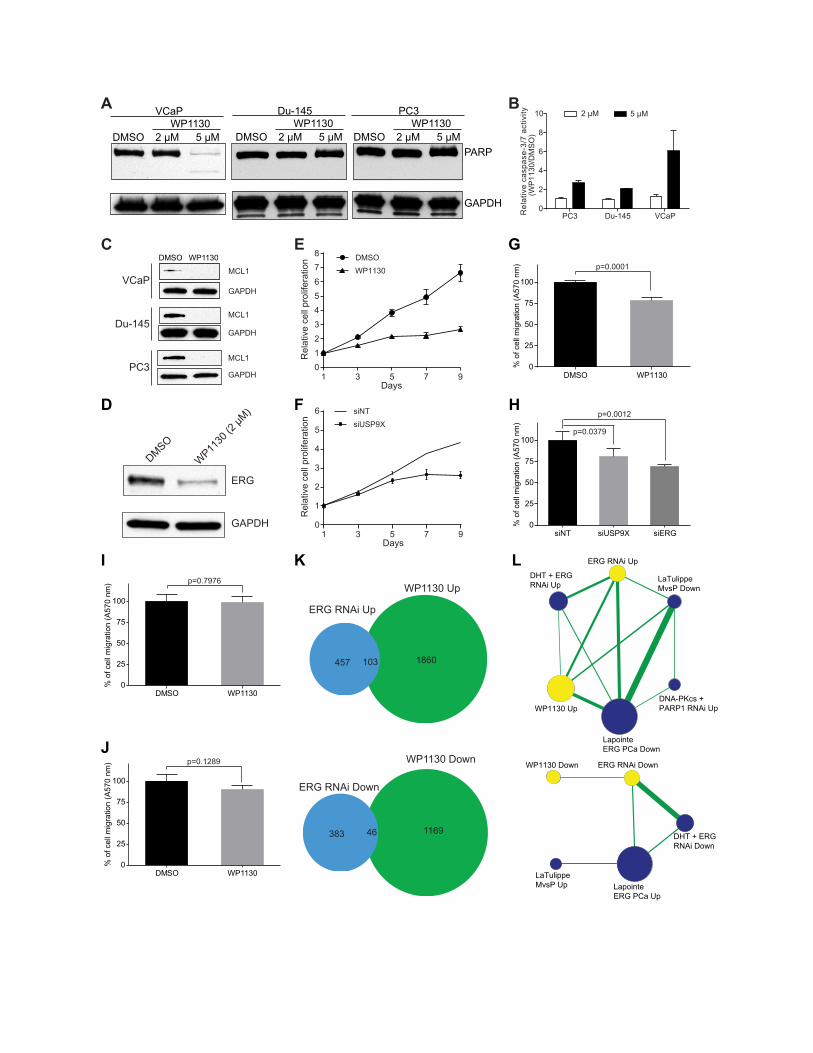
Fig. S4. Effects of WP1130 on prostate cancer cells.
(A,B) WP1130 causes apoptosis in VCaP cells. VCaP, Du-145 and PC3 cells were treated with WP1130 for 24 hours. Immunoblotting was performed with antibodies against PARP and GAPDH (A); caspase-3/7 activity was determined with a luminometric assay (B) (n=4, error bar represent s.d.). (C) Treatment with 2 µM WP1130 causes ERG depletion in VCaP cells after 24 hours. Immunoblotting was performed for ERG and GAPDH. (E) Treatment with 2 µM WP1130 inhibits VCaP cell proliferation. The difference to vehicle (DMSO) treatment becomes statistically significant (p<0.05, Student’s t test) three days after treatment (n=3, error bars represent s.e.m.). (F) USP9X knockdown with siUSP9X-2 inhibits VCaP cell proliferation. The difference to siNT becomes statistically significant (p<0.05, Student’s t test) five days after treatment (n=3, error bars represent s.e.m.). (G-J) Effect of WP1130 treatment, ERG and USP9X knockdown on cell migration. Transwell cell migration assay was performed for VCaP cells after WP1130 (2 µM) treatment (G) or ERG or USP9X depletion by RNAi (H). Treatment with 2 µM WP1130 does not significantly affect Du-145 (I) and PC3 (J) cells migration. (n=3; error bars represent s.d.; p values, Student’s t test). (K, L) WP1130 affects ERG-regulated gene expression in prostate cancer. Cells were treated with WP1130, or transfected with two different siRNAs against ERG. The mRNA expression levels were then assayed using microarrays. Venn diagrams (K) indicate a highly significant overlap overlap genes whose transcript levels were altered by the WP1130 treatment (Dataset S1) and by ERG siRNA knockdown (Dataset S2), which was observed for both the concordantly upregulated (2.86-fold enrichment, p=1.86e-22, hypergeometric test) and the concordantly downregulated genes (2.67-fold enrichment, p=9.25e-10, hypergeometric test). A concept map (L) for gene sets (blue nodes) with highly significant enrichment (adjusted p-value cut-off <0.001, Fisher’s exact test) in genes regulated by WP1130 treatment or ERG RNAi (yellow nodes) in VCaP cells. The node size is proportional to the number of genes in a given gene set. Edge width is proportional to the negative logarithm (base 10) of the adjusted p value for testing the enrichment between two gene sets: These results suggest that WP1130-mediated depletion of ERG causes a disruption of the ERG-regulated gene program. The more significant overlap between upregulated genes is consistent with ERG acting as a transcriptional repressor of genes whose expression is activated by androgen receptor (AR) (6, 7). We compared the overlap between WP1130 and ERG-regulated genes identified in our expression analyses and those compiled from publicly available expression data related to prostate cancer (8, 9) and ERG modulation of AR-regulated gene expression (6). We found a marked overlap of genes upregulated with WP1130 treatment (WP1130 Up) and ERG RNAi (ERG RNAi Up) in VCaP cells with sets of genes that are downregulated during the development of ERG-positive prostate tumors (Lapointe ERG PCa Down) and the progression from primary to metastatic prostate cancer (LaTulippe MvsP Down) (Figure 4a). Also, we found a significant overlap between genes upregulated after WP1130 treatment and ERG knockdown and those that are upregulated by the AR agonist dihydrotestosterone (DHT) in the absence of ERG (DHT+ERG RNAi Up) (6). These findings indicate that WP1130 counteracts ERG-mediated repression of genes during prostate carcinogenesis. Since a recent study reported a dependency of ERG-mediated invasion and cell growth on DNA-directed protein kinase catalytic subunit (DNA-PKcs) and poly (ADP-ribose) polymerase 1 (PARP-1) for ERG-mediated gene expression (10). Therefore we examined the overlap of genes whose expression is commonly changed upon DNA-PKcs and PARP-1 knockdown (10) with the gene sets described above. We found a highly significant overlap between the genes that were downregulated in ERG-overexpressing tumors and during metastatic progression of prostate cancer with the genes upregulated upon DNA-PKcs

and PARP-1 knockdown in VCaP cells (DNA-PKcs+PARP-1 RNAi Up). No significant overlap was found between genes whose expression was altered in these cells and those we observed in our transcriptome analysis of WP1130 treatment or ERG knockdown. This finding suggests that depletion of ERG by WP1130 or RNAi and knockdown of DNA-PKcs and PARP-1 may affect invasion and growth via different pathways in ERG-expressing prostate cancer cells.


Fig. S5. Effects of WP1130 on ERG levels and tumor growth in vivo.
(A) USP9X and ERG expression in 22Rv1, PC3, Du-145 and VCaP cells. Immunoblotting was performed with antibodies against USP9X, ERG, and GAPDH. (B,C) Microvessel density analysis in 22Rv1-vector, 22Rv1-ERG or VCaP xenografts upon WP1130 treatment. Representative images (B) of endomucin/hematoxylin stained tumor samples from mice treated with vehicle (DMSO) or WP1130 (40 mg/kg). Bar is 100 µm. Quantification of tumor microvessel density (C) (n=8; error bars represent s.d.; p values, Student’s t test). (D,E) Effect of WP1130 treatment on PC3 and Du-145 tumor growth. Tumor volumes in mice xenografted with PC3 (D) or Du-145 cells (E) that were treated upon appearance of tumors with 40 mg/kg WP1130 or vehicle (i.p.) every other day beginning on day 11 (D), or 10 (E) after cell injection. Error bars represent s.e.m. (F-I) Effect of WP1130 treatment on LuCaP 86.2 xenograft growth and microvessel density. Tumor volumes in mice xenografted with LuCaP 86.2 tumors that were treated with 40 mg/kg WP1130 or vehicle (i.p.) every other day (F). Error bars represent s.e.m. ERG protein levels (G) in WP1130- or vehicle-treated xenografts were analyzed by immunoblotting using GAPDH as loading control. Representative images (H) of endomucin/hematoxylin stained tumor samples from mice treated with vehicle (DMSO) or WP1130 (40 mg/kg). Bar is 100 µm. Quantification of tumor microvessel density (I) (n=4; error bars represent s.d.; p values, Student’s t test).
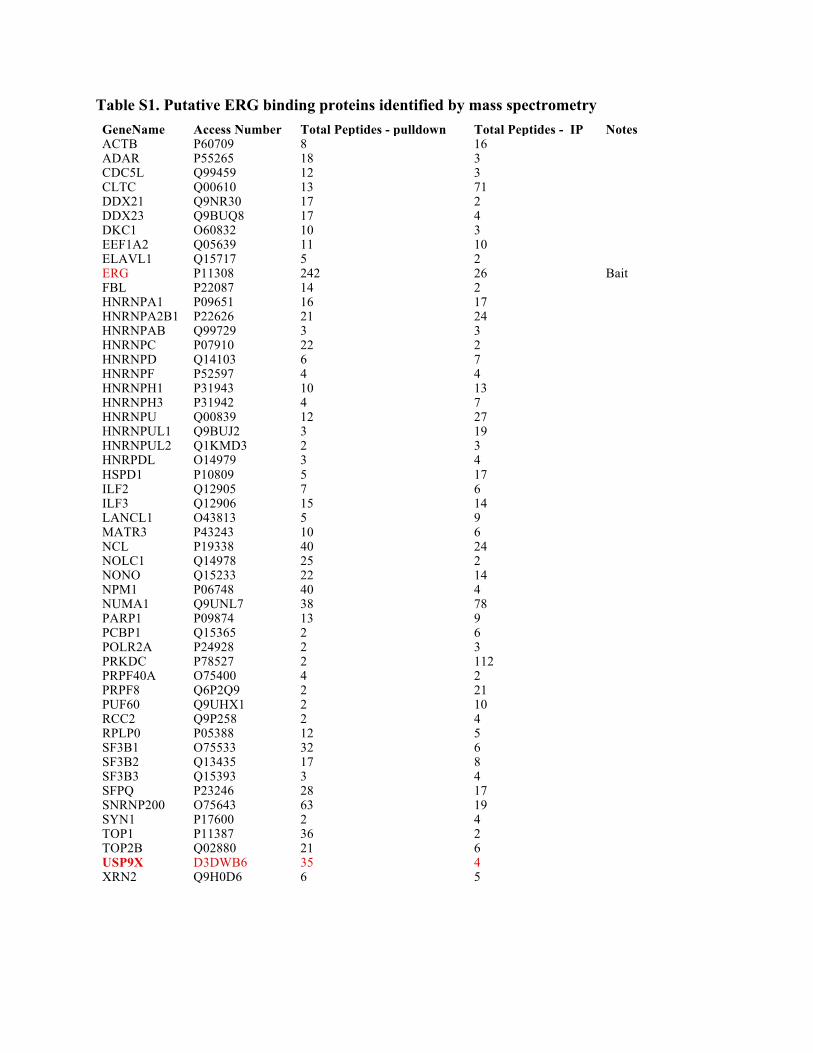
Table S1. Putative ERG binding proteins identified by mass spectrometry GeneName Access Number Total Peptides - pulldown Total Peptides - IP Notes ACTB P60709 8 16 ADAR P55265 18 3 CDC5L Q99459 12 3 CLTC Q00610 13 71 DDX21 Q9NR30 17 2 DDX23 Q9BUQ8 17 4 DKC1 O60832 10 3 EEF1A2 Q05639 11 10 ELAVL1 Q15717 5 2 ERG P11308 242 26 Bait FBL P22087 14 2 HNRNPA1 P09651 16 17 HNRNPA2B1 P22626 21 24 HNRNPAB Q99729 3 3 HNRNPC P07910 22 2 HNRNPD Q14103 6 7 HNRNPF P52597 4 4 HNRNPH1 P31943 10 13 HNRNPH3 P31942 4 7 HNRNPU Q00839 12 27 HNRNPUL1 Q9BUJ2 3 19 HNRNPUL2 Q1KMD3 2 3 HNRPDL O14979 3 4 HSPD1 P10809 5 17 ILF2 Q12905 7 6 ILF3 Q12906 15 14 LANCL1 O43813 5 9 MATR3 P43243 10 6 NCL P19338 40 24 NOLC1 Q14978 25 2 NONO Q15233 22 14 NPM1 P06748 40 4 NUMA1 Q9UNL7 38 78 PARP1 P09874 13 9 PCBP1 Q15365 2 6 POLR2A P24928 2 3 PRKDC P78527 2 112 PRPF40A O75400 4 2 PRPF8 Q6P2Q9 2 21 PUF60 Q9UHX1 2 10 RCC2 Q9P258 2 4 RPLP0 P05388 12 5 SF3B1 O75533 32 6 SF3B2 Q13435 17 8 SF3B3 Q15393 3 4 SFPQ P23246 28 17 SNRNP200 O75643 63 19 SYN1 P17600 2 4 TOP1 P11387 36 2 TOP2B Q02880 21 6 USP9X D3DWB6 35 4 XRN2 Q9H0D6 6 5

Table S2. Relative mRNA expression in VCaP cells after 72 hours USP9X knockdown.
siNT siUSP9X-2 siUSP9X-3 ERG 1.00±0.08 1.04±0.09 1.18±0.17 USP9X 1.00±0.03 0.03±0.003 0.07±0.01
Table S3. Relative mRNA expression in VCaP cells after 24 hours WP1130 treatment.
DMSO 5 µM WP1130 ERG 1.00±0.12 1.02±0.06 USP9X 1.00±0.07 0.98±0.06
Table S4. P values (Fisher’s exact test) for testing pairwise enrichment between gene sets.
Node 1 Node 2 Adjusted p value ERG RNAi Up WP1130 Up 1.738E-15 LaTulippe MvsP Down WP1130 Up 1.175E-10 Lapointe ERG Pca Down WP1130 Up 1.288E-22 DHT+ERG RNAi Up WP1130 Up 4.898E-05 ERG RNAi Down WP1130 Down 1.585E-06 LaTulippe MvsP Down ERG RNAi Up 8.318E-08 Lapointe ERG Pca Down ERG RNAi Up 2.239E-21 DHT+ERG RNAi Up ERG RNAi Up 4.677E-16 Lapointe ERG Pca Up ERG RNAi Down 1.479E-08 DHT+ERG RNAi Down ERG RNAi Down 1.349E-35 Lapointe ERG Pca Up LaTulippe MvsP Up 8.710E-08 Lapointe ERG Pca Down LaTulippe MvsP Down 1.318E-41 DNA-PKcs+PARP-1 RNAi Up LaTulippe MvsP Down 1.259E-05 DHT+ERG RNAi Down Lapointe ERG Pca Up 1.047E-08 DHT+ERG RNAi Up Lapointe ERG Pca Down 1.288E-07 DNA-PKcs+PARP-1 RNAi Up Lapointe ERG Pca Down 7.079E-06
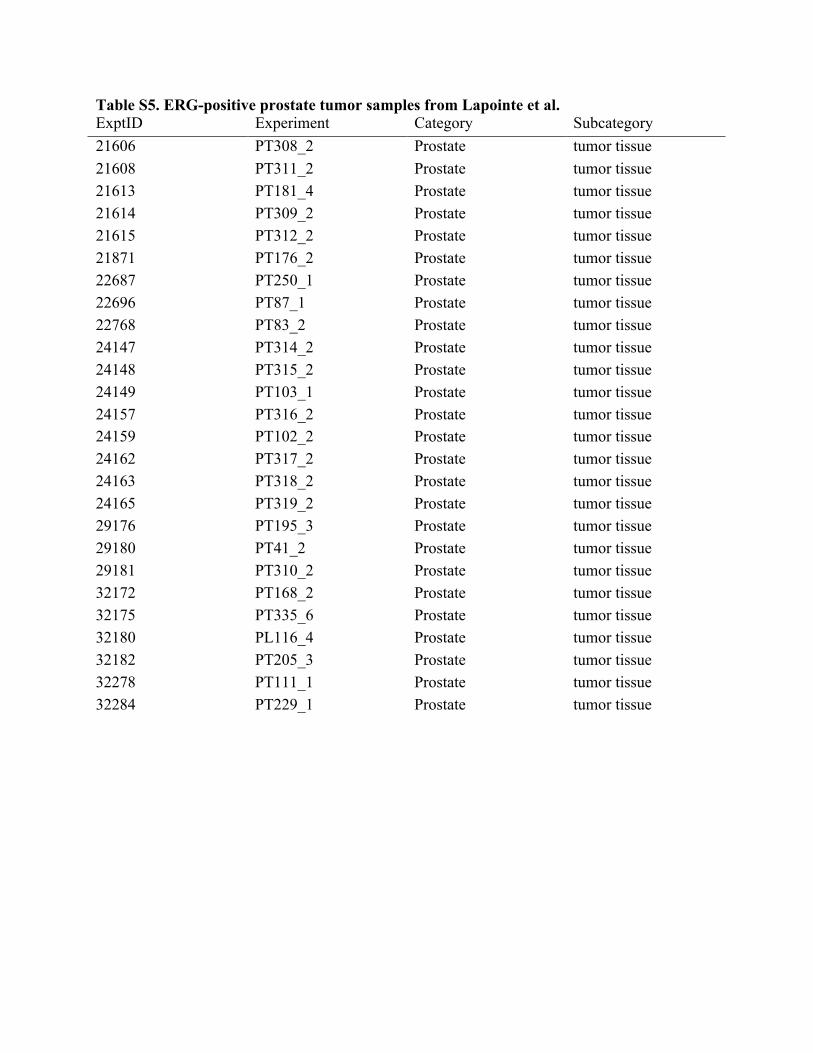
Table S5. ERG-positive prostate tumor samples from Lapointe et al. ExptID Experiment Category Subcategory 21606 PT308_2 Prostate tumor tissue 21608 PT311_2 Prostate tumor tissue 21613 PT181_4 Prostate tumor tissue 21614 PT309_2 Prostate tumor tissue 21615 PT312_2 Prostate tumor tissue 21871 PT176_2 Prostate tumor tissue 22687 PT250_1 Prostate tumor tissue 22696 PT87_1 Prostate tumor tissue 22768 PT83_2 Prostate tumor tissue 24147 PT314_2 Prostate tumor tissue 24148 PT315_2 Prostate tumor tissue 24149 PT103_1 Prostate tumor tissue 24157 PT316_2 Prostate tumor tissue 24159 PT102_2 Prostate tumor tissue 24162 PT317_2 Prostate tumor tissue 24163 PT318_2 Prostate tumor tissue 24165 PT319_2 Prostate tumor tissue 29176 PT195_3 Prostate tumor tissue 29180 PT41_2 Prostate tumor tissue 29181 PT310_2 Prostate tumor tissue 32172 PT168_2 Prostate tumor tissue 32175 PT335_6 Prostate tumor tissue 32180 PL116_4 Prostate tumor tissue 32182 PT205_3 Prostate tumor tissue 32278 PT111_1 Prostate tumor tissue 32284 PT229_1 Prostate tumor tissue

Table S6. Sequences for all primers and siRNAs. siRNAs siUSP9X-#1 5'-AGAAAUCGCUGGUAUAAAU-3' siUSP9X-#2 5'-GUACGACGAUGUAUUCUCA-3' siUSP9X-#3 5'-GAAAUAACUUCCUACCGAA-3' siERG-#1 5'-GAUCCUACGCUAUGGAGUA-3' siERG-#2 5'-GGACAGACUUCCAAGAUGA-3' siUSP5-#1 5'-GAGCUGACGUGUACUCAUA-3' siUSP5-#2 5'-GAAGUACACCCAGCGAGUU-3' siUSP14-#1 5'-GCAUAUCGCUUACGUUCUA-3' siUSP14-#2 5'-CAAGAUGAAUGGAUUAAGU-3' siUCHL5-#1 5'-GCAGUUAAUACCACUAGUA-3' siUCHL5-#2 5'-GAUAGCAGAGUUACAAAGA-3' Cloning Primers USP9X_CDS_F 5'-GGGGTACCATGACAGCCACGACTCGTGGCTC-3' Kpn I USP9X_CDS_R 5'-ACGCGTCGACTTGATCCTTGGTTTGAGGTGG-3' Sal I ERG_GST_F 5'-TCCCCCGGGGGAATGATTCAGACTGTCCCGGAC-3' Xma I ERG_GST_His_R 5'-CCGCTCGAGCTATCAGTGGTGGTGGTGGTGGTGGTAGTAAGTGCCCAGATGAG-3' Xho I ERG_TnT_F 5'-CCGCTCGAGATGATTCAGACTGTCCCGGAC-3' Xho I ERG_TnT_R 5'-TCCCCCGGGGTAGTAAGTGCCCAGATGAG-3' Xma I ERG_ΔNAD_F 5'-CCGCTCGAGATGAACTACGGCAGCTACATG-3' Xho I ERG_ΔNAD-PNT_F 5'-CCGCTCGAGATGCATGCTAGAAACACAGG-3' Xho I ERG_N951_R 5'-GCTCTAGACTGGCCACTGCCTGGATTTGCAAG-3' Xba I ERG_ΔE_F 5'-CTTGCAAATCCAGGCAGTGGCCAGTTCCACGGGATCGCCCAGGCCCTC-3' ERG_ΔE_R 5'-GAGGGCCTGGGCGATCCCGTGGAACTGGCCACTGCCTGGATTTGCAAG-3' ETV1_CDS_F 5'-CCGCTCGAGGGAATGGATGGATTTTATGACCAGC-3' Xho I ETV1_CDS_R 5'-GCTCTAGAATACACGTAGCCTTCGTTGTAG-3' Xba I ETV4_CDS_F 5'-CCGCTCGAGATGGAGCGGAGGATGAAAGC-3' Xho I ETV4_CDS_R 5'-GCTCTAGAGTAAGAGTAGCCACCCTTGG-3' Xba I ETV5_CDS_F 5'-CCGCTCGAGATGGACGGGTTTTATGATCAGC-3' Xho I ETV5_CDS_R 5'-GCTCTAGAGTAAGCAAAGCCTTCGGCATAG-3' Xba I FEV_CDS_F 5'-CCGCTCGAGATGAGACAGAGCGGCGCCTC-3' Xho I FEV_CDS_R 5'-GCTCTAGAGTGGTAATGGCCCCCCAAG-3' Xba I FLI1_CDS_F 5'-CCGCTCGAGATGGACGGGACTATTAAGGAG-3' Xho I FLI1_CDS_R 5'-GCTCTAGAGTAGTAGCTGCCTAAGTGTGAAG-3' Xba I esiRNA primers USP9X_F 5'-TCACTATAGGGAGAGCCTAATCAACATGGAGTGGAGA-3' USP9X_R 5'-TCACTATAGGGAGACCAATTTTCCACATCAACCA-3' Realtime PCR primers ERG_F 5'-CGCAGAGTTATCGTGCCAGCAGAT-3' ERG_R 5'-CCATATTCTTTCACCGCCCACTCC-3' USP9X_F 5'- CAAAGCAATGAAACGTCCAA -3' USP9X_R 5'- GGTGGAGGCGACTCATGTT -3' GAPDH_F 5'-CGACCACTTTGTCAAGCTCA-3' GAPDH_R 5'-AGGGGAGATTCAGTGTGGTG-3' qUsp5-F 5'-CGGGACCAGGCCTTGAA-3' qUsp5-R 5'-TCGTCAATGTGACTGAAGATCCA-3' qUSP14-F 5'-AACGCTAAAGGATGATGATTGGG-3' qUSP14-R 5'-TTTGGCTGAGGGTTCTTCTGG-3' qUCHL5-F 5'-ACTTGCAGAGGAGGAACCCA-3' qUCHL5-R 5'-GCTGGTGTTCTGCTAAAGTCT-3'

Table S7. Quantification of triplicate immunoblot experiments.
Fig.2C NT siUSP9X-1 siUSP9X-2 siUSP9X-3 USP9X 1 0.30 0.15 0.24 Ave 0 0.05 0.10 0.17 SD ERG 1 0.51 0.18 0.37 Ave 0 0.18 0.12 0.13 SD Fig.2E DMSO WP1130-1µM WP1130-2µM WP1130-3µM WP1130-4µM WP1130-5µM ERG 1 0.79 0.43 0.39 0.23 0.04 Ave 0 0.02 0.11 0.07 0.13 0.02 SD Fig.S3D
siNT+empty vector
siUSP9X+empty vector
siUSP9X+USP9X-Δ3'UTR-FLAG
siUSP9X+USP9X-mut-Δ3'UTR-FLAG
USP9X 1 0.10 0.51 0.48 Ave 0 0.02 0.07 0.04 SD FLAG 1 0.93 Ave 0 0.15 SD ERG 1 0.40 0.79 0.45 Ave 0 0.04 0.06 0.07 SD Fig. S3G 0h 2h 4h 6h 8h ERG 1 0.79 0.54 0.31 0.22 Ave 0 0.12 0.09 0.14 0.14 SD Fig. S3H DMSO WP1130 MG132 WP1130+MG132 ERG 1 0.31 1.22 0.76 Ave 0 0.01 0.19 0.11 SD Fig. S3I USP5 siNT siUSP5-1 siUSP5-2 USP9X 1 0.16 0.10 Ave 0 0.07 0.07 SD ERG 1 0.96 0.90 Ave 0 0.03 0.09 SD USP14 siNT siUSP14-1 siUSP14-2 USP9X 1 0.16 0.21 Ave 0 0.07 0.08 SD ERG 1 1.03 0.75 Ave 0 0.04 0.19 SD UCHL5 siNT siUCHL5-1 siUCHL5-2 USP9X 1 0.09 0.09 Ave 0 0.03 0.00 SD ERG 1 1.07 0.92 Ave 0 0.01 0.02 SD
Supplemental References 1. Morgan SM, Samulowitz U, Darley L, Simmons DL, & Vestweber D (1999)
Biochemical characterization and molecular cloning of a novel endothelial-specific sialomucin. Blood 93(1):165-175.
2. Sen A, et al. (2012) Paxillin mediates extranuclear and intranuclear signaling in prostate cancer proliferation. J Clin Invest 122(7):2469-2481.
3. Kittler R, Heninger AK, Franke K, Habermann B, & Buchholz F (2005) Production of endoribonuclease-prepared short interfering RNAs for gene silencing in mammalian cells. Nat Methods 2(10):779-784.
4. Smyth GK (2004) Linear models and empirical bayes methods for assessing differential expression in microarray experiments. Stat Appl Genet Mol Biol 3:Article3.
5. Smoot ME, Ono K, Ruscheinski J, Wang PL, & Ideker T (2011) Cytoscape 2.8: new features for data integration and network visualization. Bioinformatics 27(3):431-432.
6. Chng KR, et al. (2012) A transcriptional repressor co-regulatory network governing androgen response in prostate cancers. EMBO J.
7. Yu J, et al. (2010) An integrated network of androgen receptor, polycomb, and TMPRSS2-ERG gene fusions in prostate cancer progression. Cancer Cell 17(5):443-454.
8. Lapointe J, et al. (2004) Gene expression profiling identifies clinically relevant subtypes of prostate cancer. Proc Natl Acad Sci U S A 101(3):811-816.
9. LaTulippe E, et al. (2002) Comprehensive gene expression analysis of prostate cancer reveals distinct transcriptional programs associated with metastatic disease. Cancer Res 62(15):4499-4506.
10. Brenner JC, et al. (2011) Mechanistic rationale for inhibition of poly(ADP-ribose) polymerase in ETS gene fusion-positive prostate cancer. Cancer Cell 19(5):664-678.


![Supplemental ata or...2 Am. . Enol. Vitic. Supplemental ata or: d ., e nc nd tne de Tod &KDUDFWHUL]DWLRQDQGLGHQWL¿FDWLRQRIPLQRULW\UHGJUDSHYDULHWLHVUHFRYHUHGLQ5LRMD 6SDLQ](https://static.documents.pub/doc/80x56/5e9a76b1fff09b522812d462/supplemental-ata-or-2-am-enol-vitic-supplemental-ata-or-d-e-nc-nd-tne.jpg)


