Supplementary Figure 1. Phenotype and genotype of cultured and transplanted S1 KCST (A) Brightfield and mCherry fluorescence images of the spheres generated from the CD133-positive cells infected with either Control- NeoR or KRAS-NeoR. (B) Transplanted pancreas with S1 KCST spheres. Yellow arrows indicate the cyst-like structures found during pancreas dissection. (C) Representative images of H&E and Alcian blue staining from S1 KCST cultured spheres (left) and transplanted mice (right). Note that no alcian blue-positive cytoplasm in cultured spheres. Scale Bars, 100μM. (D) Indel spectrum images of TIDE analysis for S1 KCST spheres. Red and black bars show p < 0.05 and p > 0.05, respectively. Orange bar shows the peak with no Indel mutations.
Transcript
Supplementary Figure 1. Phenotype and genotype of cultured and transplanted S1 KCST
(A) Brightfield and mCherry fluorescence images of the spheres generated from the CD133-positive cells infected with either Control-
NeoR or KRAS-NeoR. (B) Transplanted pancreas with S1 KCST spheres. Yellow arrows indicate the cyst-like structures found
during pancreas dissection. (C) Representative images of H&E and Alcian blue staining from S1 KCST cultured spheres (left) and
transplanted mice (right). Note that no alcian blue-positive cytoplasm in cultured spheres. Scale Bars, 100µM. (D) Indel spectrum
images of TIDE analysis for S1 KCST spheres. Red and black bars show p < 0.05 and p > 0.05, respectively. Orange bar shows the
peak with no Indel mutations.
Supplementary Figure 2. Phenotype and genotype of cultured and transplanted S2 and S3 spheres
(A and B) Indel spectrum images of TIDE analysis for S2 KECST (A) and S3 KECST (B) spheres. (C) Transplanted pancreas with S2
and S3 KECST spheres. Yellow arrows indicate the cyst-like structures found during pancreas dissection.
Supplementary Figure 3. Immunohistochemistry with antibodies against phospho-ERK and phospho-AKT
Human PDA, PanIN, and pancreas transplanted with S1 KCST, S2 KECST, and S3 KECST spheres was stained with anti-phospho-
ERK and phospho-AKT antibodies. Note that phospho-AKT signal is weak or absent in human native PanIN and all transplanted
hiPanIN lesions. Scale Bars, 200µM.
Supplementary Figure 4. Phenotype and genotype of cultured and transplanted spheres
(A-C) H&E and Alcian blue staining of the transplanted S2 KECST (A and B) and S3 KECST (B) spheres. (D) Pancreas transplanted
with S2 KECST spheres was stained with human nuclear-specific antibody (HuNu, white) and mCherry fluorescence (red) along with
DAPI nuclear staining (blue). Note that neither mCherry- nor HuNu-positive cells were found in mouse duct of the same pancreas.
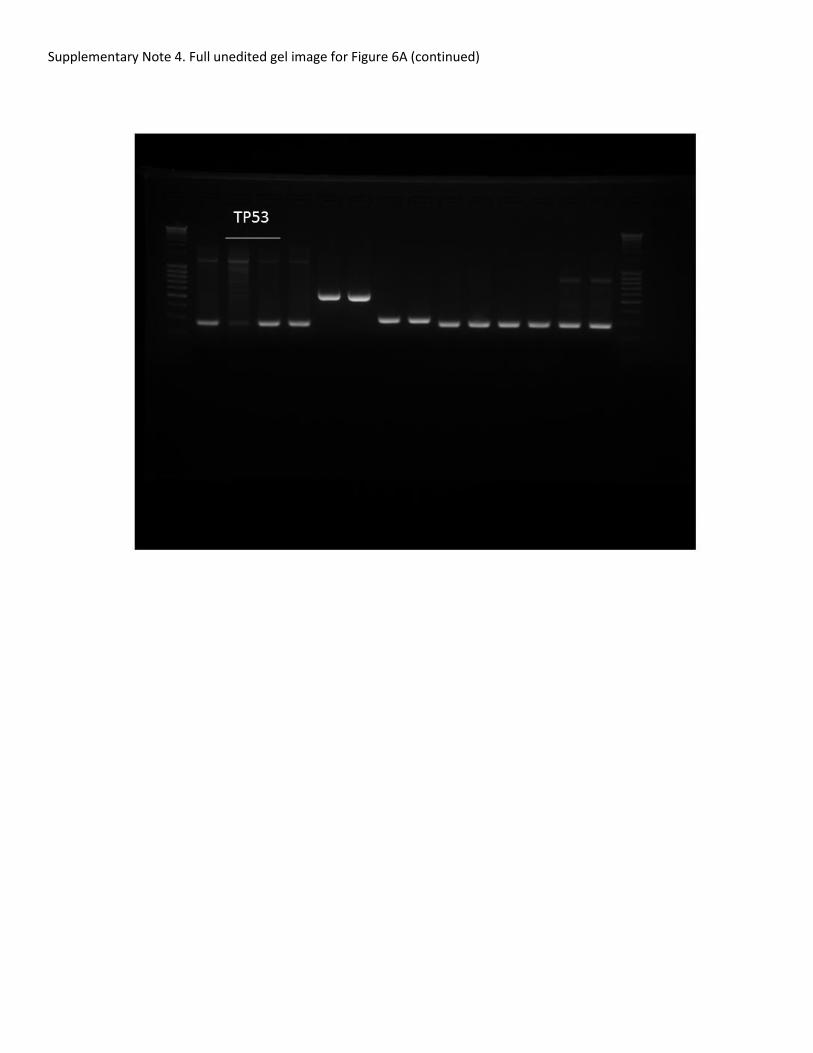
Magnified view of the boxed areas are shown to the right. Scale Bars, 200µM. (E) Genomic DNA PCR of cloned spheres for assessing
the presence of lentiviral transgenes. Numbers on top denote clone numbers.
Supplementary Figure 5. Immunohistochemistry with anti-human mitochondria antibody
Pancreas transplanted with S1 KCST, S2 KECST, and S3 KECST spheres was stained with anti-human mitochondria antibody. Scale
Bars, 200µM.
Supplementary Figure 6. Hematoxylin and Eosin and anti-human mitochondria antibody staining on serial sections
Serial sections of the pancreas transplanted with S2 KECST (ID 187) spheres were stained with H&E and anti-human mitochondria
antibody. Scale Bars, 200µM.
Supplementary Figure 7. Genotype and phenotype of S2 KCTclone3
(A) TIDE Indel spectrum images of TIDE analysis for S2 KCTclone3. Note that Indel spectrum for CDKN2A is not available due to the
large size of deletion. (B) Genomic DNA sequences of CRISPR-Cas9-targeted loci. The numbers next to the gene names indicate the
total number of nucleotide deleted or inserted. Arrows indicate the expected cut site by Cas9 nuclease. (C) H&E staining of the human
grafts found in transplanted pancreas with S2 KCTclone3. Scale Bars, 200µM.
Supplementary Figure 8. Genotype and phenotype of S1 clones
(A and B) TIDE Indel spectrum images of TIDE analysis for S1 KCSTclone3 (A) and S1 KCSTclone3 (B). (C and D) Genomic DNA
sequences of CRISPR-Cas9-targeted loci for S1 KCSTclone3 (C) and S1 KCSTclone3 (D). The numbers next to the gene names indicate
the total number of nucleotide deleted or inserted. Arrows indicate the expected cut site by Cas9 nuclease.
Supplementary Figure 9. H&E images of S1 clones
(A-B) H&E staining of PanIN structures found in transplanted pancreas with S1 KCSTclone4. (A) and S1 KECSTclone4 (B). Note that the
PanIN structures show cribriforming (A, ID203), abnormal nuclei (yellow arrows), and necrotic cells in the lumen (red arrows),
features of human PanIN2 and 3. Magnified images are shown on right. (C) Relative mRNA expression level of ERBB2 transgene
Error bars = S.D. n = 2. Scale Bars, 200µM.
Supplementary Figure 10. Genotype and phenotype of S2 KCSTclone8
(A) TIDE Indel spectrum images of TIDE analysis for S2 KCSTclone8. (B) Genomic DNA sequences of CRISPR-Cas9-targeted loci for
S2 KCSTclone8. The numbers next to the gene names indicate the total number of nucleotide deleted or inserted. Arrows indicate the
expected cut site by Cas9 nuclease. (C) H&E staining of PanIN structures found in transplanted pancreas with S2 KCSTclone8. Scale
Bars, 200µM.
Supplementary Figure 11. Off-target analysis result of S1 KCSTclone3
Off-target analysis result of S1 KCSTclone3. See Supplementary Table 4.
Supplementary Figure 12. Off-target analysis result of S1 KCSTclone4
Off-target analysis result of S1 KCSTclone4. See Supplementary Table 4.
Supplementary Figure 13. Off-target analysis result of S2 KCTclone3
Off-target analysis result of S2 KCTclone3. See Supplementary Table 4.
Supplementary Figure 14. Off-target analysis result of S2 KCSTclone8
Off-target analysis result of S2 KCSTclone8. See Supplementary Table 4.
Supplementary Figure 15. Genetic modification of human ductal cell line HPDE induces invasive PDA development
(A) Indel spectrum images of TIDE analysis for HPDEKECST (B) Schematics of lentiCRISPRv2 and new sets of sgRNA sequences
(KECST2). (C) Genomic DNA PCR for assessing the presence of lentiviral transgenes in HPDE cells. (D) Relative mRNA expression
level of oncogenic KRAS and ERBB2 transgene. Error bars = S.D. (E) Indel efficiency of each genomic loci assessed by TIDE
analysis. (F) Stereoscopic and representative H&E and CK19 (green) staining images of the tumors formed in the transplanted
pancreas with HPDEKECST2. Red arrows indicate tumor nodules. (G) Representative H&E staining of spleen with metastatic cells
found in ID 215. The metastatic cells are CK19-positive (green, bottom). (H) Stereoscopic and representative H&E staining images of
the tumors formed in the transplanted pancreas with HPDEKCST2. Scale Bars, 200µM.
Supplementary Table 1. Phenotypes of pancreas donors
ANONYMOUS ID AGE (YEAR) GENDER BODY MASS INDEX
S1 54 M 40.3
S2 40 F 25.2
S3 51 M 28.4
Supplementary Table 2. List of PanIN-like structures in transplanted mouse pancreas
SAMPLE ID MOUSE ID HUMAN
GRAFT FOUND
PATHOLOGY REVIEW
S1 KCST 192 YES PanIN1
193 YES PanIN1
194 YES PanIN1
S2 KECST 179 YES PanIN1, PanIN2
180 YES PanIN2
181 NO N/A
185 YES PanIN1
186 YES PanIN1
190 YES PanIN2
S3 KECST 187 YES PanIN1
188 YES PanIN1, PanIN2
191 YES PanIN1
Supplementary Table 3. List of isolated sphere clones and their genotypes
Sample ID Clone
ID
Presence of Transgenes Indel mutation status
Note
K E C S T CDKN2A SMAD4 TP53
S1 KCST 3 Y N Y Y Y -32/-5 -22/-20 -4/-4 S1 KCSTclone3
4 Y N Y Y Y -28/-10 -65/-5 -4/5 S1 KCSTclone4
5 Y N Y Y Y -22/-22 -2/-5 -6/-85
6 Y N Y Y Y -12/-10 -24/-2 -21/-21
7 Y N Y Y Y -9/-9 -5/-1 -12/-6
9 Y N Y Y Y -29/-5 -5/-1 -12/-6
10 Y N Y Y Y -12/-5 -5/-1 -12/-6
11 Y N Y Y Y -12/-76 -5/-5 -6/-4
12 Y N Y Y Y -35/-35 -5/-5 -12/1
13 Y N Y Y Y N/D -5/-5 -6/-4
14 Y N Y Y Y -5/-4 0/-13 -11/4
15 Y N Y Y Y N/D -5/-5 -6/-4
16 Y N Y Y Y N/D -5/-5 -6/-4
17 Y N Y Y Y -36/-5 N/D N/D
18 Y N Y N Y -21/-28 0/0 -12/4
S2 KECST 3 Y N Y N Y -95/-95 0/0 +1/+1 S2 KCTclone3
7 Y N Y Y Y -25/-5 -2/-2 N/D
8 Y N Y Y Y -17/-17 -2/+1 -1/-1 S2 KCSTclone8
S3 KECST 2 Y Y Y Y Y -21/-21 -6/-6 -6/-6
4 Y Y Y Y Y -21/-21 -6/-6 -6/-6
7 Y Y Y Y Y -21/-21 -6/-6 -6/-6
Supplementary Table 4. Off-target analysis result
sgRNA
human
chromosome alignment(dots are matched bp) off-target score Note
CDKN2A#1 Query_1 ACCGTAACTATTCGGTGCGTNGG
activity=1 when
PAM=NGG
Ch9:21974692-
21974714 ....................T.. 1
CDKN2A
locus
Ch7:153288832-
153288851 ....A..........T.T.. 0.113715
CDKN2A#1
OFF1
Query_1 ACCGTAACTATTCGGTGCGTNaG
activity=0.4 when
PAM=NAG
Ch2:204638735-
204638720 .............A.. 0.10188864
CDKN2A#1
OFF2
SMAD4#1 Query_1 ACAACTCGTTCGTAGTGATANGG
activity=1 when
PAM=NGG
Ch18:48575216-
48575194 ....................T.. 1
SMAD4
locus
Ch7:68734529-
68734509 .....T..T.........G.. 0.442225
SMAD4#1
OFF1
TP53#2 Query_1 GGGCAGCTACGGTTTCCGTCNGG
activity=1 when
PAM=NGG
Ch17:7579375-
7579353 ....................T.. 1 TP53 locus
Supplementary Table 5. Tumors found in mouse pancreas transplanted with transduced HPDE cells