12 June 2015 Update | Sector: Media PVR Niket Shah ([email protected]); +91 22 3982 5426 Atul Mehra ([email protected]); +91 22 3982 5417 BSE SENSEX S&P CNX CMP: INR650 TP: INR775 (+19%) Buy 26,425 7,983 Bloomberg PVRL IN Equity Shares (m) 41.4 M.Cap. (INR b) / (USD b) 28.2/0.5 52-Week Range (INR) 751/465 1, 6, 12 Rel. Per (%) 6/-1/15 Avg Val (INRm)/Vol ‘000 69/104 Free float (%) 70.5 Financials & Valuation (INR b) Y/E MAR 2015 2016E 2017E Net Sales 14.8 17.6 22.9 EBITDA 2.1 2.7 3.8 Adj PAT 0.1 0.3 0.9 EPS (INR) 3.3 6.1 18.4 Gr.(%) -77.7 81.9 203.3 BV/Sh INR 98.5 166.3 181.9 RoE (%) 3.4 4.8 10.6 RoCE (%) 8.9 9.0 12.7 P/E (x) 194.2 106.8 35.2 P/BV (X) 6.6 3.9 3.6 Shareholding pattern (%) As on Mar-15 Dec-14 Mar-14 Promoter 29.5 29.6 28.9 DII 7.7 4.7 4.4 FII 23.5 26.2 19.5 Others 39.3 39.5 47.2 FII Includes depository receipts Stock Performance (1-year) DT to strengthen PVR’s dominance in NCR Synergies galore in F&B and advertising To acquire DT Cinemas for INR5b; raise INR3.5b fresh equity to fund the deal: PVR acquired DT Cinemas from DLF for INR5b. DT Cinemas currently has 29 operational screens (10 upcoming)—primarily in Delhi, Gurgaon and Chandigarh; its presence in DLF malls gives it a huge locational advantage, resulting in heavy footfalls. The acquisition gives PVR the right of first refusal in malls that DLF will develop in future. PVR has announced that it will raise (subject to shareholder approval) INR3.5b (INR700/share) in fresh equity from Multiples Private Equity to fund the deal. This preferential allotment will dilute PVR’s equity by 10.7%. Deal to strengthen PVR’s dominance in NCR; synergies galore in F&B and advertising: PVR’s market share will increase to 21% NCR following the deal, thereby strengthening its dominance in the region. DT Cinemas’ Average Ticket Price (ATP) and F&B spend per head (SPH)—at INR250 and INR95, respectively— are higher than PVR, owing to its presence in NCR and premium audience base. The management believes while ATP increase in DT properties will be similar to PVR’s NCR properties going forward, F&B margins can improve significantly with PVR’s scale and expertise coming into picture. With NCR being a high-advertising market, PVR’s management believes it has strong room to improve ad revenue per screen in the DT properties going forward. DT’s long-term, revenue-sharing agreement for rentals provide growth and margin visibility: DT Cinema’s average circuit age of less than six years, long- term rental agreements (~18 year contracts) and advantage of being present in high-end malls made it an attractive asset from an acquisition perspective. Majority of DT’s rental agreements are structured as ~15% revenue-sharing contacts (superior to PVR’s current rental cost of 18.5%), resulting in savings on rentals. Another advantage for PVR is that refurbishing cost for DT properties will be insignificant (restricted to re-branding activities) as it already has a strong circuit with good finishes, technology and fit outs. Valuation and view: We believe the acquisition fits completely with PVR’s business model, with full set of synergies in F&B and advertising likely to materialize over next the 12-18 months. With DT acquisition adding ~39 screens and PVR targeting to open 60 new screens annually over the next two years, we expect total screen count at ~608 by FY17 strengthening PVRs numero uno position in multiplex business in India. We expect 24% revenue CAGR and 37% EBTDA CAGR over FY15-17 on the back of better outlook for content in FY16 and expected revival in discretionary spends. We model DT Cinemas’ acquisition and consequent dilution to fund the deal and, hence upgrade FY17 EBITDA by 13%, build higher debt (20% vs earlier forecast) and dilution (10.7%). We value PVR at 11x FY17E EV/EBITDA. Maintain Buy with a revised target price of INR775. Investors are advised to refer through disclosures made at the end of the Research Report. Motilal Oswal research is available on www.motilaloswal.com/Institutional-Equities , Bloomberg, Thomson Reuters, Factset and S&P Capital.
As on Mar-15 Dec-14 Mar-14 Promoter 29.5 29.6 28.9
DII 7.7 4.7 4.4
FII 23.5 26.2 19.5 Others 39.3 39.5 47.2
FII Includes depository receipts
Stock Performance (1-year)
DT to strengthen PVR’s dominance in NCR Synergies galore in F&B and advertising
To acquire DT Cinemas for INR5b; raise INR3.5b fresh equity to fund the deal: PVR acquired DT Cinemas from DLF for INR5b. DT Cinemas currently has 29 operational screens (10 upcoming)—primarily in Delhi, Gurgaon and Chandigarh; its presence in DLF malls gives it a huge locational advantage, resulting in heavy footfalls. The acquisition gives PVR the right of first refusal in malls that DLF will develop in future. PVR has announced that it will raise (subject to shareholder approval) INR3.5b (INR700/share) in fresh equity from Multiples Private Equity to fund the deal. This preferential allotment will dilute PVR’s equity by 10.7%.
Deal to strengthen PVR’s dominance in NCR; synergies galore in F&B and advertising: PVR’s market share will increase to 21% NCR following the deal, thereby strengthening its dominance in the region. DT Cinemas’ Average Ticket Price (ATP) and F&B spend per head (SPH)—at INR250 and INR95, respectively—are higher than PVR, owing to its presence in NCR and premium audience base. The management believes while ATP increase in DT properties will be similar to PVR’s NCR properties going forward, F&B margins can improve significantly with PVR’s scale and expertise coming into picture. With NCR being a high-advertising market, PVR’s management believes it has strong room to improve ad revenue per screen in the DT properties going forward.
DT’s long-term, revenue-sharing agreement for rentals provide growth and margin visibility: DT Cinema’s average circuit age of less than six years, long-term rental agreements (~18 year contracts) and advantage of being present in high-end malls made it an attractive asset from an acquisition perspective. Majority of DT’s rental agreements are structured as ~15% revenue-sharing contacts (superior to PVR’s current rental cost of 18.5%), resulting in savings on rentals. Another advantage for PVR is that refurbishing cost for DT properties will be insignificant (restricted to re-branding activities) as it already has a strong circuit with good finishes, technology and fit outs.
Valuation and view: We believe the acquisition fits completely with PVR’s business model, with full set of synergies in F&B and advertising likely to materialize over next the 12-18 months. With DT acquisition adding ~39 screens and PVR targeting to open 60 new screens annually over the next two years, we expect total screen count at ~608 by FY17 strengthening PVRs numero uno position in multiplex business in India. We expect 24% revenue CAGR and 37% EBTDA CAGR over FY15-17 on the back of better outlook for content in FY16 and expected revival in discretionary spends. We model DT Cinemas’ acquisition and consequent dilution to fund the deal and, hence upgrade FY17 EBITDA by 13%, build higher debt (20% vs earlier forecast) and dilution (10.7%). We value PVR at 11x FY17E EV/EBITDA. Maintain Buy with a revised target price of INR775.
Investors are advised to refer through disclosures made at the end of the Research Report.
Motilal Oswal research is available on www.motilaloswal.com/Institutional-Equities, Bloomberg, Thomson Reuters, Factset and S&P Capital.
DT Cinemas acquired for INR5b; INR3.5b fresh equity raised to fund the deal PVR has acquired DT Cinemas for an enterprise value of INR5b (debt-free) from DLF. DT Cinemas currently has 29 operational screens (10 upcoming screens) located primarily in Delhi, Gurgaon and Chandigarh regions and enjoys heavy footfalls led by locational advantage of being in DLF malls. Along with existing and upcoming 10 screens, his acquisition also gives PVR the right of first refusal in malls that DLF will develop in future. PVR has announced that it will raise (subject to shareholder approval) INR3.5b (INR700/share) in fresh equity from Multiple Private Equity to fund this deal. This preferential allotment will result in 10.7% dilution in PVR’s equity. PVR management believes the deal is done at 11-12x FY17E EV/EBITDA.
The payout for the transaction is partly conditional. While payout for the 29 operational screens of INR3.5b is immediate; the cost for 10 screens under development amounting to INR1.5b will be paid in a phased manner when milestones are achieved (screens are ready for operations). Management highlighted that INR1b will be paid when 7 screens in Noida (The Mall of India), get operational (which is expected in 4-6 months) while balance INR0.5b will be paid when 3 screens in New Delhi (Chanakyapuri) get operational (expected in 4QFY16).
DT Cinemas in FY15 attracted 4m footfalls and occupancy of ~30%. Once this deal gets through, PVR will further its market leadership based on number of screens from existing 467 to 506. PVR will be making the necessary regulatory applications in the next 30 days and expects the deal to be consummated over next 4-6 months. Management expects this deal the go through CCI approval without any difficulty as even post the deal, due to high number of single screens in Delhi NCR region the combined seats market share for PVR and DT combined will be ~21%. Exhibit 1: Multiples PE (through three distinct funds) invests INR3.5b for 10.7% stake Fund Shares (m) Value (INR b) Plenty PE Fund I Ltd 4.1 2.9 Multiples PE fund II LLP 0.4 0.3 Plenty CI Fund I Limited 0.4 0.3 Total 5.0 3.5
Source: Company, MOSL
Exhibit 2: DT Cinemas has strong presence in NCR region with 39 screens City Location Screens
New Delhi DLF Promenade Mall, Vasant Kunj 7
New Delhi DLF Place Mall, Saket 6
Gurgaon DLF Mega Mall 3
Gurgaon DLF City Centre 3
New Delhi DLF City Centre, Shalimar Bagh 4
Chandigarh DLF City Centre 3
Gurgaon DLF Star Mall 2
New Delhi Greater Kailash II 1
Noida (Upcoming) The Mall of India 7
New Delhi (Upcoming) Chanakyapuri 3
Total
39
Source: Company, MOSL
12 June 2015 3
PVR Ltd
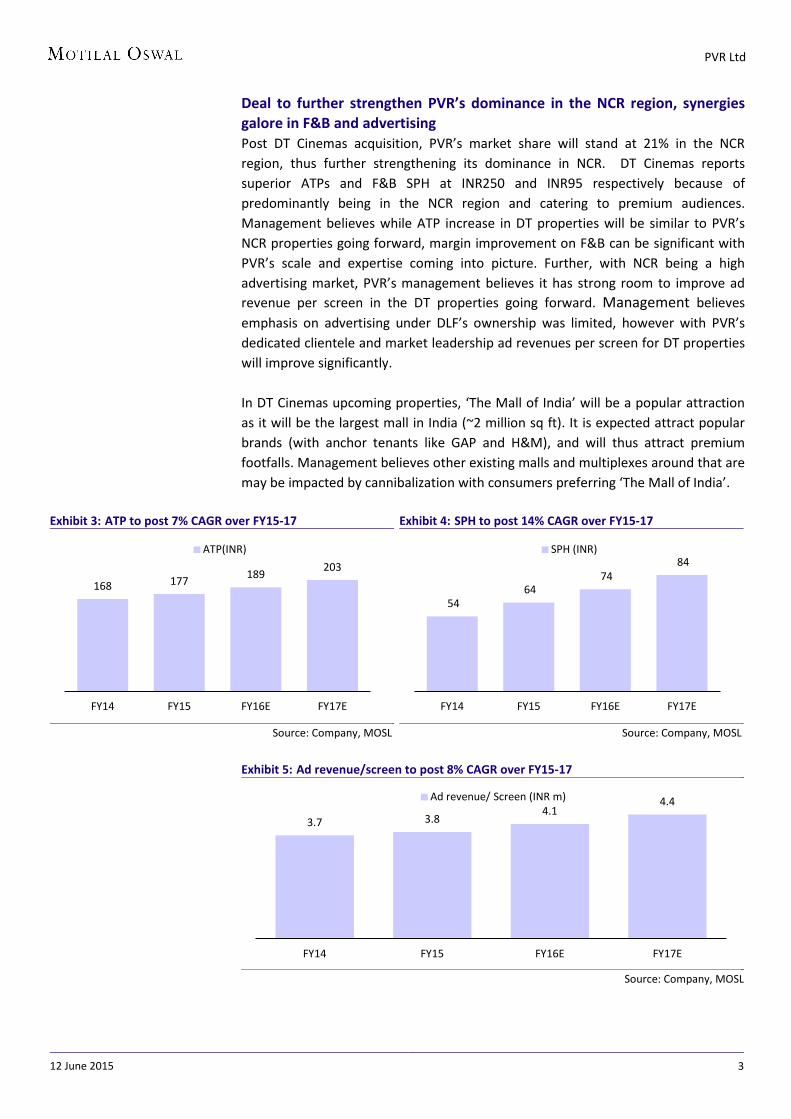
Deal to further strengthen PVR’s dominance in the NCR region, synergies galore in F&B and advertising Post DT Cinemas acquisition, PVR’s market share will stand at 21% in the NCR region, thus further strengthening its dominance in NCR. DT Cinemas reports superior ATPs and F&B SPH at INR250 and INR95 respectively because of predominantly being in the NCR region and catering to premium audiences. Management believes while ATP increase in DT properties will be similar to PVR’s NCR properties going forward, margin improvement on F&B can be significant with PVR’s scale and expertise coming into picture. Further, with NCR being a high advertising market, PVR’s management believes it has strong room to improve ad revenue per screen in the DT properties going forward. Management believes emphasis on advertising under DLF’s ownership was limited, however with PVR’s dedicated clientele and market leadership ad revenues per screen for DT properties will improve significantly. In DT Cinemas upcoming properties, ‘The Mall of India’ will be a popular attraction as it will be the largest mall in India (~2 million sq ft). It is expected attract popular brands (with anchor tenants like GAP and H&M), and will thus attract premium footfalls. Management believes other existing malls and multiplexes around that are may be impacted by cannibalization with consumers preferring ‘The Mall of India’.
Exhibit 3: ATP to post 7% CAGR over FY15-17
Source: Company, MOSL
Exhibit 4: SPH to post 14% CAGR over FY15-17
Source: Company, MOSL
Exhibit 5: Ad revenue/screen to post 8% CAGR over FY15-17
Source: Company, MOSL
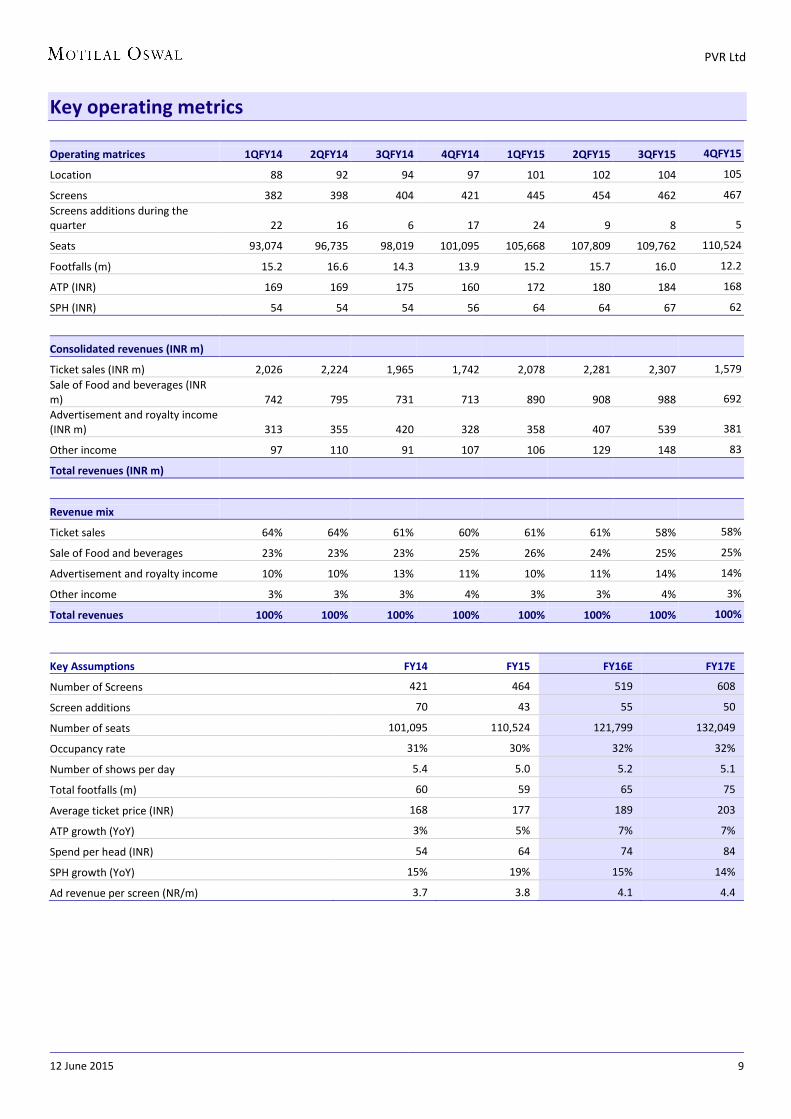
168 177 189 203
FY14 FY15 FY16E FY17E
ATP(INR)
54 64
74 84
FY14 FY15 FY16E FY17E
SPH (INR)
3.7 3.8 4.1
4.4
FY14 FY15 FY16E FY17E
Ad revenue/ Screen (INR m)
12 June 2015 4
PVR Ltd
Long tenure, revenue sharing agreement for rentals drive growth visibility DT Cinema’s average circuit age of less than 6 years, long tenured rental agreements (~18 year contracts), along with its locational advantage of being in high-end malls made it an attractive asset from an acquisition perspective. Further, majority of DT Cinemas properties’ rental agreements are structured as ~15% revenue sharing contacts which is superior to PVR’s current rental cost of 18.5%, thus resulting in savings in rentals. Further, refurbishing cost for DT Cinemas properties will be insignificant (restricted to re-branding activities only) as it already has a strong circuit with good finishes, technology and fit outs. Acquisition further strengthens PVR’s leadership position as No.1 player We believe DT Cinemas acquisition is highly synergistic with PVR’s business model, with full set of synergies in F&B and advertising likely to materialize over next 12-18 months. With DT acquisition adding ~39 screens and PVR targeting to open 60 new screens annually over the next two years, we expect total screen count at ~608 by FY17 thus strengthening PVRs No.1 position in multiplex business in India. With better outlook for content in FY16, coupled with expected revival in discretionary spends, we expect 24% revenue CAGR and 37% EBTDA CAGR over FY15-17. We model DT Cinemas’ acquisition, and consequent dilution to fund the deal, and hence upgrade FY17 EBITDA by 13%, build higher debt (20% vs earlier) and dilution (10.7%). While we model for equity dilution in FY16, we model DT Cinemas revenues in FY17 as it will be its first full year of operations post acquisition by PVR). We value PVR at 11x FY17E EV/EBITDA. Maintain Buy with a revised target price of INR775. Exhibit 6: PVR leads the multiplex market with 506 screens
Source: Company, MOSL
Exhibit 7: Revenues to post 24% CAGR over FY15-17
Source: Company, MOSL
Exhibit 8: EBITDA to post 37% CAGR over FY15-17
Source: Company, MOSL
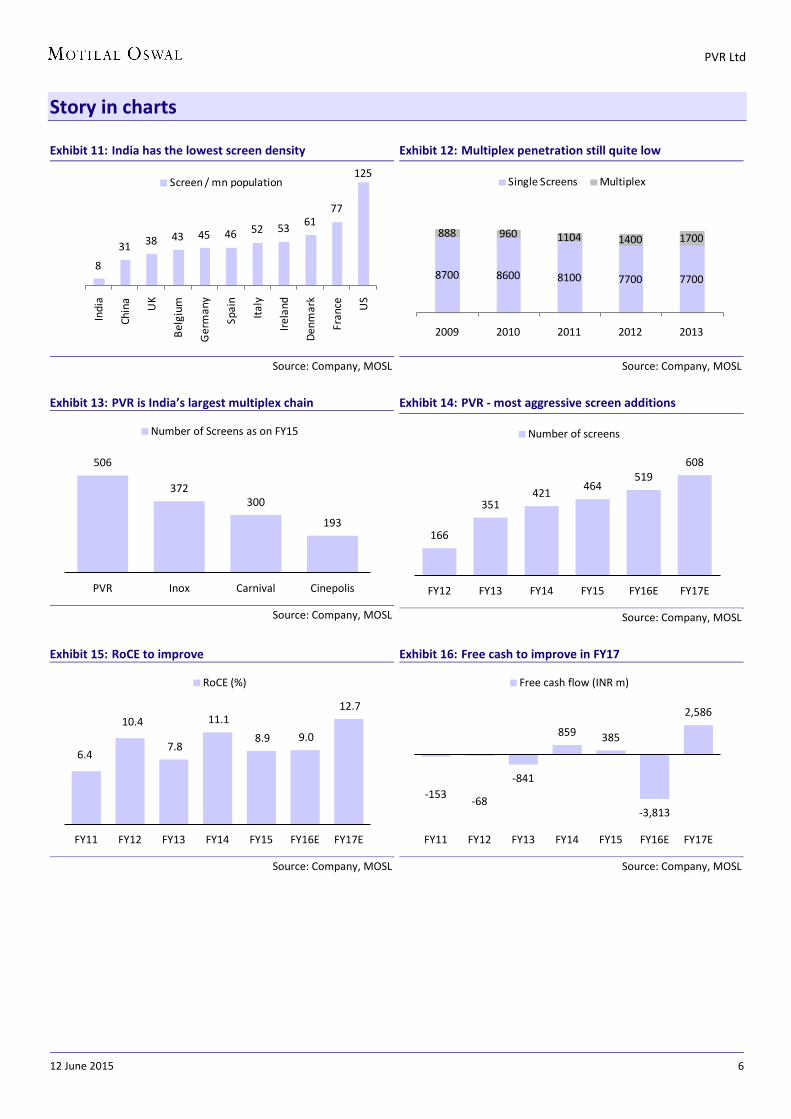
506
372 300
193
PVR Inox Carnival Cinepolis
Number of Screens as on FY15
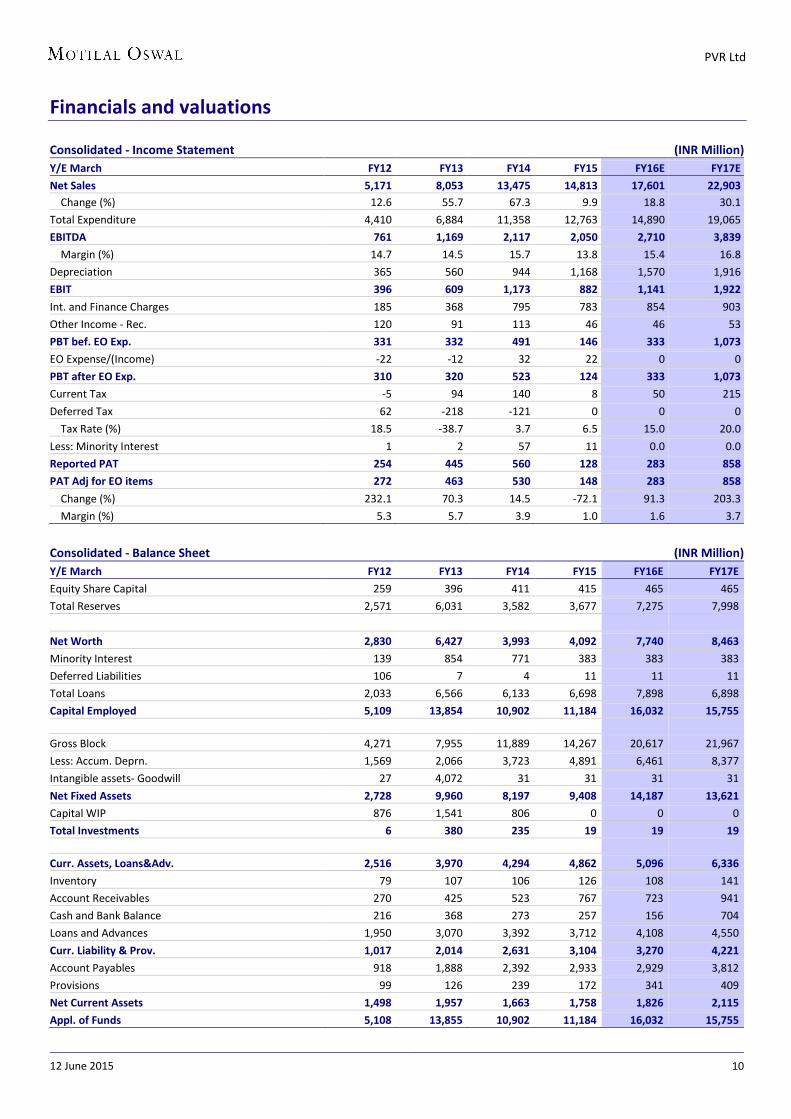
5,171 8,053
13,475 14,813
17,601
22,903
FY12 FY13 FY14 FY15 FY16E FY17E
Revenue (INR m
761 1,169 2,117 2,050 2,710 3,839
14.7 14.5
15.7
13.8
15.4
16.8
FY12 FY13 FY14 FY15 FY16E FY17E
EBITDA Margins %
12 June 2015 5
PVR Ltd
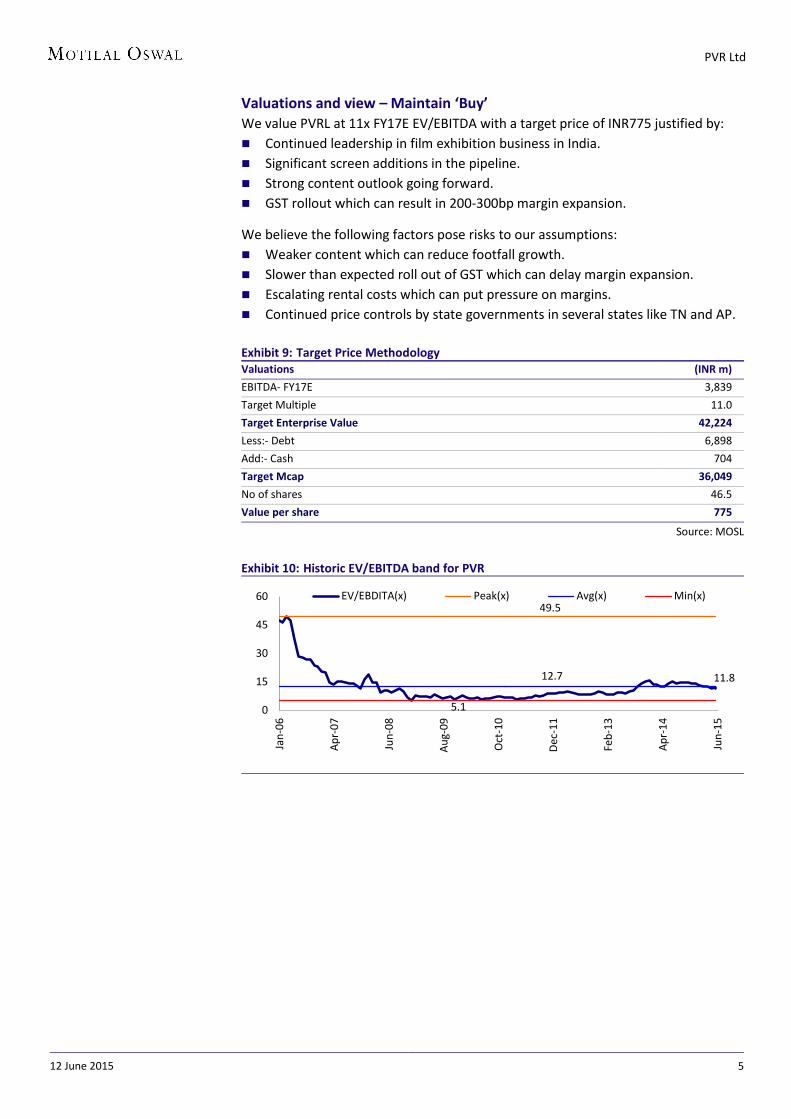
Valuations and view – Maintain ‘Buy’ We value PVRL at 11x FY17E EV/EBITDA with a target price of INR775 justified by: Continued leadership in film exhibition business in India. Significant screen additions in the pipeline. Strong content outlook going forward. GST rollout which can result in 200-300bp margin expansion.
We believe the following factors pose risks to our assumptions: Weaker content which can reduce footfall growth. Slower than expected roll out of GST which can delay margin expansion. Escalating rental costs which can put pressure on margins. Continued price controls by state governments in several states like TN and AP. Exhibit 9: Target Price Methodology Valuations (INR m)
EBITDA- FY17E 3,839
Target Multiple 11.0
Target Enterprise Value 42,224
Less:- Debt 6,898
Add:- Cash 704
Target Mcap 36,049
No of shares 46.5
Value per share 775
Source: MOSL
Exhibit 10: Historic EV/EBITDA band for PVR
11.8
49.5
12.7
5.1 0
15
30
45
60
Jan-
06
Apr-
07
Jun-
08
Aug-
09
Oct
-10
Dec
-11
Feb-
13
Apr-
14
Jun-
15
EV/EBDITA(x) Peak(x) Avg(x) Min(x)
12 June 2015 6
PVR Ltd
Story in charts
Exhibit 11: India has the lowest screen density
Source: Company, MOSL
Exhibit 12: Multiplex penetration still quite low
Source: Company, MOSL
Exhibit 13: PVR is India’s largest multiplex chain
Source: Company, MOSL
Exhibit 14: PVR - most aggressive screen additions
CF from Operations 573 1,529 2,147 1,957 2,537 3,936
(inc)/dec in FA -560 -2,372 -1,273 -1,572 -6,350 -1,350
(Pur)/Sale of Investments -502 -5,712 193 216 0 0
CF from Investments -1,031 -8,073 -1,065 -1,355 -6,350 -1,350
Issue of Shares -66 3,820 121 4 3,500 0
(Inc)/Dec in Debt 427 3,278 -434 565 1,200 -1,000
Interest Paid -207 -425 -812 -783 -854 -903
Dividend Paid -150 -60 -46 -48 -135 -135
Others -38 82 9 -355 0 0
CF from Fin. Activity -34 6,695 -1,162 -616 3,711 -2,038
Inc/Dec of Cash -574 151 -95 -15 -101 548
Add: Beginning Balance 790 216 368 272 257 156
Closing Balance 216 368 272 257 156 704
12 June 2015 12
PVR Ltd
Disclosures This document has been prepared by Motilal Oswal Securities Limited (hereinafter referred to as Most) to provide information about the company(ies) and/sector(s), if any, covered in the report and may be distributed by it and/or its affiliated company(ies). This report is for personal information of the selected recipient/s and does not construe to be any investment, legal or taxation advice to you. This research report does not constitute an offer, invitation or inducement to invest in securities or other investments and Motilal Oswal Securities Limited (hereinafter referred as MOSt) is not soliciting any action based upon it. This report is not for public distribution and has been furnished to you solely for your general information and should not be reproduced or redistributed to any other person in any form. This report does not constitute a personal recommendation or take into account the particular investment objectives, financial situations, or needs of individual clients. Before acting on any advice or recommendation in this material, investors should consider whether it is suitable for their particular circumstances and, if necessary, seek professional advice. The price and value of the investments referred to in this material and the income from them may go down as well as up, and investors may realize losses on any investments. Past performance is not a guide for future performance, future returns are not guaranteed and a loss of original capital may occur.
MOSt and its affiliates are a full-service, integrated investment banking, investment management, brokerage and financing group. We and our affiliates have investment banking and other business relationships with a some companies covered by our Research Department. Our research professionals may provide input into our investment banking and other business selection processes. Investors should assume that MOSt and/or its affiliates are seeking or will seek investment banking or other business from the company or companies that are the subject of this material and that the research professionals who were involved in preparing this material may educate investors on investments in such business. The research professionals responsible for the preparation of this document may interact with trading desk personnel, sales personnel and other parties for the purpose of gathering, applying and interpreting information. Our research professionals are paid on the profitability of MOSt which may include earnings from investment banking and other business.
MOSt generally prohibits its analysts, persons reporting to analysts, and members of their households from maintaining a financial interest in the securities or derivatives of any companies that the analysts cover. Additionally, MOSt generally prohibits its analysts and persons reporting to analysts from serving as an officer, director, or advisory board member of any companies that the analysts cover. Our salespeople, traders, and other professionals or affiliates may provide oral or written market commentary or trading strategies to our clients that reflect opinions that are contrary to the opinions expressed herein, and our proprietary trading and investing businesses may make investment decisions that are inconsistent with the recommendations expressed herein. In reviewing these materials, you should be aware that any or all of the foregoing among other things, may give rise to real or potential conflicts of interest. MOSt and its affiliated company(ies), their directors and employees and their relatives may; (a) from time to time, have a long or short position in, act as principal in, and buy or sell the securities or derivatives thereof of companies mentioned herein. (b) be engaged in any other transaction involving such securities and earn brokerage or other compensation or act as a market maker in the financial instruments of the company(ies) discussed herein or act as an advisor or lender/borrower to such company(ies) or may have any other potential conflict of interests with respect to any recommendation and other related information and opinions.; however the same shall have no bearing whatsoever on the specific recommendations made by the analyst(s), as the recommendations made by the analyst(s) are completely independent of the views of the affiliates of MOSt even though there might exist an inherent conflict of interest in some of the stocks mentioned in the research report Reports based on technical and derivative analysis center on studying charts company's price movement, outstanding positions and trading volume, as opposed to focusing on a company's fundamentals and, as such, may not match with a report on a company's fundamental analysis. In addition MOST has different business segments / Divisions with independent research separated by Chinese walls catering to different set of customers having various objectives, risk profiles, investment horizon, etc, and therefore may at times have different contrary views on stocks sectors and markets.
Unauthorized disclosure, use, dissemination or copying (either whole or partial) of this information, is prohibited. The person accessing this information specifically agrees to exempt MOSt or any of its affiliates or employees from, any and all responsibility/liability arising from such misuse and agrees not to hold MOSt or any of its affiliates or employees responsible for any such misuse and further agrees to hold MOSt or any of its affiliates or employees free and harmless from all losses, costs, damages, expenses that may be suffered by the person accessing this information due to any errors and delays. The information contained herein is based on publicly available data or other sources believed to be reliable. Any statements contained in this report attributed to a third party represent MOSt’s interpretation of the data, information and/or opinions provided by that third party either publicly or through a subscription service, and such use and interpretation have not been reviewed by the third party. This Report is not intended to be a complete statement or summary of the securities, markets or developments referred to in the document. While we would endeavor to update the information herein on reasonable basis, MOSt and/or its affiliates are under no obligation to update the information. Also there may be regulatory, compliance, or other reasons that may prevent MOSt and/or its affiliates from doing so. MOSt or any of its affiliates or employees shall not be in any way responsible and liable for any loss or damage that may arise to any person from any inadvertent error in the information contained in this report. MOSt or any of its affiliates or employees do not provide, at any time, any express or implied warranty of any kind, regarding any matter pertaining to this report, including without limitation the implied warranties of merchantability, fitness for a particular purpose, and non-infringement. The recipients of this report should rely on their own investigations.
This report is intended for distribution to institutional investors. Recipients who are not institutional investors should seek advice of their independent financial advisor prior to taking any investment decision based on this report or for any necessary explanation of its contents.
Most and it’s associates may have managed or co-managed public offering of securities, may have received compensation for investment banking or merchant banking or brokerage services, may have received any compensation for products or services other than investment banking or merchant banking or brokerage services from the subject company in the past 12 months. Most and it’s associates have not received any compensation or other benefits from the subject company or third party in connection with the research report. Subject Company may have been a client of Most or its associates during twelve months preceding the date of distribution of the research report
MOSt and/or its affiliates and/or employees may have interests/positions, financial or otherwise of over 1 % at the end of the month immediately preceding the date of publication of the research in the securities mentioned in this report. To enhance transparency, MOSt has incorporated a Disclosure of Interest Statement in this document. This should, however, not be treated as endorsement of the views expressed in the report.
Motilal Oswal Securities Limited is registered as a Research Analyst under SEBI (Research Analyst) Regulations, 2014. SEBI Reg. No. INH000000412
There are no material disciplinary action that been taken by any regulatory authority impacting equity research analysis activities
Analyst Certification The views expressed in this research report accurately reflect the personal views of the analyst(s) about the subject securities or issues, and no part of the compensation of the research analyst(s) was, is, or will be directly or indirectly related to the specific recommendations and views expressed by research analyst(s) in this report. The research analysts, strategists, or research associates principally responsible for preparation of MOSt research receive compensation based upon various factors, including quality of research, investor client feedback, stock picking, competitive factors and firm revenues
Disclosure of Interest Statement PVR LTD Analyst ownership of the stock No Served as an officer, director or employee No
A graph of daily closing prices of securities is available at www.nseindia.com and http://economictimes.indiatimes.com/markets/stocks/stock-quotes
Regional Disclosures (outside India) This report is not directed or intended for distribution to or use by any person or entity resident in a state, country or any jurisdiction, where such distribution, publication, availability or use would be contrary to law, regulation or which would subject MOSt & its group companies to registration or licensing requirements within such jurisdictions.
For U.S. Motilal Oswal Securities Limited (MOSL) is not a registered broker - dealer under the U.S. Securities Exchange Act of 1934, as amended (the"1934 act") and under applicable state laws in the United States. In addition MOSL is not a registered investment adviser under the U.S. Investment Advisers Act of 1940, as amended (the "Advisers Act" and together with the 1934 Act, the "Acts), and under applicable state laws in the United States. Accordingly, in the absence of specific exemption under the Acts, any brokerage and investment services provided by MOSL, including the products and services described herein are not available to or intended for U.S. persons.
This report is intended for distribution only to "Major Institutional Investors" as defined by Rule 15a-6(b)(4) of the Exchange Act and interpretations thereof by SEC (henceforth referred to as "major institutional investors"). This document must not be acted on or relied on by persons who are not major institutional investors. Any investment or investment activity to which this document relates is only available to major institutional investors and will be engaged in only with major institutional investors. In reliance on the exemption from registration provided by Rule 15a-6 of the U.S. Securities Exchange Act of 1934, as amended (the "Exchange Act") and interpretations thereof by the U.S. Securities and Exchange Commission ("SEC") in order to conduct business with Institutional Investors based in the U.S., MOSL has entered into a chaperoning agreement with a U.S. registered broker-dealer, Motilal Oswal Securities International Private Limited. ("MOSIPL"). Any business interaction pursuant to this report will have to be executed within the provisions of this chaperoning agreement.
The Research Analysts contributing to the report may not be registered /qualified as research analyst with FINRA. Such research analyst may not be associated persons of the U.S. registered broker-dealer, MOSIPL, and therefore, may not be subject to NASD rule 2711 and NYSE Rule 472 restrictions on communication with a subject company, public appearances and trading securities held by a research analyst account.
For Singapore Motilal Oswal Capital Markets Singapore Pte Limited is acting as an exempt financial advisor under section 23(1)(f) of the Financial Advisers Act(FAA) read with regulation 17(1)(d) of the Financial Advisors Regulations and is a subsidiary of Motilal Oswal Securities Limited in India. This research is distributed in Singapore by Motilal Oswal Capital Markets Singapore Pte Limited and it is only directed in Singapore to accredited investors, as defined in the Financial Advisers Regulations and the Securities and Futures Act (Chapter 289), as amended from time to time. In respect of any matter arising from or in connection with the research you could contact the following representatives of Motilal Oswal Capital Markets Singapore Pte Limited: Anosh Koppikar Kadambari Balachandran Email : [email protected] Email : [email protected] Contact : (+65)68189232 Contact : (+65) 68189233 / 65249115 Office Address : 21 (Suite 31),16 Collyer Quay,Singapore 04931