7654 J. Phys. Chem. 1995,99, 7654-7662 Time Resolved Electron Spin Resonance and Laser Flash Spectroscopy Investigation of the Photoreduction of Anthraquinone-2,6-disulfonic Acid, Disodium Salt by Sodium Sulfite in Aerosol OT Reverse Micelles? Nicholas J. Turro* and Igor V. Khudyakov Department of Chemistry, Columbia University, New York, New York 10027 Received: August 12, 1994; In Final Form: December 23, 1994@ Spin-correlated radical pairs (SCRP) of radical anions formed by photoreduction of anthraquinone-9,lO- disulfonic acid, disodium salt (AQ) by sodium sulfite in solution of Aerosol OT (AOT) reverse micelles in isooctane have been studied by time resolved electron spin resonance (TR ESR) and nanosecond laser flash photolysis employing optical absorption. The molar ratio of water to AOT w was varied from 5 to 50, and the spectra of SCRP were observed in micelles with w 2 20. The value of exchange interaction in such micelles was determined and found to be on the order of a few tenths of a gauss. The photoreduction of AQ is accompanied by strong emissive ESR spectra of the radicals AQ'- and S03'-. The hyperfine coupling in AQ'- is fully resolved at the relatively long time of several microseconds after the laser flash. The initial SCRP spectra are succeeded in time by an WA ESR pattern due to a radical pair mechanism. The rate constants of radical recombination within micelles and radical pair exit from the micelles were determined by laser flash photolysis. The results are consistent with the formation of associates such as AQ'-/Na+/ SO3'- triads in reverse micelles; Le., the radical anions are held together by a bridging sodium ion. Introduction Photoreduction of quinones and other carbonyl compounds by inorganic salts is an important process and has been studied intensively.' These reactions have been the subject of investiga- tion in the areas of photoinduced electron transfer and solar energy storage. Triplet radical pairs (RPs) are generally the primary species formed in the photoreduction of quinones by inorganic salts.' The magnetic characteristics of RPs of organic and inorganic radicals are expected to exhibit some peculiarities that are related to their unquenched orbital momentum of some inorganic radicals and their fast paramagnetic relaxation.2 Photogenerated RPs of radicals which remain in a close proximity demonstrate a special type of electron spin resonance (ESR) spectra, which have been successfully interpreted in terms of spin-correlated radical pairs (SCRP).3-5 ESR spectra of SCRP are most commonly observed in viscous or micellar solutions and provide valuable information on the properties of both radicals and their envir~nment.~-~ An intriguing issue related to SCRP in homogeneous (viscous) solutions is the unexpectedly long lifetime (hundreds of nanoseconds) for which reactive radicals remain in each other's proximity.6 In the present work we describe the investigation of the SCRP consisting of two radical anions (one organic and one inorganic) formed in reverse micelles of Aerosol OT. Experimental Section 1. Instruments. A detailed description of the time resolved continuous wave ESR (CW ESR) instrument is given else- this technique is termed time resolved ESR (TlX ESR). The instrument consists of a Bruker ER 100 D spectrometer, a PAR Model 4402 digital boxcar integrator, a Quanta Ray DCR +Dedicated to Professor Mostafa A. El-Sayed on the occasion of his 60th birthday in recognition of his numerous seminal and pioneering contributions to photochemistry and photophysics, many of which have provided inspiration for many research projects of the senior author over the past 3 decades. @ Abstract published in Advance ACS Abstracts, May 1, 1995. 0022-365419512099-7654$09.0010 2A Nd:YAG laser (third [I, = 355 nm] harmonic, 8-11s fwhm, typical laser energy = 10- 15 dlpulse at 20 Hz), and a Bruker broad band preamplifier with a response time of 60 ns. Typical sampling gates were 100-500 ns, and the sampling was started at 100-500 ns after the laser pulse. If not otherwise stated, the TR ESR data corresponded to an attenuation of 20 dB (microwave power = 0.7 mW). The earliest time at which reliable data can be obtained is estimated to be ca. 200 ns after laser excitation; this time is considered as t = 0 in the TR ESR data reported. The experiments were run with a flow system consisting of a flat (OS-") quartz cell. Flow rates were typically selected to be in the range of 2-5 mL/min. For measurement of time dependencies of ESR components in TR ESR spectra, a boxcar integrator was employed to monitor the variation of the signal intensity at a chosen magnetic flux density after the laser flash in real time. The sampling gate was 20 ns for such experiments. The nanosecond flash photolysis system employs the same YAG laser described above for excitation. A pulsed Xenon lamp, combined with an ISA H10 monochromator, serves as the monitoring system, which has been described elsewhere.4f Typically data acquired after 10- 15 laser pulses were averaged to produce each experimental trace both in the kinetic experi- ments and in the acquisition of a transient absorption spectra. Quartz cells having cross sections of 1 x 1 cm were used. Steady state CW ESR spectra of aqueous and micellar solutions were measured with a Bruker ESR 300 spectrometer, which has been described previously.' The microwave power was ca. 2 mW. The modulation amplitude was varied from 0.1 to 0.5 G at a modulation frequency of 100 kHz, without significant variation of the form of the observed spectra. (We will term such steady state spectra as CW ESR spectra to distinguish them from TR ESR spectra.) Solutions in Pyrex ampules were irradiated in the ESR cavity with the full light of a HgKe lamp (200 W) when necessary. 2. Reagents and Solutions. Bis(2-ethylhexyl)sulfosuccinate, sodium salt (Aerosol OT, AOT, Fluka), isooctane (Fluka), D20 (Cambridge Isotope Laboratories), Na2S03 (Fisher), hexade- 1995 American Chemical Society
Transcript
7654 J. Phys. Chem. 1995,99, 7654-7662
Time Resolved Electron Spin Resonance and Laser Flash Spectroscopy Investigation of the Photoreduction of Anthraquinone-2,6-disulfonic Acid, Disodium Salt by Sodium Sulfite in Aerosol OT Reverse Micelles?
Nicholas J. Turro* and Igor V. Khudyakov Department of Chemistry, Columbia University, New York, New York 10027
Received: August 12, 1994; In Final Form: December 23, 1994@
Spin-correlated radical pairs (SCRP) of radical anions formed by photoreduction of anthraquinone-9,lO- disulfonic acid, disodium salt (AQ) by sodium sulfite in solution of Aerosol OT (AOT) reverse micelles in isooctane have been studied by time resolved electron spin resonance (TR ESR) and nanosecond laser flash photolysis employing optical absorption. The molar ratio of water to AOT w was varied from 5 to 50, and the spectra of SCRP were observed in micelles with w 2 20. The value of exchange interaction in such micelles was determined and found to be on the order of a few tenths of a gauss. The photoreduction of AQ is accompanied by strong emissive ESR spectra of the radicals AQ'- and S03'-. The hyperfine coupling in AQ'- is fully resolved at the relatively long time of several microseconds after the laser flash. The initial SCRP spectra are succeeded in time by an WA ESR pattern due to a radical pair mechanism. The rate constants of radical recombination within micelles and radical pair exit from the micelles were determined by laser flash photolysis. The results are consistent with the formation of associates such as AQ'-/Na+/ SO3'- triads in reverse micelles; Le., the radical anions are held together by a bridging sodium ion.
Introduction
Photoreduction of quinones and other carbonyl compounds by inorganic salts is an important process and has been studied intensively.' These reactions have been the subject of investiga- tion in the areas of photoinduced electron transfer and solar energy storage. Triplet radical pairs (RPs) are generally the primary species formed in the photoreduction of quinones by inorganic salts.' The magnetic characteristics of RPs of organic and inorganic radicals are expected to exhibit some peculiarities that are related to their unquenched orbital momentum of some inorganic radicals and their fast paramagnetic relaxation.2
Photogenerated RPs of radicals which remain in a close proximity demonstrate a special type of electron spin resonance (ESR) spectra, which have been successfully interpreted in terms of spin-correlated radical pairs (SCRP).3-5 ESR spectra of SCRP are most commonly observed in viscous or micellar solutions and provide valuable information on the properties of both radicals and their envi r~nment .~-~ An intriguing issue related to SCRP in homogeneous (viscous) solutions is the unexpectedly long lifetime (hundreds of nanoseconds) for which reactive radicals remain in each other's proximity.6
In the present work we describe the investigation of the SCRP consisting of two radical anions (one organic and one inorganic) formed in reverse micelles of Aerosol OT.
Experimental Section
1. Instruments. A detailed description of the time resolved continuous wave ESR (CW ESR) instrument is given else-
this technique is termed time resolved ESR (TlX ESR). The instrument consists of a Bruker ER 100 D spectrometer, a PAR Model 4402 digital boxcar integrator, a Quanta Ray DCR
+Dedicated to Professor Mostafa A. El-Sayed on the occasion of his 60th birthday in recognition of his numerous seminal and pioneering contributions to photochemistry and photophysics, many of which have provided inspiration for many research projects of the senior author over the past 3 decades.
@ Abstract published in Advance ACS Abstracts, May 1, 1995.
0022-365419512099-7654$09.0010
2A Nd:YAG laser (third [I, = 355 nm] harmonic, 8-11s fwhm, typical laser energy = 10- 15 d lpulse at 20 Hz), and a Bruker broad band preamplifier with a response time of 60 ns. Typical sampling gates were 100-500 ns, and the sampling was started at 100-500 ns after the laser pulse. If not otherwise stated, the TR ESR data corresponded to an attenuation of 20 dB (microwave power = 0.7 mW). The earliest time at which reliable data can be obtained is estimated to be ca. 200 ns after laser excitation; this time is considered as t = 0 in the TR ESR data reported. The experiments were run with a flow system consisting of a flat (OS-") quartz cell. Flow rates were typically selected to be in the range of 2-5 mL/min.
For measurement of time dependencies of ESR components in TR ESR spectra, a boxcar integrator was employed to monitor the variation of the signal intensity at a chosen magnetic flux density after the laser flash in real time. The sampling gate was 20 ns for such experiments.
The nanosecond flash photolysis system employs the same YAG laser described above for excitation. A pulsed Xenon lamp, combined with an ISA H10 monochromator, serves as the monitoring system, which has been described elsewhere.4f Typically data acquired after 10- 15 laser pulses were averaged to produce each experimental trace both in the kinetic experi- ments and in the acquisition of a transient absorption spectra. Quartz cells having cross sections of 1 x 1 cm were used.
Steady state CW ESR spectra of aqueous and micellar solutions were measured with a Bruker ESR 300 spectrometer, which has been described previously.' The microwave power was ca. 2 mW. The modulation amplitude was varied from 0.1 to 0.5 G at a modulation frequency of 100 kHz, without significant variation of the form of the observed spectra. (We will term such steady state spectra as CW ESR spectra to distinguish them from TR ESR spectra.) Solutions in Pyrex ampules were irradiated in the ESR cavity with the full light of a HgKe lamp (200 W) when necessary.
2. Reagents and Solutions. Bis(2-ethylhexyl)sulfosuccinate, sodium salt (Aerosol OT, AOT, Fluka), isooctane (Fluka), D20 (Cambridge Isotope Laboratories), Na2S03 (Fisher), hexade-
1995 American Chemical Society
Photoreduction of AQ by Na2S03 in AOT Reverse Micelles
cyltrimethylammonium chloride (HDTCl, Kodak), and the stable nitroxyl free radical 3-carboxy-2,2,5,5-tetramethyl- 1 -pyrrolidi- nyloxyl (Aldrich) were used as received. The stable radical, which exists in our system in the ionized form is denoted as w-.
0.
No-
Anthraquinone-9, lo-disulfonic acid, disodium salt (AQ, Aldrich) was recrystallized from water-ethanol mixtures. Deionized water was used or buffer pH 8.0 (Fisher). AQ is insoluble in isooctane.
Micellar solutions of AQ and Na2S03 at five different molar ratios of w = [H20]/[AOT] were prepared in isooctane in the following way. An aqueous solution of AQ and Na~S03 was added to solutions of AOT in isooctane in a quantity that would result in the expected w = 5, 10, 20, 30, 40, or 50. It was assumed under the preparation of micellar solutions for inves- tigation that the volume of the mixture of the solution of AOT in isooctane and aqueous solution was equal to the sum of the two mixed solutions, and it was shown experimentally that this assumption is correct within the accuracy of 1-5%. Stock solutions of isooctane contained AOT in the selected concentra- tion of more than 0.1 M; mixing of these latter solutions with aqueous solutions of AQ and Na2S.03 led to [AOT] = 0.1 M in the micellar solutions. Unless otherwise stated, all micellar solutions contained [AOT] = 0.1 M and were prepared with aqueous nonbuffered solutions of compounds. The micellar solutions were shaken for several minutes or were sonicated. Such procedures led to clear or turbid solutions (depending upon the concentrations of AQ and Na2S03). All solutions were filtered through Millipore filters. Concentrations of aqueous solutions of salts were chosen in such a way that the micellar solutions used for laser flash photolysis experiments contained AQ in a concentration of (1-2) x M and Na2S03 in a concentration of 1 x M. (The extinction coefficient of AQ in aqueous solutions at A = 355 nm is equal to 1.6 x lo3 M-' cm-I).
For experiments employing TR ESR, which were performed in a thin-walled cell, the concentration of AQ was increased up to -3 x lov3 M. The concentrations of AQ and NazS03 employed are close to the limit of the solubility of these two compounds in AOT micelles, so that the use of higher concentrations of salts leads to separation of organic and aqueous phases. TR ESR experiments with solutions characterized by w = 5 and 10 were pereformed with the concentration of AOT in solution of 0.2 (w = 5) and 0.15 M (w = 10) in order to get a larger concentration (absorption) of AQ. In order to check the effect of [AOT] on the observed TR ESR spectra, experi- ments with solutions characterized by w = 30 and [AOT] = 0.1 and 0.2 M were performed; solutions with [AOT] = 0.2 M had the same concentrations of AQ and Na2S03 as solutions with [AOT] = 0.1 M as well as concentrations twice as large. All of the micellar solutions were stable for weeks except for the solution with w = 50, which became turbid upon standing. Only freshly prepared solutions with w = 50 were used. A number of AOT micellar solutions were prepared using water, which was not only deionized but was also in a buffer solution (pH 8.0). The use of buffer solution allowed the preparation of clear micellar solutions of AQ and Na2SO3 with lower concentrations of these two reagents.
J. Phys. Chem., Vol. 99, No. 19, 1995 7655 <= 2.0036, rF TM \ I
so3-* r- 2 G \
I l k * 1 7 , I C
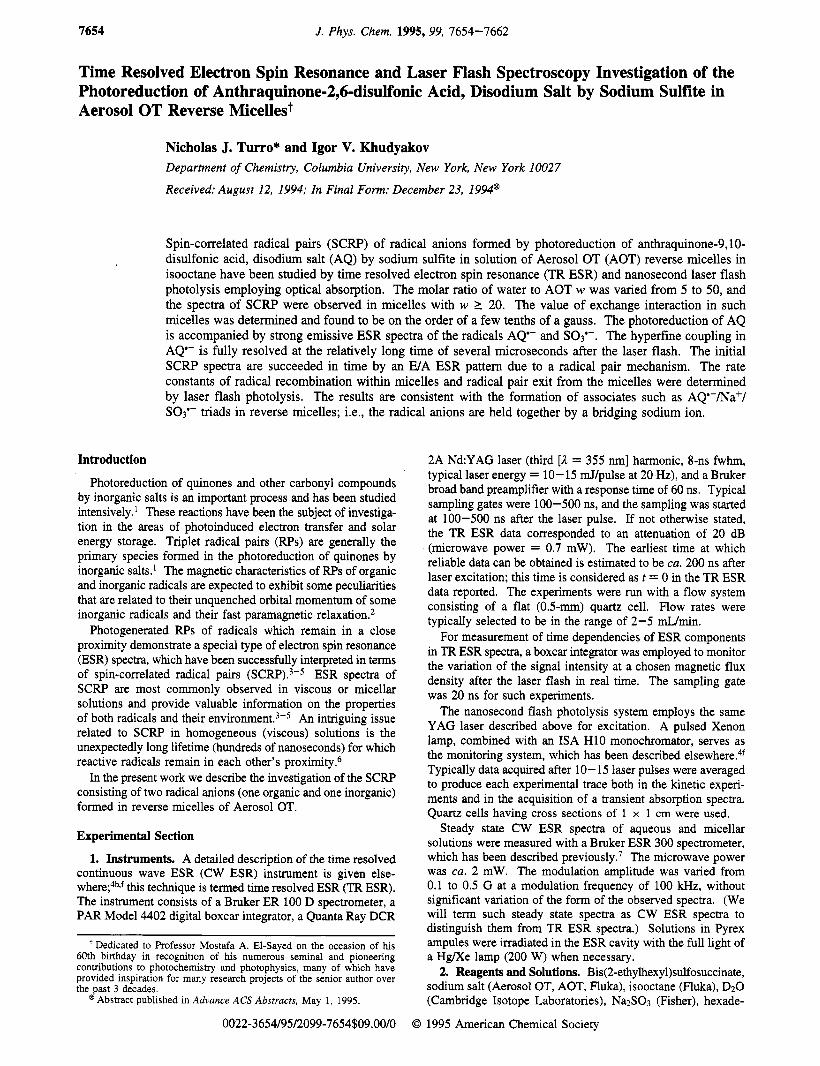
L 0- J Y Figure 1. TR ESR spectra of AQ (3 x M) in aqueous solution (pH 8.0) in the presence of 5 x M of Na2S03 taken at three different times. Filled circles mark hyperfine (HF) components of AQ-; asterisks mark the signals of so3'-, which overlaps with the highest field HF component of the AQ'- spectrum.
For the preparation of cationic micelles the detergent HDTCl was dissolved in aqueous solutions in the concentration of 0.4 M; in the presence of AQ (5 x lop3 M) and Na2S03 (5 x M) one obtains a concentration of micelles of ca. M.* This micellar solution was sonicated and filtered prior to use.
The stable free radical W- (see this section above) was dissolved in aqueous solutions (pH 8.0) and in solutions of AOT micelles of ca. 5 x M for CW ESR experiments; in the neutral or basic media employed in this investigation, the nitroxyl radical exists in the form of an anion.9
TR ESR experiments in aqueous buffer solutions were performed with AQ and Na2S03.
Perdeuterated AQ (AQ-d6) was prepared according to a literature method.'O 'H NMR showed almost complete (ca. 95%) substitution of H for D. AQ-d6 was purified in the same manner as AQ (see this section above). The AOT micellar solution of AQ-ds and NazS03 (w = 50) was prepared in the same way as solutions of protiated AQ (vide supra). D20 was used in experiments with AQ-d6 instead of Hz0.
All solutions were deoxygenated by argon bubbling, and measurements were carried out at room temperature. Solutions of AQ and AQ-ds were kept in the dark prior to photolysis in view of the expected sensitivity of anthraquinone derivatives to visible light.
Results
1. TR ESR Investigation. 1 .I. Aqueous Solutions. Laser flash photoexcitation of AQ in aqueous solutions results in the
7656 J. Phys. Chem., Vol. 99, No. 19, 1995 Turro and Khudyakov
* AQ-' so,-'
I - g = 2.0036
7 2 G - \ + 1 11=2.m32
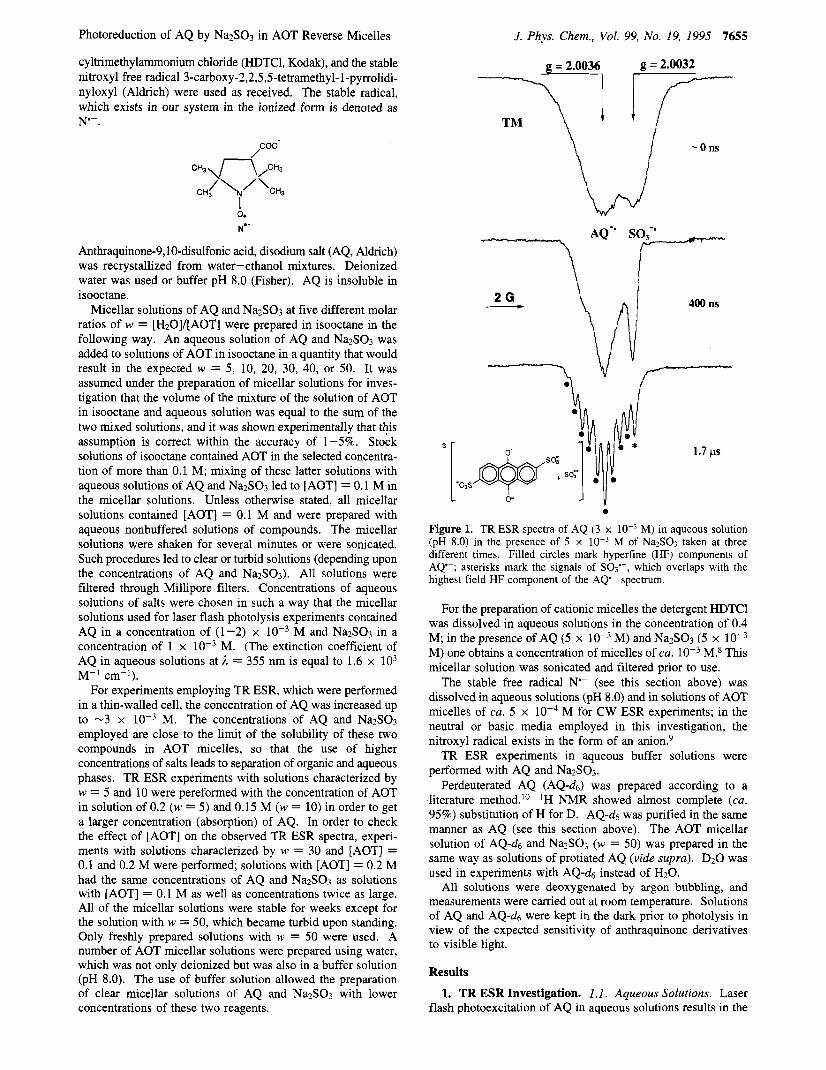
Figure 2. TR ESR spectra of AQ (1 x M) in aqueous solution (pH 8.0) in the presence of 0.1 M of Na2SO3 taken at two different times. The filled circle marks the most degenerate HF component of AQ-, which changes its phase; asterisks mark the signals of so3'-.
TM q p Figure 3. TR ESR spectra of AQ-ds (3 x M) in D20 solution in the presence of 5 x M of Na2S03. The filled circle marks the center of the signal ascribed to the semiquinone radical anion (see text); the asterisks marks the signal of so,'-. TR ESR spectra presented in Figures 1 and 2. These spectra were assigned to the semiquinone radical anion AQ'- (g = 2.0036)" and sulfite radical anion so3'- (g = 2.003 16).2a-11a The radicals are formed according to the known photoreduction of the triplet n,n* state of AQ (eqs 1 and 2).' In neutral or basicI2 aqueous solutions these two radicals exist in the form of anions. 3 3 1 4
AQ + hv - 'AQ* - 3AQ*
3AQ* + SO,2- - AQ'- + SO,'-
(1)
( 2 )
Figure 3 presents the TR ESR spectrum obtained under photolysis of AQ-ds in the presence of Na2S03.
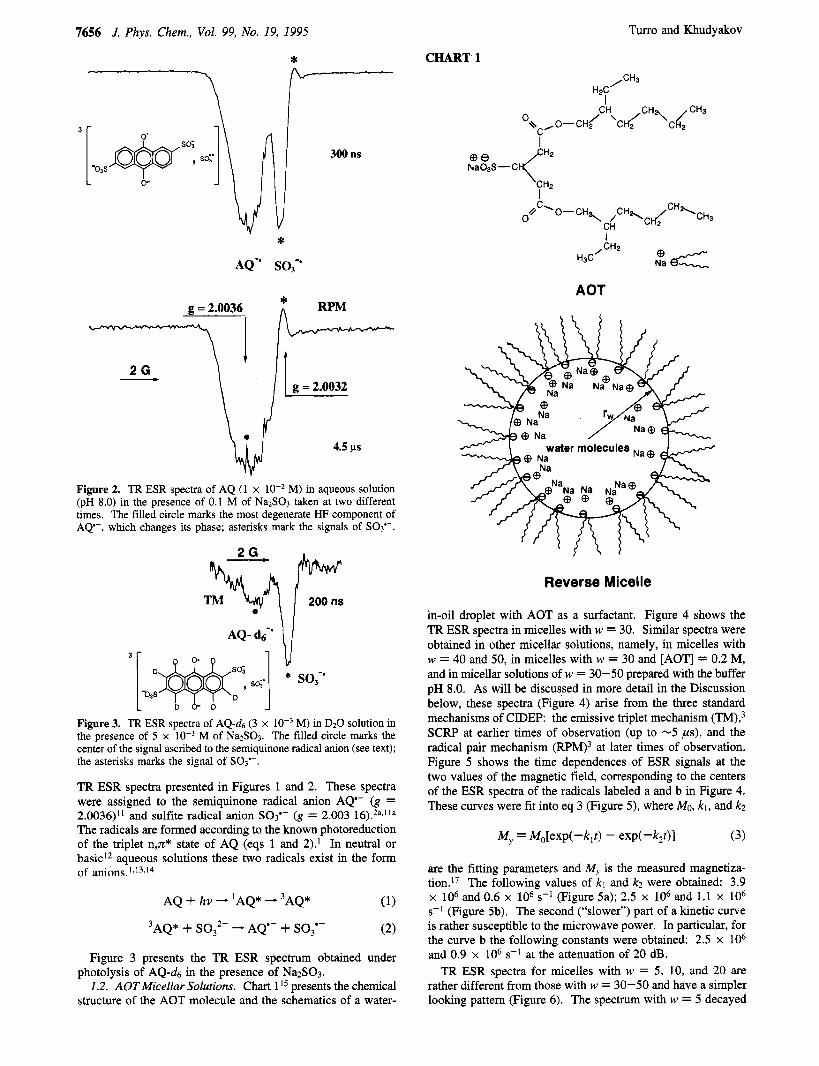
1.2. AOTMicellar Solutions. Chart l I 5 presents the chemical structure of the AOT molecule and the schematics of a water-
CHART 1
I
CH 0 BC/O-CH{cH\CKI I \ cdCH3
AOT
Reverse Micelle
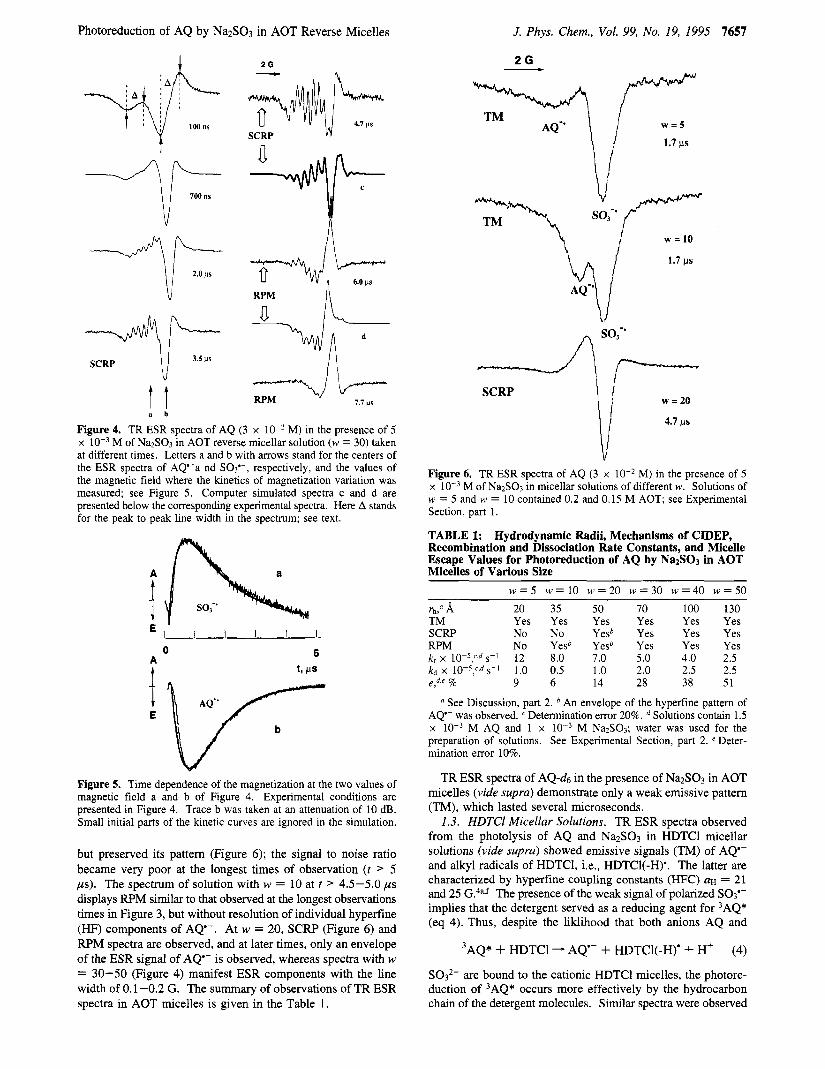
in-oil droplet with AOT as a surfactant. Figure 4 shows the TR ESR spectra in micelles with w = 30. Similar spectra were obtained in other micellar solutions, namely, in micelles with w = 40 and 50, in micelles with w = 30 and [AOT] = 0.2 M, and in micellar solutions of w = 30-50 prepared with the buffer pH 8.0. As will be discussed in more detail in the Discussion below, these spectra (Figure 4) arise from the three standard mechanisms of CIDEP: the emissive triplet mechanism (TM),3 SCRP at earlier times of observation (up to -5 ps), and the radical pair mechanism (RPM)3 at later times of observation. Figure 5 shows the time dependences of ESR signals at the two values of the magnetic field, corresponding to the centers of the ESR spectra of the radicals labeled a and b in Figure 4. These curves were fit into eq 3 (Figure 5) , where Mo, kl , and k2
M y = M,,[exp(-k,t) - exp(-k2t)l (3)
are the fitting parameters and My is the measured magnetiza- tion." The following values of kl and k2 were obtained: 3.9 x lo6 and 0.6 x lo6 s-l (Figure Sa); 2.5 x lo6 and 1.1 x lo6 s-l (Figure 5b). The second ("slower") part of a kinetic curve is rather susceptible to the microwave power. In particular, for the curve b the following constants were obtained: 2.5 x lo6 and 0.9 x lo6 s-l at the attenuation of 20 dB.
TR ESR spectra for micelles with w = 5, 10, and 20 are rather different from those with w = 30-50 and have a simpler looking pattern (Figure 6). The spectrum with w = 5 decayed
Photoreduction of AQ by Na2S03 in AOT Reverse Micelles
t t s b
2 0
RPM I \
Figure 4. TR ESR spectra of AQ (3 x lo-> M) in the presence of 5 x M of NazSO3 in AOT reverse micellar solution (w = 30) taken at different times. Letters a and b with arrows stand for the centers of the ESR spectra of AQ-a nd SO3'-, respectively, and the values of the magnetic field where the kinetics of magnetization variation was measured; see Figure 5. Computer simulated spectra c and d are presented below the corresponding experimental spectra. Here A stands for the peak to peak line width in the spectrum; see text.
Figure 5. Time dependence of the magnetization at the two values of magnetic field a and b of Figure 4. Experimental conditions are presented in Figure 4. Trace b was taken at an attenuation of 10 dB. Small initial parts of the kinetic curves are ignored in the simulation.
but preserved its pattem (Figure 6); the signal to noise ratio became very poor at the longest times of observation ( t > 5 ps). The spectrum of solution with w = 10 at t > 4.5-5.0 ps displays RPM similar to that observed at the longest observations times in Figure 3, but without resolution of individual hyperfine (HF) components of AQ'-. At w = 20, SCRP (Figure 6 ) and RPM spectra are observed, and at later times, only an envelope of the ESR signal of AQ'- is observed, whereas spectra with w = 30-50 (Figure 4) manifest ESR components with the line width of 0.1-0.2 G. The summary of observations of TR ESR spectra in AOT micelles is given in the Table 1.
J. Phys. Chem., Vol. 99, No. 19, I995 7657
2 G
TM AQ-'
G' Figure 6. TR ESR spectra of AQ (3 x M) in the presence of 5 x M of Na2S03 in micellar solutions of different w. Solutions of w = 5 and w = 10 contained 0.2 and 0.15 M AOT; see Experimental Section, part 1.
TABLE 1: Hydrodynamic Radii, Mechanisms of CIDEP, Recombination and Dissociation Rate Constants, and Micelle Escape Values for Photoreduction of AQ by NaZS03 in AOT Micelles of Various Size
w = 5 w = l O w = 2 0 w = 3 0 w = 4 0 w = 5 0
rh,a A 20 35 50 70 100 130 TM Yes Yes Yes Yes Yes Yes SCRP No No Yesb Yes Yes Yes RPM No Yesb Yesb Yes Yes Yes k, x 10-5,'.d~-1 12 8.0 7.0 5.0 4.0 2.5 kd X 10-5,',dS-' 1.0 0.5 1.0 2.0 2.5 2.5 e,d,e % 9 6 14 28 38 51
a See Discussion, part 2. An envelope of the hyperfine pattem of A Q - was observed. Determination error 20%. Solutions contain 1.5 x M AQ and 1 x low3 M NazS03; water was used for the preparation of solutions. See Experimental Section, part 2. e Deter- mination error 10%.
TR ESR spectra of AQ-ds in the presence of Na2S03 in AOT micelles (vide supra) demonstrate only a weak emissive pattem (TM), which lasted several microseconds.
1.3. HDTCl Micellar Solutions. TR ESR spectra observed from the photolysis of AQ and Na2SO3 in HDTCl micellar solutions (vide supra) showed emissive signals (TM) of AQ'- and alkyl radicals of HDTCl, i.e., HDTCl(-H)'. The latter are characterized by hyperfine coupling constants (HFC) LIH = 21 and 25 G?,f The presence of the weak signal of polarized so3'- implies that the detergent served as a reducing agent for 3AQ* (eq 4). Thus, despite the liklihood that both anions AQ and
3AQ* + HDTCl - AQ'- + HDTCl(-H)' + H' (4)
S032- are bound to the cationic HDTCl micelles, the photore- duction of 3AQ* occurs more effectively by the hydrocarbon chain of the detergent molecules. Similar spectra were observed
7658 J. Phys. Chem., Vol. 99, No. 19, 1995 Turro and Khudyakov
2.04 \
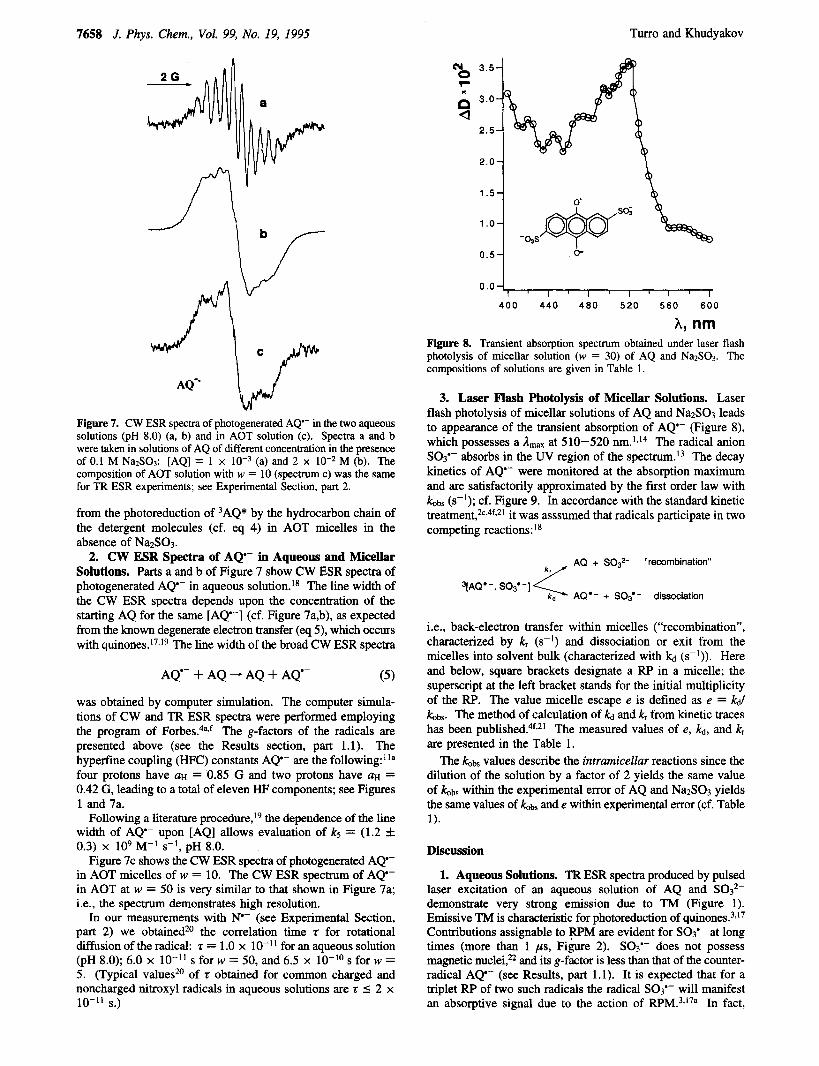
Figure 7. CW ESR spectra of photogenerated AQ'- in the two aqueous solutions (pH 8.0) (a, b) and in AOT solution (c). Spectra a and b were taken in solutions of AQ of different concentration in the presence of 0.1 M NaZS03: [AQ] = 1 x (a) and 2 x lo-* M (b). The composition of AOT solution with w = 10 (spectrum c) was the same for TR ESR experiments; see Experimental Section, part 2.
from the photoreduction of 3AQ* by the hydrocarbon chain of the detergent molecules (cf. eq 4) in AOT micelles in the absence of NazS03.
2. CW ESR Spectra of AQ- in Aqueous and Micellar Solutions. Parts a and b of Figure 7 show CW ESR spectra of photogenerated AQ- in aqueous solution.'* The line width of the CW ESR spectra depends upon the concentration of the starting AQ for the same [AQ-] (cf. Figure 7a,b), as expected from the hown degenerate electron transfer (eq 5) , which occurs with quinone^.'^*'^ The line width of the broad CW ESR spectra
AQ'- i- AQ - AQ i- AQ'- ( 5 )
was obtained by computer simulation. The computer simula- tions of CW and TR ESR spectra were performed employing the program of Forbes.4Gf The g-factors of the radicals are presented above (see the Results section, part 1.1). The hyperfine coupling (HFC) constants AQ- are the following:"" four protons have aH = 0.85 G and two protons have aH = 0.42 G, leading to a total of eleven HF components; see Figures 1 and 7a.
Following a literature pr~cedure, '~ the dependence of the line width of AQ- upon [AQ] allows evaluation of k5 = (1.2 f 0.3) x 109 M-' s-1 , pH 8.0.
Figure 7c shows the CW ESR spectra of photogenerated AQ- in AOT micelles of w = 10. The CW ESR spectrum of AQ- in AOT at w = 50 is very similar to that shown in Figure 7a; i.e., the spectrum demonstrates high resolution.
In our measurements with N'- (see Experimental Section, part 2) we obtainedz0 the correlation time z for rotational diffusion of the radical: z = 1.0 x IO-'' for an aqueous solution (pH 8.0); 6.0 x lo-" s for w = 50, and 6.5 x s for w = 5. (Typical values*O of z obtained for common charged and noncharged nitroxyl radicals in aqueous solutions are z I 2 x lo-'' s.)
0 . 0 4 , , , , I , I , , , I
400 440 4 8 0 5 2 0 560 600
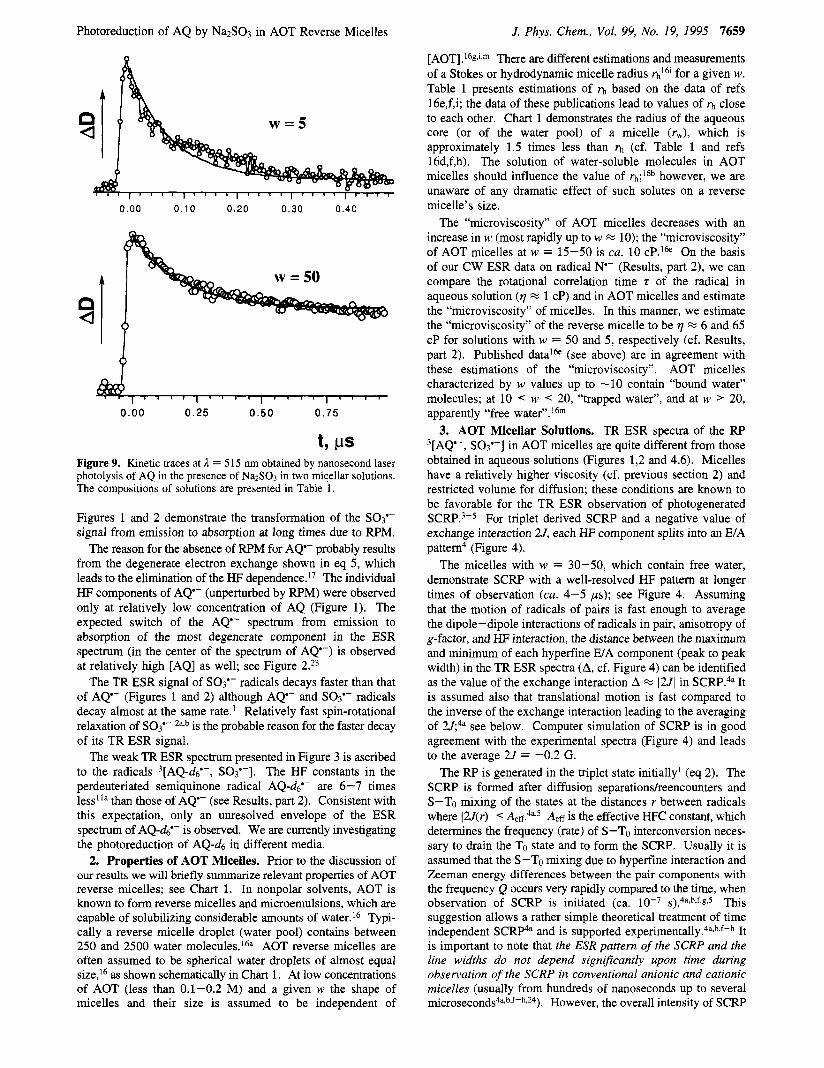
A, nm Figure 8. Transient absorption spectrum obtained under laser flash photolysis of micellar solution (w = 30) of AQ and Na2S03. The compositions of solutions are given in Table 1.
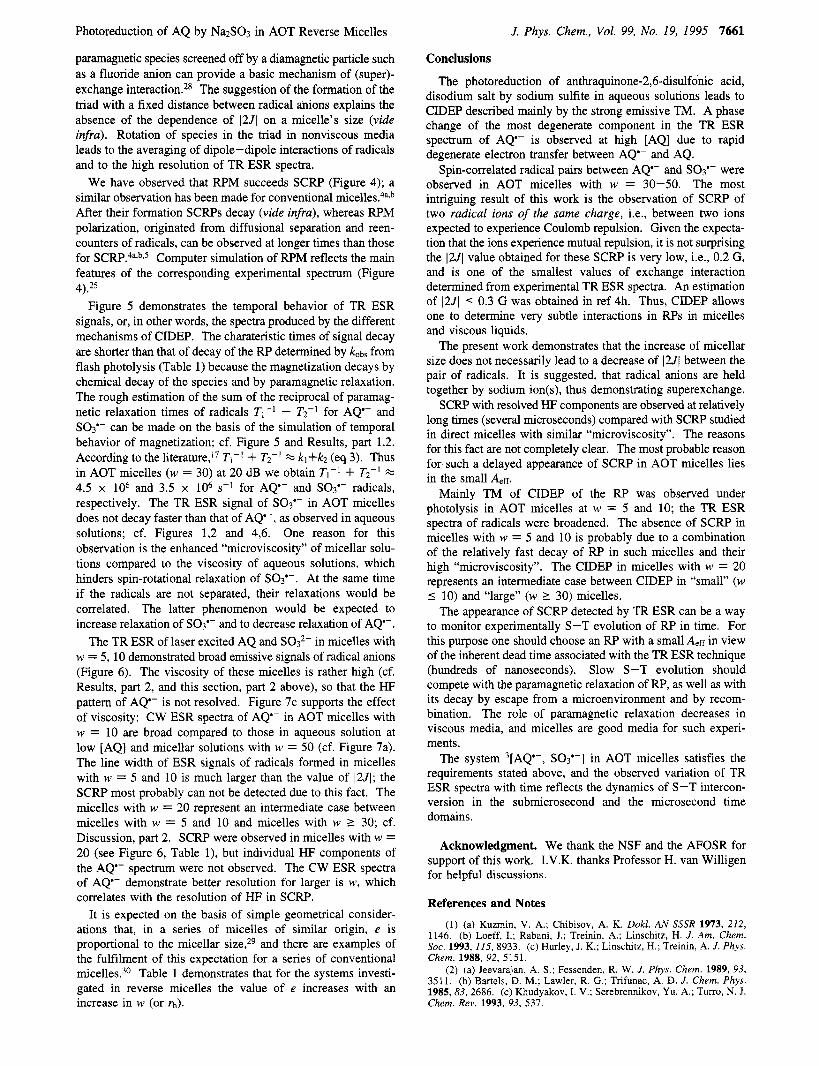
3. Laser Flash Photolysis of Micellar Solutions. Laser flash photolysis of micellar solutions of AQ and Na2S03 leads to appearance of the transient absorption of AQ- (Figure 8), which possesses a Amax at 510-520 r~m. ' , '~ The radical anion S03'- absorbs in the UV region of the ~pectrum.'~ The decay kinetics of AQ- were monitored at the absorption maximum and are satisfactorily approximated by the fust order law with k&s (s-I); cf. Figure 9. In accordance with the standard kinetic treatment,2c,4fJ it was asssumed that radicals participate in two competing reactions:I8
AQ + S032- "recombination" k r f
AQ*- + SO3*- dissociation 3[AQ*-, SO3'-] $
i.e., back-electron transfer within micelles ("recombination", characterized by k, (s-I) and dissociation or exit from the micelles into solvent bulk (characterized with k,j (s-I)). Here and below, square brackets designate a RP in a micelle; the superscript at the left bracket stands for the initial multiplicity of the RP. The value micelle escape e is defined as e = kd/ k b s . The method of calculation of k,j and k, from kinetic traces has been published.4f,21 The measured values of e, k d , and k, are presented in the Table 1.
The k& values describe the intramicellar reactions since the dilution of the solution by a factor of 2 yields the same value of kobs within the experimental error of AQ and NazS03 yields the same values of k and e within experimental error (cf. Table 1).
Discussion
1. Aqueous Solutions. TR ESR spectra produced by pulsed laser excitation of an aqueous solution of AQ and S03*- demonstrate very strong emission due to TM (Figure 1). Emissive TM is characteristic for photoreduction of quinones?,17 Contributions assignable to F M are evident for so3'- at long times (more than 1 ps, Figure 2). so3'- does not possess magnetic and its g-factor is less than that of the counter- radical AQ'- (see Results, part 1.1). It is expected that for a triplet RP of two such radicals the radical SOi- will manifest an absorptive signal due to the action of RPM.3317a In fact,
Photoreduction of AQ by Na2S03 in AOT Reverse Micelles
8
0.00 0.10 0.20 0.30 0.40
0.00 0.25 0.50 0.75
Figure 9. Kinetic traces at 1 = 515 nm obtained by nanosecond laser photolysis of AQ in the presence of Na2S.03 in two micellar solutions. The compositions of solutions are presented in Table 1.
Figures 1 and 2 demonstrate the transformation of the SO3’- signal from emission to absorption at long times due to RPM.
The reason for the absence of RPM for AQ‘- probably results from the degenerate electron exchange shown in eq 5, which leads to the elimination of the HF dependence.” The individual HF components of AQ‘- (unperturbed by RPM) were observed only at relatively low concentration of AQ (Figure 1). The expected switch of the AQ‘- spectrum from emission to absorption of the most degenerate component in the ESR spectrum (in the center of the spectrum of AQ‘-) is observed at relatively high [AQ] as well; see Figure 2.23
The TR ESR signal of SO3’- radicals decays faster than that of AQ‘- (Figures 1 and 2 ) although AQ‘- and so3’- radicals decay almost at the same rate.’ Relatively fast spin-rotational relaxation of SO3’- *ab is the probable reason for the faster decay of its TR ESR signal.
The weak TR ESR spectrum presented in Figure 3 is ascribed to the radicals 3[AQ-d,j’-, SO3’-]. The HF constants in the perdeuteriated semiquinone radical AQ-d6’- are 6-7 times less’la than those of AQ‘- (see Results, part 2) . Consistent with this expectation, only an unresolved envelope of the ESR spectrum of AQ-d6’- is observed. We are currently investigating the photoreduction of AQ-d6 in different media.
2. Properties of AOT Micelles. Prior to the discussion of our results we will briefly summarize relevant properties of AOT reverse micelles; see Chart 1. In nonpolar solvents, AOT is known to form reverse micelles and microemulsions, which are capable of solubilizing considerable amounts of water.I6 Typi- cally a reverse micelle droplet (water pool) contains between 250 and 2500 water molecules.16a AOT reverse micelles are often assumed to be spherical water droplets of almost equal size,I6 as shown schematically in Chart 1. At low concentrations of AOT (less than 0.1-0.2 M) and a given w the shape of micelles and their size is assumed to be independent of
J. Phys. Chem., Vol. 99, No. 19, 1995 7659
[AOT] ,16g,i,m There are different estimations and measurements of a Stokes or hydrodynamic micelle radius ri-,I6’ for a given w. Table 1 presents estimations of ri-, based on the data of refs 16e,f,i; the data of these publications lead to values of n close to each other. Chart 1 demonstrates the radius of the aqueous core (or of the water pool) of a micelle (rw), which is approximately 1.5 times less than rh (cf. Table 1 and refs 16d,f,h). The solution of water-soluble molecules in AOT micelles should influence the value of rh;16b however, we are unaware of any dramatic effect of such solutes on a reverse micelle’s size.
The ‘“icroviscosity” of AOT micelles decreases with an increase in w (most rapidly up to w % 10); the “microviscosity” of AOT micelles at w = 15-50 is ca. 10 cP.’& On the basis of our CW ESR data on radical N’- (Results, part 2), we can compare the rotational correlation time t of the radical in aqueous solution (77 1 cP) and in AOT micelles and estimate the “microviscosity” of micelles. In this manner, we estimate the “microviscosity” of the reverse micelle to be 77 % 6 and 65 CP for solutions with w = 50 and 5, respectively (cf. Results, part 2). Published data’& (see above) are in agreement with these estimations of the “microviscosity”. AOT micelles characterized by w values up to -10 contain “bound water” molecules; at 10 < w < 20, “trapped water”, and at w > 20, apparently “free water”.16m
3. AOT Micellar Solutions. TR ESR spectra of the RP 3[AQ‘-, SO3’-] in AOT micelles are quite different from those obtained in aqueous solutions (Figures 1,2 and 4,6). Micelles have a relatively higher viscosity (cf. previous section 2 ) and restricted volume for diffusion; these conditions are known to be favorable for the TR ESR observation of photogenerated SCRP.3-5 For triplet derived SCRP and a negative value of exchange interaction U, each HF component splits into an EIA pattern4 (Figure 4).
The micelles with w = 30-50, which contain free water, demonstrate SCRP with a well-resolved HF pattern at longer times of observation (ca. 4-5 ,us); see Figure 4. Assuming that the motion of radicals of pairs is fast enough to average the dipole-dipole interactions of radicals in pair, anisotropy of g-factor, and HF interaction, the distance between the maximum and minimum of each hyperfine E/A component (peak to peak width) in the TR ESR spectra (A, cf. Figure 4) can be identified as the value of the exchange interaction A IUI in SCRP.4a It is assumed also that translational motion is fast compared to the inverse of the exchange interaction leading to the averaging of 2J;4a see below. Computer simulation of SCRP is in good agreement with the experimental spectra (Figure 4) and leads to the average 2J = -0.2 G.
The RP is generated in the triplet state initially’ (eq 2). The SCRP is formed after diffusion separations/reencounters and S-TO mixing of the states at the distances r between radicals where (zl(r)l < Aeff.4a’5 Aeff is the effective HFC constant, which determines the frequency (rate) of S-To interconversion neces- sary to drain the To state and to form the SCRP. Usually it is assumed that the S-To mixing due to hyperfine interaction and Zeeman energy differences between the pair components with the frequency Q occurs very rapidly compared to the time, when observation of SCRP is initiated (ca. ~ ) . ~ ~ , ~ , ~ , g , ~ This suggestion allows a rather simple theoretical treatment of time independent S C w a and is supported e ~ p e r i m e n t a l l y . ~ ~ , ~ , ~ - ~ It is important to note that the ESR pattern of the SCRP and the line widths do not depend signijkantly upon time during observation of the SCRP in conventional anionic and cationic micelles (usually from hundreds of nanoseconds up to several microsecond^^^,^*^-^.^^). However, the overall intensity of SCRP
7660 J. Phys. Chem., VoE. 99, No. 19, 1995
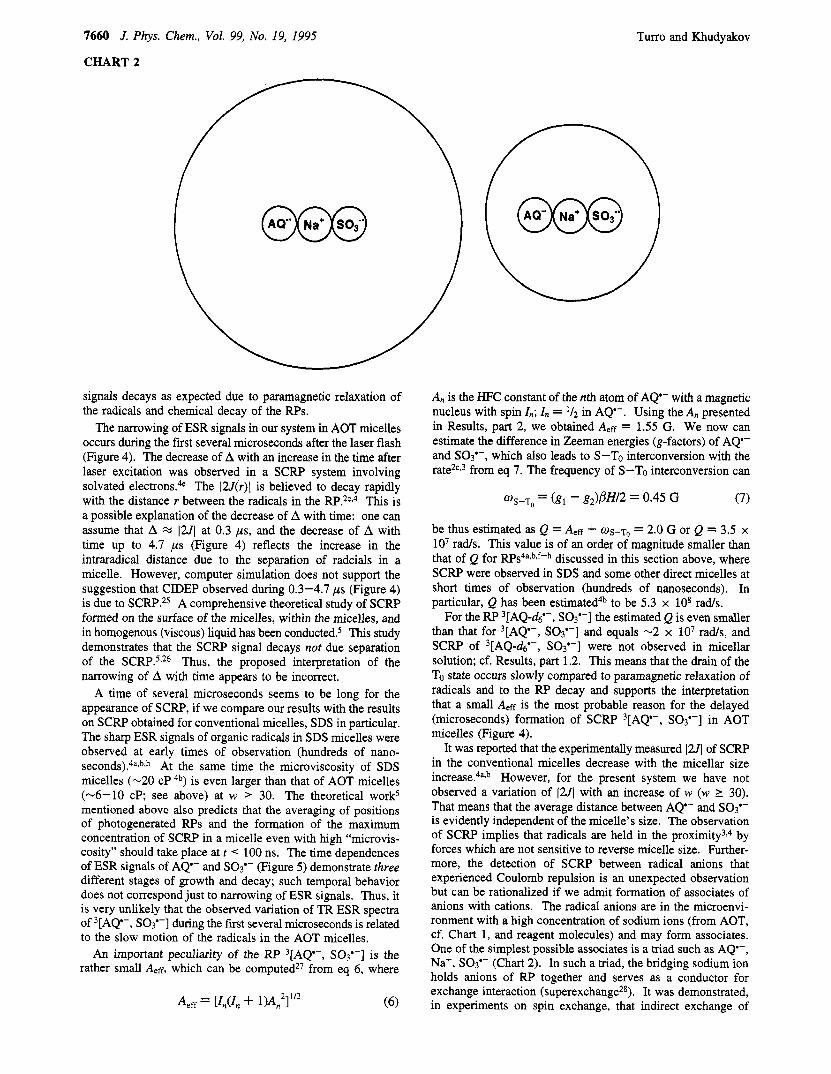
CHART 2
T m o and Khudyakov
AO" Na+ SO3" OOO /
signals decays as expected due to paramagnetic relaxation of the radicals and chemical decay of the RPs.
The narrowing of ESR signals in our system in AOT micelles occurs during the fist several microseconds after the laser flash (Figure 4). The decrease of A with an increase in the time after laser excitation was observed in a SCRP system involving solvated electrons.& The IU(r)l is believed to decay rapidly with the distance r between the radicals in the R P . 2 c 9 4 This is a possible explanation of the decrease of A with time: one can assume that A 1231 at 0.3 ps, and the decrease of A with time up to 4.7 ps (Figure 4) reflects the increase in the intraradical distance due to the separation of radcials in a micelle. However, computer simulation does not support the suggestion that CIDEP observed during 0.3-4.7 ps (Figure 4) is due to SCRP.25 A comprehensive theoretical study of SCRP formed on the surface of the micelles, within the micelles, and in homogenous (viscous) liquid has been c~nducted.~ This study demonstrates that the SCRP signal decays not due separation of the SCRP.5926 Thus, the proposed interpretation of the narrowing of A with time appears to be incorrect.
A time of several microseconds seems to be long for the appearance of SCRP, if we compare our results with the results on SCRP obtained for conventional micelles, SDS in particular. The sharp ESR signals of organic radicals in SDS micelles were observed at early times of observation (hundreds of nano- s e c o n d ~ ) . ~ ~ . ~ , ~ At the same time the microviscosity of SDS micelles (-20 CP 4b) is even larger than that of AOT micelles (-6-10 cP; see above) at w > 30. The theoretical work5 mentioned above also predicts that the averaging of positions of photogenerated RPs and the formation of the maximum concentration of SCRP in a micelle even with high "microvis- cosity" should take place at t < 100 ns. The time dependences of ESR signals of AQ'- and SOg- (Figure 5) demonstrate three different stages of growth and decay; such temporal behavior does not correspond just to narrowing of ESR signals. Thus, it is very unlikely that the observed variation of TR ESR spectra of 3[AQ'-, SO3'-] during the fist several microseconds is related to the slow motion of the radicals in the AOT micelles.
An important peculiarity of the RP 3[AQ'-, SO3'-] is the rather small Aeff, which can be computed27 from eq 6, where
A,, = [Zn(Zn -I- 1)A,2]1'2
A, is the HFC constant of the nth atom of AQ'- with a magnetic nucleus with spin I,; Z, = '12 in AQ'-. Using the A, presented in Results, part 2, we obtained A,ff = 1.55 G. We now can estimate the difference in Zeeman energies (g-factors) of AQ'- and S03'-, which also leads to S-TO interconversion with the rate2c,3 from eq 7. The frequency of S-To interconversion can
(7) w ~ - ~ , = (gl - g2)BH/2 = 0.45 G
be thus estimated as Q = A,ff + OS-T, = 2.0 G or Q = 3.5 x lo7 rads. This value is of an order of magnitude smaller than that of Q for R P s ~ ~ ~ ~ ~ ~ - ~ discussed in this section above, where SCRP were observed in SDS and some other direct micelles at short times of observation (hundreds of nanoseconds). In particular, Q has been estimated4b to be 5.3 x los rads.
For the RP 3[AQ-d6'-, SO3'-] the estimated Q is even smaller than that for 3[AQ'-, SO3'-] and equals -2 x lo7 rads, and SCRP of 3[AQ-d6'-, Sop-] were not observed in micellar solution; cf. Results, part 1.2. This means that the drain of the TO state occurs slowly compared to paramagnetic relaxation of radicals and to the RP decay and supports the interpretation that a small A,ff is the most probable reason for the delayed (microseconds) formation of SCRP 3[AQ'-, SO3'-] in AOT micelles (Figure 4).
It was reported that the experimentally measured IWI of SCRP in the conventional micelles decrease with the micellar size i n c r e a ~ e . ~ ~ , ~ However, for the present system we have not observed a variation of (211 with an increase of w (w 1 30). That means that the average distance between AQ'- and SO3'- is evidently independent of the micelle's size. The observation of SCRP implies that radicals are held in the p r ~ x i m i t y ~ , ~ by forces which are not sensitive to reverse micelle size. Further- more, the detection of SCRP between radical anions that experienced Coulomb repulsion is an unexpected observation but can be rationalized if we admit formation of associates of anions with cations. The radical anions are in the microenvi- ronment with a high concentration of sodium ions (from AOT, cf. Chart 1, and reagent molecules) and may form associates. One of the simplest possible associates is a triad such as AQ'-, Na+, SO3'- (Chart 2). In such a triad, the bridging sodium ion holds anions of RP together and serves as a conductor for exchange interaction (superexchange2*). It was demonstrated, in experiments on spin exchange, that indirect exchange of
Photoreduction of AQ by Na2S03 in AOT Reverse Micelles
paramagnetic species screened off by a diamagnetic particle such as a fluoride anion can provide a basic mechanism of (super)- exchange interaction.28 The suggestion of the formation of the triad with a fixed distance between radical anions explains the absence of the dependence of 1251 on a micelle’s size (vide infra). Rotation of species in the triad in nonviscous media leads to the averaging of dipole-dipole interactions of radicals and to the high resolution of TR ESR spectra.
We have observed that RPM succeeds SCRP (Figure 4); a similar observation has been made for conventional micelle^.^"*^ After their formation SCRPs decay (vide infra), whereas RPM polarization, originated from diffusional separation and reen- counters of radicals, can be observed at longer times than those for SCRP.4a9bv5 Computer simulation of RPM reflects the main features of the corresponding experimental spectrum (Figure
Figure 5 demonstrates the temporal behavior of TR ESR signals, or, in other words, the spectra produced by the different mechanisms of CIDEP. The charateristic times of signal decay are shorter than that of decay of the RP determined by kobs from flash photolysis (Table 1) because the magnetization decays by chemical decay of the species and by paramagnetic relaxation. The rough estimation of the sum of the reciprocal of paramag- netic relaxation times of radicals TI-’ + T2-l for AQ‘- and SO3’- can be made on the basis of the simulation of temporal behavior of magnetization; cf. Figure 5 and Results, part 1.2. According to the literature,I7 TI-’ + T2-I % kl+k2 (eq 3). Thus in AOT micelles (w = 30) at 20 dB we obtain TI-’ + T2-I 4.5 x lo6 and 3.5 x lo6 s-l for AQ‘- and so3’- radicals, respectively. The TR ESR signal of SO3’- in AOT micelles does not decay faster than that of AQ‘-, as observed in aqueous solutions; cf. Figures 1,2 and 4,6. One reason for this observation is the enhanced “microviscosity” of micellar solu- tions compared to the viscosity of aqueous solutions, which hinders spin-rotational relaxation of SO3’-. At the same time if the radicals are not separated, their relaxations would be correlated. The latter phenomenon would be expected to increase relaxation of SO3*- and to decrease relaxation of AQ-.
The TR ESR of laser excited AQ and s03’- in micelles with w = 5, 10 demonstrated broad emissive signals of radical anions (Figure 6). The viscosity of these micelles is rather high (cf. Results, part 2, and this section, part 2 above), so that the HF pattern of AQ‘- is not resolved. Figure 7c supports the effect of viscosity: CW ESR spectra of AQ‘- in AOT micelles with w = 10 are broad compared to those in aqueous solution at low [AQ] and micellar solutions with w = 50 (cf. Figure 7a). The line width of ESR signals of radicals formed in micelles with w = 5 and 10 is much larger than the value of 1251; the SCRP most probably can not be detected due to this fact. The micelles with w = 20 represent an intermediate case between micelles with w = 5 and 10 and micelles with w 2 30; cf. Discussion, part 2. SCRP were observed in micelles with w = 20 (see Figure 6, Table l), but individual HF components of the AQ‘- spectrum were not observed. The CW ESR spectra of AQ‘- demonstrate better resolution for larger is w, which correlates with the resolution of HF in SCRP.
It is expected on the basis of simple geometrical consider- ations that, in a series of micelles of similar origin, e is proportional to the micellar size,29 and there are examples of the fulfilment of this expectation for a series of conventional micelles.30 Table 1 demonstrates that for the systems investi- gated in reverse micelles the value of e increases with an increase in w (or f i ) .
4).25
J. Phys. Chem., Vol. 99, No. 19, 1995 7661
Conclusions
The photoreduction of anthraquinone-2,6-disulfonic acid, disodium salt by sodium sulfite in aqueous solutions leads to CIDEP described mainly by the strong emissive TM. A phase change of the most degenerate component in the TR ESR spectrum of AQ‘- is observed at high [AQ] due to rapid degenerate electron transfer between AQ‘- and AQ.
Spin-correlated radical pairs between AQ‘- and SO3’- were observed in AOT micelles with w = 30-50. The most intriguing result of this work is the observation of SCRP of two radical ions of the same charge, i.e., between two ions expected to experience Coulomb repulsion. Given the expecta- tion that the ions experience mutual repulsion, it is not surprising the 12JJ value obtained for these SCRP is very low, Le., 0.2 G, and is one of the smallest values of exchange interaction determined from experimental TR ESR spectra. An estimation of 124 < 0.3 G was obtained in ref 4h. Thus, CIDEP allows one to determine very subtle interactions in RPs in micelles and viscous liquids.
The present work demonstrates that the increase of micellar size does not necessarily lead to a decrease of 1251 between the pair of radicals. It is suggested, that radical anions are held together by sodium ion( s), thus demonstrating superexchange.
SCRP with resolved HF components are observed at relatively long times (several microseconds) compared with SCRP studied in direct micelles with similar ‘“icroviscosity”. The reasons for this fact are not completely clear. The most probable reason for such a delayed appearance of SCRP in AOT micelles lies in the small A,ff.
Mainly TM of CIDEP of the RP was observed under photolysis in AOT micelles at w = 5 and 10; the TR ESR spectra of radicals were broadened. The absence of SCRP in micelles with w = 5 and 10 is probably due to a combination of the relatively fast decay of RP in such micelles and their high “microviscosity”. The CIDEP in micelles with w = 20 represents an intermediate case between CIDEP in “small” (w I 10) and “large” (w L 30) micelles.
The appearance of SCRP detected by TR ESR can be a way to monitor experimentally S-T evolution of RP in time. For this purpose one should choose an RP with a small A,ff in view of the inherent dead time associated with the TR ESR technique (hundreds of nanoseconds). Slow S-T evolution should compete with the paramagnetic relaxation of RP, as well as with its decay by escape from a microenvironment and by recom- bination. The role of paramagnetic relaxation decreases in viscous media, and micelles are good media for such experi- ments.
The system 3[AQ‘-, SO3*-] in AOT micelles satisfies the requirements stated above, and the observed variation of TR ESR spectra with time reflects the dynamics of S-T intercon- version in the submicrosecond and the microsecond time domains.
Acknowledgment. We thank the NSF and the AFOSR for support of this work. I.V.K. thanks Professor H. van Willigen for helpful discussions.
References and Notes (1) (a) Kuzmin, V. A,; Chibisov, A. K. Dokl. AN SSSR 1973, 212,
(2) (a) Jeevarajan, A. S.; Fessenden, R. W. J . Phys. Chem. 1989, 93, 3511. (b) Bartels, D. M.; Lawler, R. G.; Trifunac, A. D. J . Chem. Phys. 1985,83, 2686. (c) Khudyakov, I. V.; Serebrennikov, Yu. A,; Turro, N. J. Chem. Rev. 1993, 93, 537.
7662 J. Phys. Chem., Vol. 99, No. 19, 1995
(3) (a) Hirota, N.; Yamauchi, S. In Dynamics of Excited Molecules; Kuchitsu, K., Ed.; Studies in Physical and Theroetical Chemistry; Elsevi- er: Amsterdam, 1994; Vol. 82, p 513. (b) Wan, J. K. S.; Depew, M. C. Res. Chem. Intermed. 1992, 18, 227. (c) McLauchlan, K. A. Chem. SOC. Rev. 1993, 22, 325.
(4) (a) Closs, G. L.; Forbes, M. D. E.; Noms, J. R. J . Phys. Chem. 1987, 91, 3592. (b) Wu, C.-H.; Jenks, W. S.; Koptyug, I. V.; Ghatlia, N. D.; Lipson, M.; Tarasov, V. F.; Turro, N. J. J . Am. Chem. SOC. 1993,115, 9583. (c) Ishawata, N.; Murai, H.; Kuwata, K. Res. Chem. Intermed. 1993, 19, 59. (d) Kothe, G.; Weber, S.; Ohmes, E.; Thumauer, M. C.; Noms, J. R. J . Phys. Chem. 1994, 98, 2706. (e) Murai, H.; Honma, H.; Kuwata, K. Res. Chem. Intermed. 1993, 19, 103. (f) Khudyakov, I. V.; McGany, P. F.; Turro, N. J. J . Phys. Chem. 1993, 97, 13234. (g) Ishiwata, N.; Murai, H.; Sakaguchi, Y.; Hayashi, H. Z. Phys. Chem. 1993,182,41. (h) Levstein, P. R.; van Willigen, H. Chem. Phys. Lett. 1991, 187, 415.
(5) Hore, P. J.; Hunter, D. A. Mol. Phys. 1992, 75, 1401. (6) (a) Tominaga, K.; Yamauchi, S.; Hirota, N. Chem. Phys. Lett. 1991,
179, 35. (b) Tominaga, K.; Yamauchi, S.; Hirota, N. J . Chem. Phys. 1990, 92,5175. (c) Levin, P. P.; Khudyakov, I. V.; Kuzmin, V. A. J. Phys. Chem. 1989, 93, 208.
(7) Turro, N. J.; Khudyakov, I. V.; Bossmann, S. H.; Dwyer, D. W. J . Phys. Chem. 1993, 97, 1138.
(8) van Os, N. M.; Haak, J. R.; Rupert, L. A. M. Physico-Chemical Properties of Selected Anionic, Cationic and Nonionic Surfactants; Elsevi- er: Amsterdam, 1993.
(9) Gao, Z.; Wasylishen, R. E.; Kwak, J. C. T. J . Chem. Soc., Trans. Faraday SOC. 1991, 87, 947.
(10) (a) Nguyen, D. N.; Stenhagen, A. E. Patent, Fr. 1, 466,088 (Jan 13, 1967). (b) Wang, J. F. Ph.D. Thesis, Columbia University, 1990.
(1 1) (a) Fischer, H., Helwege, K.-H., Eds. Magnetic Properties of Free Radicals; Springer: Berlin, 1977. (b) Baugh, P. J.; Phillips, G. 0.; Arthur, J. C. J . Phys. Chem. 1966, 70, 3061.
(12) Hydrolysis of NazSO3 leads to slightly basic aqueous solutions. (13) Huie, R. E.; Neta, P. J . Phys. Chem. 1984, 88, 5665. (14) Khudyakov, I. V.; Kuzmin, V. A. Russ. Chem. Rev. 1975,44,801. (15) After refs 16a-d. (16) (a) Robinson, B. H.; James, A. D.; Steytler, D. C. In Proton and
Ions Involved in Fast Dynamic Phenomena; Laszlo, P., Ed.; Elsevier: Amsterdam, 1978; p 287. (b) Robinson, B. H.; Steytler, D. C.; Tack, R. D. J . Chem. Soc., Faraday Trans. 1 1979, 75, 481. (c) Nakamura, H.; Baglioni, P.; Kevan, L.; Matsuo, T. J . Phys. Chem. 1991, 95, 1480. (d) Casado, J.; Izquierdo, C.; Fuentoes, S.; Moya, M. L. J . Chem. Educ. 1994, 71,446. (e) Hasegawa, M.; Sugimura, T.; Suzaki, Y.; Shindo, Y.; Kitahara, A. J . Phys. Chem. 1994, 98, 2120. (f) Hubig, S. M.; Rodgers, M. A. J. J . Phys. Chem. 1990, 94, 1933. (g) Bohne, C.; Abuin, E. B.; Scaiano, J. C. Langmuir 1992, 8, 469. (h) Petit, C.; Brochette, P.; Pileni, M. P. J . Phys. Chem. 1986, 90, 6517. (i) Zulauf, M.; Eicke, H.-F. J. Phys. Chem. 1979, 83,480. (i) Atik, S. S.; Thomas, J. K. J . Am. Chem. SOC. 1981, 103, 3543. (k) Uehata, A.; Nakamura, H.; Usui, S.; Matsuo, T. J . Phys. Chem. 1989, 93, 8197. (1) D'Angelo, M.; Onori, G.; Santucci, A. J . Phys. Chem. 1994, 98, 3189. (m) Eicke, H.-F.; Kvita, P. In Reverse Micelles; Luisi, P. L., Straub, B. E., Eds.; Plenum: New York, 1984; p 21.
(17) (a) Buckley, C. D.; Grant, A. I.; McLauchlan, K. A,; Ritchie, A. J. D. Faraday Discuss. Chem. Soc. 1984, 78, 257. (b) Hore, P. J.; McLauchlan, K. A.; Frydkjaer, S.; Muus, L. T. Chem. Phys. Lett. 1981, 77, 127. (c) Hore, P. J.; McLauchlan, K. A. Mol. Phys. 1981, 42, 1009. (d) Hore, P. J.; McLauchlan, K. A. Chem. Phys. Lett. 1980, 75, 582. (e) McLauchlan, K. A.; Stevens, D. G. J. Chem. Phys. 1987, 87, 4399.
Turro and Khudyakov
(18) The CW-ESR spectra of SO,'- radical was not observed under present experimental conditions (low light intensity) due to its higher reactivity compared to that of AQ'- and possible reactions with buffer stuff, impurities, and traces of oxygen;13J4 at the same time under conditions of flash irradiation the bimolecular reaction between AQ'- and so3'- is the main path of both radicals' decay.'
(19) Meisel, D.; Fessenden, R. W. J . Am. Chem. Soc. 1976, 98, 7505. (20) Ottaviani, M. F.; Baglioni, P.; Martini, G. J . Phys. Chem. 1983,
87, 3146. (21) Scaiano, J. C.; Abuin, E. B.; Stewart, L. C. J . Am. Chem. SOC. 1982,
104, 5673. (22) The natural abundance of magnetic isotopes of sulfur is less that
1%. (23) The most degenerate component (center of the AQ'- spectrum)
undergoes the first phase inversion. It is expected that at later times all such spectra should undergo phase inversion, cf. ref 17.
(24) The line width of spectra due to SCRP created by hydrogen abstraction of excited benzaldehyde from ground state benzaldehyde in SDS micelles4' does not depend on time (10-7-10-6 s) (Khudyakov, I. V. Unpublished results, 1993). Only a slight decrease (up to -15%) of the line width of durosemiquinone radical anion of SCRP in CTAC micelles with time was observed in ref 4h. SCRP spectra were detected by FT- ESR in the time interval from 20 ns to 2-3 ps. The "microvicosity" of CTAC micelles (7 % 44 cP) is relatively high; cf.: Atik, S. S.; Singer, L. A. Chem. Phys. Lett. 1978, 59, 519.
(25) Computer simulation of SCRpa,' spectra allows examination of the variation of 2J and the line width in the ESR spectra (the HFC constants and g-factors of radicals are known; cf. Results sections, parts 1.1 and 1.2). In addition, TM and RPM components may be added to the calculated SCRP spectrum in order to mimic the experimental spectrum. However, employing the programs available to us, we were unable to simulate the essential features of the observed CIDEP pattem for early times of observation, Le., 0.1-2.0 ps (Figure 4). Thus, the time evolution of the present system remains a challenging problem for a future theoretical study.
(26) It is usually believed that IU(r)l falls by approximately an order of magnitude for every A xz 1 A increase in radical s e p a r a t i ~ n . ~ ~ ~ ~ ~ * ~ One can expect for relatively large AQ'- the translational diffusion coefficient D(AQ'-) of the order of 6-10 cP, Le., in AOT micelles at w Z 30; cf. Discussion section, part 2 (see: Burshtein, A. I.; Khudyakov, I. V.; Yakobson, B. I. Prog. React. Kinet. 1984, 13, 221). l f the mutual diffusion of closely spaced A@- and s03'- is uncorrelated,6 then the mutual diffusion coefficient D12 = D(AQ'-) + D(so3'-) between large and small radicals should be of 10-5-10-6 cm2/s. The variation of U ( r ) by several orders of magnitude due to variation of the root mean square distance Ar between radicals to several angstroms will occur during the characteristic time o f t = (Ar)2/6012 < 10-9-10-8 s. Thus the estimated characteristic time of diffusional separation of AQ'- and so3'- is at least 2 orders of magnitude shorter than the time of SCRP appearance (several microseconds).
cm2/s in a media the viscosity of 9
(27) Steiner, U. E.; Ulrich, T. Chem. Rev. 1989, 89, 51. (28) Molin, Yu. N.; Salikhov, K. M.; Zamaraev, K. I. Spin Exchange;
(29) Tachia, M. In Kinetics of Nonhomogeneous Processes; Freeman,
(30) Turro, N. J.; Weed, G. C. J . Am. Chem. SOC. 1983, 105, 1861.