• Manganese is the world’s fourth most heavily consumed metal (after iron, aluminium and copper) • Global mine output of 17 million tonnes (contained metal) in 2014 – over 90% goes into steel • All steels contain manganese • Manganese is used to remove sulphur from liquid steel (sulphur causes steel to crack) • There is no viable substitute for manganese as a de-sulphiriser • Manganese is also used to improve the strength of certain steels (especially structural steels, high strength flat steels) • Non-steel consumption of manganese includes de-polarisation of dry-cell batteries, an additive in certain aluminium and copper alloys and animal feed What is manganese?
Transcript
• Manganese is the world’s fourth most heavily consumed metal(after iron, aluminium and copper)
• Global mine output of 17 million tonnes (contained metal) in 2014 – over 90% goes into steel
• All steels contain manganese
• Manganese is used to remove sulphur from liquid steel(sulphur causes steel to crack)
• There is no viable substitute for manganese as a de-sulphiriser
• Manganese is also used to improve the strength of certain steels(especially structural steels, high strength flat steels)
• Non-steel consumption of manganese includes de-polarisation of dry-cell batteries, an additive in certain aluminium and copper alloys and animal feed
What is manganese?
Steel demand SteelmakingDemand for Mn alloys
Mn alloys production
Mn ore mining
The steel industry consumes over 90% of all manganese units
Manganese industry value chain
• Manganese needs to be smelted into ferroalloy because it is added into steel after decarburisation(Mn ore is too impure to add to decarburised steel)
• Main Mn alloys are silicomanganese (SiMn), high carbon ferromanganese (HC FeMn),medium/low carbon ferromanganese (MLC FeMn), electrolytic manganese metal (EMM)
• The Mn ore industry is relatively consolidated , dominated by a few large producers (BHP Billiton / South32 by far the largest)…..though the industry is now fragmenting
• The Mn alloy industry is highly fragmented and characterised by low profitability. Around 60% of Mn alloys are produced in China. Output is dominated by a very large number of small Chinese companies (up to 1,000).
Steel product Key specifications Main Mn alloy product
Automotive strip mill carbon steel products
Low carbon contentLow silicon content
MLC FeMn
Other surface critical strip mill carbon steel products
Low silicon content HC FeMn
Standard strip millcarbon steel products
Low carbon content SiMn
Standard carbon steel long products
Higher carbon contentHigher silicon content
SiMn
High carbon steel long products
High carbon content HC FeMn
Stainless steel flat products
Low carbon contentHigh silicon content
LC SiMn in Europe, USAEMM in Asia
Main steel product demand drivers for manganese alloys
0
2
4
6
8
10
12
14
16
18
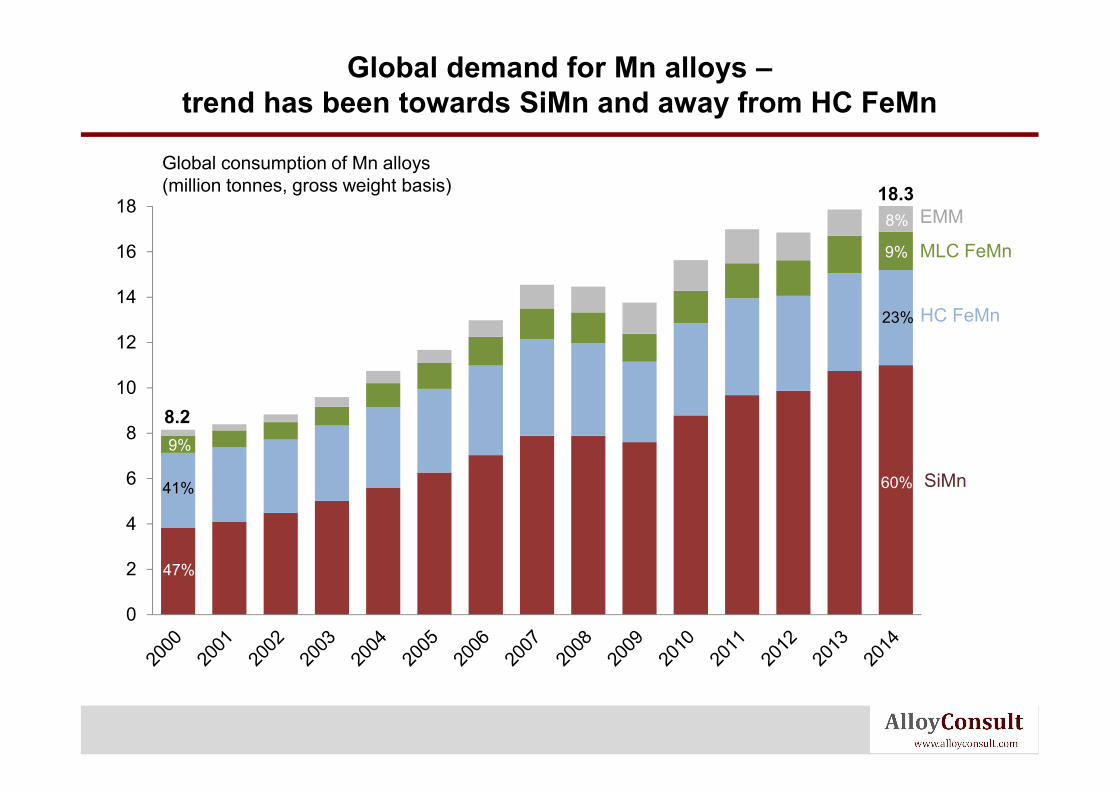
Global consumption of Mn alloys(million tonnes, gross weight basis)
SiMn
HC FeMn
MLC FeMn
47%
60%
11%
9%
41%
23%
Global demand for Mn alloys –trend has been towards SiMn and away from HC FeMn
EMM
8.2
18.3
9%
9%
8%
25%
30%
35%
40%
45%
50%
55%
60%
65%
0.69%
0.70%
0.71%
0.72%
0.73%
0.74%
0.75%
BRICs shareof global
steel output(right axis)
Average Mn content of global crude steel
output(left axis)
There are good reasons to expect that the average Mn content of steel will continue to rise
Structural steels require strength, so tend to have a high manganese content
Developing countries focus more on structural steel consumption – for infrastructure and buildings
Chinese building / earthquake resistance standards will continue to tighten, leading to higher Mncontent in steel (especially rebar)
Strong demand potential from India and other early-stage developing nations
Increasing use of high-strength steels in automotive sector
S.Africa
AustraliaChina
Gabon
Brazil
India
UkraineKazakhstan
GhanaOthers
Manganese ore production by country and company, 2014 –BHP more than twice the size of the next largest producer
Global Mn ore production by country, 2014
Total: ~17 million tonnesData shown on a contained metal basis
BHP Billiton(South32)
Privat-CML
Eramet
AssmangUMK
Vale
Tsipi +Kudumane
Others
Global Mn ore production by company, 2014
23%
11%
9%
8%7%4%
5%
30%
21%18%
5%
9%
3%
3%2%
2%
Global demand for manganese ore(million tonnes contained Mn)
0
5
10
15
20
Rest of world
China
24%
53%
7.5
17.3
20.0
Global demand for Mn ore – actual & forecast –Despite slowdown, demand will rise by ~3Mtpy by 2020
Brazil16%
India9%
China 7%
Georgia 5%
Gabon 3%
Known world Mn resources
South Africa89%
Reported world Mn reserves
Rest of World11%
total ~10 billion tonnes(~650 years of supply*)
South Africa23%
Ukraine21%
Australia14%
total ~650 million tonnes(~40 years of supply*)
Manganese ore global reserves & resources –South Africa utterly dominates global resources
* assuming current rate of mining
Most Mn ore in South Africa is in the Kalahari basin. New operations are based on lower grade semi-carbonate ore
Kalahari manganese basin
SOUTH AFRICA
High-grade ore, up to 48% Mn. Mostly controlled by long-established producers (Assmang and BHP Billiton)
Mn ore supply from S.Africa is currently constrainedby rail and port capacity bottlenecks
• Manganese ore for export from the Kalahari basin is subject to significant logistical bottlenecks in terms of rail and port capacity
• This has led to rationing of rail paths between producers, with increasing pressure from the new mines coming on-stream
• Current plans from Transnet propose expanded rail capacity and port terminal by earliest 2019-20. This has made it challenging for new entrants to ramp up as planned from 2012-15
• Trucking of Mn ore from the Kalahari has risen substantially, but comes with its own constraints in terms of cost, road/truck capacity and environmental/safety pressures. Mn ore also needs dedicated port capacity
• Current low Mn prices reduce business case for infrastructure investment
• More smelting in South Africa extremely difficult due to electricity shortage
• Up until a decade ago, Mn ore was typically sold on an annual contract basis(very similar to iron ore)
• The rise of China brought the “Chinese way” of buying on a spot basis into the Mn ore market….though some western customers still buy on annual agreements, spot pricing now totally dominates the Mn ore market(again, very similar to iron ore)
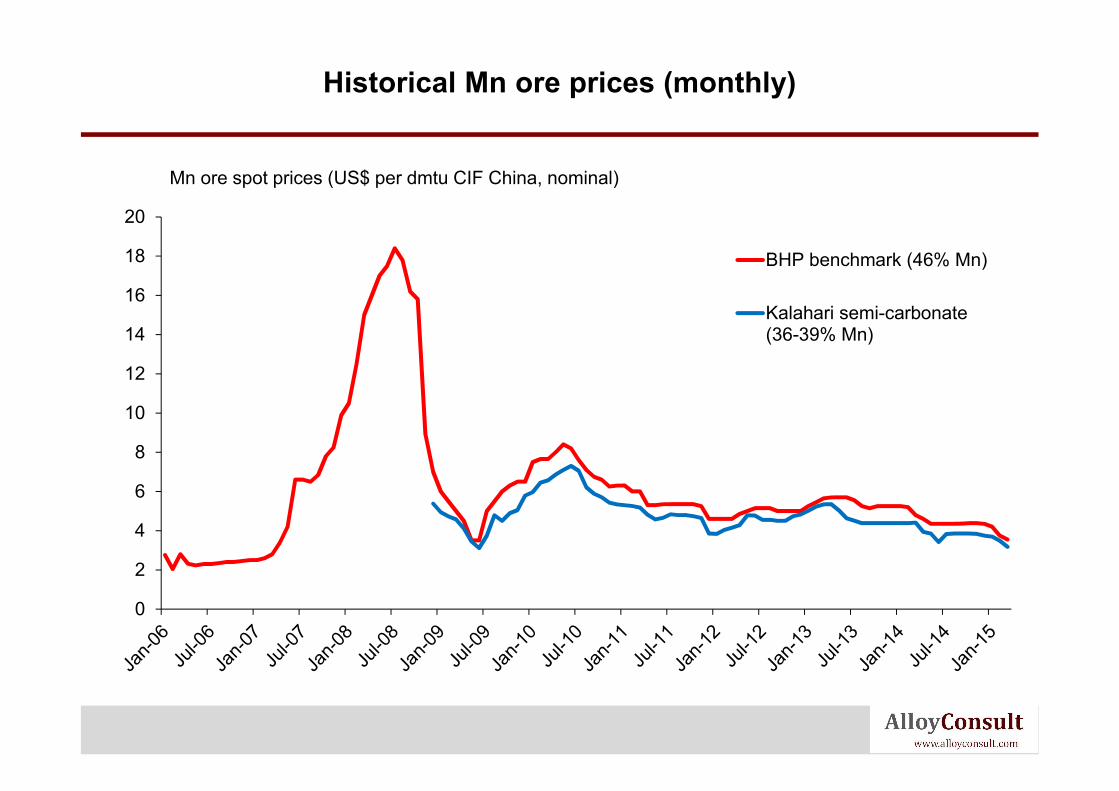
• Two spot price series are regularly published – “BHP benchmark” for high grade, “Kalahari semi-carbonate” for lower grade. Nevertheless the Mn ore market remains very untransparent…unlike steel and iron ore, index pricing for Mn ore has not significantly taken off
• Consequently, BHP Billiton remain a price setter in Mn ore, by virtue of their market leader status and publication of their benchmark prices. BHP Billiton have stated that they would prefer not to be in the position of setting the industry’s benchmark prices
Notes on manganese pricing mechanism (1)
• In most markets, Mn alloy prices have never normally been agreed on an annual contract basis
• Outside China much business is done on quarterly contracts; in China and some other markets, spot prices predominate
• Mn alloy spot prices are published to a significantly greater extent than Mn ore. Numerous industry publications provide a wide array of Mn alloy prices(Metal Bulletin, CRU, Ryan’s Notes, Asian Metal, Platts…)
• BHP Billiton does not have a market-leading presence in the Mn alloy markets(unlike Mn ore)Nevertheless it is an important producer, especially of HC FeMn
• In 2012, BHP Billiton implemented a strategy of selling all its Mn alloys to traders. This has impacted some Mn alloy markets significantly. South32 may well choose to rescind this and sell directly to customers
Notes on manganese pricing mechanism (2)
21
Country Operation Product Capacity
Australia GemcoMn ore
(avg 45%)4.8 Mtpa
S.Africa WesselsMn ore
(avg 44%)1.2 Mtpa
S.Africa MamatwanMn ore
(avg 40%)3.5 Mtpa
Australia Temco SiMn 120ktpa
Australia Temco HC FeMn 150ktpa
S.Africa Meyerton HC FeMn 350ktpa
S.Africa Meyerton MLC FeMn 90ktpa
Summary of BHP Billiton manganese operations
0
100
200
300
400
500
600
700
800
900
Thousands
MLCFeMn HCFeMn SiMn
BHP Billiton Mn alloy output by type(kt gross weight)
0
100
200
300
400
500
600
700
800
900
Thousands
Australia S.Africa
BHP Billiton Mn alloy output by location(kt gross weight)
BHP Billiton manganese alloy production –by product and location
22
0
1
2
3
4
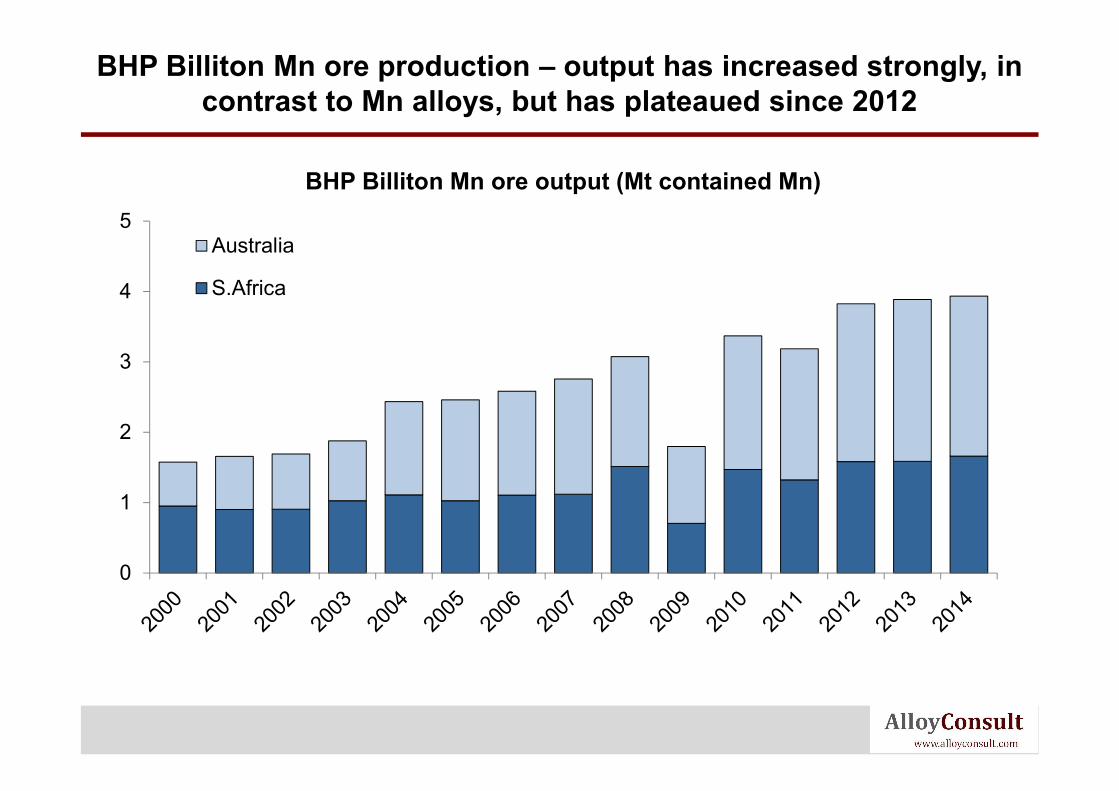
5Australia
S.Africa
BHP Billiton Mn ore output (Mt contained Mn)
23
BHP Billiton Mn ore production – output has increased strongly, in contrast to Mn alloys, but has plateaued since 2012
• World’s largest producer of Mn ores and leading producer of Mn alloys
• Vertically integrated Mn ore mining and smeltingoperations
• Large resources of medium and high-grade ores, which are mostly low in phosphorous
• Low ore and alloy production costs
• Location in relation to Chinese market
• Financial resources of parent company
• Big exposure to South African challenges(ownership, power prices, infrastructure, new entrants)
• Manganese very small percentage of company turnover, & profit; division is not a core business
• Poor manganese market outlook for some years
• Hard to sell all manganese assets together
• Financial resources available for expansion by
acquisition, if appropriate targets can be identified
• Dominant position in Mn ore market can be extended/consolidated, and leveraged
• Manganese demand will still grow faster than steel output
• Growth of India and other emerging economies partly to compensate for slowdown of Chinese growth
• Structural oversupply – manganese ore supply base seems to be fragmenting
• Persistently low prices reduce attractiveness of business
• Potential loss of rail paths to new South African entrants
• Macro risks (esp. exchange rates in South Africa)
• Political risk from native land claims in Australia and the black-empowerment movement in South Africa
• South African infrastructure constraints
Strengths Weaknesses
Opportunities Threats
BHP Billiton – manganese business SWOT analysis
24
• The Mn ore market remains quite consolidated, though has de-consolidated recently due to new entrants starting up in South Africa
• Potential for significant further consolidation appears limited at the present time, partly because the assets of the major producers are valued highly and there is a very limited number of potential buyers (this is partly why South32 is being formed – BHP Billiton were unable to sell their manganese assets conventionally)
• Consolidation of the new producers in South Africa would be complicated by political and Black Empowerment / ownership factors
• The Mn alloy industry is very fragmented, mostly because of the industry being dominated by hundreds of small Chinese producers. There seems little prospect of major consolidation in China, partly due to low barriers to entry
• Regulatory approval is unlikely to be a big hurdle to some further consolidation in the Mn ore and alloy markets
Notes on M&A potential
Mn ore cost curve, 2015 –BHP Billiton mines are in a favourable cost position
0.00
0.50
1.00
1.50
2.00
2.50
3.00
3.50
4.00
4.50
5.00
0 2 4 6 8 10
Ca
sh
co
st
CIF
Ch
ina
(U
SD
/dm
tu)
Supply of Mn ore to Chinese market (Mt contained Mn)
Current benchmark price
BHP Billiton mines
• There is little prospect of technological change significantly altering the competitive landscape; manganese is unsubstitutable in steel and indeed use of Mn per tonne of steel is rising
• Political matters impacting the manganese market include
• South Africa – BE laws, infrastructure bottlenecks, power shortages
• Native land claims at certain mines
• Toxicity of manganese as a substance, particularly harmful in dust form(linked to various brain diseases)
• Anti-dumping duties, mostly in Mn alloys
• Chinese export tax (20%) on Mn alloys
Notes on competitive landscape
0%
10%
20%
30%
40%
50%
Seaborne ores
28
Average Mn grade (%) of major manganese ores –BHP Billiton amongst the higher grade mines