Working Paper 27697http://www.nber.org/papers/w27697
NATIONAL BUREAU OF ECONOMIC RESEARCH1050 Massachusetts Avenue
Cambridge, MA 02138August 2020
The views expressed herein are those of the authors and do not necessarily reflect the views of the National Bureau of Economic Research.
NBER working papers are circulated for discussion and comment purposes. They have not been peer-reviewed or been subject to the review by the NBER Board of Directors that accompanies official NBER publications.
Peak China HousingKenneth S. Rogoff and Yuanchen YangNBER Working Paper No. 27697August 2020JEL No. F39,G01,R3
ABSTRACT
China’s real estate has been a key engine of its sustained economic expansion. This paper argues, however, that even before the Covid-19 shock, a decades-long housing boom had given rise to severe price misalignments and regional supply-demand mismatches, making an adjustment both necessary and inevitable. We make use of newly available and updated data sources to analyze supply-demand conditions in the fast-moving Chinese economy. The imbalances are then compared to benchmarks from other economies. We conclude that the sector is quite vulnerable to a sustained aggregate growth shock, such as Covid-19 might pose. In our baseline calibration, using input-output tables and taking account of the very large footprint of housing construction and real-estate related sectors, the adjustment to a decline in housing activity can easily trim a cumulative 5-10 percent from the level of output (over a period of years).
Kenneth S. RogoffThomas D Cabot Professor of Public PolicyEconomics DepartmentHarvard UniversityLittauer Center 216Cambridge, MA 02138-3001and [email protected]
Yuanchen YangPBC School of Finance Tsinghua University 43 Chengfu Road, Haidian District Beijing [email protected]
2
I. Introduction It has long been argued that despite China’s truly epic real estate boom over the past
three decades (as documented in a number of previous papers),3 the central government’s
ability to tightly monitor the financial system, and to resolve insolvencies quickly in the event
of a crisis, makes it relatively immune to conventional housing-related financial crises. At the
same time, however, this view has been largely untested thanks to the country’s extraordinary
growth performance, with expectations of further fast growth underpinning ever higher
housing prices. How much of a vulnerability might the real estate sector prove in the wake of
the Covid-19 shock?
This paper’s contribution is threefold. First, we make use of newly available sources, to
extend and significantly update earlier work on the size and scale of China’s housing market.
We especially take advantage of the digitization of China’s statistics, which has helped
provide both more extensive and more accurate data. Fang et al. (2015) document housing
price growth in major Chinese cities from 2003 to 2013, while Glaeser et al. (2017) track
changes in China’s construction square footage, household vacancy rates, etc. from 2002 to
2012. We find that significant changes, even before the Covid-19 pandemic, have taken place
since. During 2013-2018, for example, real estate investment increased by 30% and
household leverage ratio rose from 33% to 60%. Another important factor is that China
underwent a major change of leadership in 2013, and that has heavily influenced the
country’s real estate policies. Thus, using data (some of which runs through 2020) gives a
significantly more accurate picture of China’s rapidly-evolving housing market.
3 See, for example, Fang et al. (2015), Chivakul et al. (2015), Glaeser et al. (2017), and Koss and Shi (2018).
3
Second, we provide a quantitative characterization of the upstream and downstream
contribution to GDP of China’s real estate sector by exploiting newer input-output tables.
Our updated measure, based on cross-industry correlations derived from China’s most recent
input-output matrix, and taking into account higher-order effects (in addition to first-order) is
29%, even higher than in earlier studies.4
Real estate activity involves both the production of property and the provision of services
related to property. The former refers to building, renovating, repairing and maintaining of
property, while the latter includes buying, selling, renting and managing of property.5 In
addition, real estate is closely linked to an array of industries through the supply chain. To
complete a real estate project, various inputs are needed, including intermediate inputs, such
as steel and concrete, from the manufacturing sector, labor input from the construction sector,
capital input from the banking sector, etc. Hence to estimate the sum effect of real estate on
the economy, we consider not only the output of real estate sector alone, but also the output
share of closely related industries. Using the input-output table, we find that a 20% fall in real
estate activity could lead to a 5-10% fall in GDP, even without amplification from a banking
crisis, or accounting for the importance of real estate as collateral.
Third, we present a substantial body of evidence from the last 20 years using a variety of
Chinese and international datasets that strongly suggests the existence of a housing bubble in
China. Extant literature has largely concentrated on China alone (Fang et al., 2015; Ding et
4 Previous studies using narrower measures of housing’s impact typically put the size of the sector around 16% (e.g., Glaeser et al (2017), Liu and Xiong (2018)). Our measure is closest in spirit to Cook et. al. (2018) who use an earlier (2012) input output table and arrive at a 22% contribution of housing. See the Technical Appendix. 5 According to the International Standard Industrial Classification (the SIC codes), real estate is classified as a tertiary industry, encompassing only the provision of property-related services, which is merely part of housing activity.
4
al., 2017), with a few papers drawing comparison with the United States (e.g. Glaeser et al.,
2017). We take a cross-country perspective, starting with classic housing booms from
advanced economies while zooming in on China’s current boom, to enable comparison on a
global scale. Despite the repeated argument that China is different, we note that it shares
striking similarities with other boom episodes in the run-up of housing prices, the scale of the
construction sector, the debt accumulation etc. Indeed, given the severity of many economic
indicators, China’s decades-long housing boom shows many signs of having hit a potentially
precarious peak.6
The structure of the paper proceeds as follows. Section II briefly reviews the most
closely-related literature. Section III presents recent developments of China’s housing market
up to the Covid-19 pandemic (though we include some very recent 2020 data just before the
conclusions.) Section IV analyzes housing supply-demand dynamics. Section V examines
real estate’s linkage to the economy and its resilience to the Covid-19 stress. Section VI
concludes. Appendices provide data description and technical details.
II. The literature
The most closely-related studies to ours include earlier papers such as Fang et al. (2015),
Chivakul et al. (2015), Glaeser et al. (2017), and Koss and Shi (2018). Using data ending in
2013, 2014, 2012 and 2016 respectively, all of these papers explore the unique features
6 A considerable body of research has shown that housing sector is closely linked to business cycles (Leamer, 2007; 2015), Mian, Sufi and Verner (2017) and to post World War II financial crises (Reinhart and Rogoff, 2009; Jorda, Schularick and Taylor, 2016).
5
characterizing China’s housing market, and, like ours, analyze the possibility and
macroeconomic severity of potential bubble bursts.
Employing detailed information on the profile of mortgage borrowers, Fang et al. (2015)
find that housing price appreciation is largely matched by household income growth. The
participation by bottom-income mortgage borrowers in the housing market remains steady
despite onerous financial burdens, and their mortgage loans are protected by down payments
usually in excess of 35%. Therefore, an imminent financial crisis triggered by the housing
market is unlikely to happen in China.
Chivakul et al. (2015) identify China’s housing oversupply based on various datasets,
and consider a number of scenarios to restore supply-demand balance. The paper concludes
that the process of adjustment implies negative growth impacts, with the adverse effect being
stronger in smaller cities, as well as cities in the northeast region.
Glaeser et al. (2017) examine a variety of factors that help sustain China’s soaring
housing prices, highlighting, among other factors, the capacity and determination of the
Chinese government to regulate housing prices. The authors also warn about the potentially
significant social costs associated with the overemphasis on housing price stability, and
propose the alternative solution of accommodating high levels of housing construction and
supply.
Koss and Shi (2018) discuss the history of China’s property market and then assess its
resemblance to classic housing bubbles. In the event of a price drop and bubble burst, the
authors propose a battery of near-term policy prescriptions, ranging from the tightening of
6
mortgage requirements to the improvement of legal infrastructure, to help China withstand
the impact.
.
III. Recent Developments in the Rapidly Evolving Landscape
1. China’s Real Estate Boom
China’s real estate market started to form in the year 1988, when major urban housing
reforms intended to commercialize housing according to the demands of a socialist planned
economy were initiated. Since then, real estate has quickly emerged to be a “pillar” industry
and housing prices have taken off (Figure 1).
Figure 1. Residential Housing Prices and Annual Growth Rates This figure presents average residential housing price and year-on-year percentage change at the national level from 1991 to 2018.
National Average Housing Price (yuan/sq.m) Year-on-year Percentage Change
7
There are three important growth episodes in China’s modern real estate history. The
first one originated in 1989 from Hainan province, the nation’s largest and southernmost
island featuring cultural tourism. Within three years’ time, housing prices went from just 300
yuan per square meter to around 7,500 at the peak. When interest rates began rising in 1993,
housing prices plummeted to 1,000 yuan per square meter and remained there until the early
2000s. The second growth episode came on the heels of the global economic crisis in 2008.
Banks set interest rates barely above inflation and easy money boosted investment demand
for housing. Home prices rose rapidly from 2009 until significant policy tightening starting in
the second half of 2010. After a moderate softening in 2014, the most recent growth spurt
began in early 2015, driven by a combination of loose monetary policy and expansionary
fiscal policy.
Since 2002, housing prices in China’s tier one cities have risen more than six-fold
compared to the 80% overall national increase in US housing prices between 2000 and 2005,7
or the increase in Ireland of 100% and Spain of 230% in their respective housing booms.8
With the crash of Japan’s real estate market in the 1990s and the bursting of the U.S. housing
bubble during 2006-2007 as precedents, Chinese authorities have long been wary of the risks
associated with overheating housing prices and, at various times, have taken measures to
clamp down on speculation. Nevertheless, housing prices in China have risen at
unprecedented rate (Figure 2). Until Covid-19, whenever the Chinese government looked to
7 Source: S&P/Case Shiller index (Federal Reserve Bank of St. Louis) 8 Source: OECD. According to OECD housing prices data (https://data.oecd.org/price/housing-prices.htm), Ireland’s housing price rose from 79.47 to 162.68 from early 2000s to 2007, and Spain’s housing price index rose from 45.52 to 148.79 between 1996 and 2007.
8
it to stimulate growth, it often did so by fueling credit to real estate acquisition and
construction.
Figure 2. Residential Housing Prices by City Tier (yuan/sq.m) This figure depicts the annual housing prices in first-, second-, third-tier cities from 2002 to 2017. National Bureau of Statistics provides annual data for 35 large and medium-sized cities. Tier-1 cities include Beijing, Shanghai, Guangzhou, and Shenzhen. The other 31 cities belong to tier-2. The rest belong to tier-3.
Source: National Bureau of Statistics
China reputedly has a two-speed housing market, reflecting the heterogeneous growth
rates between the better-off first-tier cities and all the rest. In the more up-to-date data
however, we see that starting in 2017, first-tier cities slowed in terms of housing price
appreciation, and fell below that of second- and third-tier cities, where appreciation
Figure 3. Monthly Residential Housing Price Changes by City Tier (last year=100) This figure shows monthly residential housing price changes in first-, second-, third-tier cities from 2006 to 2019.
Certainly, by international standards, the scale of China’s real estate boom is
unprecedented. Currently, the home price to income9 ratios in Beijing, Shanghai, Shenzhen,
and Guangzhou are comparable to the world’s most expensive cities (Figure 4). In particular,
the price to income ratios in Beijing, Shanghai and Shenzhen exceed a multiple of 40
compared to 22 in London and 12 in New York.10 Of course, such price to income ratios
might be justified if the expectation is that very fast income growth will continue indefinitely.
But even aside from the Covid-19 pandemic, China’s rapidly aging population, a shrinking
technological gap with the west, and normal decreasing returns to investment, all suggest that
future growth will likely be trending downward.
9 Home price to income ratio is calculated as the ratio of median housing price to median household disposable income, expressed as years of income. 10 These comparisons are pre-covid-19.
Figure 4: Home Price-to-income Ratios in the World’s Major Cities (2018) This figure shows home price-to-income ratios in Beijing, Shanghai, Hong Kong, Shenzhen, Singapore, Tel Aviv, Guangzhou, Paris, Vancouver, Munich, Barcelona, Tokyo, New York, and San Francisco, respectively.
Source: Numbeo
2. The Role of Real Estate in the Chinese Economy
China’s real estate has been an extraordinarily important driver of its economy. Real
estate investment rose from 5% of GDP in 1995 to over 13% of GDP in 2019, of which more
than 70% is devoted to residential building.11 However, as we have emphasized, focusing on
real estate services alone understates the sector’s impact. Real estate not only accounts for
23% of household consumption,12 but it also connects to various sectors of the economy
through investment, construction, and the financial system.
11 Unless otherwise indicated, all data are from the National Bureau of Statistics of China. 12 Household consumption consists of household expenditure on 1) food, tobacco and liquor; 2) clothing; 3) residence; 4) household facilities, articles, and services; 5) transport and communications; 6) education, cultural and recreation; 7) health care and medical services; 8) miscellaneous goods and services. Housing related consumption here refers to household expenditure on residence. If we also include expenditure on household facilities, articles, and services, the figure rises to 30%.
0
5
10
15
20
25
30
35
40
45
50
Bei
jing
Shan
ghai
Hon
g K
ong
Shen
zhen
Sing
apor
e
Lond
on
Tel A
viv
Gua
ngzh
ou
Paris
Van
couv
er
Mun
ich
Bar
celo
na
Toky
o
New
Yor
k
San
Fran
cisc
o
11
China’s economic rise largely relies on an investment-driven growth model, and the ratio
of total fixed assets investment to GDP has reached 70-80% in recent years, of which a
significant proportion is in the real estate sector. In 2018, real estate investment composed
13% of China’s GDP, while historically in the United State, this figure has been about 5%
(Figure 5).
Figure 5. China and U.S. Real Estate Investment This figure shows annual real estate investment in China and the United States from 2002 to 2018. Real estate investment is placed on the left axis, and the ratio of real estate investment to GDP is placed on the right axis.
Source: U.S. Department of Commerce Bureau of Economic Analysis
Real estate is naturally related to the construction industry in that developers basically
make profits by managing the construction process and turning raw land into salable
property. In 2016, real estate and construction industries combined accounted for around 29%
China Real Estate Investment (billion $) U.S. Real Estate Investment (billion $)
China Real Estate Investment/GDP - Right U.S. Real Estate Investment/GDP - Right
12
of China’s GDP,13 comparable only by pre-crisis Spain and Ireland. Real estate and
construction are also crucial for job creation, making up around 20% of urban non-private
employment (Figure 6).14
Figure 6. Contribution of Real Estate and Construction to Urban Employment This figure shows the contribution of real estate and construction sectors to urban employment. Total employment in real estate and construction sectors is placed on the left axis, and the ratio of real estate and construction employment to total urban employment is placed on the right axis.
Although our later analysis of an impact of real estate activity decline is entirely on the
real side and does not build in amplification from a financial crisis, of course real estate is
also closely related to the financial system. This is especially true for the banking sector, as
bank lending represents the primary source of real estate funding. Through the fourth quarter
of 2018, real estate loans amounted to 38.7 trillion yuan, accounting for about 28% of total
13 This number is obtained by calculating the total demand on upstream and downstream industries generated by the real estate sector based on input/output table. Details are provided in Section V. 14 Similar estimates are given by Glaeser et al. (2017).
Construction Employment (1000 persons) Real Estate Employment (1000 persons)
Share of Urban Employment - Right
13
loans and 40% of new loans in financial institutions. The growth in real estate loans far
outweighs that of the other sectors: from 2014 to 2018, the average annual increase in real
estate credit was 20%, whereas the number was 6% for manufacturing.15
Excessive concentration of financial resources in real estate related industries has created
various distortions in the economy. As banks rely on real estate and land holdings as the main
collateral securing loans, they extend more credit to firms with land holdings, crowding out
credit to those without. Rising housing prices also induce firms whose core business is
unrelated to real estate to make land investments, shifting talents and resources away from
areas of economic need such as trade, manufacturing, and technological innovation (Bleck
and Liu, 2014; Chen et al., 2016; Hau and Ouyang, 2018).
Local governments are also heavily involved in real estate activity. On one hand, land
sales fueled by a thriving housing market constitute a principal source of local fiscal revenue
(Figure 7); on the other hand, local officials are promoted or demoted depending on their
ability to generate economic growth (Li and Zhou, 2005), and construction activity itself
represents measurable economic output.
15 Source: China Financial Stability Report published annually by People’s Bank of China
14
Figure 7. Land Finance This figure shows the contribution of land finance, which mainly refers to land transfer fees, to local fiscal revenue. Land transfer fees and total fiscal revenue are placed on the left axis, and the ratio of land transfer fees to total fiscal revenue is placed on the right axis.
Source: Ministry of Finance of the People’s Republic of China
For average households, home ownership is not only a necessity for marriage expected
especially of young men, but also an appealing financial asset given a record of robust capital
gains and a lack of alternative investment instruments. The result is a housing market with
valuation far exceeding that of other financial assets (Figure 8). Housing wealth now forms a
far larger share of overall Chinese assets (including stocks, securitized loans and bank
lending) than it does in the United States, accounting for 78% of all assets compared to 35%
for the United States.16 This makes Chinese private consumption significantly more sensitive
to a decline in housing prices.
16 Source: China Guangfa Bank and Southwestern University of Finance and Economics
Land Transfer Fees Total Fiscal Revenue Land Transfer Fees/Total Fiscal Revenue - Right
15
Figure 8. Valuation of Different Asset Classes in 2017 (trillion yuan) This figure demonstrates the market valuation of housing, stock, and bond assets in China, U.S. and Japan, respectively.
It is worth noting that although the GDP of China is roughly comparable to that of the
United States when measured at PPP exchange rates, (and significantly smaller measured at
market exchange rates), the market value of the housing stock is more than double that of the
United States, and more than triple that of Europe. Such comparisons are reminiscent of the
Japanese housing bubble of the late 1980s and early 1990s, when the market value of real
estate in the Japan was also more than twice that of the United States compared to less than
1/3 the value today.
IV. Supply-Demand Dynamics
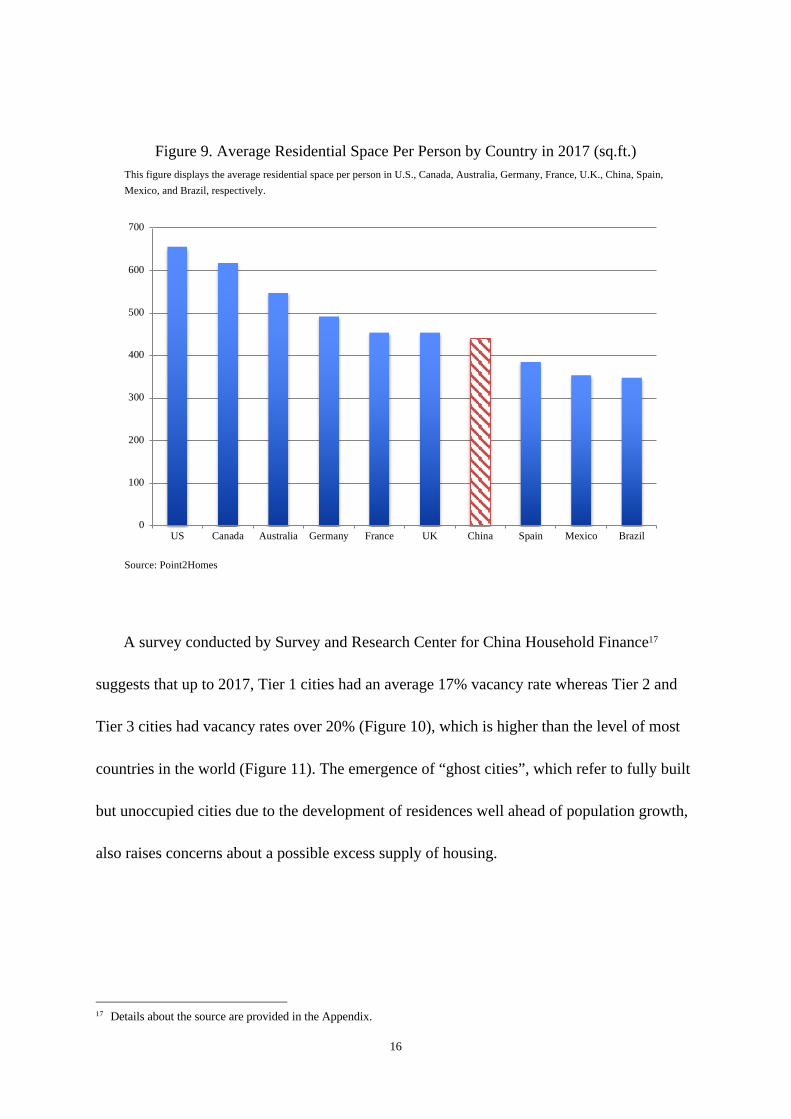
Following years of massive housing construction, China’s per capita residential space
has reached 41 square meters, on par with wealthy European countries such as Germany and
France (Figure 9). The question then is: is there an oversupply in housing?
0
50
100
150
200
250
300
350
400
450
ChinaHousing
ChinaStock
ChinaBond
U.S.Housing
U.S. StockU.S. Bond JapanHousing
JapanStock
JapanBond
16
Figure 9. Average Residential Space Per Person by Country in 2017 (sq.ft.) This figure displays the average residential space per person in U.S., Canada, Australia, Germany, France, U.K., China, Spain, Mexico, and Brazil, respectively.
Source: Point2Homes
A survey conducted by Survey and Research Center for China Household Finance17
suggests that up to 2017, Tier 1 cities had an average 17% vacancy rate whereas Tier 2 and
Tier 3 cities had vacancy rates over 20% (Figure 10), which is higher than the level of most
countries in the world (Figure 11). The emergence of “ghost cities”, which refer to fully built
but unoccupied cities due to the development of residences well ahead of population growth,
also raises concerns about a possible excess supply of housing.
17 Details about the source are provided in the Appendix.
0
100
200
300
400
500
600
700
US Canada Australia Germany France UK China Spain Mexico Brazil
17
Figure 10. Housing Vacancy Rates by City Tier (2017) This figure reports the housing vacancy rates by city tier in 2017. The housing vacancy rates in first-, second-, third-tier cities are placed on the left axis, and the total number of empty dwellings is placed on the right axis.
Source: Survey and Research Center for China Household Finance
Figure 11. Housing Vacancy Rates by Country This figure reports the housing vacancy rates in Spain, Italy, China, Austria, Sweden, France, Belgium, Japan, U.S., Denmark, Ireland, Finland, Canada, Singapore, Germany, Netherlands, Iceland, Poland, and U.K., respectively.
Source: European Union
0
10
20
30
40
50
60
70
80
16%
17%
18%
19%
20%
21%
22%
23%
24%
2011 2013 2015 2017
Total Empty Dwellings (millions) - Right Tier 1 Tier 2 Tier 3
0%
5%
10%
15%
20%
25%
30%
Spai
n
Italy
Chi
na
Aus
tria
Swed
en
Fran
ce
Bel
gium
Japa
n
US
Den
mar
k
Irel
and
Finl
and
Can
ada
Sing
apor
e
Ger
man
y
Net
herla
nds
Icel
and
Pola
nd UK
18
China’s housing boom appears truly epic in comparison to all but a couple of post-war
booms around the world, both in terms of cumulative price increase and in terms of the
dependence of the Chinese economy on residential construction.18 It is tempting to conclude
that housing oversupply is a problem in China, based on its pure volume and by international
standards. However, at least until recently, there have been other arguments suggesting that
China’s housing market is different. Steady income growth, strong household balance sheets,
limited investment alternatives, and most importantly, implicit support or even promotion by
the government make it less susceptible to a sudden price drop or crisis.
In the next sub-section, we examine China’s current housing supply relative to the
country’s growing needs. Although the forces sustaining high housing prices have dominated
until recently, the trends supporting ever-rising prices are muting substantially, suggesting
risk of a large housing market adjustment.
1. Slowing Housing Demand
Classic factors that determine housing demand include housing price, population growth
and income growth. Housing prices in China are apparently beyond affordability, as
evidenced by the astonishing home price to income ratios across all city tiers (Figure 12).
According to the Joint Center for Housing Studies of Harvard University, an average home
costs only 2 to 4 times the median annual income in most parts of the United States. In
18 Again, understanding that housing price and construction data is of mixed quality even in the advanced economies.
19
addition to price, the other two factors—demographics and income—also seem to have
changed for the worse.
Figure 12. Home Price-to-Income Ratios by City Tier This figure presents home price-to-income ratios in first-, second-, third-tier cities from 2003 to 2017.
Demographic trends suggest a sustained decline in new household formation as China’s
population ages, and as it digests the long-run consequences of its policies to slow population
growth. The problem is most acute in Tier 3 cities, but it is still considerable in Tier 1 cities.
The age group of 20-50, who comprises the majority of homebuyers, keeps shrinking. The
abolition of one-child policy effective from January 2016 is unlikely to reverse the downward
demographic trend, since escalating cost of living substantially reduces people’s willingness
to have children. Late marriage and marriage with no children have become increasingly
popular in metropolitan areas. On the other hand, real estate developers build residences well
ahead of population growth, leaving behind them sprawling new neighborhoods devoid of
inhabitants.
More importantly, as China’s economy inevitably slows, household income growth is
also expected to decline. As Glaeser et al. (2017) caution, the current (pre-Covid) prices
cannot withstand a sustained income growth slowdown.
At the same time, China’s household leverage ratio, which is defined as the ratio of
household debt to GDP, has risen rapidly to 60% at the end of 2018,19 up from 18% before
2008 (Figure 13).
Figure 13. Household Leverage Ratios by Country This figure presents household leverage ratios in China, U.S., Euro Area, Japan, Russia, Brazil, India, and South Africa, respectively, from 2008 to 2018.
Source: Bank for International Settlements, People’s Bank of China
19 According to the Bank for International Settlements, China’s household leverage ratio was 52.6% in 2018, whereas it was estimated at 60.4% by the People’s Bank of China.
Fang et al. (2015) argue that China’s mortgage loans are relatively secure, owing to high
down payments usually in excess of 35 percent. However, the more recent data suggests
greater fragility today. As the central bank cut the minimum required mortgage down
payment to 20 percent from 25 percent for first-home purchases, and to 30 percent from 40
percent for second-home purchases in 2016, outstanding mortgage debt quickly increased to
38 trillion yuan, making up over 70% of total household debt. In fact, China’s household
leverage ratio is now close to the level of major advanced economies such as Europe and
Japan, and much higher than the emerging market average.
Figure 14. Change of Household Leverage Ratios in China and the U.S. This figure exhibits the quarterly change of household leverage ratios in China and the United States. The U.S. time series starts from 1952. Due to data limitations, the Chinese time series starts from 2006.
Source: Bank for International Settlements
-5%
0%
5%
10%
15%
1952
1954
1956
1958
1960
1962
1964
1966
1968
1970
1972
1974
1976
1978
1980
1982
1984
1986
1988
1990
1992
1994
1996
1998
2000
2002
2004
2006
2008
2010
2012
2014
2016
2018
U.S. Quarterly Change China Quarterly Change
1969 Dollar Crisis
1981 Economic Crisis
1991 Economic Recession
2008 Subprime Crisis
22
By 2019, housing loans constituted about 30% of the value of Chinese bank loans,20
during a period when bank lending has been expanding significantly faster than GDP growth.
Although Chinese household leverage remains below that of the United States before the
2008 financial crisis (compared to 42%),21 it is already above where Spain was in 2008
(26%),22 and as Figure 14 shows, it has been rising rapidly. It is sobering to recall that U.S.
regulators never expected that housing prices would fall by 36% from peak to trough (by the
Case-Shiller index); even the very cautious pragmatic Chinese regulators may not yet be fully
anticipating the depth of the possible fall in China’s housing prices.
China’s urbanization drive, traditional notion of home ownership as a marriage necessity,
and the purchase of property for investment purposes etc. are often quoted as unique national
characteristics that complicate any demand analysis. However, there are limits, as China’s
policymakers have increasingly recognized in recent years. President Xi famously stressed
that houses are “for living, not for speculation” at the 19th National Congress of the
Communist Party of China and the government subsequently imposed stricter tightening
measures. Meanwhile, urbanization has reached the point where home ownership is over 90%
for the total of 276 million urban households,23 comparable to countries with the highest
home ownership in the world (Figure 15).
20 Source: People’s Bank of China 21 Source: Board of Governors of the Federal Reserve System 22 Source: CEIC 23 Source: JP Morgan
23
Figure 15. Home Ownership by Country This figure presents home ownership in China, Singapore, India, Iceland, Mexico, Brazil, Argentina, Australia, Canada, Japan, New Zealand, United States, Korea, South Africa, and Switzerland, respectively.
Source: EMF Hypostat, IBGE: Instituto Brasileiro de Geografia e Estatí, OECD Affordable Housing Database, Statistics Canada, Statistics of Japan, Statistics Singapore, Stats NZ, United States Census
With urbanization rate reaching about 60% and projected to remain relatively stable, the
urbanizing process will surely have much less of an impact on urban housing prices going
forward. (Indeed, it seems quite plausible that the demands of social distancing in crowded
cities could also have a negative impact on prices). With 87% of new homebuyers already
having more than one dwelling (Figure 16) and price to rent ratios among the world’s highest
even before Covid-19 (Figure 17), owners of multiple homes have growing pressures to sell
(Figure 18).
40%
50%
60%
70%
80%
90%
100%C
hina
Sing
apor
e
Indi
a
Icel
and
Mex
ico
Bra
zil
Arg
entin
a
Aus
tralia
Can
ada
Japa
n
New
Zea
land
Uni
ted
Stat
es
Kor
ea
Sout
h A
fric
a
Switz
erla
nd
24
Figure 16. Number of Dwellings of New Homebuyers This figure presents the breakdown of new homebuyers based on the number of dwellings that they already own at the time of new home purchase.
Source: Survey and Research Center for China Household Finance
Figure 17. Home Price-to-Rent Ratios in the World’s Major Cities (2018) This figure presents home price-to-rent ratios in Shenzhen, Beijing, Hong Kong, Shanghai, Tel Aviv, Tokyo, Guangzhou, Munich, Paris, Singapore, London, Vancouver, Barcelona, New York, and San Francisco, respectively in the year 2018.
First-time Purchaser Having One Dwelling Having Two or More Dwellings
0
10
20
30
40
50
60
70
80
90
Shen
zhen
Bei
jing
Hon
g K
ong
Shan
ghai
Tel A
viv
Toky
o
Gua
ngzh
ou
Mun
ich
Paris
Sing
apor
e
Lond
on
Van
couv
er
Bar
celo
na
New
Yor
k
San
Fran
cisc
o
25
Figure 18. Willingness to Sell Homes This figure shows the percentage of people who are prepared to sell their homes in each group.
Source: Survey and Research Center for China Household Finance
Home ownership is a symbol of social status and financial strength in traditional Chinese
culture. As mortgage loans climb to historical heights, there is little room for additional debt
capacity in the household sector.
It is true that, in principle, individuals’ desire to upgrade their housing could still sustain
demand for construction, even if the existing stock of housing seems large by international
standards. Still, statistics from the third National Economic Census show that the majority of
China’s housing was built after the 1990s (and almost all of it since the 1980s), indicating
little urgent need for large-scale home improvement in the near future (Figure 19). The large
overhang of supply (particularly outside Tier I cities) suggests a significant slowdown in
construction is likely needed over medium term.
0%
2%
4%
6%
8%
10%
12%
14%
16%
18%
20%
Having One Dwelling Having Two Dwellings Having Three or More Dwellings
Without Vacancy With Vacancy
26
Figure 19. Proportion of Housing by Year of Construction This figure shows the classification of housing based on the time of construction.
Source: National Economic Census
We acknowledge some important caveats. Given the powerful intervention that the
government can exercise on land and credit, China’s housing market is subject to great policy
uncertainty as the government constantly switches between tightening and easing policies,
often to prevent a decline in growth. With changing dynamics of international relations and
mounting trade pressures, lower interest rates can be expected. Furthermore, our analysis
does not take into account shadow banking, and income statistics obtained through the survey
methodology may fail to cover the wealthiest population who often owns more than one
property for investment purposes.
2. Housing Supply
0%
5%
10%
15%
20%
25%
30%
35%
40%
Before 1949 1950—1959 1960—1969 1970—1979 1980—1989 1990—1999 2000—2005
27
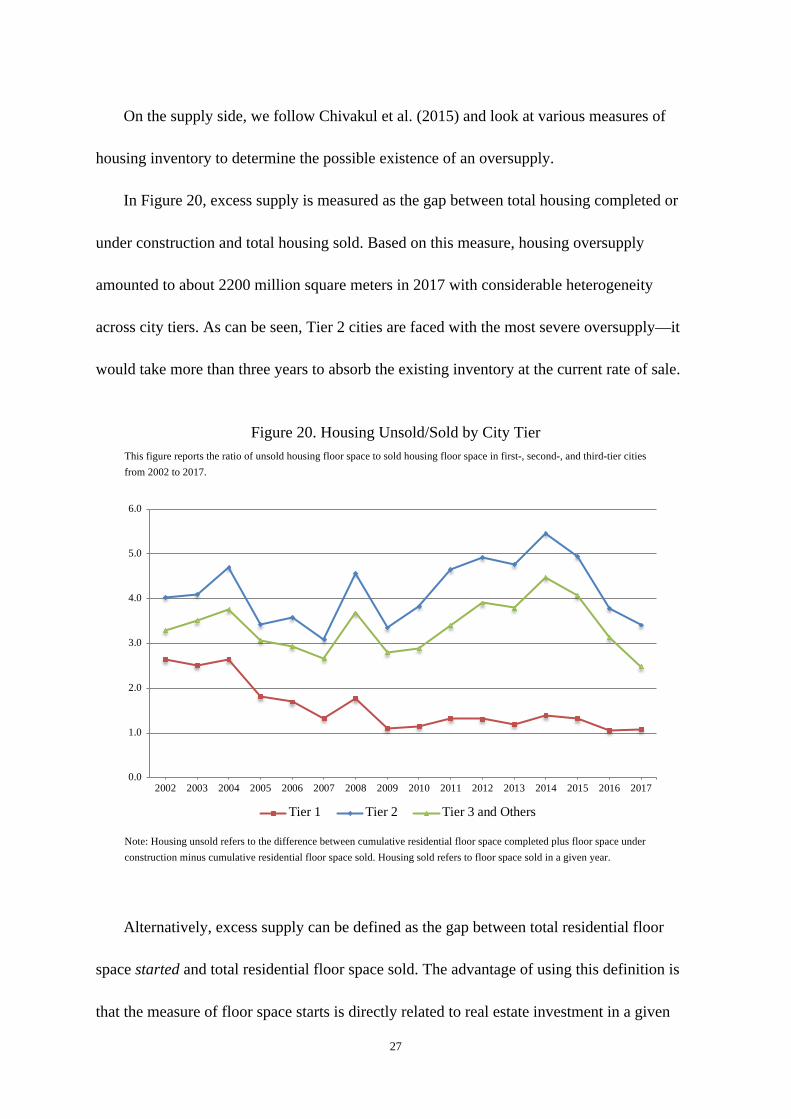
On the supply side, we follow Chivakul et al. (2015) and look at various measures of
housing inventory to determine the possible existence of an oversupply.
In Figure 20, excess supply is measured as the gap between total housing completed or
under construction and total housing sold. Based on this measure, housing oversupply
amounted to about 2200 million square meters in 2017 with considerable heterogeneity
across city tiers. As can be seen, Tier 2 cities are faced with the most severe oversupply—it
would take more than three years to absorb the existing inventory at the current rate of sale.
Figure 20. Housing Unsold/Sold by City Tier This figure reports the ratio of unsold housing floor space to sold housing floor space in first-, second-, and third-tier cities from 2002 to 2017.
Note: Housing unsold refers to the difference between cumulative residential floor space completed plus floor space under construction minus cumulative residential floor space sold. Housing sold refers to floor space sold in a given year.
Alternatively, excess supply can be defined as the gap between total residential floor
space started and total residential floor space sold. The advantage of using this definition is
that the measure of floor space starts is directly related to real estate investment in a given
year. In comparison, the measure of floor space under construction includes floor space
planned but not completed in previous years. Based on the second measure, total housing
oversupply is estimated at about 2,850 million square meters in 2018, in which case it would
take an average of two years to absorb the existing inventory, assuming no new construction
(Figure 21).
Figure 21. Housing Inventory This figure reports the floor space of housing inventory from 1997 to 2018. The floor space of housing unsold is placed on the left axis, and the ratio of floor space unsold to floor space sold is placed on the right axis.
Note: Housing unsold measures the difference between cumulative residential floor space started minus cumulative residential floor space sold. Housing sold refers to floor space sold in a given year.24
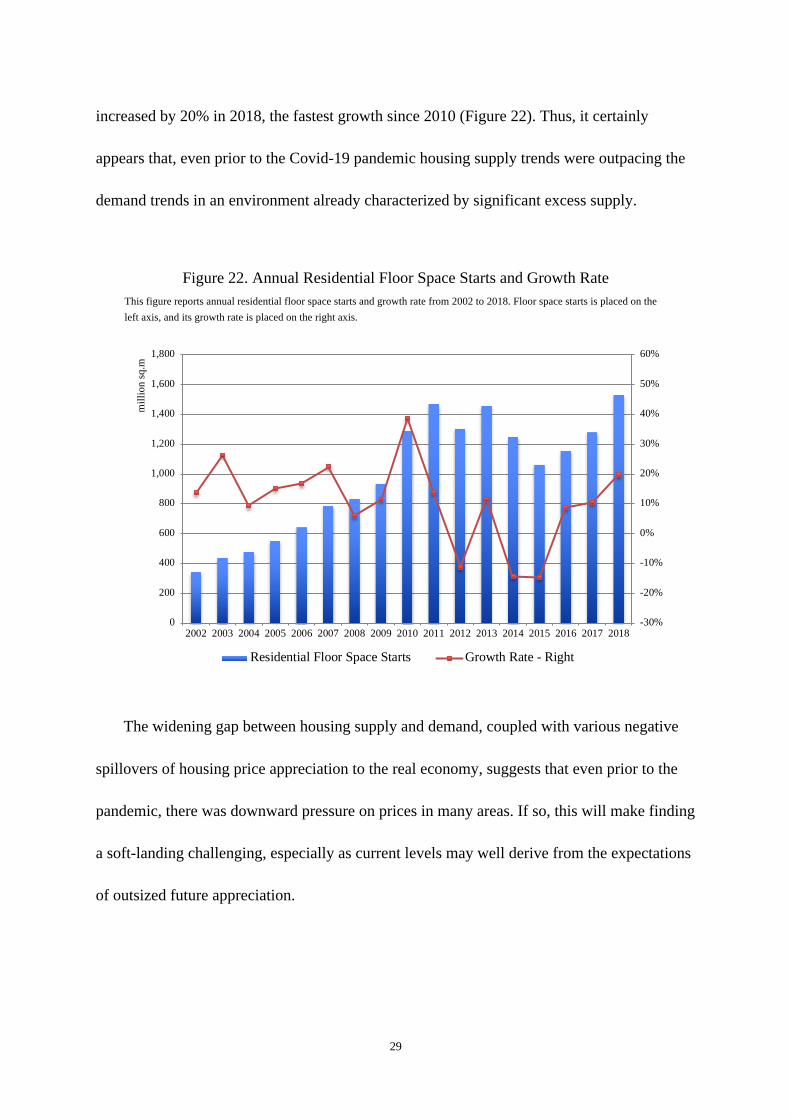
Even as there is an increasing volume of housing unsold, and despite the consensus
projection of a nationwide slowdown in housing demand, residential floor space starts still
24 In comparison with our approach that estimates housing inventory at the aggregate level, Glaeser et al. (2017) calculate inventory based on developers’ inventory data for 32 major Chinese cities and generalize the result to 232 other cities. The latter approach risks underestimating housing stock particularly in tier-3 cities. Most critically, it is subject to biases inherent in self-reported data, as the figures are submitted by real estate developers.
0.0
0.5
1.0
1.5
2.0
2.5
3.0
3.5
4.0
4.5
0
500
1,000
1,500
2,000
2,500
3,000
3,500
4,000
4,500
1997
1998
1999
2000
2001
2002
2003
2004
2005
2006
2007
2008
2009
2010
2011
2012
2013
2014
2015
2016
2017
2018
mill
ion
sq.m
Housing Unsold Housing Unsold/Sold - Right
29
increased by 20% in 2018, the fastest growth since 2010 (Figure 22). Thus, it certainly
appears that, even prior to the Covid-19 pandemic housing supply trends were outpacing the
demand trends in an environment already characterized by significant excess supply.
Figure 22. Annual Residential Floor Space Starts and Growth Rate This figure reports annual residential floor space starts and growth rate from 2002 to 2018. Floor space starts is placed on the left axis, and its growth rate is placed on the right axis.
The widening gap between housing supply and demand, coupled with various negative
spillovers of housing price appreciation to the real economy, suggests that even prior to the
pandemic, there was downward pressure on prices in many areas. If so, this will make finding
a soft-landing challenging, especially as current levels may well derive from the expectations
Residential Floor Space Starts Growth Rate - Right
30
V. Housing Activities amid COVID-19
The outbreak of the coronavirus pandemic poses great uncertainties for the housing
market. With the economy still battered even though recovering, the housing market has
started to adjust, with rents already falling.
1. Coronavirus Pandemic as a Negative Shock on Housing Activities
China’s housing market slowed down as a result of the coronavirus pandemic reducing
transactions and causing financial hurdles for many families. In February 2020, housing price
in 70 medium and large-sized cities saw the slowest growth over 57 months.25 Given that
market liquidity measured by sales volume dropped by 25% in the first quarter,26 rent serves
as a better indicator of housing market conditions. According to the Weifang rent index
compiled by the Chinese Academy of Social Sciences, housing rent plunged for five
consecutive months through May 2020 (Figure 23).
Among first-tier cities, Shenzhen and Beijing took the hardest hit. Shenzhen’s rent
experienced the largest fall in May 2020, down by 3.2%, and rent in Beijing fell to its lowest
level since January 2018 when the index was first launched. Housing prices in all second-tier
cities except for Xiamen and Fuzhou were on the decline, for up to 14%.
25 Source: National Bureau of Statistics of China. 26 Source: National Bureau of Statistics of China. Due to limited liquidity, housing price picked up in certain cities after reopening (see for example https://www.wsj.com/articles/china-property-real-estate-boom-covid-pandemic-bubble-11594908517)
31
Figure 23. Weifang Comprehensive Rent Index This figure reports the Weifang comprehensive rent index starting from January 2018. The index is compiled by the Chinese Academy of Social Sciences.
2. The Effect of Declining Housing Activities on the Economy
Since real estate constitutes a key source of fiscal revenue for China’s local governments
and an important form of collateral for enterprises, even modestly declining price, compared
to the usual pattern of ever rising prices, could pose a considerable risk.
There are at least three channels through which declining housing activities exert a direct
effect on the economy. First, a massive reduction in home sales strains developers’ cash
flows and likely puts many out of business. Rental companies have also come under immense
pressure from lockdown policies and reduced travel. According to Bloomberg,27 over 100
real estate firms active in China filed for bankruptcy in the first quarter of 2020. As 1.46
trillion yuan of corporate debt in the real estate industry is due by the end of 2020, another
tidal wave of bankruptcies is expected to come if the coronavirus pandemic does not remain
contained. Second, surge in real estate insolvencies will cause people to lose their jobs or at
least part of their income, which again puts a downward pressure on housing demand. Third,
there is the financial accelerator mechanism through which property price affects the balance
sheet of households and corporates and their ability to contract loans. Housing price
movement, therefore, impacts both credit growth and financial stability.
As we have already discussed, real estate has an amplifying effect due to its linkage to
other sectors of the economy, for example construction, household appliances, furnishings,
leasing services, etc. Therefore, a reduction in housing activities may contribute to a
downward spiral in the economy, leading to further declines in employment, income,
consumption, and investment.
In this section, we use input-output modeling to explore the size of the impact of housing
market shocks on the economy, making use of China’s latest input-output table (for the year
2017). We quantify the interdependency between sectors in the industrial network as
∆𝑋 = (𝐼 − 𝐴)!"∆𝐹 (1)
where ∆𝑋 is the vector of total output of each sector. ∆𝐹 is the vector of final demand. 𝐴
signifies the matrix of direct requirement coefficients. Multiplying total output of each sector
with the rate of value added yields the magnitude of impact on total value added.
In 2016, real estate investment amounted to 10,258 billion yuan, of which 7,630 billion
goes to construction and installation, 146 billion is used to purchase equipment and
instruments, and the remaining 2,482 billion is invested in other items. Investment in other
33
items, which is mostly land, does not form fixed assets directly and is therefore excluded
from the calculation. The estimated impact of real estate on the economy can be found in
Table 1.28
Table 1. Economic Impact of Real Estate (2016) This table reports the estimated impact of real estate related activities on China’s economy based on cross-industry linkages in the input-output matrix.
Item Amount Coefficient Value Added Contribution to GDP
Investment in Construction 7,630 2.12 16,176 21.8%
Investment in Equipment 146 2.51 366 0.5%
Real Estate Value Added 4,819 1.00 4,819 6.5%
Sum of Effects
28.7%
Total GDP 74,359
100%
Taking into account the external sector does not fundamentally change the message.
Δ𝑋 = [𝐼 − (𝐼 − 𝑀)𝐴]!"(𝐼 − 𝑀)∆𝐹 (2)
where M is the matrix formed by diagonalizing each sector’s share of imports in domestic
demand. In this case, the aggregate economic impact of real estate comes to 24% of GDP,
whereas a similar definition gives U.S. at about 15%.
In a similar work by the Federal Reserve Bank of Kansas City, Cook et al. (2018) used
the earlier (2012) version of China’s input-output table and determined the magnitude of real
estate activity to be 22% of GDP. The reason that their results is slightly different from ours
is partly due to the growing importance of real estate activity to the Chinese economy from
28 Technical details of obtaining the coefficients can be found in the appendix.
34
2012 to 2017, and partly reflects the different ways we estimate real estate construction. In
Cook et al. (2018), the value of housing-related construction is computed based on the share
of fixed capital formation related to the real estate sector in total fixed capital formation,
whereas in our paper, the value of real estate construction is obtained by subtracting land
purchases from real estate investment.
Applying a similar method, we can estimate the dependence on real estate sector of other
major economies in the world (Figure 24). China is even more dependent on housing
construction than Ireland and Spain just prior to the financial crisis, and far more dependent
than the United States.
Figure 24. Real Estate Related Activities’ Share of GDP by Country This figure presents the share of real estate related activities in total GDP in China, U.S., U.K., Germany, France, Spain, Netherlands, Finland, Ireland, Japan, and Korea.
3. Impact of the Housing Sector under Different Scenarios for the Pandemic
The coronavirus pandemic has created severe social disruption. Different responses to it
can lead to distinct scenarios of economic consequences. According to the Australian
National University, China’s GDP is projected to fall by 6.5-9.5% depending on how well the
pandemic is brought under control, and investment will be down by 7.0-10.2% in each
scenario (Table 2). Based on the results from the input-output table, a reduction in real estate
investment of the same scale implies an additional 2.0-2.9% decrease in GDP.
Table 2. Effect of Housing Activities on GDP under Different Scenarios This table reports the estimated impact of real estate on the economy under different scenarios of the coronavirus pandemic.
Scenario Description Real Estate Investment Amplification on GDP
1 One wave in 2020; one wave in
2021; no recurrence after 2021 -7.0% -2.0%
2 One wave in 2020; one wave in
2021; recurrence after 2021 -8.1% -2.3%
3 Two waves in 2020; one wave in
2021; no recurrence after 2021 -10.1% -2.9%
4 Two waves in 2020; two waves in
2021; no recurrence after 2021 -10.0% -2.9%
VI. Conclusion
This paper identifies an excess supply in China’s real estate sector through cross-country
comparison and supply-demand analysis. We present new and significantly updated data to
suggest the real estate sector has an outsized footprint on China’s economy, and that broadly
36
construed (using an input-output table and taking into account higher-order effects)
constitutes 29% of China’s economy, even higher than previous estimates. (Taking into
account the external sector lowers the estimate to 24%.) Moreover, demand supply factors
have tilted significantly in recent years, suggesting the possibility of significant downward
pressures, especially due to slowing trend growth.
Based on input-output and scenario analyses, we find that 20% fall in the housing sector
and related activities (if one did occur), could lead to a roughly 5-10% decline in the level of
output.
It is true that Chinese authorities have enormous administrative power over the value of
housing. Not only is there extensive zoning and regulation, but in China private entities
cannot own land, a fact that further underscores just how massive the Chinese real estate
explosion has been. However, as our analysis shows, authorities face a delicate balancing act
as many of the policies they could enact to hold up prices (for example tightening regulation
over the building of new homes) might help existing owners, but at the expense of more rapid
employment and production decline.
37
References
Bleck A., and Liu X.W. (2018). Credit expansion and credit misallocation. Journal of Monetary Economics, 94,
27–40.
Campbell, J. Y. and Cocco, J. F. (2007). How Do House Prices Affect Consumption? Evidence from Micro
Data. Journal of Monetary Economics, 54(3), 591–621.
Case, K. E., Quigley, J. M., and Shiller, R. J. (2005). Comparing Wealth Effects: the Stock Market versus the
Housing Market. Advances in Macroeconomics, 5(1).
Chakraborty I., Goldstein I., and MacKinlay A. (2018). Housing Price Booms and Crowding-Out Effects in
Bank Lending. The Review of Financial Studies, 31(7), 2806–2853.
Chaney, T., Sraer D. and Thesmar D. (2012). The Collateral Channel: How Real Estate Shocks affect Corporate
Investment. American Economic Review, 102(6), 2381-2409.
Chen, J., Guo F., and Zhu A. (2011). The Housing-led Growth Hypothesis Revisited: Evidence from the
Chinese Provincial Panel Data. Urban Studies, 48(10), 2049–2067.
Chen T., Liu L., Xiong W., and Zhou L.A. (2016). The Speculation Channel and Crowding Out Channel: Real
Estate Shocks and Corporate Investment in China. Working Paper.
Chivakul M., Lam W.R., Liu X.G., Maliszewski W., and Schipke A. (2015). Understanding Residential Real
Estate in China. IMF Working Paper 15/84.
Cook, T., Nie, J., and Hall, A.S. (2018). An Inter-Industry Analysis of China’s Housing Market and the
Macroeconomy. Federal Reserve Bank of Kansas City Research Working Paper.
Coulson, N. E. and Kim, M.S. (2000). Residential Investment, Non-residential Investment and GDP. Real
Estate Economics, 28(2), 233–247.
Fang H.M., Gu Q.L., Xiong W., and Zhou L.A. (2015). Demystifying the Chinese Housing Boom. NBER
Macroeconomics Annual (30).
Gan, J. (2007). Collateral, Debt Capacity, and Corporate Investment: Evidence from a Natural experiment.
Journal of Financial Economics, 85(3), 709-734.
Glaeser, E., Huang W., Ma Y.R., and Shleifer A. (2017). A Real Estate Boom with Chinese Characteristics.
Journal of Economic Perspectives, 31(1), 93-116.
Green, R. K. (1997). Follow the Leader: How Changes in Residential and Non-residential Investment Predict
Changes in GDP. Real Estate Economics, 25(2), 253–270.
Hau H. and Ouyang D.F. Local Capital Scarcity and Industrial Decline Caused by China’s Real Estate Booms,
VOX, 26 October 2018.
38
Huang, Y.T., Li Q., Liow K.M., and Zhou X.X. (2018). Is Housing the Business Cycle? A Multi-resolution
Analysis for OECD Countries. Working Paper.
Jorda, Oscar, Moritz Schularick, and Alan Taylor (2016). The Great Mortgaging: Housing Finance, Crises and
Business Cycle. Economic Policy v. 31, issue 85. 107-52.
Kim, K.H. (2004). Housing and the Korean Economy. Journal of Housing Economics, 13(4), 321–341.
Koss R. and Shi X.R. (2018). Stabilizing China’s Housing Market. IMF Working Paper 18/89.
Leamer, E.E. (2007). Housing is the Business Cycle. National Bureau of Economic Research.
Leamer, E.E. (2015). Housing really is the Business Cycle: What Survives the Lessons of 2008– 09? Journal of
Money, Credit and Banking, 47, 43–50.
Li, H.B. and Zhou L.A. (2005). Political Turnover and Economic Performance: The Incentive Role of Personnel
Control in China. Journal of Public Economics, 89(9–10), 1743–62.
Liu. C., Xiong, W. (2018). China’s Real Estate Market. NBER Working Paper No. 25297.
Miao, J.J. and Wang P.F. (2014). Sectoral Bubbles, Misallocation, and Endogenous Growth, Journal of
Mathematical Economics. Journal of Mathematical Economics, 53, 153-163.
Mian, A., Sufi A., and Verner E. (2017). Household Debt and Business Cycles Worldwide, Quarterly Journal of
Economics, 132(4), 1755-1817.
Ren, Y., and Yuan Y. (2014). Why the Housing Sector Leads the Whole Economy: The Importance of
Collateral Constraints and News Shocks. The Journal of Real Estate Finance and Economics, 48(2), 323–
341.
Reinhart, C., and Rogoff K. (2008). Is the 2007 U. S. Sub-Prime Financial Crisis So Different? An International
Historical Comparison. American Economics Review, 98, 339-344.
Reinhart, C., and Rogoff K. (2009). The Aftermath of Financial Crises. American Economic Review, 99, 466-
472.
39
Appendix: Technical Details
There are two types of input-output matrices, direct requirement matrix and total
requirement matrix, both of which are published in coefficient form. The direct requirements
coefficients show the amount of inputs required directly to produce one unit of output. The
total requirements coefficients show the sum of direct and indirect inputs required to produce
one unit of output.
In this paper, we use China’s input-output total requirement matrix from 2017,29 which
is also the latest official version available for our analysis (Table 3).
Table 3. Total Requirement Coefficients from China’s 2017 Input-Output Table