61
PEAK MAC Panel Discussion 2017 Solar Eclipse

PEAK MAC Panel Discussion
2017 Solar Eclipse

SECURITY North Korea nuclear ambition hikes threat to grid
Peter Behr, E&E News reporter Published: Monday, August 21, 2017


At 4:10:38 p.m. Aug. 14, 2003, a tsunami of electric power measuring over 3.5 million kilowatts surged out of Ohio and into New York, then Canada and then Detroit, tripping circuit breakers along the eastern Great Lakes power network. Tens of thousands of people were left in the dark.Stunned operators throughout the region were clueless about the causes of the cascading outage. But they immediately began to restore power from the bottom up, restarting one power plant, then another and another.North Korea nuclear ambition hikes threat to grid Peter Behr, E&E News reporter Published: Monday, August 21, 2017
SECURITY North Korea nuclear ambition hikes threat to grid
Peter Behr, E&E News reporter Published: Monday, August 21, 2017

A root case of Blackout
Ineffective Communications

John Phipps
• Director, Real Time Operations• Oversee the Real Time Operations staff that perform
reliability and market functions for the CAISO Balancing Authority, and monitor the Western EIM. Responsible for ensuring the Real-Time Operations processes, procedures, and staff adhere to all CAISO tariff requirements and industry reliability standards.

Wei Shao
• Currently serving as the Manager of Power Operations Engineering at Sacramento Municipal Utility District (SMUD). In this role, he oversees a group of engineers providing all the engineering studies and applications support to the reliable operation of SMUD and the Balancing Authority of Northern California (BANC).
• Prior to joining SMUD, Wei held various positions in Network Applications and Operations Engineering at the California Independent System Operator (CAISO).

Michelle Cathcart • Michelle has been VP of Transmission System Operations at BPA
for just over a year. In this role, she oversees two control centers, a group of operations planning and operations coordination engineers, and related support organizations. Prior to that, Michelle served as the director of Strategy and Organizational Performance at Peak Reliability. Before assuming that role, she oversaw Peak’s real-time operations and training as the director of operations. Prior to arriving at Peak, Michelle served as the managing director of operations and market interface at the Western Electricity Coordinating Council. She spent the early part of her career at Madison Gas and Electric Company where she led the Wisconsin utility’s participation in the Midwest Independent System Operator and the Midwest Contingency Reserve Sharing Group.

Jason Ausmus
• Jason has been at Peak Reliability for 4 years. He is currently the Manager of Operations Planning at Peak and has spent the last 2 years in this role. As manager, he is responsible for Peak’s Outage Coordination Process which includes all of the operational planning studies and outage submission processing.
• Prior to joining Peak Reliability, Jason spent nearly 10 years at ITC Holding (TO/TOP in the MISO footprint) as an operations engineer performing operational planning studies.
ISO Confidential
August 21, 2017 Solar Eclipse Review
John PhippsDirector, Real Time Operations

ISO Confidential
CAISO solar eclipse overview
• Installed solar capacity at BES level ~ 10,000 MW– Peak solar output of 9,914 MW on June 17, 2017
• Installed wind capacity of ~ 6,500 MW– Peak wind output of 4,985 MW on May 16, 2017
• Rooftop solar ~ 5,800 MW– Approximately 31% or 1855 MW are commercial or industrial installations with
the remainder being residential• Expected obscuration
– 76% at the higher latitudes of Northern California to approximately 62% in the lower latitudes of Southern California
• ISO all-time peak load of 50,270 MW July 24, 2006– Forecast peak load for August 21 - 36,339 MW– Actual load on August 21 - 36,046 MW
Slide 11

ISO Confidential
CAISO preparation for the solar eclipse• Performed studies using high, medium, and low load level days• Adjusted load forecast in studies and day ahead market to compensate for
reduction in behind-the-meter solar• Adjust solar ramp as follows for both the studies and day ahead market*
– HE10 max solar, HE 11 min solar, HE12 max solar• Increased regulation up & down procurement for the eclipse period• Tightened AGC bands (close to L10) for the eclipse period• Restricted Maintenance Operations (no TTC derate)
– Actual RMO was set 2 weeks in advance• Solar resources
– Requested to follow Dispatch Operating Target (DOT) during return from eclipse• Hydro generation
– Requested hydro resources be ready for rapid response during loss and return of solar
• ISO RT Ops staff– Crew training – used simulator and table top – Created guide for on-shift crew
Slide 12
* The CAISO Day Ahead Market normally uses hourly averages for load and resource values. This would have dampened the impact of the eclipse.

ISO Confidential
Coordination in preparation for the solar eclipse
Slide 13
Entity Items
Peak RC • Shared Operational Plan• Discussed eclipse impact on BES & rooftop resources• Shared market simulation results• Peak RC solar eclipse readiness call
Adjacent BA’s • Reviewed anticipated eclipse impact & Operational Plans
EIM Participants • Discussed consistent policy for ETSR’s during eclipse• Accounted for eclipse in energy schedule submittals
Gas companies • Shared gas burn calculations from market simulations• Discussed any planned gas line work
CAISO TO’s • Anticipated eclipse impact & Operational plan• Sent “Peak Day” messaging before and during the
eclipseMarket Participants • Shared anticipated eclipse impact & Operational Plan
• Verified resources had adequate fuel• Requested bids to keep resources flexible• Requested they follow their DOT (dispatch target)

ISO Confidential
Anticipated and actual impact on CAISO solar resources
Slide 14
Actual solar at start of eclipse = 6,392 MWLower than forecast due to some cloud
cover
Actual solar at maximum obscuration
= 2,845 MW
Estimated actual solar loss of 6,000 MW
Blue line is similar day solar output. Yellow is forecast of the solar eclipse impact on solar production.

ISO Confidential
Solar production during the eclipse compared to adjacent days
Slide 15

ISO Confidential
Comparison of solar forecast and actual generation
Slide 16
Due to excessive energy all resources, including solar, were economically decremented using supplied bids

ISO Confidential
CAISO load and solar eclipse impact on behind the meter solar
Slide 17
Red is actual load, yellow is day ahead forecast, blue is Monday August 14, 2017
Increase in load due to loss of roof top solar
Load was lower than forecast as the sun reappeared

ISO Confidential
CAISO resource mix for August 21, 2017
Slide 18

ISO Confidential
CAISO performance indices
Slide 19
Last 30 minutes
10 sec ago
Current

ISO Confidential
Wrap-up• Replacement energy came from the following
– Interties (~3,200 MW)– Hydro (~800 MW)– Thermal (~1,600 MW)– EIM transfers (~350 MW)
• No manual intervention was required during the eclipse– No manual curtailment of solar resources– No manual/verbal dispatch of resources
Key points• Extensive preparation by all teams was key to making this a success• Accurate forecasts for load and variable resources are crucial• A flexible resource fleet is important
– Decremental bid on solar was very useful during return from eclipse– Variability of resources types helped manage the ramp up and down due to
limitations on configuration transitions.– Giving hydro resources enough heads up to adjust water for maximum
flexibility
Slide 20

ISO Confidential
2017 Solar Eclipse Review
September, 27 2017
BANC/SMUD
Powering forward. Together.
CONFIDENTIAL. FOR INTERNAL USE ONLY.

• Overview of BANC/SMUD
• Preparation/Coordination for 2017 Solar Eclipse
• Estimated vs. Actual Impacts of Solar Eclipse
• Conclusions and Observations
22
Outline

Balancing Authority of Northern California (BANC)
BANC (BA)
SMUD (TOP)(BANC Operator)
WAPA-SNR(TOP)
Modesto IrrigationDistrict (TOP)
City of Roseville
United StatesBureau of Reclamation
City of Redding
City of Shasta Lake
23

Solar Generation in BANC
24
Installed Solar PV Capacity
BANC BA SMUDFootprint
WAPAFootprint
Utility-Scale 166.8 MW 138.5 MW 28.3 MW
Behind-The-Meter 206.9 MW 152 MW 54.9 MW
Total 373.7 MW 290.5 MW 83.2 MW

5
Solar Eclipse on August 21, 2017
Northern California saw a partial eclipse between 9:02 AM and 11:39 AM PPT with the max sun obscuration of 76% at about 10:17 AM.

• BANC/SMUD performed initial analysis in June 2017 and coordinated the preparation with all TOPs within BA footprint.
• BANC/SMUD participated in all the discussions and coordination with Peak RC and CAISO.
• BANC/SMUD provided training to all the System Operators in the five-week sessions.
• BANC/SMUD performed another analysis five days before the eclipse with updated load forecast and weather forecast data and developed an Operating Plan.
26
Preparation to Solar Eclipse

Estimated Utility-Scale Solar Generation during Eclipse
27

Forecasted vs. Actual Load
Forecasted BANC Load Actual BANC Load
28

Conclusions and Observations
29
• BANC/SMUD had a smooth operation over the solar eclipse on August 21.
• The actual solar generation reduction during the eclipse was similar to the forecast.
• The air temperature dropped 4 degrees during the eclipse such that the load demand increased slower than forecasted.

.SMUD

2017 Eclipse Post-Event Summary
Michelle Cathcart - BPA
B O N N E V I L L E P O W E R A D M I N I S T R A T I O N
32
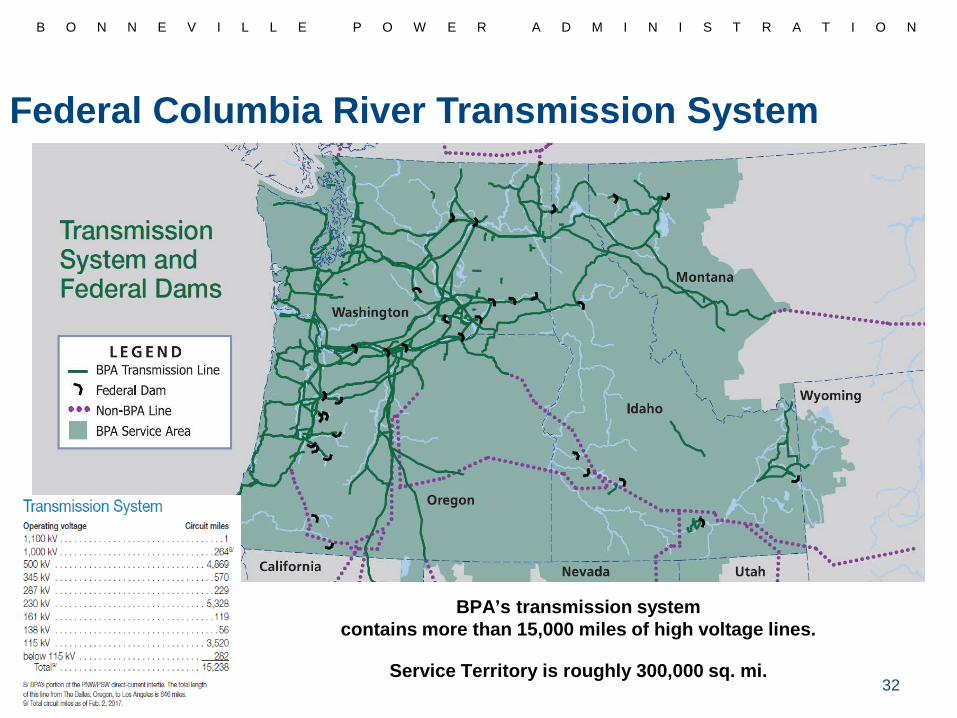
BPA’s transmission systemcontains more than 15,000 miles of high voltage lines.
Service Territory is roughly 300,000 sq. mi.
Federal Columbia River Transmission System

B O N N E V I L L E P O W E R A D M I N I S T R A T I O N
Generation Capacity in BPA Balancing Authority Area
33
69.1%
14.9%
5.7%
5.3%3.7% 1.2%
Generation Capacity Within The BPA Balancing Authority Area, By Type
hydro
wind
gas
coal
nuclear
biomass
solar
Total Nameplate Generation = 32108 MW, as of 02May2016

B O N N E V I L L E P O W E R A D M I N I S T R A T I O N
Preparations
34

B O N N E V I L L E P O W E R A D M I N I S T R A T I O N
• Public safety and awareness article published on BPA’s website and social media
• Field Operations staff prepared for potential emergencies/damage due to large influx of eclipse viewers (est. 1 million+ in Oregon)
• Transportation did not run any heavy equipment moves or tractor trailers on 8/21 or 8/22
Preparations, cont.
35

B O N N E V I L L E P O W E R A D M I N I S T R A T I O N
• BPA worked closely with CAISO and Peak Reliability to develop Operating Plan.
• BPA requested that Columbia Generating Station enter a “No Touch” order for the day of the eclipse.
• BPA Power Business line requested that hydro plant outages be deferred for the day.
Preparations, cont.
36

B O N N E V I L L E P O W E R A D M I N I S T R A T I O N
• Deferred outages on any major transmission facilities that directly impacted California/Canada flows.
• A “No Touch” order on all BPA communication equipment for the duration of the eclipse.
• Scheduling to California during the eclipse was significantly increased, as were imports from Canada. Total interchange remained relatively flat throughout the event.
Preparations, cont.
37

B O N N E V I L L E P O W E R A D M I N I S T R A T I O N
• Work on our Remedial Action Scheme (RAS) system was deferred.
• BPA Dispatch proactively went to a more restrictive Area Control Error (ACE) control, enabling tighter generation control. This had the effect of moving BPA’s ACE closer toward zero, ensuring that BPA would be able to more fully respond to any ACE deviations that occurred during the eclipse.
Preparations, cont.
38

B O N N E V I L L E P O W E R A D M I N I S T R A T I O N
Scheduled vs. Actual BPA Balancing Area Load:
System Performance
39

B O N N E V I L L E P O W E R A D M I N I S T R A T I O N
Load Data From 0930-1100:
System Performance, cont.
40

B O N N E V I L L E P O W E R A D M I N I S T R A T I O N
Actual BPA Balancing Area Solar PV Generation:
System Performance, cont.
41

B O N N E V I L L E P O W E R A D M I N I S T R A T I O N
While not unexpected, there were some events that were specifically related to the eclipse:• Clockwise loop flow on the Northwest AC Intertie
(NWACI) decreased by approximately 500MW in the 90 minutes prior to maximum occlusion.
• Actual load in BPA’s Balancing Area decreased by a maximum of just over 200MW leading up to the moment of totality.
Unexpected Outcomes
42
B O N N E V I L L E P O W E R A D M I N I S T R A T I O N
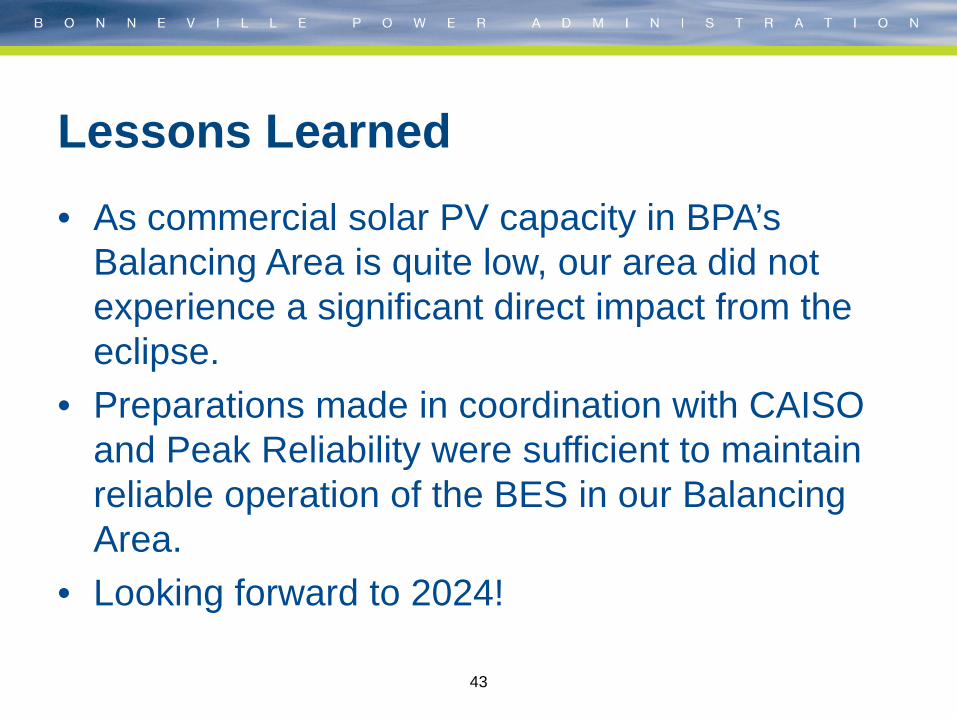
• As commercial solar PV capacity in BPA’s Balancing Area is quite low, our area did not experience a significant direct impact from the eclipse.
• Preparations made in coordination with CAISO and Peak Reliability were sufficient to maintain reliable operation of the BES in our Balancing Area.
• Looking forward to 2024!
Lessons Learned
43

B O N N E V I L L E P O W E R A D M I N I S T R A T I O N
Michael Zeiler, www.GreatAmericanEclipse.com44

B O N N E V I L L E P O W E R A D M I N I S T R A T I O N
Questions?
Thank you!45

Jason AusmusManager Operations Planning
Solar EclipsePost-Event Observations
Sept 27, 2017

47
• Eclipse Path and Preparation• BA/TOP Coordination Efforts• Projected Solar Gen Reduction• Actual Solar Gen Reduction• Other Eclipse Event Observations• Post-Eclipse Analysis Efforts
Overview

48
Aug 21, 2017 (9:00A – 12:15P PDT)

49
• Requested event information and Operating Plans from all BA’s in the Peak footprint (plus AESO)o Summarized into Operating Memo for footprint
• Held readiness webinar on Aug 17th to present study results and expected impact
• Excellent response from BAs in providing data, operating plans and webinar participation!
Peak/BA Eclipse Preparation Efforts

50
• Real-time Ops Engineers (ROEs) also performed studies the night before utilizing the latest inputs
• Created additional displays for situational awareness purposes
Other Preparations by Peak

51
1Utility Scale number accounts for both Solar PV and Solar Thermal
• Utility Scale PV (uPV) estimates made assuming obscuration impact was 1 to 1, i.e. for every 1% obscuration a 1% MW output reduction will occur
• Distribution Scale PV (dPV) estimates came from survey results
Estimated Impacts to Peak FootprintCapacity Max Forecasted
Reduction
Utility Scale1 17.4 GW 7.2 GWDistribution Scale 8.7 GW 2.9 GWTotal 26.1 GW 10.1 GW

52
Actual uPV Impact due to the Eclipse
∆ ≈ -55 MW/min
∆ ≈ + 80 MW/min
∆ ≈ + 115 MW/min

53
1Utility Scale number accounts for both Solar PV and Solar Thermal
• Actual Utility Scale PV (uPV) reduction confirmed the 1 to 1 relationship between % obscuration and % MW output, i.e. for every 1% obscuration a 1% MW output reduction will occur
Actual Impacts to Peak FootprintCapacity Max Forecasted
ReductionMax Actual Reduction
Utility Scale1 17.4 GW 7.2 GW 7.4 GWDistribution Scale 8.7 GW 2.9 GW TBD – Final ReportTotal 26.1 GW 10.1 GW TBD – Final Report

54
• One of the challenges going into the eclipse was knowing the exact dPV installationso Not a lot of visibility behind-the-meter (BTM)o Difficulty separating changes in system load from
changes in BTM generation• Peak collaborating with the National
Renewable Energy Laboratory (NREL)o One objective is to determine actual BTM impact
of dPV installations of the eclipse by BA
Challenge of calculating exact dPV Impact

55
Effect of Distributed PV on System Load• Comparison of load ramp before
eclipse (yellow arrow) vs during eclipse (blue arrow)
• Load ramp increase due to reduction of distributed PV output resulting in increase in load on system
- CAISO Solar Gen- CAISO System Load
Eclipse Start
Eclipse Max
Eclipse Start
Eclipse Max

56
• During the eclipse, system load decreasedo Some load drop was expectedo 5% load drop in March 2015 Europe Eclipse
• Likely causes were attributed to drop in temperature during the eclipse, human factors (curiosity of the event), etc.o Temperature drops were observed to be
anywhere from 4 – 11 degrees in a 1 hour period
System Loading Observations

57
Actual uPV Impact due to the Eclipse

58
Other System Event Observations
• No reliability issues observed during event
• Sufficient reserves were maintained for the duration of the event
• Peak and NREL currently collaborating on a final report of the evento Tentatively planning for late-Oct

59
Apr 8th 2024 – Next Solar Eclipse for U.S.

60
Apr 8th 2024 – Next Solar Eclipse for U.S.


