21
Peak Oil Peak Oil Future Energy Scenarios Future Energy Scenarios Dr. Robert J. Brecha Dr. Robert J. Brecha University of Dayton University of Dayton Chautauqua Course, May 22-24, 20
| Date post: | 17-Dec-2015 |
| Category: |
Documents |
| Upload: | kerry-harper |
| View: | 216 times |
| Download: | 0 times |

Peak OilPeak Oil
Future Energy ScenariosFuture Energy Scenarios
Dr. Robert J. BrechaDr. Robert J. Brecha
University of DaytonUniversity of Dayton
Chautauqua Course, May 22-24, 2006

World Energy UseWorld Energy Use
Coal
Nuclear
Oil
Gas
Hydro
Biomass
Geothermal, wind solar, etc.
RE
Total~400 Quadrillion Btu

Total US Energy Use (Quads)
32.6
17.6
21.1
16.2
0.25
2.2
1.2
0.90.6
26.3
US Energy UseUS Energy Use
Industrial
Commercial
Residential
Transportation Lightvehicles
Med./hvytrucks
Air
(Water, pipeline, rail, buses)
~2/3 of oil use is transportation

US Yearly Petroleum US Yearly Petroleum ProductionProduction
19
49
19
53
19
57
19
61
19
65
19
69
19
73
19
77
19
81
19
85
19
89
19
93
19
97
20
01
0
500
1000
1500
2000
2500
3000
3500
Pro
du
cti
on
(10
6 b
bl/year)
US Petroleum Production
Alaska NG Plant Liquids Lower 48
US Energy Information Agency: http://www.eia.doe.gov/oil_gas/petroleum/pet_frame.html

Finding NorwaysFinding Norways
R.C. Duncan and W. Youngquist, “The World Petroleum Life-Cycle”http://www.dieoff.com/page133.pdf

Driving Habits vs. Driving Habits vs. HybridsHybrids
Scenario one: Fleet grows by 0.5%/yr; no hybrids; driving amount remains const. at 11,600 mi/veh/yrScenario two: Fleet grows by 0.5%/yr; hybrids incr. at 25%/yr.; driving amount remains const. at 11,600 mi/veh/yrScenario three: Fleet grows by 0.5%/yr; no hybrids; driving cut by 10% one time to 10,440 mi/veh/yrScenario four: Fleet grows by 0.5%/yr; no hybrids; driving cut by 2%/yr from 11,600 mi/veh/yr
But … if the decline rate is 3 – 5 %/year?50
60
70
80
90
100
110
120
130
140
2005 2010 2015 2020 2025
Year
Mil
lio
n g
all
on
s o
f g
as p
er
year
Scenario 1 Scenario 2 Scenario 3 Scenario 4

Fuel Economy by SpeedFuel Economy by Speed
Transportation Energy Data Book, 24th Ed.
Driving at 60 mph instead of 70 mph could saveroughly 500,000 barrels of oil each day

EthanolEthanolYield for ethanol from corn is ~70 GJ/ha (@9000 kgcorn/ha)
Automobile + light truck transportation uses ~1.7×10¹⁰ GJ/a
Quick calculation: we would need 2.4×10⁸ ha of land
Currently we have in the US 1.2×10⁸ ha of cropland total
But … the key point missing is the energy input. Ethanol fromindustrial-scale corn farming is barely an energy break-even. Energy return on Energy invested (EROEI) ratio is ~1. GHG emissions are only slightly less than for conventional gasoline.
D.Pimentel and T. Patzek, Natural Resources Research 14, 65-76 (2005) Shapouri - USDA “The Energy Balance of Corn Ethanol: An Update” Ag. Econ. Report 813Farrell et al., Science 311, 506-508 (2006)

Four ScenariosFour Scenarios
0.010.020.030.040.050.060.070.080.090.0
100.0110.0
2000 2005 2010 2015 2020 2025 2030 2035 2040
Year
MM
bo
e/d
Current Conserve BAU Green Nuclear Coal

Effects of Peak Oil – Effects of Peak Oil – Scenario IScenario I
2005
2009
2013
2017
2021
2025
2029
2033
0.00
5.00
10.00
15.00
20.00
Solar
Wind
Gas hydrates
Shale oil
Biomass
Hydro
Tar sands
Nuclear
Nat. gas
Coal
Oil
Mil
lion
boe/d
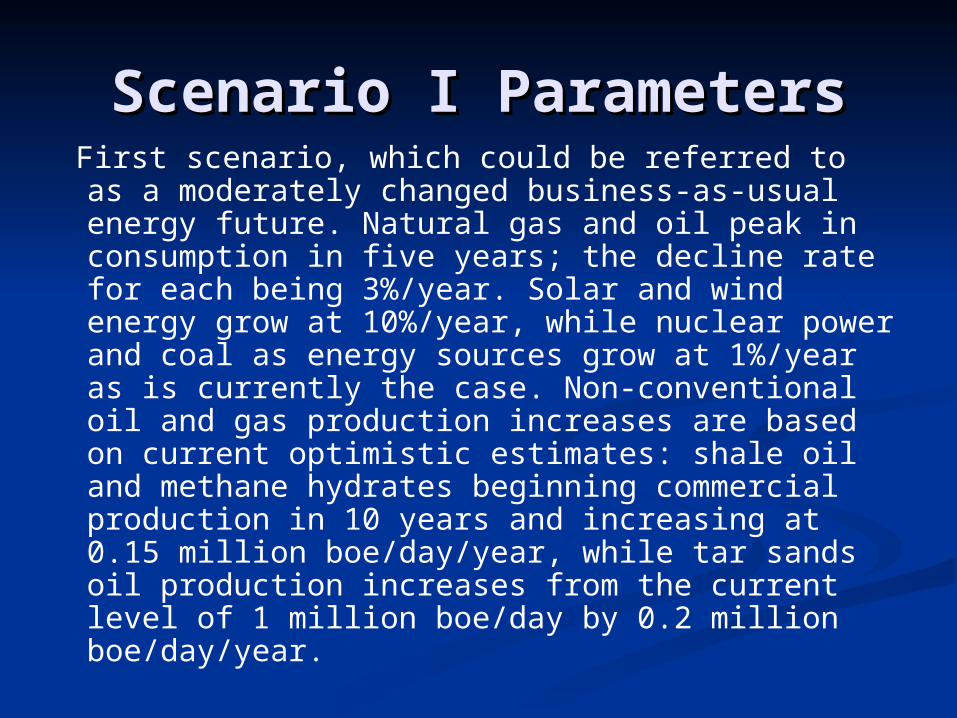
Scenario I ParametersScenario I Parameters First scenario, which could be referred to as a
moderately changed business-as-usual energy future. Natural gas and oil peak in consumption in five years; the decline rate for each being 3%/year. Solar and wind energy grow at 10%/year, while nuclear power and coal as energy sources grow at 1%/year as is currently the case. Non-conventional oil and gas production increases are based on current optimistic estimates: shale oil and methane hydrates beginning commercial production in 10 years and increasing at 0.15 million boe/day/year, while tar sands oil production increases from the current level of 1 million boe/day by 0.2 million boe/day/year.

Green Energy Future – Green Energy Future – Scenario IIScenario II
2005
2009
2013
2017
2021
2025
2029
2033
0.00
5.00
10.00
15.00
20.00
Solar
Wind
Gas hydrates
Shale oil
Biomass
Hydro
Tar sands
Nuclear
Nat. gas
Coal
Oil
Mil
lion
boe/d

Scenario II ParametersScenario II ParametersSecond scenario, which could be referred to as
a green energy future. Natural gas and oil peak in consumption in five years; the decline rate for each being 3%/year, considered as a lower limit. Solar and wind energy grow at 20%/year, while nuclear power and coal as energy sources grow at 1%/year as is currently the case. Finally, non-conventional oil and gas development proceeds more slowly than in the first scenario: shale oil and methane hydrates beginning commercial production in 10 years and increasing at 0.05 million boe/day/year, while tar sands oil production increases from the current level of 1 million boe/day by the same 0.05 million boe/day/year.

NuclearNuclear
Technology knownTechnology known Good for environment – at least for Good for environment – at least for
COCO22 emissions emissions Electricity, not transportationElectricity, not transportation Back to HirschBack to Hirsch Waste disposal, etc.Waste disposal, etc. Non-renewable (~50 years at Non-renewable (~50 years at
CROC?)CROC?)

Nuclear Future – Nuclear Future – Scenario IIIScenario III
2005
2009
2013
2017
2021
2025
2029
2033
0.00
5.00
10.00
15.00
20.00
25.00
Solar
Wind
Gas hydrates
Shale oil
Biomass
Hydro
Tar sands
Nuclear
Nat. gas
Coal
Oil
Mil
lion
boe/d

Scenario III ParametersScenario III Parameters Third scenario, nuclear-supplemented fossil-
fuel energy future. Natural gas and oil peak in consumption in five years; the decline rate for each being 3%/year, as in the first scenario. Solar and wind energy grow at 10%/year and coal grows at 1%/year, while nuclear power as an energy source increases at 10%/year beginning in 10 years to allow for ramp-up. Finally, the prognoses for non-conventional oil and gas are based on current optimistic estimates: shale oil and methane hydrates beginning commercial production in 10 years and increasing at 0.15 million boe/day/year, while tar sands oil production increases from the current level of 1 million boe/day by 0.2 million boe/day/year.

Life-cycle COLife-cycle CO22 emissions emissions
H. Hondo / Energy 30 (2005) 2042–2056

The Coal Future – The Coal Future – Scenario IVScenario IV
20
05
20
09
20
13
20
17
20
21
20
25
20
29
20
33
0.00
5.00
10.00
15.00
20.00
25.00
30.00
Solar
Wind
Gas hydrates
Shale oil
Biomass
Hydro
Tar sands
Nuclear
Nat. gas
Coal
Oil
Mil
lion
boe/d

Scenario IV ParametersScenario IV Parameters
Fourth scenario, coal energy future. Natural gas and oil peak in consumption in five years; the decline rate for each being 8%/year, leading to a strong increase in the use of coal, at a rate of 5%/year. Solar and wind energy grow at 10%/year, while nuclear power grows at 1%/year as is currently the case. Finally, the prognoses for non-conventional oil and gas are based on current optimistic estimates: shale oil and methane hydrates beginning commercial production in 10 years and increasing at 0.15 million boe/day/year, while tar sands oil production increases from the current level of 1 million boe/day by 0.2 million boe/day/year.

Coal ProductionCoal Production
http://www.eia.doe.gov/emeu/aer/coal.htmlEnergy Information Administration – Annual Energy Review 2005

Coal ProductionCoal Production
Coal Production, 1949-2004
0.00
5.00
10.00
15.00
20.00
25.00
30.00
1950 1960 1970 1980 1990 2000 2010
Co
al e
ne
rgy
co
nte
nt
(Qu
ad
s)
0
200
400
600
800
1000
1200
To
tal P
rod
uct
ion
(m
illio
n t
on
s)
Coal production Million Btu/ton Energy content


