54
European Tourism in 2017: Trends & Prospects (Q2/2017) PEAN TOURISM 2016 TRENDS & PROSPECTS APRIL 2016
European Tourism in 2017: Trends & Prospects (Q2/2017)
PEAN TOURISM 2016 TRENDS & PROSPECTS
APRIL 2016
European Tourism in 2017: Trends & Prospects (Q2/2017)
1
EUROPEAN TOURISM IN 2017: TRENDS & PROSPECTS
Quarterly Report (Q2/2017)
A quarterly insights report produced for the Market Intelligence Group
of the European Travel Commission (ETC)
by Tourism Economics (an Oxford Economics Company)
Brussels, June 2017
ETC Market Intelligence Report
European Tourism in 2017: Trends & Prospects (Q2/2017)
2
Copyright © 2017 European Travel Commission
European Tourism in 2017: Trends & Prospects (Q2/2017)
All rights reserved. The contents of this report may be quoted, provided the source is given accurately
and clearly. Distribution or reproduction in full is permitted for own or internal use only. While we
encourage distribution via publicly accessible websites, this should be done via a link to ETC's
corporate website, www.etc-corporate.org, referring visitors to the Research/Trends Watch section.
The designations employed and the presentation of material in this publication do not imply the
expression of any opinions whatsoever on the part of the Executive Unit of the European Travel
Commission.
Data sources: This report includes data from the TourMIS database (http://www.tourmis.info), STR
Global, IATA, AEA and UNWTO.
Economic analysis and forecasts are provided by Tourism Economics and are for interpretation by
users according to their needs.
Published and printed by the European Travel Commission
Rue du Marché aux Herbes, 61, 1000 Brussels, Belgium
Website: www.etc-corporate.org
Email: [email protected]
ISSN No: 2034-9297
This report was compiled and edited by:
Tourism Economics (an Oxford Economics Company)
on behalf of the ETC Market Intelligence Group
Cover: Mediterranean seascape, Monaco Bay
Image ID: 100122674
Copyright: LiliGraphie
European Tourism in 2017: Trends & Prospects (Q2/2017)
3
TABLE OF CONTENTS Foreword ............................................................................................................. 5
1. Tourism Performance Summary 2017 ............................................................ 9
2. Global Tourism Forecast Summary .............................................................. 11
3. Recent Industry Performance ....................................................................... 12
3.1 Air Transport .......................................................................................... 12
3.2 Accommodation ..................................................................................... 16
4. Special Feature ............................................................................................. 20
5. Key Source Market Performance .................................................................. 23
5.1 Key Intra-European Markets .................................................................. 23
5.2 Non-European Markets .......................................................................... 27
6. Origin Market Share Analysis........................................................................ 30
6.1 United States .......................................................................................... 31
6.2 Canada ................................................................................................... 32
6.3 Mexico .................................................................................................... 33
6.4 Argentina ................................................................................................ 34
6.5 Brazil ...................................................................................................... 35
6.6 India ....................................................................................................... 36
6.7 China ...................................................................................................... 37
6.8 Japan ..................................................................................................... 38
6.9 Australia ................................................................................................. 39
6.10 United Arab Emirates ........................................................................... 40
6.11 Russia .................................................................................................. 41
7. Economic Outlook ......................................................................................... 42
7.1 Overview ................................................................................................ 42
7.2 Eurozone ................................................................................................ 44
7.3 United Kingdom...................................................................................... 45
7.4 United States .......................................................................................... 46
7.5 Japan ..................................................................................................... 47
7.6 Emerging Markets .................................................................................. 48
8. Appendix 1 .................................................................................................... 51
9. Appendix 2 .................................................................................................... 53

European Tourism in 2017: Trends & Prospects (Q2/2017)
4
European Tourism in 2017: Trends & Prospects (Q2/2017)
5
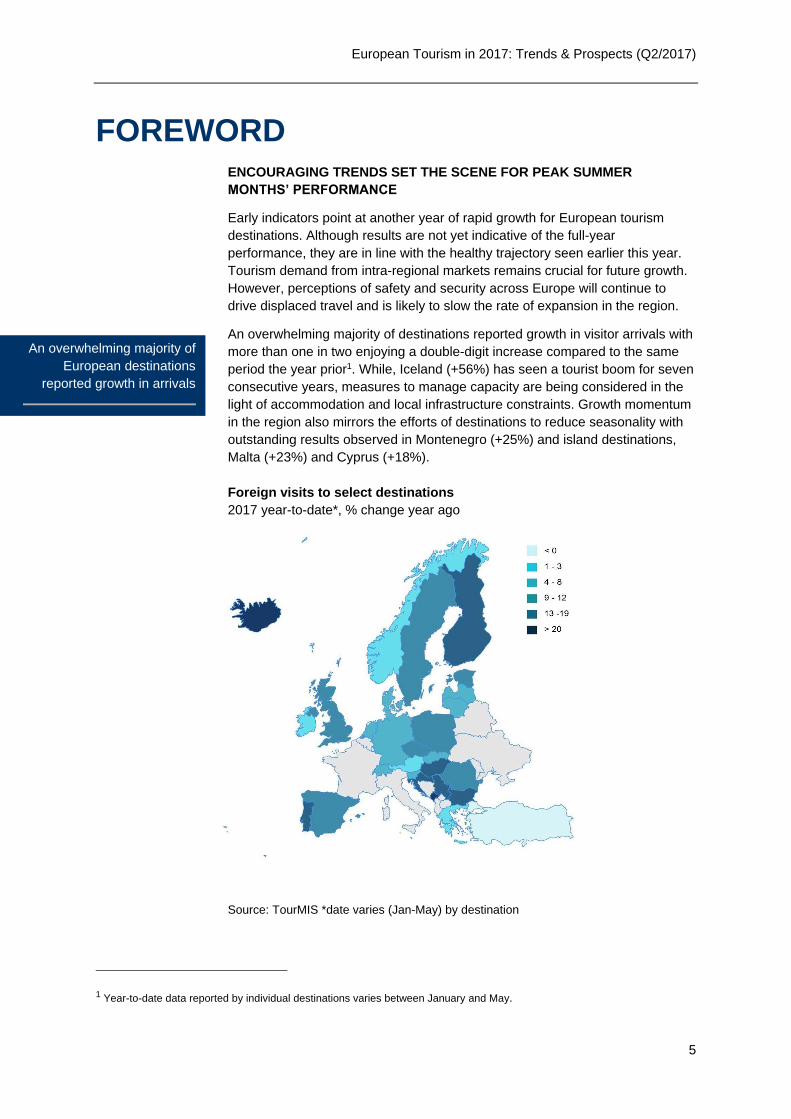
FOREWORD ENCOURAGING TRENDS SET THE SCENE FOR PEAK SUMMER
MONTHS’ PERFORMANCE
Early indicators point at another year of rapid growth for European tourism
destinations. Although results are not yet indicative of the full-year
performance, they are in line with the healthy trajectory seen earlier this year.
Tourism demand from intra-regional markets remains crucial for future growth.
However, perceptions of safety and security across Europe will continue to
drive displaced travel and is likely to slow the rate of expansion in the region.
An overwhelming majority of destinations reported growth in visitor arrivals with
more than one in two enjoying a double-digit increase compared to the same
period the year prior1. While, Iceland (+56%) has seen a tourist boom for seven
consecutive years, measures to manage capacity are being considered in the
light of accommodation and local infrastructure constraints. Growth momentum
in the region also mirrors the efforts of destinations to reduce seasonality with
outstanding results observed in Montenegro (+25%) and island destinations,
Malta (+23%) and Cyprus (+18%).
Foreign visits to select destinations
2017 year-to-date*, % change year ago
Source: TourMIS *date varies (Jan-May) by destination
1 Year-to-date data reported by individual destinations varies between January and May.
An overwhelming majority of
European destinations
reported growth in arrivals
European Tourism in 2017: Trends & Prospects (Q2/2017)
6
Finland (+18%) and Bulgaria (+17%) also performed well. The former, which is
celebrating 100 years of independence in 2017, saw an upsurge in the flow of
Chinese visitors (+81%)2 helped by improved flight connections and a strong
media exposure in China, whereas the last was seen as a more affordable
alternative for winter breaks. Portugal, Serbia and Croatia (all +15%) owe their
success, among other factors, to improved air connectivity and strong
marketing and promotion efforts. Westwards, in Switzerland, arrivals rose by a
modest +5% maintaining its position as a traditional winter destination. Turkey’s
setback (-8%) however, will require significant efforts to restore the inflow of
tourists in the near future due to the perceived safety and security concerns in
the country.
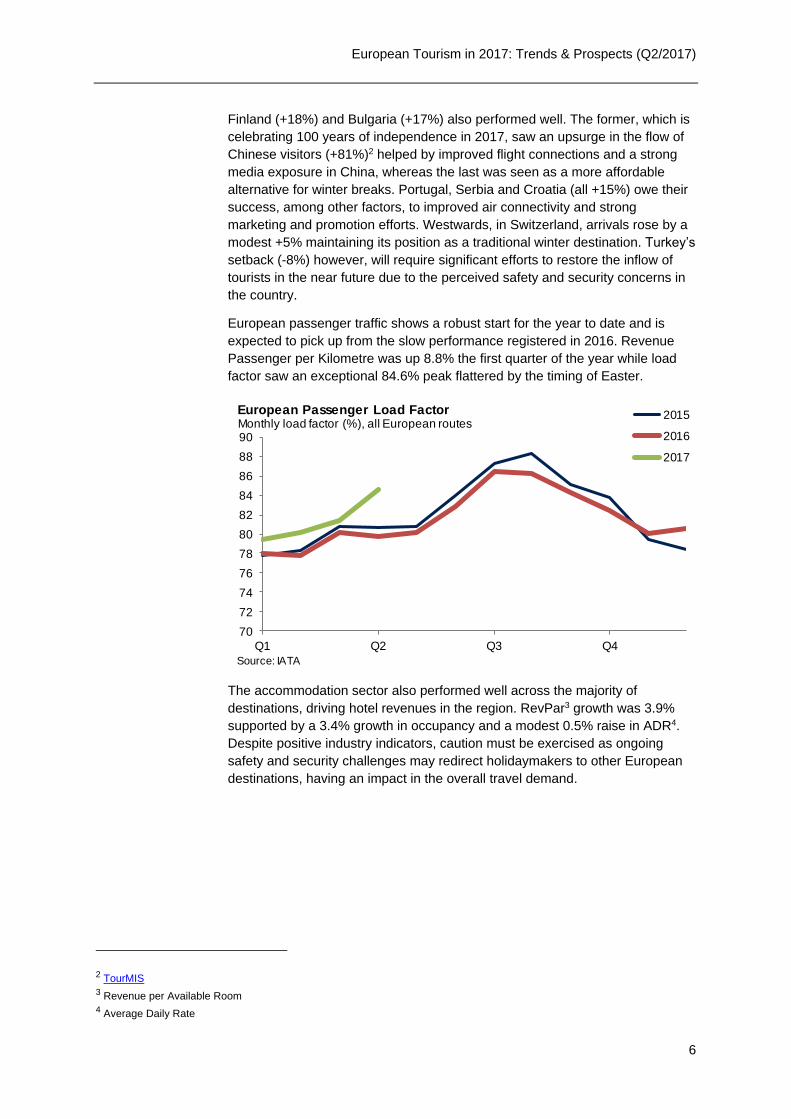
European passenger traffic shows a robust start for the year to date and is
expected to pick up from the slow performance registered in 2016. Revenue
Passenger per Kilometre was up 8.8% the first quarter of the year while load
factor saw an exceptional 84.6% peak flattered by the timing of Easter.
The accommodation sector also performed well across the majority of
destinations, driving hotel revenues in the region. RevPar3 growth was 3.9%
supported by a 3.4% growth in occupancy and a modest 0.5% raise in ADR4.
Despite positive industry indicators, caution must be exercised as ongoing
safety and security challenges may redirect holidaymakers to other European
destinations, having an impact in the overall travel demand.
2 TourMIS
3 Revenue per Available Room
4 Average Daily Rate
70
72
74
76
78
80
82
84
86
88
90
Q1 Q2 Q3 Q4
2015
2016
2017
Source: IATA
Monthly load factor (%), all European routesEuropean Passenger Load Factor
European Tourism in 2017: Trends & Prospects (Q2/2017)
7
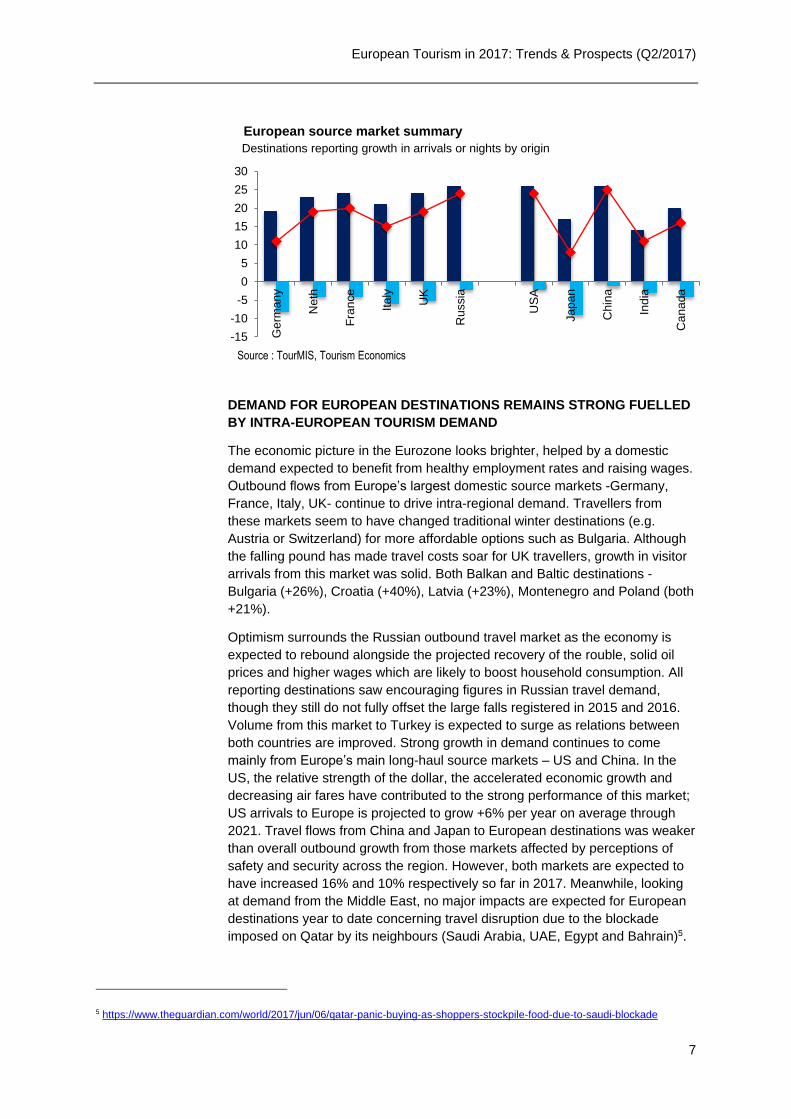
DEMAND FOR EUROPEAN DESTINATIONS REMAINS STRONG FUELLED
BY INTRA-EUROPEAN TOURISM DEMAND
The economic picture in the Eurozone looks brighter, helped by a domestic
demand expected to benefit from healthy employment rates and raising wages.
Outbound flows from Europe’s largest domestic source markets -Germany,
France, Italy, UK- continue to drive intra-regional demand. Travellers from
these markets seem to have changed traditional winter destinations (e.g.
Austria or Switzerland) for more affordable options such as Bulgaria. Although
the falling pound has made travel costs soar for UK travellers, growth in visitor
arrivals from this market was solid. Both Balkan and Baltic destinations -
Bulgaria (+26%), Croatia (+40%), Latvia (+23%), Montenegro and Poland (both
+21%).
Optimism surrounds the Russian outbound travel market as the economy is
expected to rebound alongside the projected recovery of the rouble, solid oil
prices and higher wages which are likely to boost household consumption. All
reporting destinations saw encouraging figures in Russian travel demand,
though they still do not fully offset the large falls registered in 2015 and 2016.
Volume from this market to Turkey is expected to surge as relations between
both countries are improved. Strong growth in demand continues to come
mainly from Europe’s main long-haul source markets – US and China. In the
US, the relative strength of the dollar, the accelerated economic growth and
decreasing air fares have contributed to the strong performance of this market;
US arrivals to Europe is projected to grow +6% per year on average through
2021. Travel flows from China and Japan to European destinations was weaker
than overall outbound growth from those markets affected by perceptions of
safety and security across the region. However, both markets are expected to
have increased 16% and 10% respectively so far in 2017. Meanwhile, looking
at demand from the Middle East, no major impacts are expected for European
destinations year to date concerning travel disruption due to the blockade
imposed on Qatar by its neighbours (Saudi Arabia, UAE, Egypt and Bahrain)5.
5 https://www.theguardian.com/world/2017/jun/06/qatar-panic-buying-as-shoppers-stockpile-food-due-to-saudi-blockade
-15
-10
-5
0
5
10
15
20
25
30
Ge
rma
ny
Ne
th
Fra
nce
Ita
ly
UK
Ru
ssia
US
A
Ja
pa
n
Ch
ina
Ind
ia
Ca
na
da
Destinations reporting growth in arrivals or nights by origin
European source market summary
Source : TourMIS, Tourism Economics
European Tourism in 2017: Trends & Prospects (Q2/2017)
8
CAPITALISING ON THE REGION’S VAST OFFERING IS KEY TO ENSURE
SUSTAINED GROWTH
The beginning of 2017 saw significant turbulence in the world’s premiere tourist
destination: “Brexit”, terrorism-related disruption, political volatility and
uncertainties, etc. which have failed to dim the region’s appeal. Europe
continues to lure millions of international travellers (615 million international
tourist arrivals in 20166) confirming the tourism sector’s resilience to safety and
security shocks and geopolitical uncertainty. As seen from the Long-Haul
Travel Sentiment Index7, Europe’s well-known destinations continue to have
the potential to fuel the interest of long-haul travellers in 2017. “Independently
of a stable European domestic market, growth is also driven by long-haul
source markets. Cheap oil prices, favourable currency exchanges, raising
middle classes coupled with improved air connectivity and travel facilitation, are
contributing significantly to the surge of outbound travel to Europe”, said
Eduardo Santander, Executive Director European Travel Commission (ETC).
Jennifer Iduh (ETC Executive Unit)
with the assistance of the ETC Market Intelligence Group
6 UNWTO
7 LHTSI: The Long-Haul Travel Sentiment Survey captures people’s intention to travel abroad, their motivations and barriers to
travel, as well as key characteristics of their trip
European Tourism in 2017: Trends & Prospects (Q2/2017)
9
1. TOURISM PERFORMANCE
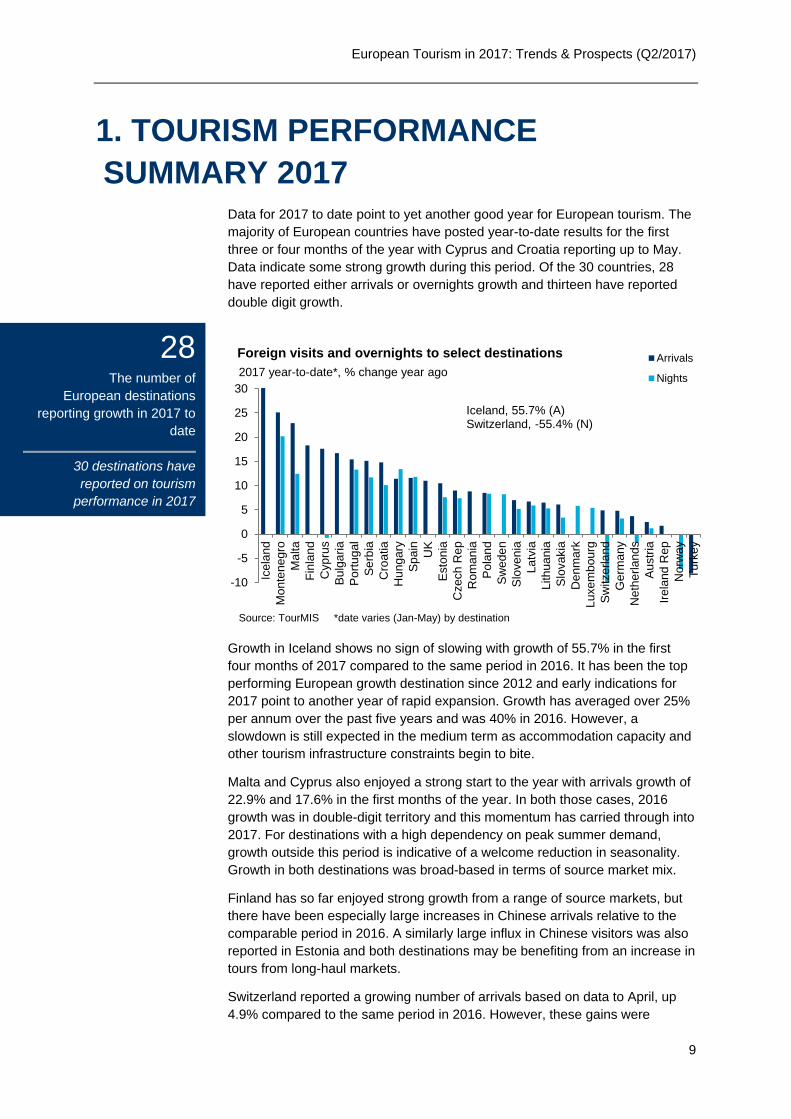
SUMMARY 2017 Data for 2017 to date point to yet another good year for European tourism. The
majority of European countries have posted year-to-date results for the first
three or four months of the year with Cyprus and Croatia reporting up to May.
Data indicate some strong growth during this period. Of the 30 countries, 28
have reported either arrivals or overnights growth and thirteen have reported
double digit growth.
Growth in Iceland shows no sign of slowing with growth of 55.7% in the first
four months of 2017 compared to the same period in 2016. It has been the top
performing European growth destination since 2012 and early indications for
2017 point to another year of rapid expansion. Growth has averaged over 25%
per annum over the past five years and was 40% in 2016. However, a
slowdown is still expected in the medium term as accommodation capacity and
other tourism infrastructure constraints begin to bite.
Malta and Cyprus also enjoyed a strong start to the year with arrivals growth of
22.9% and 17.6% in the first months of the year. In both those cases, 2016
growth was in double-digit territory and this momentum has carried through into
2017. For destinations with a high dependency on peak summer demand,
growth outside this period is indicative of a welcome reduction in seasonality.
Growth in both destinations was broad-based in terms of source market mix.
Finland has so far enjoyed strong growth from a range of source markets, but
there have been especially large increases in Chinese arrivals relative to the
comparable period in 2016. A similarly large influx in Chinese visitors was also
reported in Estonia and both destinations may be benefiting from an increase in
tours from long-haul markets.
Switzerland reported a growing number of arrivals based on data to April, up
4.9% compared to the same period in 2016. However, these gains were
-10
-5
0
5
10
15
20
25
30
Icela
nd
Monte
negro
Malta
Fin
lan
d
Cypru
s
Bu
lga
ria
Po
rtu
gal
Se
rbia
Cro
atia
Hung
ary
Sp
ain
UK
Esto
nia
Czech R
ep
Rom
an
ia
Po
lan
d
Sw
ede
n
Slo
ven
ia
Latv
ia
Lithuania
Slo
vakia
Denm
ark
Luxem
bourg
Sw
itzerla
nd
Germ
any
Neth
erl
and
s
Au
str
ia
Irela
nd
Rep
Norw
ay
Turk
ey
Arrivals
Nights
Source: TourMIS *date varies (Jan-May) by destination
2017 year-to-date*, % change year ago
Foreign visits and overnights to select destinations
Iceland, 55.7% (A)Switzerland, -55.4% (N)
28 The number of
European destinations
reporting growth in 2017 to
date
30 destinations have
reported on tourism
performance in 2017
European Tourism in 2017: Trends & Prospects (Q2/2017)
10
reportedly offset by substantial decline in the number of overnights - down
55.4%. This fall is not reflected in hotel occupancy data and may be due to a
change in methodology for measurement. But relatively weak performance
reflects why the Swiss National Bank desires a depreciation of what it
considers a heavily overvalued Swiss franc which has hit labour-intensive
sectors, such as tourism and consumer services.
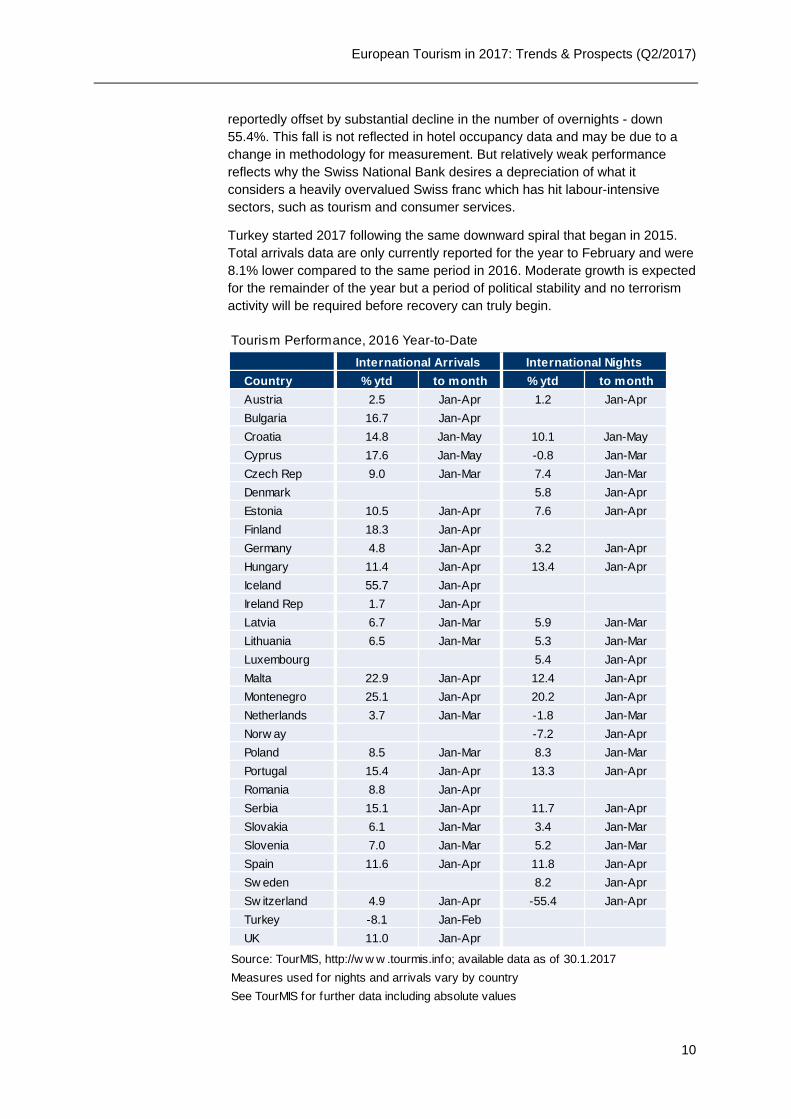
Turkey started 2017 following the same downward spiral that began in 2015.
Total arrivals data are only currently reported for the year to February and were
8.1% lower compared to the same period in 2016. Moderate growth is expected
for the remainder of the year but a period of political stability and no terrorism
activity will be required before recovery can truly begin.
Tourism Performance, 2016 Year-to-Date
Country % ytd to month % ytd to month
Austria 2.5 Jan-Apr 1.2 Jan-Apr
Bulgaria 16.7 Jan-Apr
Croatia 14.8 Jan-May 10.1 Jan-May
Cyprus 17.6 Jan-May -0.8 Jan-Mar
Czech Rep 9.0 Jan-Mar 7.4 Jan-Mar
Denmark 5.8 Jan-Apr
Estonia 10.5 Jan-Apr 7.6 Jan-Apr
Finland 18.3 Jan-Apr
Germany 4.8 Jan-Apr 3.2 Jan-Apr
Hungary 11.4 Jan-Apr 13.4 Jan-Apr
Iceland 55.7 Jan-Apr
Ireland Rep 1.7 Jan-Apr
Latvia 6.7 Jan-Mar 5.9 Jan-Mar
Lithuania 6.5 Jan-Mar 5.3 Jan-Mar
Luxembourg 5.4 Jan-Apr
Malta 22.9 Jan-Apr 12.4 Jan-Apr
Montenegro 25.1 Jan-Apr 20.2 Jan-Apr
Netherlands 3.7 Jan-Mar -1.8 Jan-Mar
Norw ay -7.2 Jan-Apr
Poland 8.5 Jan-Mar 8.3 Jan-Mar
Portugal 15.4 Jan-Apr 13.3 Jan-Apr
Romania 8.8 Jan-Apr
Serbia 15.1 Jan-Apr 11.7 Jan-Apr
Slovakia 6.1 Jan-Mar 3.4 Jan-Mar
Slovenia 7.0 Jan-Mar 5.2 Jan-Mar
Spain 11.6 Jan-Apr 11.8 Jan-Apr
Sw eden 8.2 Jan-Apr
Sw itzerland 4.9 Jan-Apr -55.4 Jan-Apr
Turkey -8.1 Jan-Feb
UK 11.0 Jan-Apr
Source: TourMIS, http://w w w .tourmis.info; available data as of 30.1.2017
Measures used for nights and arrivals vary by country
See TourMIS for further data including absolute values
International Arrivals International Nights
European Tourism in 2017: Trends & Prospects (Q2/2017)
11
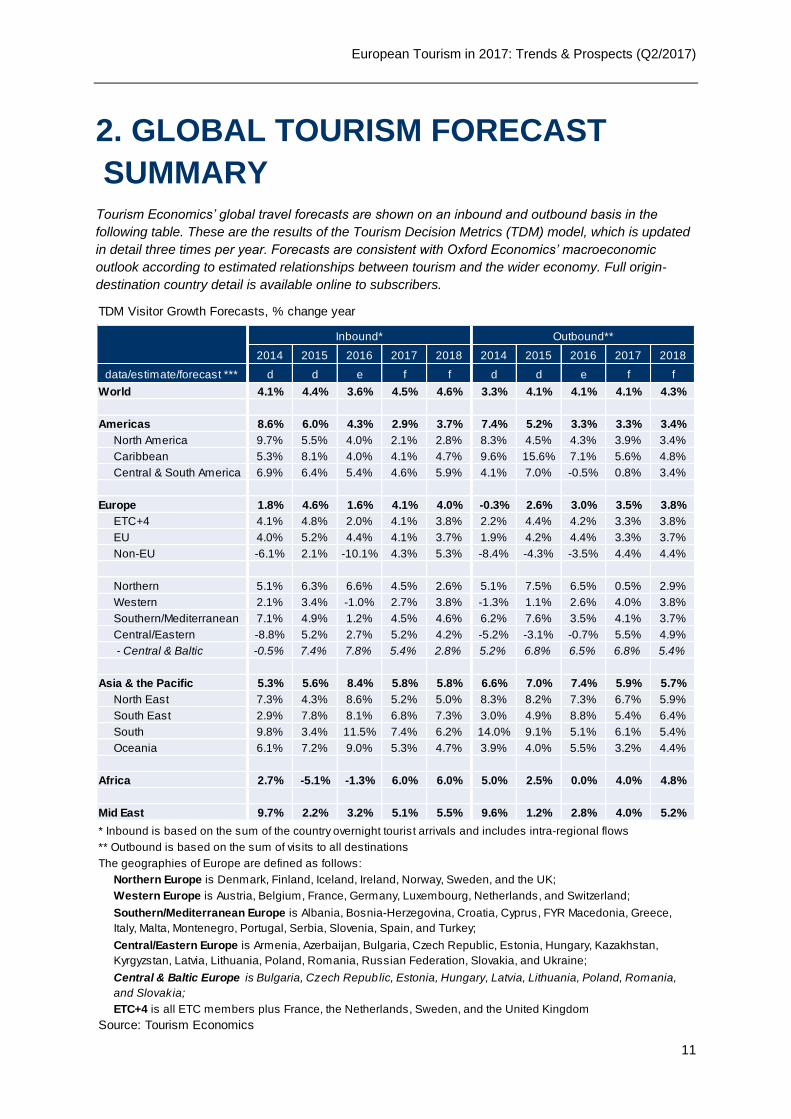
2. GLOBAL TOURISM FORECAST
SUMMARY Tourism Economics’ global travel forecasts are shown on an inbound and outbound basis in the
following table. These are the results of the Tourism Decision Metrics (TDM) model, which is updated
in detail three times per year. Forecasts are consistent with Oxford Economics’ macroeconomic
outlook according to estimated relationships between tourism and the wider economy. Full origin-
destination country detail is available online to subscribers.
TDM Visitor Growth Forecasts, % change year
2014 2015 2016 2017 2018 2014 2015 2016 2017 2018
d d e f f d d e f f
World 4.1% 4.4% 3.6% 4.5% 4.6% 3.3% 4.1% 4.1% 4.1% 4.3%
Americas 8.6% 6.0% 4.3% 2.9% 3.7% 7.4% 5.2% 3.3% 3.3% 3.4%
North America 9.7% 5.5% 4.0% 2.1% 2.8% 8.3% 4.5% 4.3% 3.9% 3.4%
Caribbean 5.3% 8.1% 4.0% 4.1% 4.7% 9.6% 15.6% 7.1% 5.6% 4.8%
Central & South America 6.9% 6.4% 5.4% 4.6% 5.9% 4.1% 7.0% -0.5% 0.8% 3.4%
Europe 1.8% 4.6% 1.6% 4.1% 4.0% -0.3% 2.6% 3.0% 3.5% 3.8%
ETC+4 4.1% 4.8% 2.0% 4.1% 3.8% 2.2% 4.4% 4.2% 3.3% 3.8%
EU 4.0% 5.2% 4.4% 4.1% 3.7% 1.9% 4.2% 4.4% 3.3% 3.7%
Non-EU -6.1% 2.1% -10.1% 4.3% 5.3% -8.4% -4.3% -3.5% 4.4% 4.4%
Northern 5.1% 6.3% 6.6% 4.5% 2.6% 5.1% 7.5% 6.5% 0.5% 2.9%
Western 2.1% 3.4% -1.0% 2.7% 3.8% -1.3% 1.1% 2.6% 4.0% 3.8%
Southern/Mediterranean 7.1% 4.9% 1.2% 4.5% 4.6% 6.2% 7.6% 3.5% 4.1% 3.7%
Central/Eastern -8.8% 5.2% 2.7% 5.2% 4.2% -5.2% -3.1% -0.7% 5.5% 4.9%
- Central & Baltic -0.5% 7.4% 7.8% 5.4% 2.8% 5.2% 6.8% 6.5% 6.8% 5.4%
Asia & the Pacific 5.3% 5.6% 8.4% 5.8% 5.8% 6.6% 7.0% 7.4% 5.9% 5.7%
North East 7.3% 4.3% 8.6% 5.2% 5.0% 8.3% 8.2% 7.3% 6.7% 5.9%
South East 2.9% 7.8% 8.1% 6.8% 7.3% 3.0% 4.9% 8.8% 5.4% 6.4%
South 9.8% 3.4% 11.5% 7.4% 6.2% 14.0% 9.1% 5.1% 6.1% 5.4%
Oceania 6.1% 7.2% 9.0% 5.3% 4.7% 3.9% 4.0% 5.5% 3.2% 4.4%
Africa 2.7% -5.1% -1.3% 6.0% 6.0% 5.0% 2.5% 0.0% 4.0% 4.8%
Mid East 9.7% 2.2% 3.2% 5.1% 5.5% 9.6% 1.2% 2.8% 4.0% 5.2%
* Inbound is based on the sum of the country overnight tourist arrivals and includes intra-regional flows
** Outbound is based on the sum of visits to all destinations
The geographies of Europe are defined as follows:
Northern Europe is Denmark, Finland, Iceland, Ireland, Norway, Sweden, and the UK;
Western Europe is Austria, Belgium, France, Germany, Luxembourg, Netherlands, and Switzerland;
ETC+4 is all ETC members plus France, the Netherlands, Sweden, and the United Kingdom
Source: Tourism Economics
Central & Baltic Europe is Bulgaria, Czech Republic, Estonia, Hungary, Latvia, Lithuania, Poland, Romania,
and Slovakia;
Southern/Mediterranean Europe is Albania, Bosnia-Herzegovina, Croatia, Cyprus, FYR Macedonia, Greece,
Italy, Malta, Montenegro, Portugal, Serbia, Slovenia, Spain, and Turkey;
Central/Eastern Europe is Armenia, Azerbaijan, Bulgaria, Czech Republic, Estonia, Hungary, Kazakhstan,
Kyrgyzstan, Latvia, Lithuania, Poland, Romania, Russian Federation, Slovakia, and Ukraine;
data/estimate/forecast ***
Outbound**Inbound*
European Tourism in 2017: Trends & Prospects (Q2/2017)
12
3. RECENT INDUSTRY PERFORMANCE
INDUSTRY PERFORMANCE REMAINS STRONG
Passenger growth in 2017 has continued in line with the solid growth seen in 2016.
A strong dollar continues to aid outbound growth from the Americas but growth is
beginning to slow.
Asian travel to Europe has been recovering following some safety concerns.
Hotel occupancy has continued to rise in early 2017 in most European countries and
across all European regions. However, Northern Europe has witnessed a fall in ADR
and RevPAR.
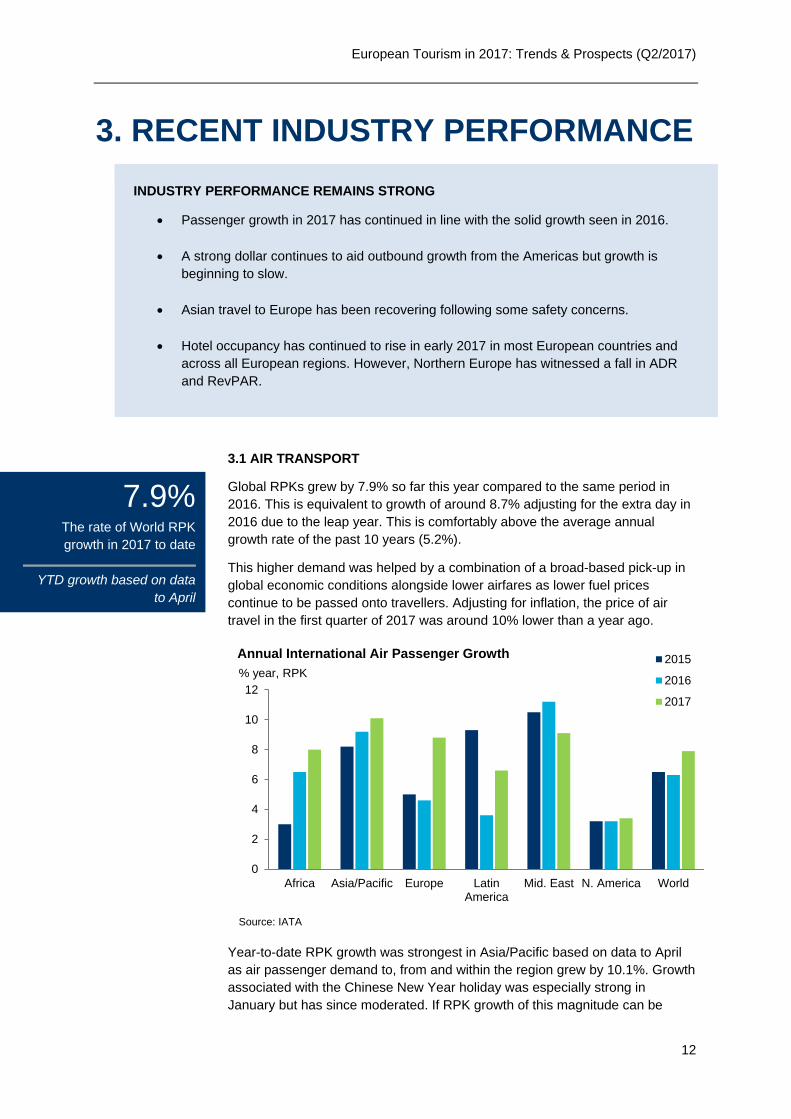
3.1 AIR TRANSPORT
Global RPKs grew by 7.9% so far this year compared to the same period in
2016. This is equivalent to growth of around 8.7% adjusting for the extra day in
2016 due to the leap year. This is comfortably above the average annual
growth rate of the past 10 years (5.2%).
This higher demand was helped by a combination of a broad-based pick-up in
global economic conditions alongside lower airfares as lower fuel prices
continue to be passed onto travellers. Adjusting for inflation, the price of air
travel in the first quarter of 2017 was around 10% lower than a year ago.
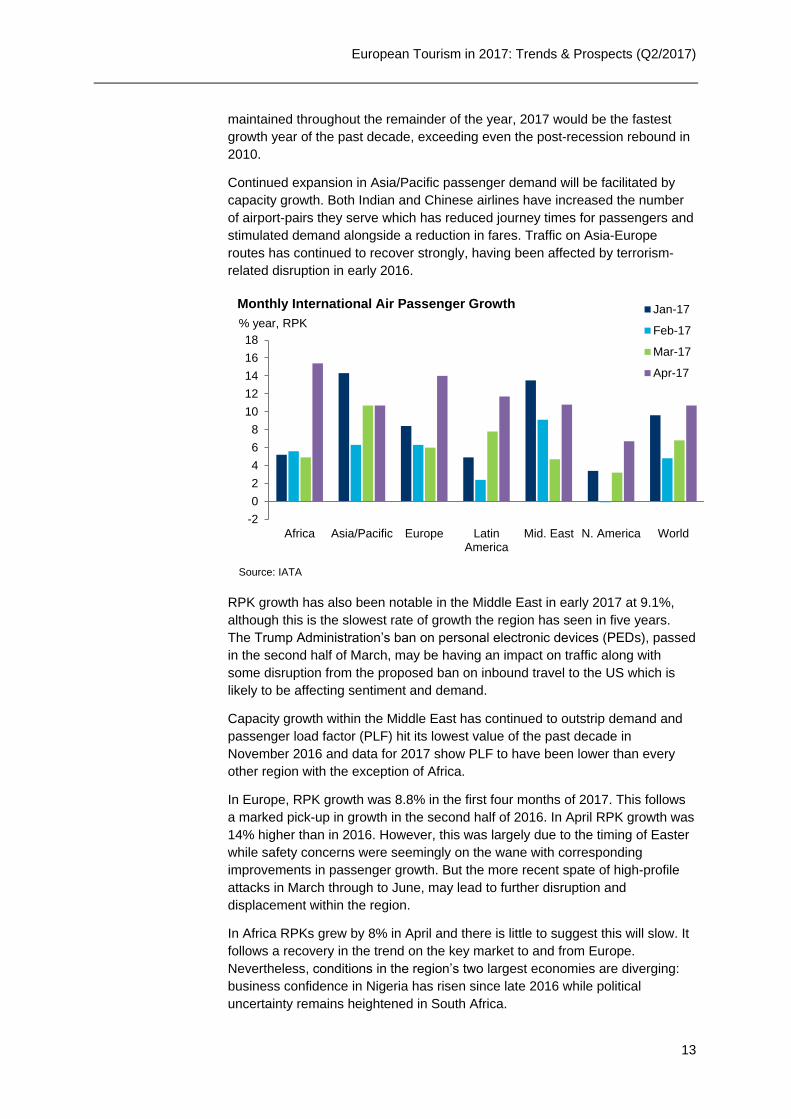
Year-to-date RPK growth was strongest in Asia/Pacific based on data to April
as air passenger demand to, from and within the region grew by 10.1%. Growth
associated with the Chinese New Year holiday was especially strong in
January but has since moderated. If RPK growth of this magnitude can be
Africa Asia/Pacific Europe LatinAmerica
Mid. East N. America World
0
2
4
6
8
10
12
2015
2016
2017
Source: IATA
% year, RPK
Annual International Air Passenger Growth
7.9% The rate of World RPK
growth in 2017 to date
YTD growth based on data
to April
European Tourism in 2017: Trends & Prospects (Q2/2017)
13
maintained throughout the remainder of the year, 2017 would be the fastest
growth year of the past decade, exceeding even the post-recession rebound in
2010.
Continued expansion in Asia/Pacific passenger demand will be facilitated by
capacity growth. Both Indian and Chinese airlines have increased the number
of airport-pairs they serve which has reduced journey times for passengers and
stimulated demand alongside a reduction in fares. Traffic on Asia-Europe
routes has continued to recover strongly, having been affected by terrorism-
related disruption in early 2016.
RPK growth has also been notable in the Middle East in early 2017 at 9.1%,
although this is the slowest rate of growth the region has seen in five years.
The Trump Administration’s ban on personal electronic devices (PEDs), passed
in the second half of March, may be having an impact on traffic along with
some disruption from the proposed ban on inbound travel to the US which is
likely to be affecting sentiment and demand.
Capacity growth within the Middle East has continued to outstrip demand and
passenger load factor (PLF) hit its lowest value of the past decade in
November 2016 and data for 2017 show PLF to have been lower than every
other region with the exception of Africa.
In Europe, RPK growth was 8.8% in the first four months of 2017. This follows
a marked pick-up in growth in the second half of 2016. In April RPK growth was
14% higher than in 2016. However, this was largely due to the timing of Easter
while safety concerns were seemingly on the wane with corresponding
improvements in passenger growth. But the more recent spate of high-profile
attacks in March through to June, may lead to further disruption and
displacement within the region.
In Africa RPKs grew by 8% in April and there is little to suggest this will slow. It
follows a recovery in the trend on the key market to and from Europe.
Nevertheless, conditions in the region’s two largest economies are diverging:
business confidence in Nigeria has risen since late 2016 while political
uncertainty remains heightened in South Africa.
Africa Asia/Pacific Europe LatinAmerica
Mid. East N. America World
-2
0
2
4
6
8
10
12
14
16
18
Jan-17
Feb-17
Mar-17
Apr-17
Source: IATA
% year, RPK
Monthly International Air Passenger Growth
European Tourism in 2017: Trends & Prospects (Q2/2017)
14
In Latin America year-to-date RPK growth was 6.6% – lower than long run
average growth going back to 2003. Recessions in Argentina, Brazil and
Venezuela continue to offset demand growth elsewhere in the region and air
demand is likely to remain sluggish (relative to the long run average)
throughout 2017. Both business and leisure-related travel are suffering. In the
case of Brazil, last summer’s Olympic Games in Rio de Janeiro provided
temporary respite, while recoveries in Venezuela and Argentina remain a
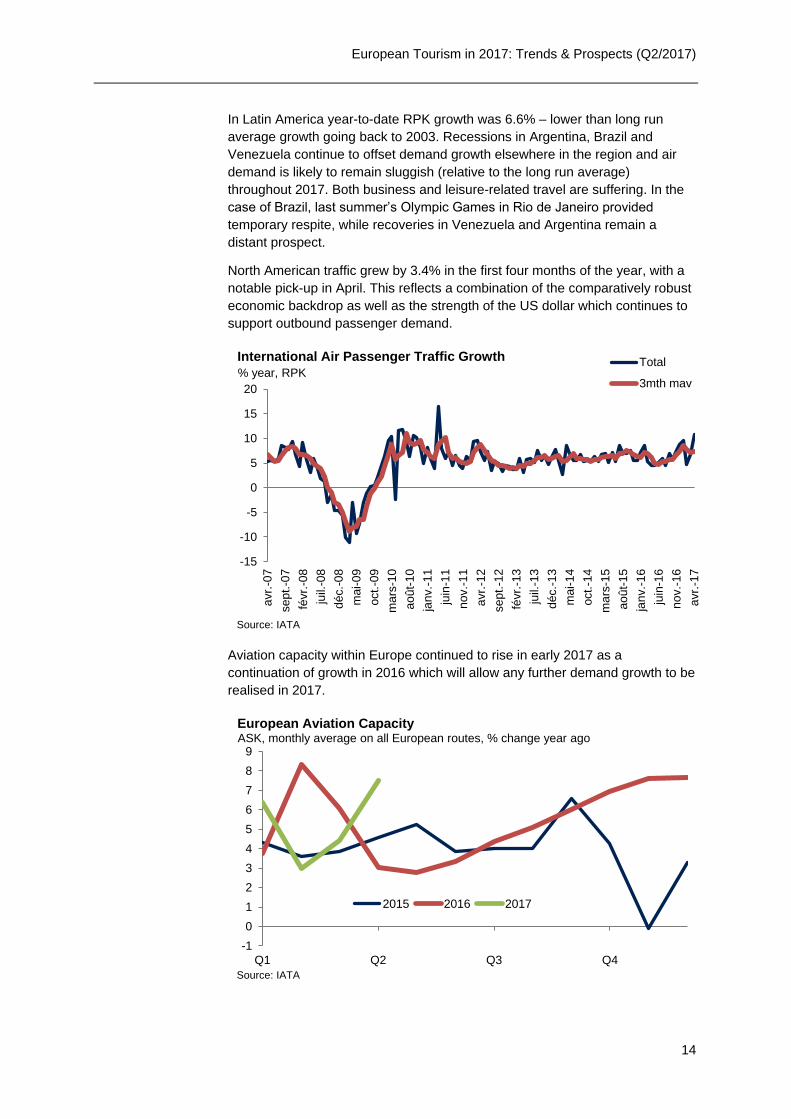
distant prospect.
North American traffic grew by 3.4% in the first four months of the year, with a
notable pick-up in April. This reflects a combination of the comparatively robust
economic backdrop as well as the strength of the US dollar which continues to
support outbound passenger demand.
Aviation capacity within Europe continued to rise in early 2017 as a
continuation of growth in 2016 which will allow any further demand growth to be
realised in 2017.
-15
-10
-5
0
5
10
15
20
avr.
-07
sept.-0
7
févr.
-08
juil.
-08
déc.-
08
mai-09
oct.
-09
mars
-10
août-
10
janv.-
11
juin
-11
nov.-
11
avr.
-12
sept.-1
2
févr.
-13
juil.
-13
déc.-
13
mai-14
oct.
-14
mars
-15
août-
15
janv.-
16
juin
-16
nov.-
16
avr.
-17
Total
3mth mav
Source: IATA
% year, RPK
International Air Passenger Traffic Growth
-1
0
1
2
3
4
5
6
7
8
9
Q1 Q2 Q3 Q4
2015 2016 2017
Source: IATA
ASK, monthly average on all European routes, % change year ago
European Aviation Capacity
European Tourism in 2017: Trends & Prospects (Q2/2017)
15
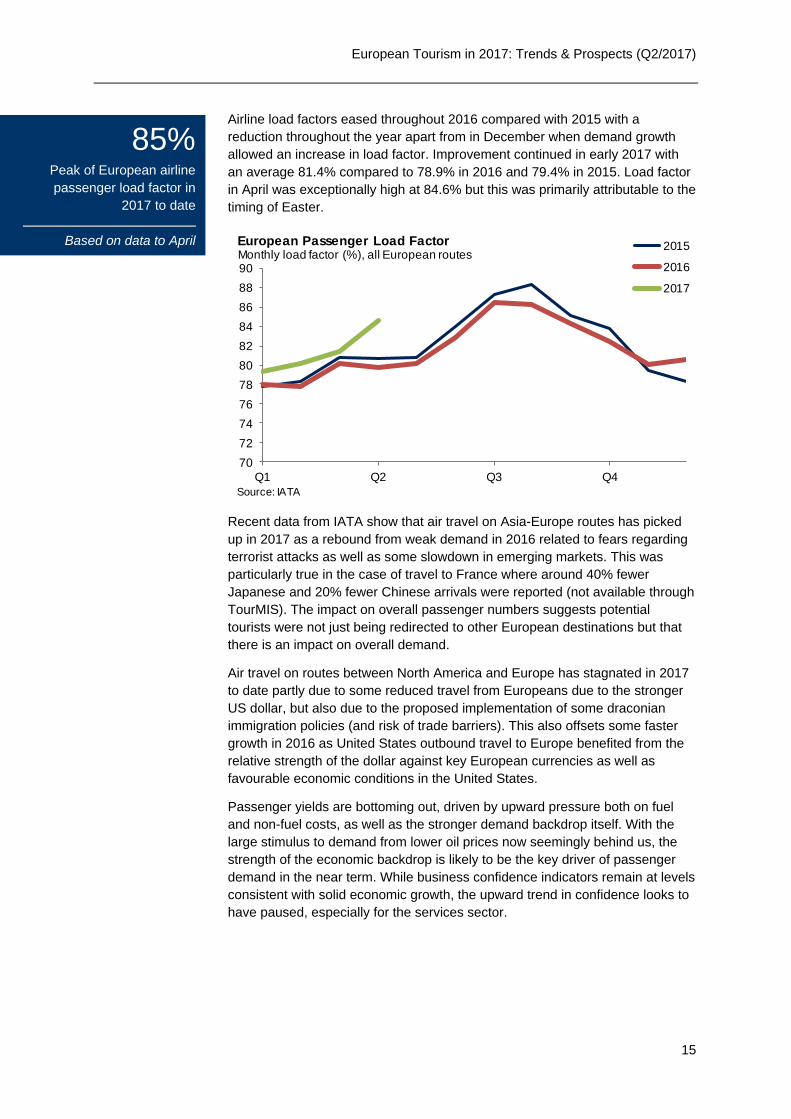
Airline load factors eased throughout 2016 compared with 2015 with a
reduction throughout the year apart from in December when demand growth
allowed an increase in load factor. Improvement continued in early 2017 with
an average 81.4% compared to 78.9% in 2016 and 79.4% in 2015. Load factor
in April was exceptionally high at 84.6% but this was primarily attributable to the
timing of Easter.
Recent data from IATA show that air travel on Asia-Europe routes has picked
up in 2017 as a rebound from weak demand in 2016 related to fears regarding
terrorist attacks as well as some slowdown in emerging markets. This was
particularly true in the case of travel to France where around 40% fewer
Japanese and 20% fewer Chinese arrivals were reported (not available through
TourMIS). The impact on overall passenger numbers suggests potential
tourists were not just being redirected to other European destinations but that
there is an impact on overall demand.
Air travel on routes between North America and Europe has stagnated in 2017
to date partly due to some reduced travel from Europeans due to the stronger
US dollar, but also due to the proposed implementation of some draconian
immigration policies (and risk of trade barriers). This also offsets some faster
growth in 2016 as United States outbound travel to Europe benefited from the
relative strength of the dollar against key European currencies as well as
favourable economic conditions in the United States.
Passenger yields are bottoming out, driven by upward pressure both on fuel
and non-fuel costs, as well as the stronger demand backdrop itself. With the
large stimulus to demand from lower oil prices now seemingly behind us, the
strength of the economic backdrop is likely to be the key driver of passenger
demand in the near term. While business confidence indicators remain at levels
consistent with solid economic growth, the upward trend in confidence looks to
have paused, especially for the services sector.
70
72
74
76
78
80
82
84
86
88
90
Q1 Q2 Q3 Q4
2015
2016
2017
Source: IATA
Monthly load factor (%), all European routesEuropean Passenger Load Factor
85% Peak of European airline
passenger load factor in
2017 to date
Based on data to April
European Tourism in 2017: Trends & Prospects (Q2/2017)
16
3.2 ACCOMMODATION
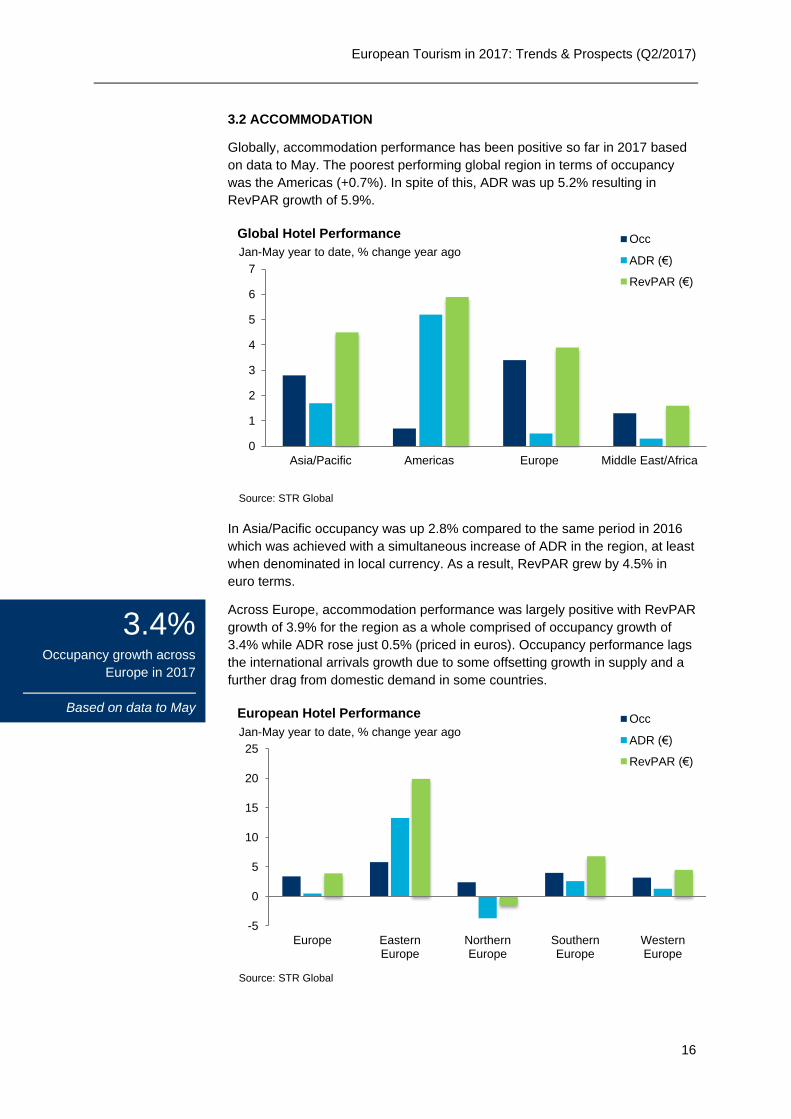
Globally, accommodation performance has been positive so far in 2017 based
on data to May. The poorest performing global region in terms of occupancy
was the Americas (+0.7%). In spite of this, ADR was up 5.2% resulting in
RevPAR growth of 5.9%.
In Asia/Pacific occupancy was up 2.8% compared to the same period in 2016
which was achieved with a simultaneous increase of ADR in the region, at least
when denominated in local currency. As a result, RevPAR grew by 4.5% in
euro terms.
Across Europe, accommodation performance was largely positive with RevPAR
growth of 3.9% for the region as a whole comprised of occupancy growth of
3.4% while ADR rose just 0.5% (priced in euros). Occupancy performance lags
the international arrivals growth due to some offsetting growth in supply and a
further drag from domestic demand in some countries.
0
1
2
3
4
5
6
7
Asia/Pacific Americas Europe Middle East/Africa
Occ
ADR (€)
RevPAR (€)
Source: STR Global
Jan-May year to date, % change year ago
Global Hotel Performance
-5
0
5
10
15
20
25
Europe EasternEurope
NorthernEurope
SouthernEurope
WesternEurope
Occ
ADR (€)
RevPAR (€)
Source: STR Global
Jan-May year to date, % change year ago
European Hotel Performance
3.4% Occupancy growth across
Europe in 2017
Based on data to May
European Tourism in 2017: Trends & Prospects (Q2/2017)
17
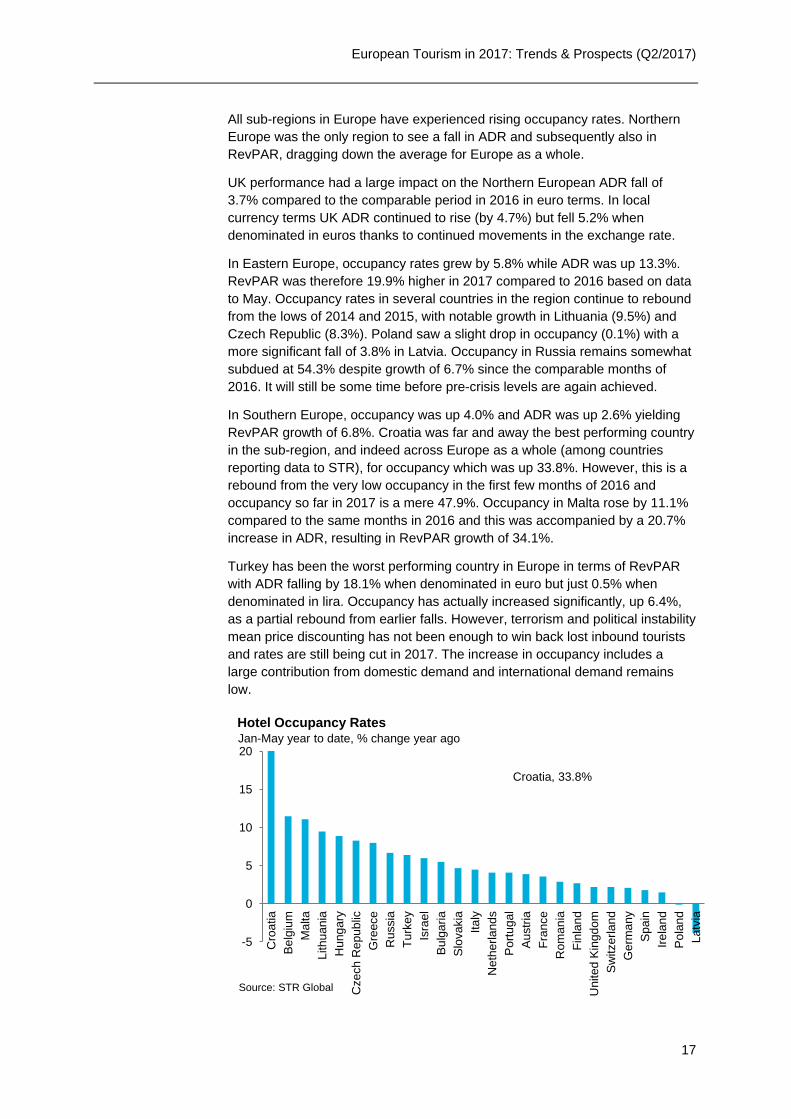
All sub-regions in Europe have experienced rising occupancy rates. Northern
Europe was the only region to see a fall in ADR and subsequently also in
RevPAR, dragging down the average for Europe as a whole.
UK performance had a large impact on the Northern European ADR fall of
3.7% compared to the comparable period in 2016 in euro terms. In local
currency terms UK ADR continued to rise (by 4.7%) but fell 5.2% when
denominated in euros thanks to continued movements in the exchange rate.
In Eastern Europe, occupancy rates grew by 5.8% while ADR was up 13.3%.
RevPAR was therefore 19.9% higher in 2017 compared to 2016 based on data
to May. Occupancy rates in several countries in the region continue to rebound
from the lows of 2014 and 2015, with notable growth in Lithuania (9.5%) and
Czech Republic (8.3%). Poland saw a slight drop in occupancy (0.1%) with a
more significant fall of 3.8% in Latvia. Occupancy in Russia remains somewhat
subdued at 54.3% despite growth of 6.7% since the comparable months of
2016. It will still be some time before pre-crisis levels are again achieved.
In Southern Europe, occupancy was up 4.0% and ADR was up 2.6% yielding
RevPAR growth of 6.8%. Croatia was far and away the best performing country
in the sub-region, and indeed across Europe as a whole (among countries
reporting data to STR), for occupancy which was up 33.8%. However, this is a
rebound from the very low occupancy in the first few months of 2016 and
occupancy so far in 2017 is a mere 47.9%. Occupancy in Malta rose by 11.1%
compared to the same months in 2016 and this was accompanied by a 20.7%
increase in ADR, resulting in RevPAR growth of 34.1%.
Turkey has been the worst performing country in Europe in terms of RevPAR
with ADR falling by 18.1% when denominated in euro but just 0.5% when
denominated in lira. Occupancy has actually increased significantly, up 6.4%,
as a partial rebound from earlier falls. However, terrorism and political instability
mean price discounting has not been enough to win back lost inbound tourists
and rates are still being cut in 2017. The increase in occupancy includes a
large contribution from domestic demand and international demand remains
low.
-5
0
5
10
15
20
Cro
atia
Be
lgiu
m
Malta
Lithuania
Hung
ary
Czech R
epub
lic
Gre
ece
Russia
Turk
ey
Isra
el
Bu
lga
ria
Slo
vakia
Italy
Neth
erl
and
s
Po
rtu
gal
Au
str
ia
Fra
nce
Rom
an
ia
Fin
lan
d
United
Kin
gdom
Sw
itzerla
nd
Germ
any
Sp
ain
Irela
nd
Po
lan
d
Latv
ia
Source: STR Global
Jan-May year to date, % change year ago
Hotel Occupancy Rates
Croatia, 33.8%
European Tourism in 2017: Trends & Prospects (Q2/2017)
18
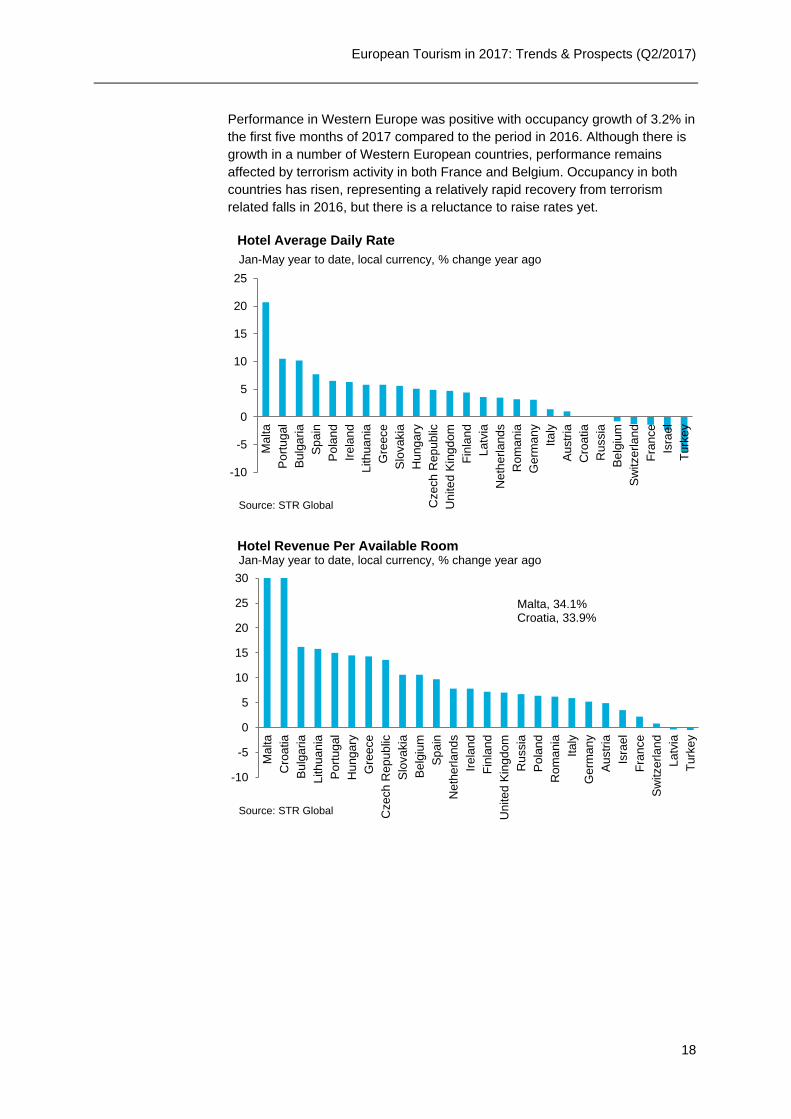
Performance in Western Europe was positive with occupancy growth of 3.2% in
the first five months of 2017 compared to the period in 2016. Although there is
growth in a number of Western European countries, performance remains
affected by terrorism activity in both France and Belgium. Occupancy in both
countries has risen, representing a relatively rapid recovery from terrorism
related falls in 2016, but there is a reluctance to raise rates yet.
-10
-5
0
5
10
15
20
25
Malta
Po
rtu
gal
Bu
lga
ria
Sp
ain
Po
lan
d
Irela
nd
Lithuan
ia
Gre
ece
Slo
vakia
Hung
ary
Czech R
epub
lic
United
Kin
gdom
Fin
lan
d
Latv
ia
Neth
erl
and
s
Rom
an
ia
Germ
an
y
Italy
Au
str
ia
Cro
atia
Russia
Be
lgiu
m
Sw
itzerla
nd
Fra
nce
Isra
el
Turk
ey
Source: STR Global
Jan-May year to date, local currency, % change year ago
Hotel Average Daily Rate
-10
-5
0
5
10
15
20
25
30
Malta
Cro
atia
Bu
lga
ria
Lithuania
Po
rtu
gal
Hung
ary
Gre
ece
Czech R
epub
lic
Slo
vakia
Be
lgiu
m
Sp
ain
Neth
erl
and
s
Irela
nd
Fin
lan
d
United
Kin
gdom
Russia
Po
lan
d
Rom
an
ia
Italy
Germ
any
Au
str
ia
Isra
el
Fra
nce
Sw
itzerla
nd
Latv
ia
Turk
ey
Source: STR Global
Jan-May year to date, local currency, % change year agoHotel Revenue Per Available Room
Malta, 34.1%Croatia, 33.9%
European Tourism in 2017: Trends & Prospects (Q2/2017)
19
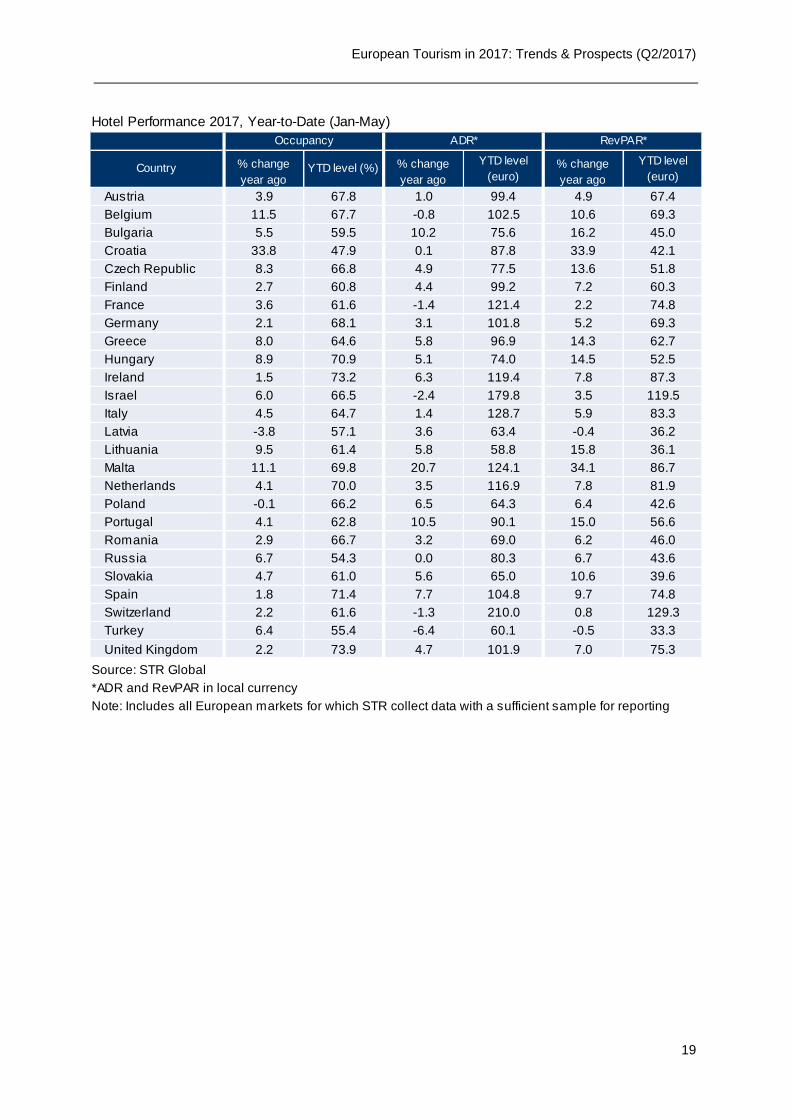
Austria 3.9 67.8 1.0 99.4 4.9 67.4
Belgium 11.5 67.7 -0.8 102.5 10.6 69.3
Bulgaria 5.5 59.5 10.2 75.6 16.2 45.0
Croatia 33.8 47.9 0.1 87.8 33.9 42.1
Czech Republic 8.3 66.8 4.9 77.5 13.6 51.8
Finland 2.7 60.8 4.4 99.2 7.2 60.3
France 3.6 61.6 -1.4 121.4 2.2 74.8
Germany 2.1 68.1 3.1 101.8 5.2 69.3
Greece 8.0 64.6 5.8 96.9 14.3 62.7
Hungary 8.9 70.9 5.1 74.0 14.5 52.5
Ireland 1.5 73.2 6.3 119.4 7.8 87.3
Israel 6.0 66.5 -2.4 179.8 3.5 119.5
Italy 4.5 64.7 1.4 128.7 5.9 83.3
Latvia -3.8 57.1 3.6 63.4 -0.4 36.2
Lithuania 9.5 61.4 5.8 58.8 15.8 36.1
Malta 11.1 69.8 20.7 124.1 34.1 86.7
Netherlands 4.1 70.0 3.5 116.9 7.8 81.9
Poland -0.1 66.2 6.5 64.3 6.4 42.6
Portugal 4.1 62.8 10.5 90.1 15.0 56.6
Romania 2.9 66.7 3.2 69.0 6.2 46.0
Russia 6.7 54.3 0.0 80.3 6.7 43.6
Slovakia 4.7 61.0 5.6 65.0 10.6 39.6
Spain 1.8 71.4 7.7 104.8 9.7 74.8
Switzerland 2.2 61.6 -1.3 210.0 0.8 129.3
Turkey 6.4 55.4 -6.4 60.1 -0.5 33.3
United Kingdom 2.2 73.9 4.7 101.9 7.0 75.3
Source: STR Global
Note: Includes all European markets for which STR collect data with a sufficient sample for reporting
YTD level
(euro)Country
*ADR and RevPAR in local currency
Hotel Performance 2017, Year-to-Date (Jan-May)
Occupancy ADR* RevPAR*
% change
year ago
% change
year ago
% change
year agoYTD level (%)
YTD level
(euro)
European Tourism in 2017: Trends & Prospects (Q2/2017)
20
4. SPECIAL FEATURE
POTENTIAL IMPACTS OF TERRORISM IN 2017
2016 saw a spate of terrorist attacks across a number of European cities with
spillover impacts onto regional tourism performance due to heightened security
concerns. A partial rebound was expected in 2017 as concerns eased following
the usual pattern of recovery from disruptive events. However, more recent
activity may undermine this recovery for destinations across the region.
The perceived risk to traveller safety is a crucial factor driving the overall impact
on specific destinations and the wider region. Prior analysis showed that cities
which were hit by multiple attacks and over a longer period of time were
associated with a higher perceived risk and larger falls in travel. For example,
Brussels suffered a larger fall in demand than Munich in 2016.
Perceived safety risks are not limited to just the affected cities as travel to other
destinations within those countries were also affected in 2016. Wider impacts
were felt across the region and some continued impact is expected in 2017.
For Europe as a whole, two distinct impacts have been evident on travel:
displaced travel provides a benefit to some other destinations; while a
proportion of potential travellers have avoided European destinations
altogether.
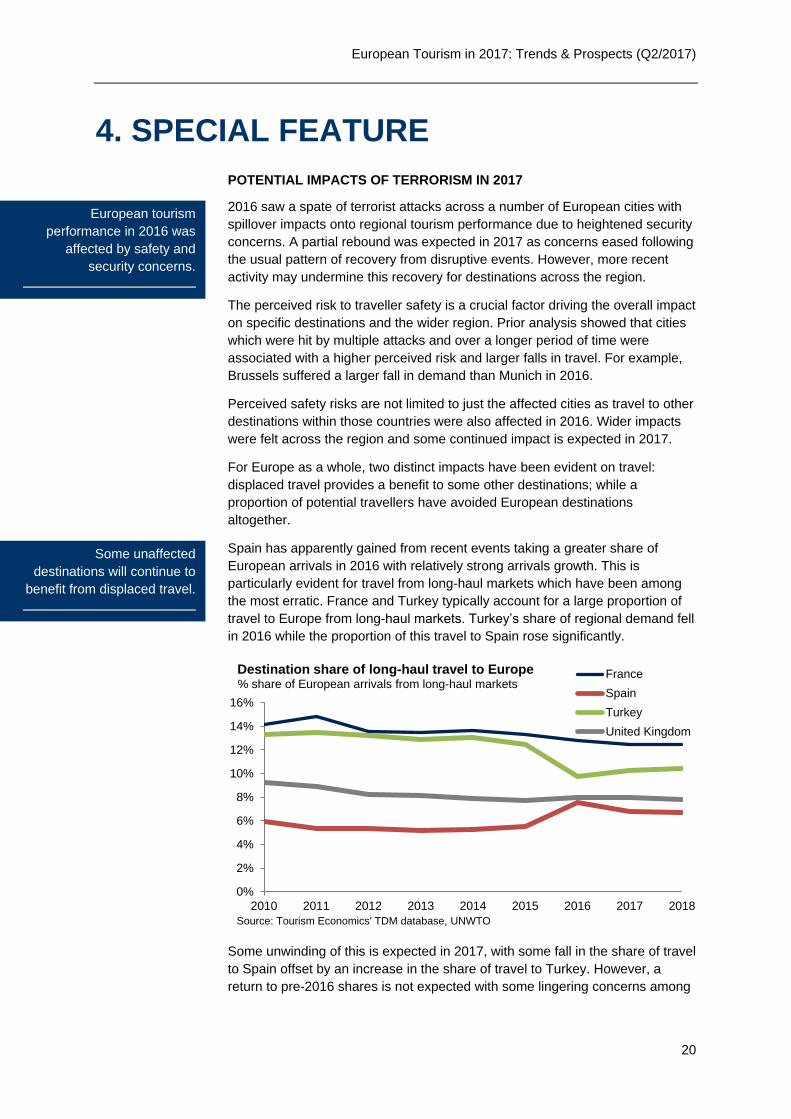
Spain has apparently gained from recent events taking a greater share of
European arrivals in 2016 with relatively strong arrivals growth. This is
particularly evident for travel from long-haul markets which have been among
the most erratic. France and Turkey typically account for a large proportion of
travel to Europe from long-haul markets. Turkey’s share of regional demand fell
in 2016 while the proportion of this travel to Spain rose significantly.
Some unwinding of this is expected in 2017, with some fall in the share of travel
to Spain offset by an increase in the share of travel to Turkey. However, a
return to pre-2016 shares is not expected with some lingering concerns among
0%
2%
4%
6%
8%
10%
12%
14%
16%
2010 2011 2012 2013 2014 2015 2016 2017 2018
France
Spain
Turkey
United Kingdom
Source: Tourism Economics' TDM database, UNWTO
% share of European arrivals from long-haul markets
Destination share of long-haul travel to Europe
European tourism
performance in 2016 was
affected by safety and
security concerns.
Some unaffected
destinations will continue to
benefit from displaced travel.
European Tourism in 2017: Trends & Prospects (Q2/2017)
21
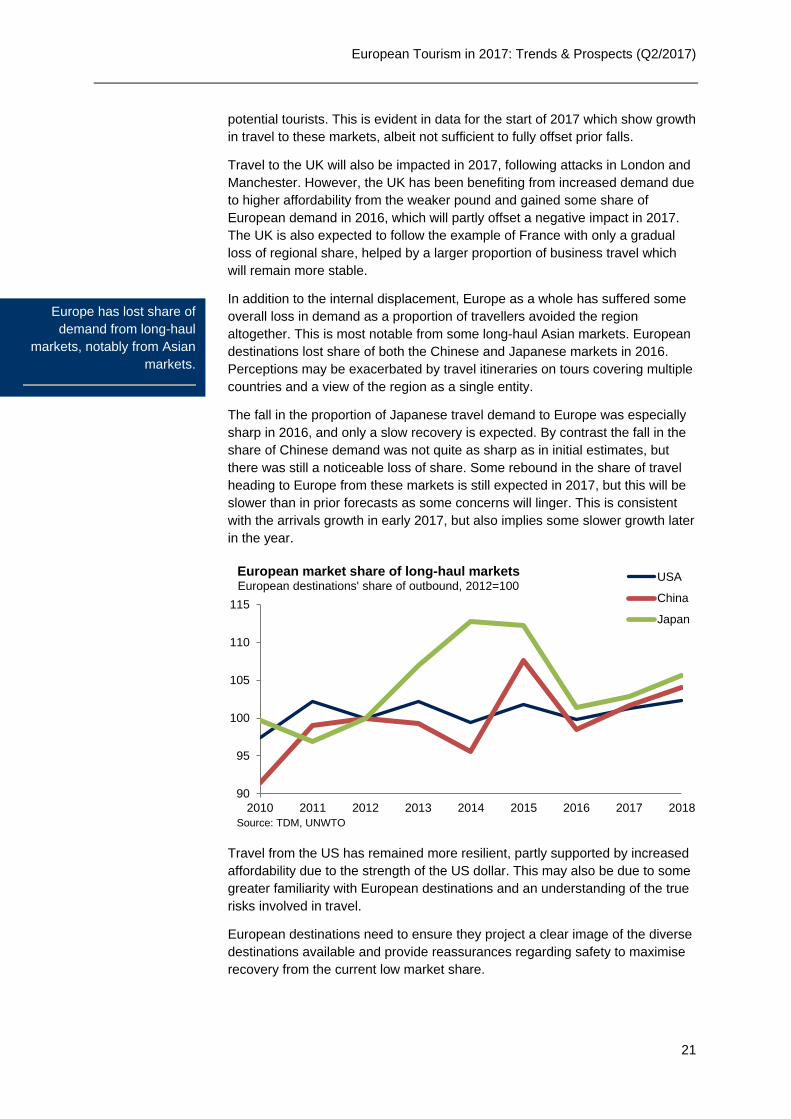
potential tourists. This is evident in data for the start of 2017 which show growth
in travel to these markets, albeit not sufficient to fully offset prior falls.
Travel to the UK will also be impacted in 2017, following attacks in London and
Manchester. However, the UK has been benefiting from increased demand due
to higher affordability from the weaker pound and gained some share of
European demand in 2016, which will partly offset a negative impact in 2017.
The UK is also expected to follow the example of France with only a gradual
loss of regional share, helped by a larger proportion of business travel which
will remain more stable.
In addition to the internal displacement, Europe as a whole has suffered some
overall loss in demand as a proportion of travellers avoided the region
altogether. This is most notable from some long-haul Asian markets. European
destinations lost share of both the Chinese and Japanese markets in 2016.
Perceptions may be exacerbated by travel itineraries on tours covering multiple
countries and a view of the region as a single entity.
The fall in the proportion of Japanese travel demand to Europe was especially
sharp in 2016, and only a slow recovery is expected. By contrast the fall in the
share of Chinese demand was not quite as sharp as in initial estimates, but
there was still a noticeable loss of share. Some rebound in the share of travel
heading to Europe from these markets is still expected in 2017, but this will be
slower than in prior forecasts as some concerns will linger. This is consistent
with the arrivals growth in early 2017, but also implies some slower growth later
in the year.
Travel from the US has remained more resilient, partly supported by increased
affordability due to the strength of the US dollar. This may also be due to some
greater familiarity with European destinations and an understanding of the true
risks involved in travel.
European destinations need to ensure they project a clear image of the diverse
destinations available and provide reassurances regarding safety to maximise
recovery from the current low market share.
90
95
100
105
110
115
2010 2011 2012 2013 2014 2015 2016 2017 2018
USA
China
Japan
Source: TDM, UNWTO
European destinations' share of outbound, 2012=100
European market share of long-haul markets
Europe has lost share of
demand from long-haul
markets, notably from Asian
markets.
European Tourism in 2017: Trends & Prospects (Q2/2017)
22
TRAVEL DISRUPTION DUE TO QATAR BLOCKADE
Global travel in 2017 is also being disrupted by the blockade of travel to Qatar
due to political tensions, including some small impact on travel to Europe. This
will come through travel flows via the Gulf region, and particularly from Asian
markets, adding to potential security concerns from terrorism.
The blockade affects all travel to Qatar by land, some regional air travel, and
crucially limits the airspace available for flights to the country. The immediate
consequence of this is that flights to, or via, Qatar involve longer travel times. A
reduction in capacity may ultimately increase prices on these routes. Higher
travel times and prices will both influence passenger demand.
The amount of European demand potentially affected by the blockade is
relatively small as around one-fifth of travel from Asia to Europe is via hubs in
the Gulf region, according to data from IATA. Within that, around 5% of travel
from Asia to Europe comes via Qatar itself as a hub.
Any reduction in Asian travel to Europe via Qatar can be partly absorbed by
increases on other routes, but some proportion will also be deferred or even
cancelled. The duration of the blockade will affect the impact and a relatively
swift resolution remains part of Tourism Economics’ central outlook including
minimal impact on hub operations, but some longer effects evident on travel
within the Middle East region.
The travel volumes which are potentially affected are small, but events could
undermine some of the expected growth from the largest Asian markets.
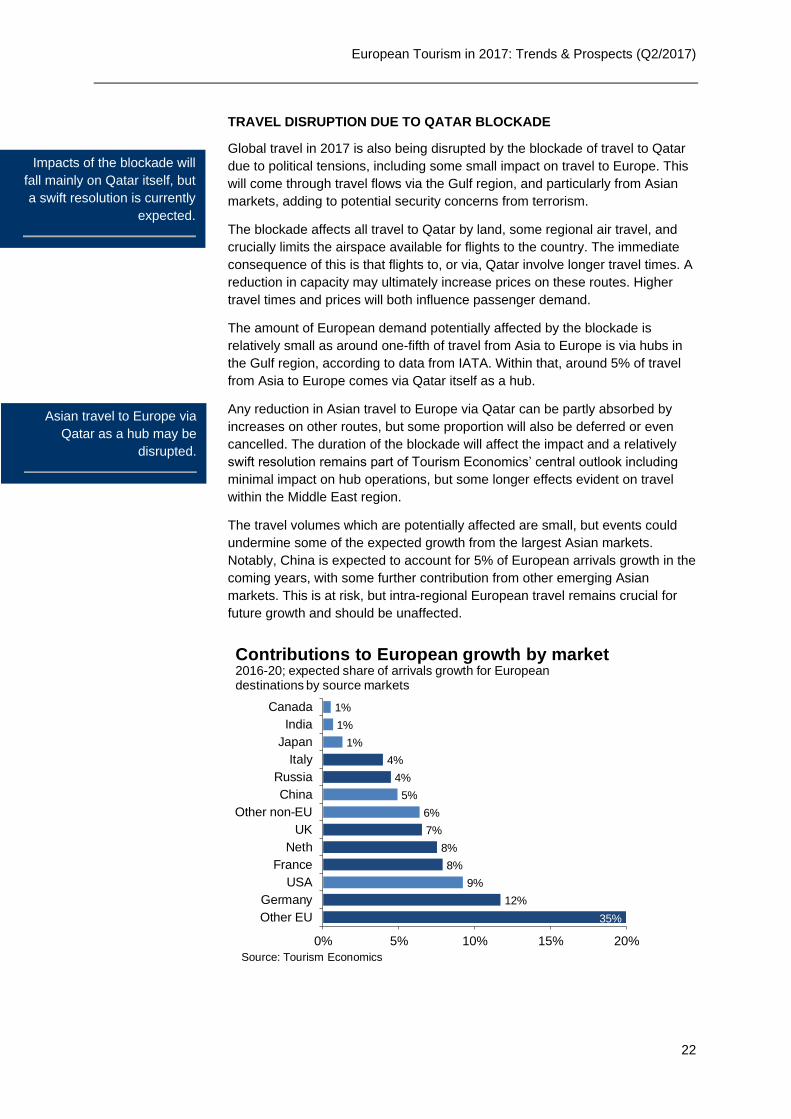
Notably, China is expected to account for 5% of European arrivals growth in the
coming years, with some further contribution from other emerging Asian
markets. This is at risk, but intra-regional European travel remains crucial for
future growth and should be unaffected.
12%
9%
8%
8%
7%
6%
5%
4%
4%
1%
1%
1%
0% 5% 10% 15% 20%
Other EU
Germany
USA
France
Neth
UK
Other non-EU
China
Russia
Italy
Japan
India
Canada
Contributions to European growth by market2016-20; expected share of arrivals growth for European destinations by source markets
Source: Tourism Economics
35%
Impacts of the blockade will
fall mainly on Qatar itself, but
a swift resolution is currently
expected.
Asian travel to Europe via
Qatar as a hub may be
disrupted.
European Tourism in 2017: Trends & Prospects (Q2/2017)
23
5. KEY SOURCE MARKET
PERFORMANCE
GROWTH CONTINUES INTO 2017
European travel demand continues to grow across the majority of destinations and
from a range of source markets.
Intra-European travel remains crucial for future growth.
Recent spate of high-profile terror attacks in Europe a near-term concern.
Trends discussed in this section in some cases relate to the first five months of the year although
actual coverage varies by destination. For the majority of countries April will be the latest available
data point. Further detailed monthly data for origin and destination, including absolute values, can be
obtained from TourMIS, http://tourmis.info.
5.1 KEY INTRA-EUROPEAN MARKETS
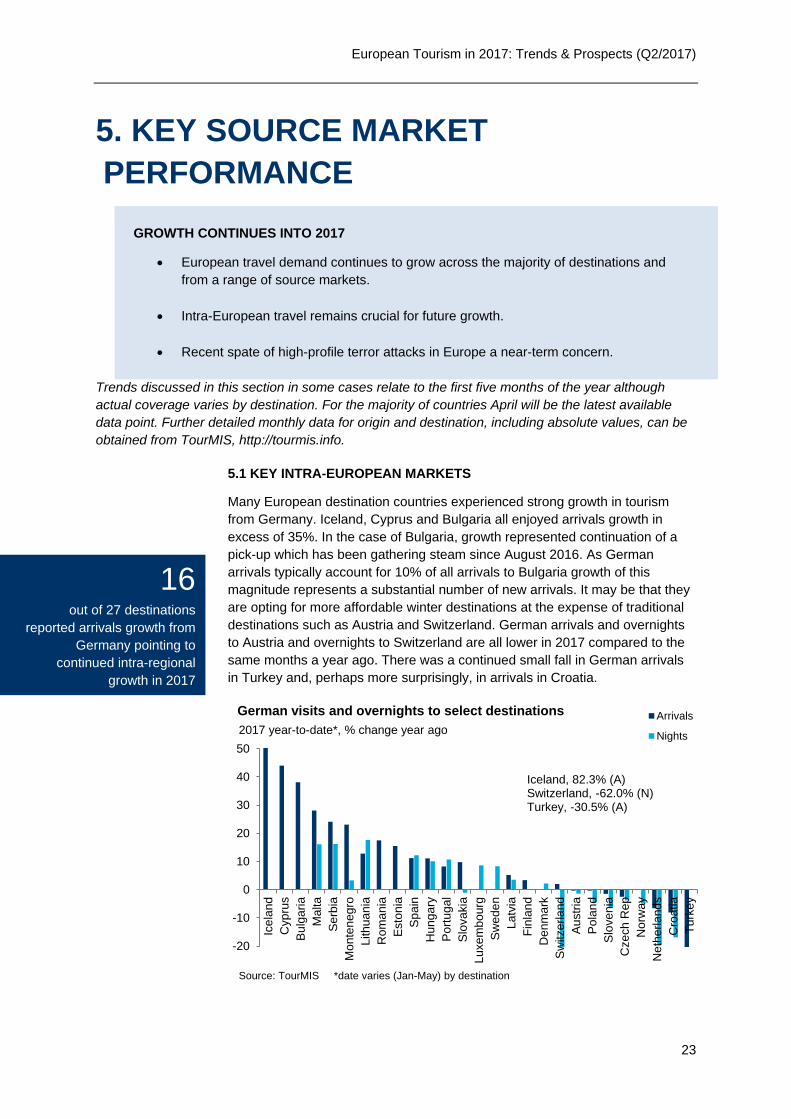
Many European destination countries experienced strong growth in tourism
from Germany. Iceland, Cyprus and Bulgaria all enjoyed arrivals growth in
excess of 35%. In the case of Bulgaria, growth represented continuation of a
pick-up which has been gathering steam since August 2016. As German
arrivals typically account for 10% of all arrivals to Bulgaria growth of this
magnitude represents a substantial number of new arrivals. It may be that they
are opting for more affordable winter destinations at the expense of traditional
destinations such as Austria and Switzerland. German arrivals and overnights
to Austria and overnights to Switzerland are all lower in 2017 compared to the
same months a year ago. There was a continued small fall in German arrivals
in Turkey and, perhaps more surprisingly, in arrivals in Croatia.
-20
-10
0
10
20
30
40
50
Icela
nd
Cypru
s
Bu
lga
ria
Malta
Se
rbia
Mo
nte
negro
Lithuania
Rom
an
ia
Esto
nia
Sp
ain
Hung
ary
Po
rtu
gal
Slo
vakia
Luxem
bourg
Sw
ede
n
Latv
ia
Fin
lan
d
Denm
ark
Sw
itzerla
nd
Au
str
ia
Po
lan
d
Slo
ven
ia
Czech R
ep
Norw
ay
Neth
erl
and
s
Cro
atia
Turk
ey
Arrivals
Nights
Source: TourMIS *date varies (Jan-May) by destination
2017 year-to-date*, % change year ago
German visits and overnights to select destinations
Iceland, 82.3% (A)Switzerland, -62.0% (N)Turkey, -30.5% (A)
16 out of 27 destinations
reported arrivals growth from
Germany pointing to
continued intra-regional
growth in 2017
European Tourism in 2017: Trends & Prospects (Q2/2017)
24
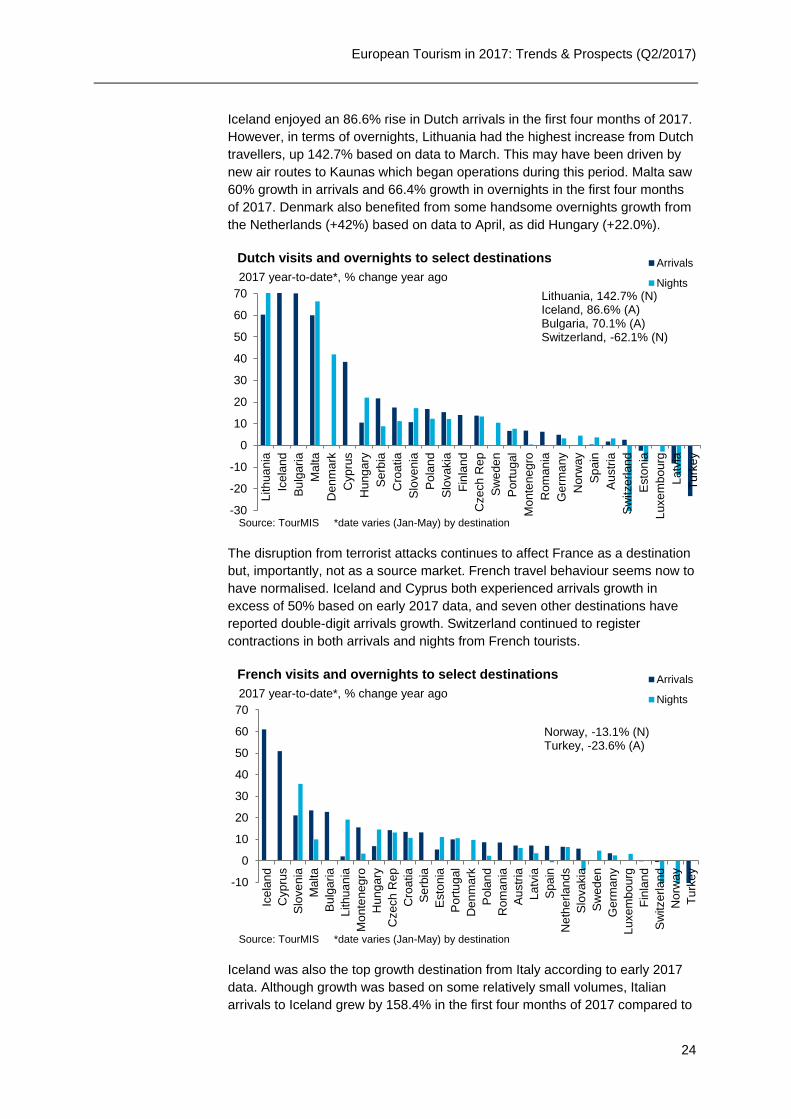
Iceland enjoyed an 86.6% rise in Dutch arrivals in the first four months of 2017.
However, in terms of overnights, Lithuania had the highest increase from Dutch
travellers, up 142.7% based on data to March. This may have been driven by
new air routes to Kaunas which began operations during this period. Malta saw
60% growth in arrivals and 66.4% growth in overnights in the first four months
of 2017. Denmark also benefited from some handsome overnights growth from
the Netherlands (+42%) based on data to April, as did Hungary (+22.0%).
The disruption from terrorist attacks continues to affect France as a destination
but, importantly, not as a source market. French travel behaviour seems now to
have normalised. Iceland and Cyprus both experienced arrivals growth in
excess of 50% based on early 2017 data, and seven other destinations have
reported double-digit arrivals growth. Switzerland continued to register
contractions in both arrivals and nights from French tourists.
Iceland was also the top growth destination from Italy according to early 2017
data. Although growth was based on some relatively small volumes, Italian
arrivals to Iceland grew by 158.4% in the first four months of 2017 compared to
-30
-20
-10
0
10
20
30
40
50
60
70
Lithuania
Icela
nd
Bu
lga
ria
Malta
Denm
ark
Cypru
s
Hung
ary
Se
rbia
Cro
atia
Slo
ven
ia
Po
lan
d
Slo
vakia
Fin
lan
d
Czech R
ep
Sw
ede
n
Po
rtu
gal
Monte
negro
Rom
an
ia
Germ
any
Norw
ay
Sp
ain
Au
str
ia
Sw
itzerla
nd
Esto
nia
Luxem
bourg
Latv
ia
Turk
ey
Arrivals
Nights
Source: TourMIS *date varies (Jan-May) by destination
2017 year-to-date*, % change year ago
Dutch visits and overnights to select destinations
Lithuania, 142.7% (N)Iceland, 86.6% (A)Bulgaria, 70.1% (A)Switzerland, -62.1% (N)
-10
0
10
20
30
40
50
60
70
Icela
nd
Cypru
s
Slo
ven
ia
Malta
Bu
lga
ria
Lithuania
Monte
negro
Hung
ary
Czech R
ep
Cro
atia
Se
rbia
Esto
nia
Po
rtu
gal
Denm
ark
Po
lan
d
Rom
an
ia
Au
str
ia
Latv
ia
Sp
ain
Neth
erl
and
s
Slo
vakia
Sw
ede
n
Germ
any
Luxem
bourg
Fin
lan
d
Sw
itzerla
nd
Norw
ay
Turk
ey
Arrivals
Nights
Source: TourMIS *date varies (Jan-May) by destination
2017 year-to-date*, % change year ago
French visits and overnights to select destinations
Norway, -13.1% (N)Turkey, -23.6% (A)
European Tourism in 2017: Trends & Prospects (Q2/2017)
25
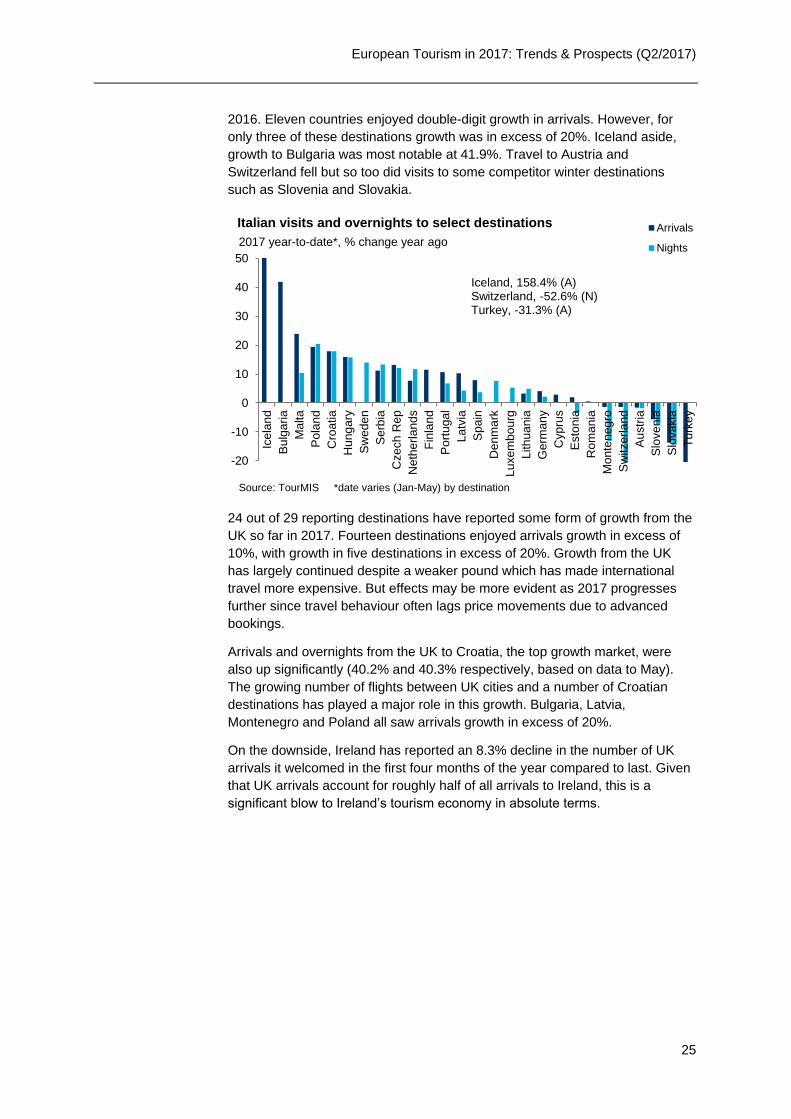
2016. Eleven countries enjoyed double-digit growth in arrivals. However, for
only three of these destinations growth was in excess of 20%. Iceland aside,
growth to Bulgaria was most notable at 41.9%. Travel to Austria and
Switzerland fell but so too did visits to some competitor winter destinations
such as Slovenia and Slovakia.
24 out of 29 reporting destinations have reported some form of growth from the
UK so far in 2017. Fourteen destinations enjoyed arrivals growth in excess of
10%, with growth in five destinations in excess of 20%. Growth from the UK
has largely continued despite a weaker pound which has made international
travel more expensive. But effects may be more evident as 2017 progresses
further since travel behaviour often lags price movements due to advanced
bookings.
Arrivals and overnights from the UK to Croatia, the top growth market, were
also up significantly (40.2% and 40.3% respectively, based on data to May).
The growing number of flights between UK cities and a number of Croatian
destinations has played a major role in this growth. Bulgaria, Latvia,
Montenegro and Poland all saw arrivals growth in excess of 20%.
On the downside, Ireland has reported an 8.3% decline in the number of UK
arrivals it welcomed in the first four months of the year compared to last. Given
that UK arrivals account for roughly half of all arrivals to Ireland, this is a
significant blow to Ireland’s tourism economy in absolute terms.
-20
-10
0
10
20
30
40
50Ic
ela
nd
Bu
lga
ria
Ma
lta
Po
lan
d
Cro
atia
Hun
ga
ry
Sw
ed
en
Se
rbia
Czech
Re
p
Neth
erl
and
s
Fin
lan
d
Po
rtu
gal
La
tvia
Sp
ain
Denm
ark
Luxem
bo
urg
Lithua
nia
Germ
an
y
Cyp
rus
Esto
nia
Rom
an
ia
Monte
ne
gro
Sw
itzerla
nd
Au
str
ia
Slo
ve
nia
Slo
va
kia
Turk
ey
Arrivals
Nights
Source: TourMIS *date varies (Jan-May) by destination
2017 year-to-date*, % change year ago
Italian visits and overnights to select destinations
Iceland, 158.4% (A)Switzerland, -52.6% (N)Turkey, -31.3% (A)
European Tourism in 2017: Trends & Prospects (Q2/2017)
26
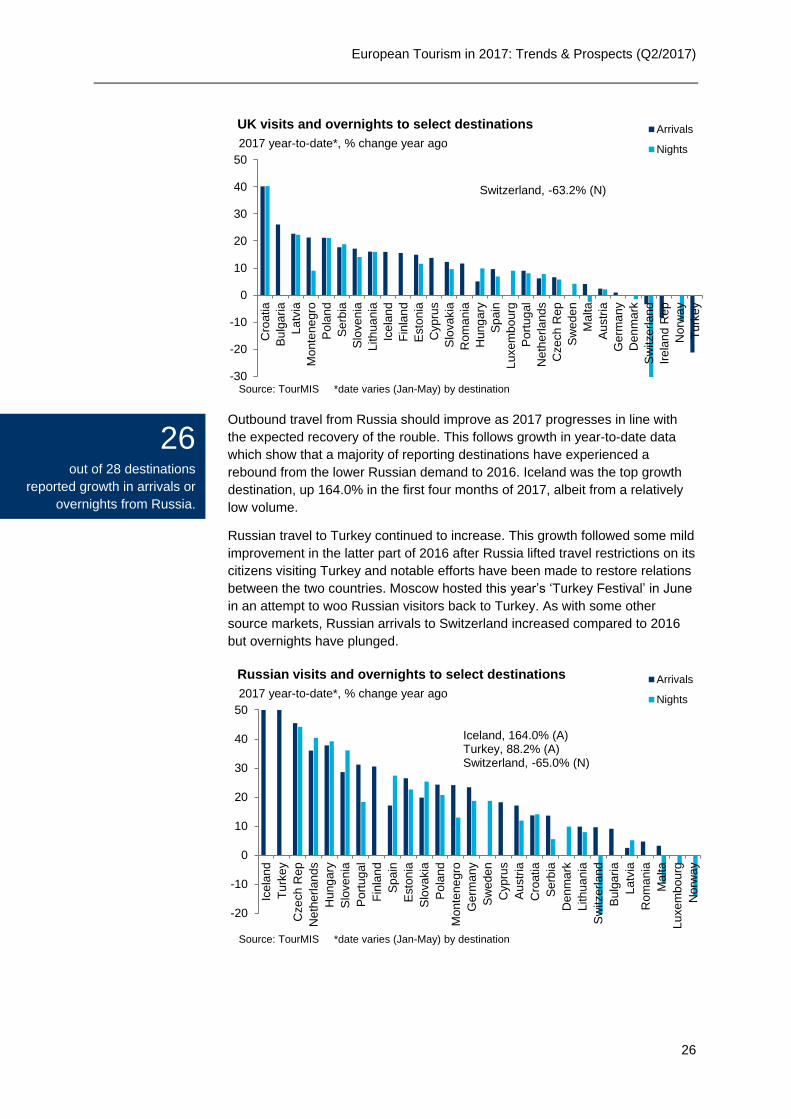
Outbound travel from Russia should improve as 2017 progresses in line with
the expected recovery of the rouble. This follows growth in year-to-date data
which show that a majority of reporting destinations have experienced a
rebound from the lower Russian demand to 2016. Iceland was the top growth
destination, up 164.0% in the first four months of 2017, albeit from a relatively
low volume.
Russian travel to Turkey continued to increase. This growth followed some mild
improvement in the latter part of 2016 after Russia lifted travel restrictions on its
citizens visiting Turkey and notable efforts have been made to restore relations
between the two countries. Moscow hosted this year’s ‘Turkey Festival’ in June
in an attempt to woo Russian visitors back to Turkey. As with some other
source markets, Russian arrivals to Switzerland increased compared to 2016
but overnights have plunged.
-30
-20
-10
0
10
20
30
40
50
Cro
atia
Bu
lga
ria
La
tvia
Mo
nte
ne
gro
Po
lan
d
Se
rbia
Slo
ve
nia
Lith
ua
nia
Ice
lan
d
Fin
lan
d
Esto
nia
Cyp
rus
Slo
va
kia
Ro
ma
nia
Hu
ng
ary
Sp
ain
Lu
xe
mb
ourg
Po
rtu
gal
Ne
the
rla
nd
s
Cze
ch
Re
p
Sw
ed
en
Ma
lta
Au
str
ia
Ge
rma
ny
De
nm
ark
Sw
itze
rla
nd
Ire
lan
d R
ep
No
rwa
y
Tu
rke
y
Arrivals
Nights
Source: TourMIS *date varies (Jan-May) by destination
2017 year-to-date*, % change year ago
UK visits and overnights to select destinations
Switzerland, -63.2% (N)
-20
-10
0
10
20
30
40
50
Icela
nd
Turk
ey
Czech R
ep
Neth
erl
and
s
Hung
ary
Slo
ven
ia
Po
rtu
gal
Fin
lan
d
Sp
ain
Esto
nia
Slo
vakia
Po
lan
d
Monte
negro
Germ
any
Sw
ede
n
Cypru
s
Au
str
ia
Cro
atia
Se
rbia
Denm
ark
Lithuania
Sw
itzerla
nd
Bu
lga
ria
Latv
ia
Rom
an
ia
Malta
Luxem
bourg
Norw
ay
Arrivals
Nights
Source: TourMIS *date varies (Jan-May) by destination
2017 year-to-date*, % change year ago
Russian visits and overnights to select destinations
Iceland, 164.0% (A)Turkey, 88.2% (A)Switzerland, -65.0% (N)
26 out of 28 destinations
reported growth in arrivals or
overnights from Russia.
European Tourism in 2017: Trends & Prospects (Q2/2017)
27
5.2 NON-EUROPEAN MARKETS
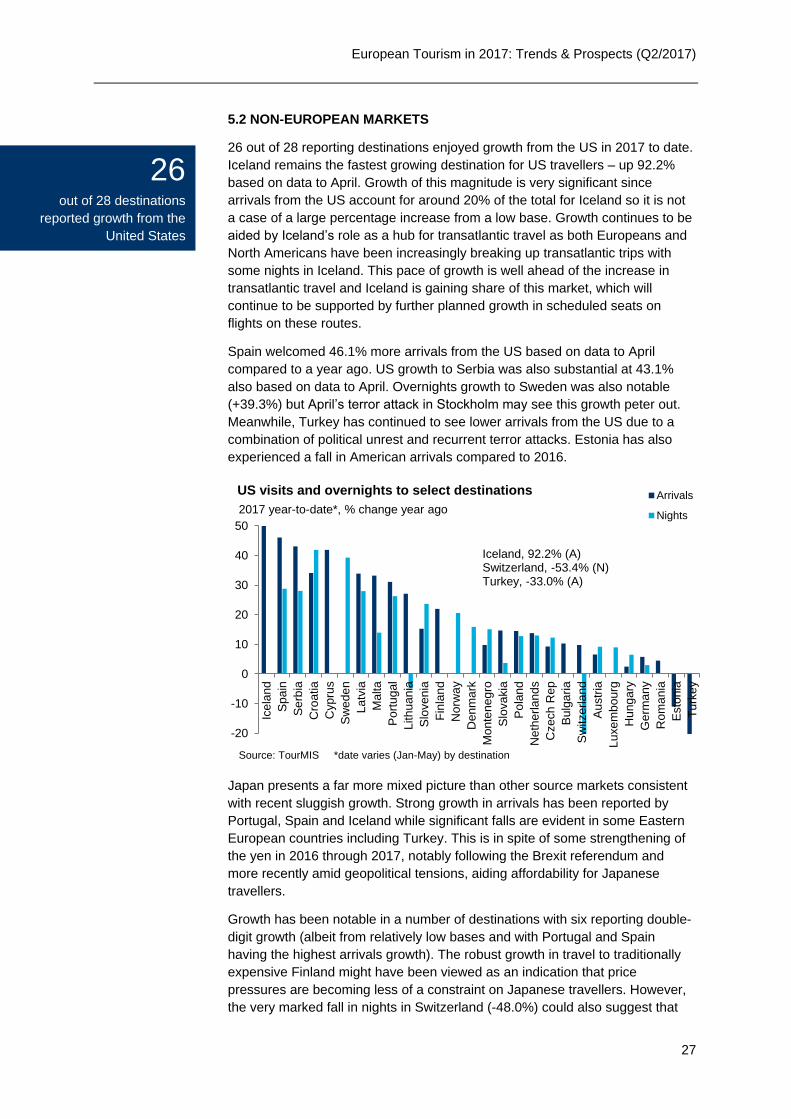
26 out of 28 reporting destinations enjoyed growth from the US in 2017 to date.
Iceland remains the fastest growing destination for US travellers – up 92.2%
based on data to April. Growth of this magnitude is very significant since
arrivals from the US account for around 20% of the total for Iceland so it is not
a case of a large percentage increase from a low base. Growth continues to be
aided by Iceland’s role as a hub for transatlantic travel as both Europeans and
North Americans have been increasingly breaking up transatlantic trips with
some nights in Iceland. This pace of growth is well ahead of the increase in
transatlantic travel and Iceland is gaining share of this market, which will
continue to be supported by further planned growth in scheduled seats on
flights on these routes.
Spain welcomed 46.1% more arrivals from the US based on data to April
compared to a year ago. US growth to Serbia was also substantial at 43.1%
also based on data to April. Overnights growth to Sweden was also notable
(+39.3%) but April’s terror attack in Stockholm may see this growth peter out.
Meanwhile, Turkey has continued to see lower arrivals from the US due to a
combination of political unrest and recurrent terror attacks. Estonia has also
experienced a fall in American arrivals compared to 2016.
Japan presents a far more mixed picture than other source markets consistent
with recent sluggish growth. Strong growth in arrivals has been reported by
Portugal, Spain and Iceland while significant falls are evident in some Eastern
European countries including Turkey. This is in spite of some strengthening of
the yen in 2016 through 2017, notably following the Brexit referendum and
more recently amid geopolitical tensions, aiding affordability for Japanese
travellers.
Growth has been notable in a number of destinations with six reporting double-
digit growth (albeit from relatively low bases and with Portugal and Spain
having the highest arrivals growth). The robust growth in travel to traditionally
expensive Finland might have been viewed as an indication that price
pressures are becoming less of a constraint on Japanese travellers. However,
the very marked fall in nights in Switzerland (-48.0%) could also suggest that
-20
-10
0
10
20
30
40
50
Icela
nd
Sp
ain
Se
rbia
Cro
atia
Cypru
s
Sw
ede
n
Latv
ia
Malta
Po
rtu
gal
Lithuania
Slo
ven
ia
Fin
lan
d
Norw
ay
Denm
ark
Monte
negro
Slo
vakia
Po
lan
d
Neth
erl
and
s
Czech R
ep
Bu
lga
ria
Sw
itzerla
nd
Au
str
ia
Luxem
bourg
Hung
ary
Germ
any
Rom
an
ia
Esto
nia
Turk
ey
Arrivals
Nights
Source: TourMIS *date varies (Jan-May) by destination
2017 year-to-date*, % change year ago
US visits and overnights to select destinations
Iceland, 92.2% (A)Switzerland, -53.4% (N)Turkey, -33.0% (A)
26 out of 28 destinations
reported growth from the
United States
European Tourism in 2017: Trends & Prospects (Q2/2017)
28
some price pressures remain. It is also notable that whilst arrivals in Spain from
Japan were up 42.6%, overnights still fell slightly.
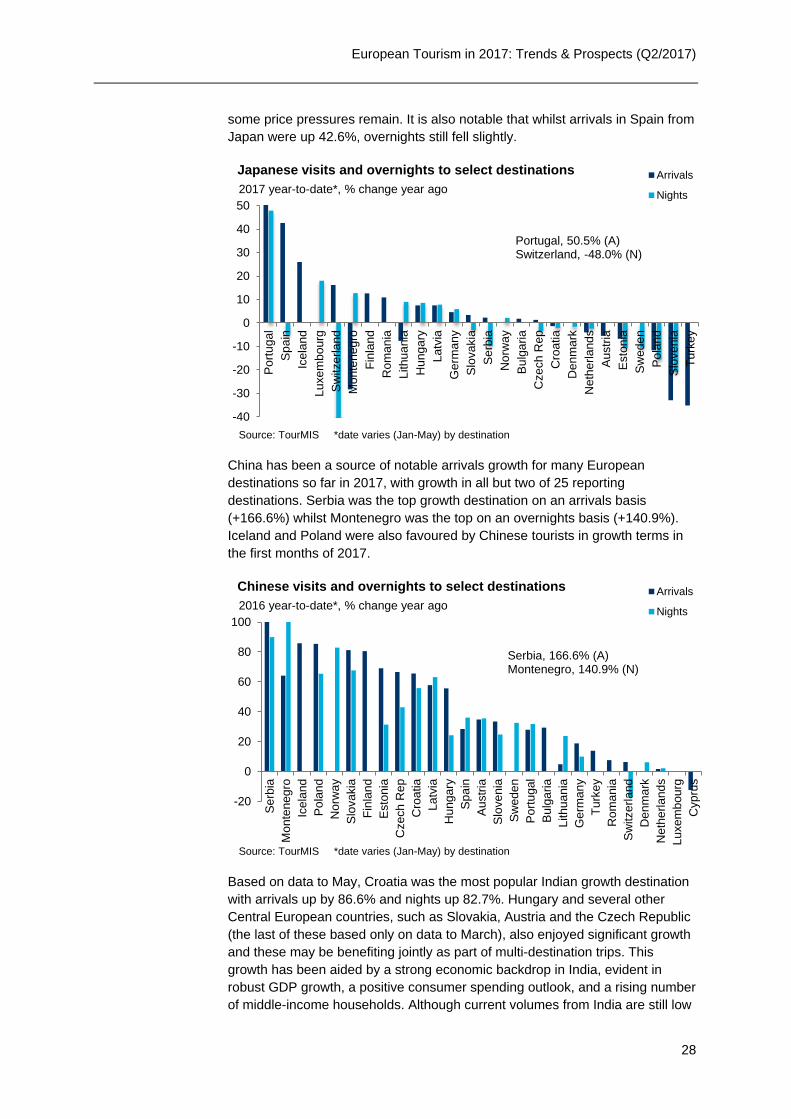
China has been a source of notable arrivals growth for many European
destinations so far in 2017, with growth in all but two of 25 reporting
destinations. Serbia was the top growth destination on an arrivals basis
(+166.6%) whilst Montenegro was the top on an overnights basis (+140.9%).
Iceland and Poland were also favoured by Chinese tourists in growth terms in
the first months of 2017.
Based on data to May, Croatia was the most popular Indian growth destination
with arrivals up by 86.6% and nights up 82.7%. Hungary and several other
Central European countries, such as Slovakia, Austria and the Czech Republic
(the last of these based only on data to March), also enjoyed significant growth
and these may be benefiting jointly as part of multi-destination trips. This
growth has been aided by a strong economic backdrop in India, evident in
robust GDP growth, a positive consumer spending outlook, and a rising number
of middle-income households. Although current volumes from India are still low
-40
-30
-20
-10
0
10
20
30
40
50
Po
rtu
gal
Sp
ain
Ice
lan
d
Lu
xe
mb
ourg
Sw
itze
rla
nd
Mo
nte
ne
gro
Fin
lan
d
Ro
ma
nia
Lith
ua
nia
Hu
ng
ary
La
tvia
Ge
rma
ny
Slo
va
kia
Se
rbia
No
rwa
y
Bu
lga
ria
Cze
ch
Re
p
Cro
atia
De
nm
ark
Ne
the
rla
nd
s
Au
str
ia
Esto
nia
Sw
ed
en
Po
lan
d
Slo
ve
nia
Tu
rke
y
Arrivals
Nights
Source: TourMIS *date varies (Jan-May) by destination
2017 year-to-date*, % change year ago
Japanese visits and overnights to select destinations
Portugal, 50.5% (A)Switzerland, -48.0% (N)
-20
0
20
40
60
80
100
Se
rbia
Monte
negro
Icela
nd
Po
lan
d
Norw
ay
Slo
vakia
Fin
lan
d
Esto
nia
Czech R
ep
Cro
atia
Latv
ia
Hung
ary
Sp
ain
Au
str
ia
Slo
ven
ia
Sw
ede
n
Po
rtu
gal
Bu
lga
ria
Lithuania
Germ
any
Turk
ey
Rom
an
ia
Sw
itzerla
nd
Denm
ark
Neth
erl
and
s
Luxem
bourg
Cypru
s
Arrivals
Nights
Source: TourMIS *date varies (Jan-May) by destination
2016 year-to-date*, % change year ago
Chinese visits and overnights to select destinations
Serbia, 166.6% (A)Montenegro, 140.9% (N)
European Tourism in 2017: Trends & Prospects (Q2/2017)
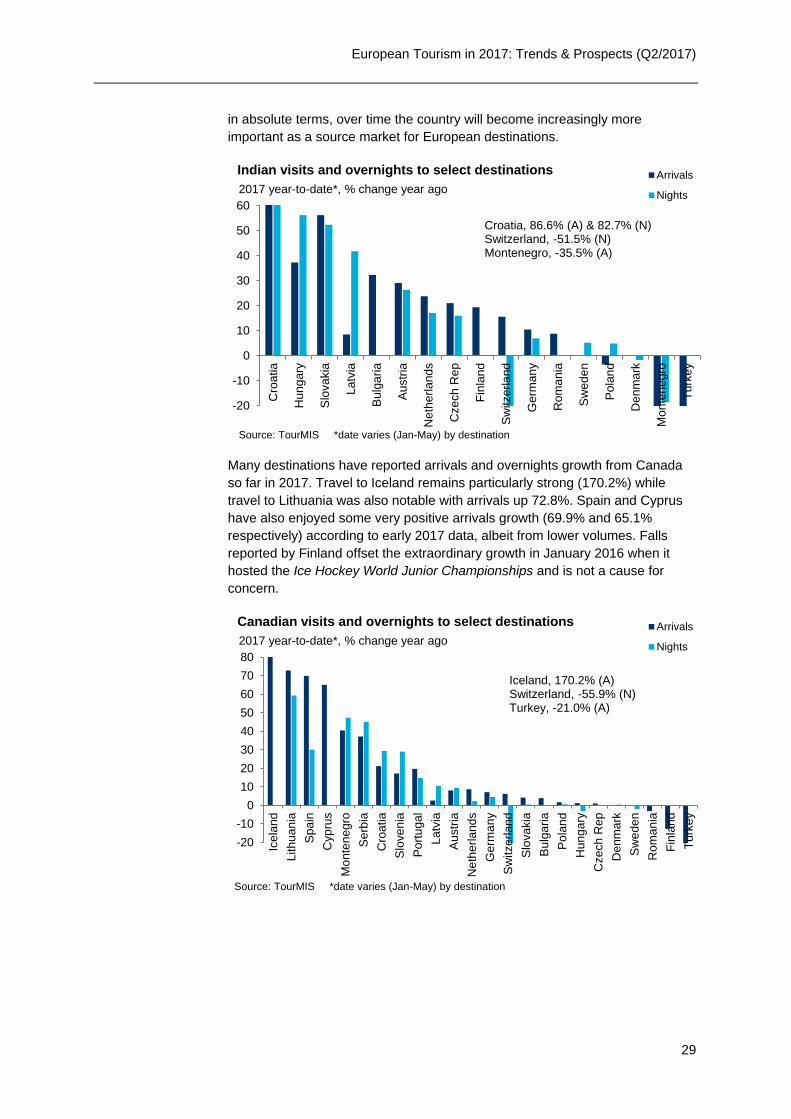
29
in absolute terms, over time the country will become increasingly more
important as a source market for European destinations.
Many destinations have reported arrivals and overnights growth from Canada
so far in 2017. Travel to Iceland remains particularly strong (170.2%) while
travel to Lithuania was also notable with arrivals up 72.8%. Spain and Cyprus
have also enjoyed some very positive arrivals growth (69.9% and 65.1%
respectively) according to early 2017 data, albeit from lower volumes. Falls
reported by Finland offset the extraordinary growth in January 2016 when it
hosted the Ice Hockey World Junior Championships and is not a cause for
concern.
-20
-10
0
10
20
30
40
50
60
Cro
atia
Hu
ng
ary
Slo
va
kia
La
tvia
Bu
lga
ria
Au
str
ia
Ne
the
rla
nd
s
Cze
ch
Re
p
Fin
lan
d
Sw
itze
rla
nd
Ge
rma
ny
Ro
ma
nia
Sw
ed
en
Po
lan
d
De
nm
ark
Mo
nte
ne
gro
Tu
rke
y
Arrivals
Nights
Source: TourMIS *date varies (Jan-May) by destination
2017 year-to-date*, % change year ago
Indian visits and overnights to select destinations
Croatia, 86.6% (A) & 82.7% (N)Switzerland, -51.5% (N) Montenegro, -35.5% (A)
-20
-10
0
10
20
30
40
50
60
70
80
Icela
nd
Lithuania
Sp
ain
Cypru
s
Monte
negro
Se
rbia
Cro
atia
Slo
ven
ia
Po
rtu
gal
Latv
ia
Au
str
ia
Neth
erl
and
s
Germ
any
Sw
itzerla
nd
Slo
vakia
Bu
lga
ria
Po
lan
d
Hung
ary
Czech R
ep
Denm
ark
Sw
ede
n
Rom
an
ia
Fin
lan
d
Turk
ey
Arrivals
Nights
Source: TourMIS *date varies (Jan-May) by destination
2017 year-to-date*, % change year ago
Canadian visits and overnights to select destinations
Iceland, 170.2% (A)Switzerland, -55.9% (N)Turkey, -21.0% (A)
European Tourism in 2017: Trends & Prospects (Q2/2017)
30
6. ORIGIN MARKET SHARE ANALYSIS
METHODOLOGY
Based on the Tourism Decision Metrics (TDM) model, the following charts and analysis show
Europe’s evolving market position – in absolute and percentage terms – for selected source
markets. 2015 values are, in most cases, year-to-date estimates based on the latest available
data and are not final reported numbers.
Data in these charts and tables relate to reported arrivals in all destinations as a comparable
measure of outbound travel for calculation of market share.
For example, US outbound figures featured in the analysis are larger than reported departures
in national statistics as long haul trips often involve travel to multiple destinations. In 2014 US
data reporting shows 11.9m departures to Europe while the sum of European arrivals from the
US was 23.4m. Thus each US trip to Europe involved a visit to two destinations on average.
The geographies of Europe are defined as follows:
Northern Europe is Denmark, Finland, Iceland, Ireland, Norway, Sweden, and the UK;
Western Europe is Austria, Belgium, France, Germany, Luxembourg, Netherlands, and
Switzerland;
Southern/Mediterranean Europe is Albania, Bosnia-Herzegovina, Croatia, Cyprus, FYR
Macedonia, Greece, Italy, Malta, Montenegro, Portugal, Serbia, Slovenia, Spain, and Turkey;
Central/Eastern Europe is Armenia, Azerbaijan, Bulgaria, Czech Republic, Estonia, Hungary,
Kazakhstan, Kyrgyzstan, Latvia, Lithuania, Poland, Romania, Russian Federation, Slovakia,
and Ukraine.
European Tourism in 2017: Trends & Prospects (Q2/2017)
31
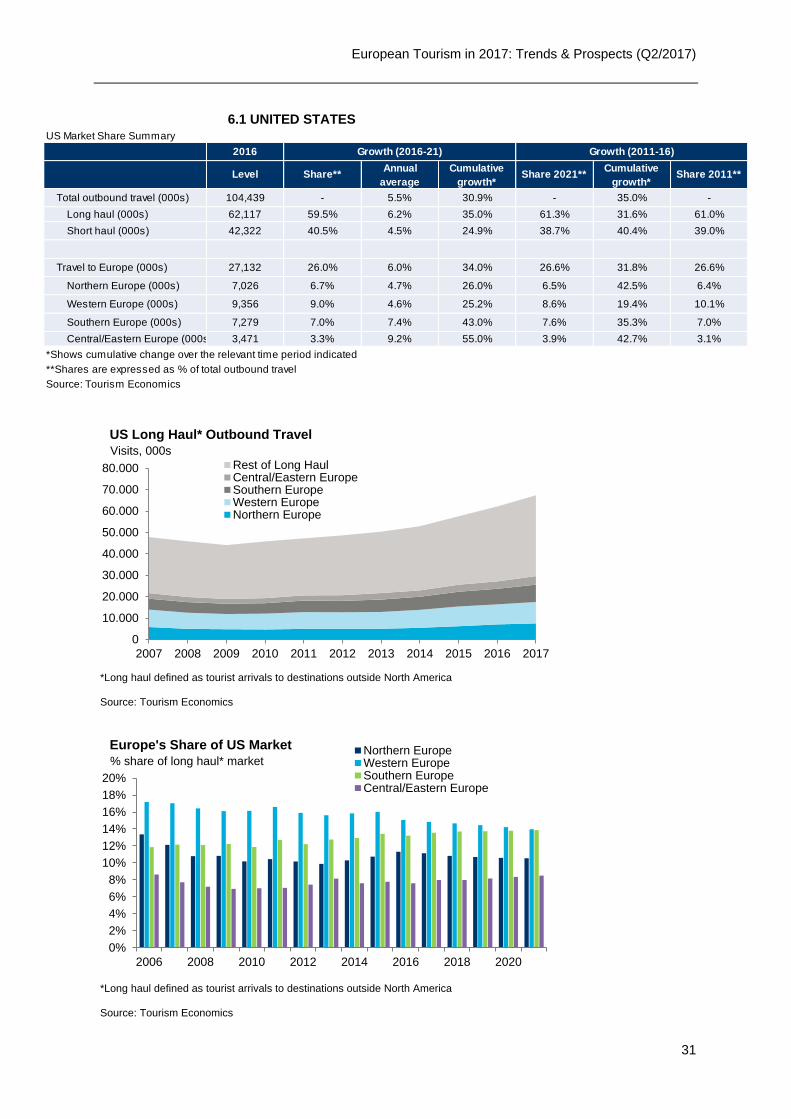
6.1 UNITED STATES
US Market Share Summary
2016
Total outbound travel (000s) 104,439 - 5.5% 30.9% - 35.0% -
Long haul (000s) 62,117 59.5% 6.2% 35.0% 61.3% 31.6% 61.0%
Short haul (000s) 42,322 40.5% 4.5% 24.9% 38.7% 40.4% 39.0%
Travel to Europe (000s) 27,132 26.0% 6.0% 34.0% 26.6% 31.8% 26.6%
Northern Europe (000s) 7,026 6.7% 4.7% 26.0% 6.5% 42.5% 6.4%
Western Europe (000s) 9,356 9.0% 4.6% 25.2% 8.6% 19.4% 10.1%
Southern Europe (000s) 7,279 7.0% 7.4% 43.0% 7.6% 35.3% 7.0%
Central/Eastern Europe (000s) 3,471 3.3% 9.2% 55.0% 3.9% 42.7% 3.1%
*Shows cumulative change over the relevant time period indicated
**Shares are expressed as % of total outbound travel
Source: Tourism Economics
Growth (2016-21) Growth (2011-16)
Level Share**Annual
average
Cumulative
growth*Share 2021**
Cumulative
growth*Share 2011**
0
10.000
20.000
30.000
40.000
50.000
60.000
70.000
80.000
2007 2008 2009 2010 2011 2012 2013 2014 2015 2016 2017
Rest of Long HaulCentral/Eastern EuropeSouthern EuropeWestern EuropeNorthern Europe
*Long haul defined as tourist arrivals to destinations outside North America
Source: Tourism Economics
Visits, 000s
US Long Haul* Outbound Travel
2006 2008 2010 2012 2014 2016 2018 2020
0%
2%
4%
6%
8%
10%
12%
14%
16%
18%
20%
Northern EuropeWestern EuropeSouthern EuropeCentral/Eastern Europe
*Long haul defined as tourist arrivals to destinations outside North America
Source: Tourism Economics
% share of long haul* market
Europe's Share of US Market
European Tourism in 2017: Trends & Prospects (Q2/2017)
32
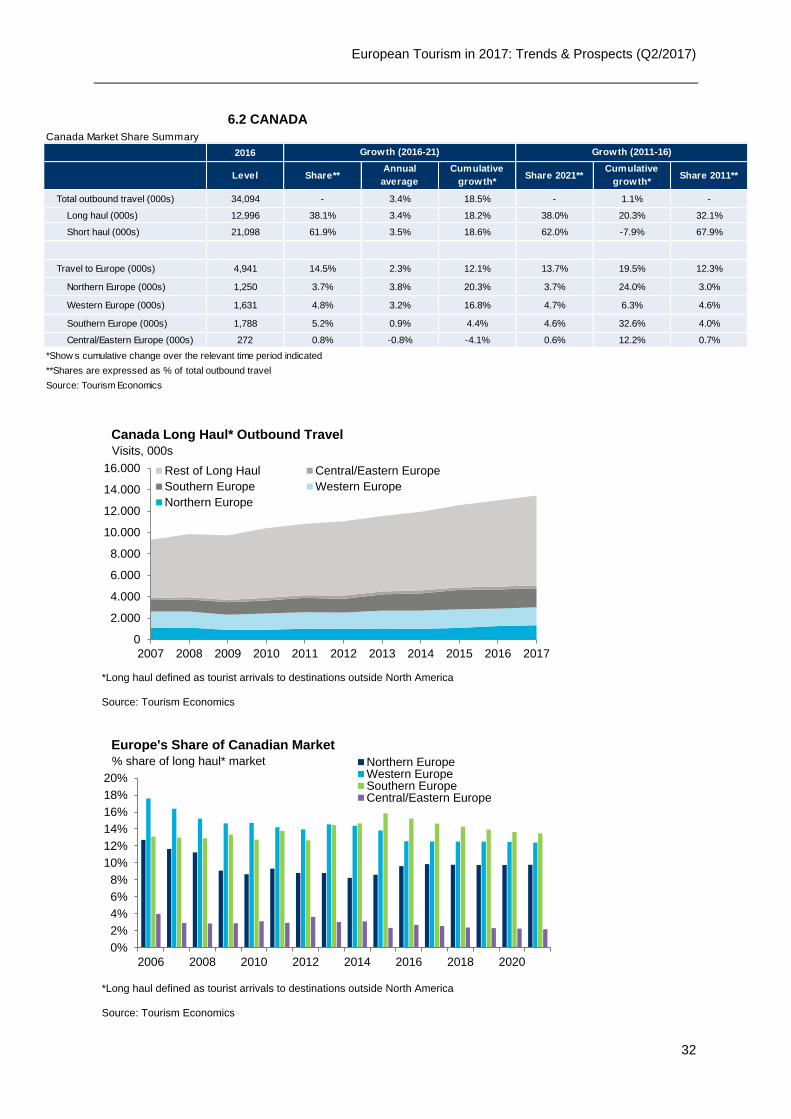
6.2 CANADA
Canada Market Share Summary
2016
Total outbound travel (000s) 34,094 - 3.4% 18.5% - 1.1% -
Long haul (000s) 12,996 38.1% 3.4% 18.2% 38.0% 20.3% 32.1%
Short haul (000s) 21,098 61.9% 3.5% 18.6% 62.0% -7.9% 67.9%
Travel to Europe (000s) 4,941 14.5% 2.3% 12.1% 13.7% 19.5% 12.3%
Northern Europe (000s) 1,250 3.7% 3.8% 20.3% 3.7% 24.0% 3.0%
Western Europe (000s) 1,631 4.8% 3.2% 16.8% 4.7% 6.3% 4.6%
Southern Europe (000s) 1,788 5.2% 0.9% 4.4% 4.6% 32.6% 4.0%
Central/Eastern Europe (000s) 272 0.8% -0.8% -4.1% 0.6% 12.2% 0.7%
*Show s cumulative change over the relevant time period indicated
**Shares are expressed as % of total outbound travel
Source: Tourism Economics
Growth (2016-21) Growth (2011-16)
Level Share**Annual
average
Cumulative
growth*Share 2021**
Cumulative
growth*Share 2011**
0
2.000
4.000
6.000
8.000
10.000
12.000
14.000
16.000
2007 2008 2009 2010 2011 2012 2013 2014 2015 2016 2017
Rest of Long Haul Central/Eastern Europe
Southern Europe Western Europe
Northern Europe
*Long haul defined as tourist arrivals to destinations outside North America
Source: Tourism Economics
Visits, 000s
Canada Long Haul* Outbound Travel
2006 2008 2010 2012 2014 2016 2018 2020
0%
2%
4%
6%
8%
10%
12%
14%
16%
18%
20%
Northern EuropeWestern EuropeSouthern EuropeCentral/Eastern Europe
*Long haul defined as tourist arrivals to destinations outside North America
Source: Tourism Economics
% share of long haul* market
Europe's Share of Canadian Market
European Tourism in 2017: Trends & Prospects (Q2/2017)
33
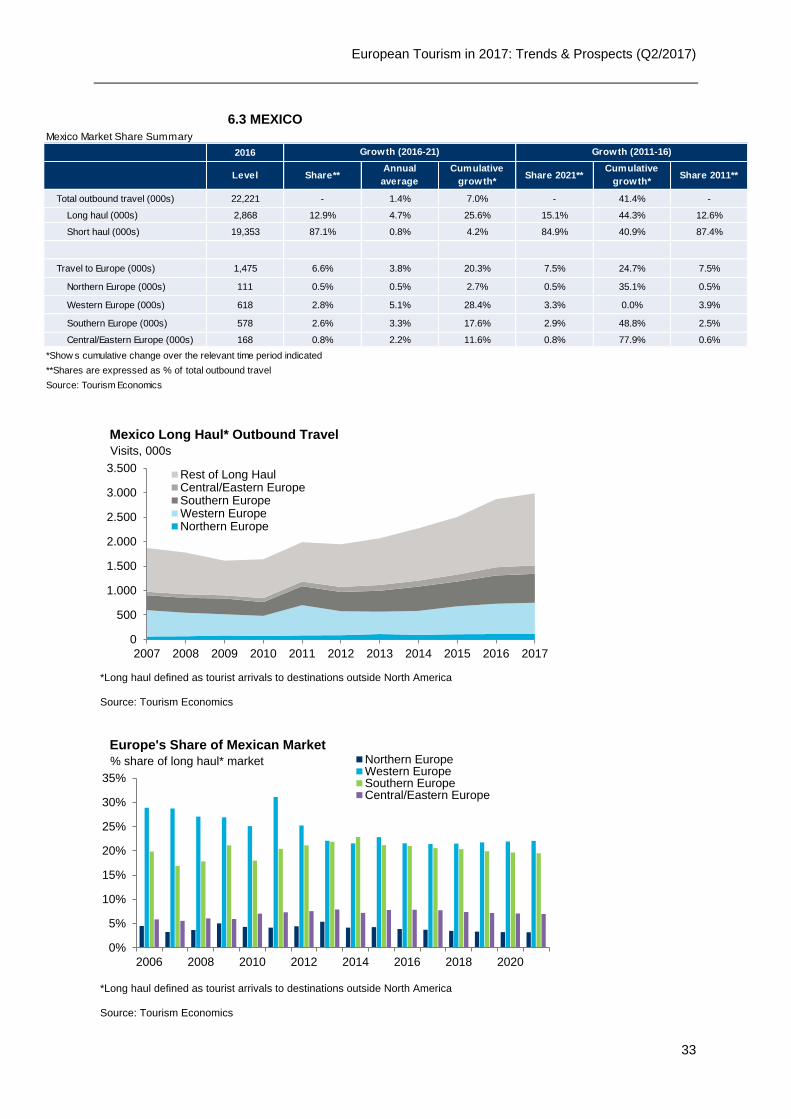
6.3 MEXICO
Mexico Market Share Summary
2016
Total outbound travel (000s) 22,221 - 1.4% 7.0% - 41.4% -
Long haul (000s) 2,868 12.9% 4.7% 25.6% 15.1% 44.3% 12.6%
Short haul (000s) 19,353 87.1% 0.8% 4.2% 84.9% 40.9% 87.4%
Travel to Europe (000s) 1,475 6.6% 3.8% 20.3% 7.5% 24.7% 7.5%
Northern Europe (000s) 111 0.5% 0.5% 2.7% 0.5% 35.1% 0.5%
Western Europe (000s) 618 2.8% 5.1% 28.4% 3.3% 0.0% 3.9%
Southern Europe (000s) 578 2.6% 3.3% 17.6% 2.9% 48.8% 2.5%
Central/Eastern Europe (000s) 168 0.8% 2.2% 11.6% 0.8% 77.9% 0.6%
*Show s cumulative change over the relevant time period indicated
**Shares are expressed as % of total outbound travel
Source: Tourism Economics
Growth (2016-21) Growth (2011-16)
Level Share**Annual
average
Cumulative
growth*Share 2021**
Cumulative
growth*Share 2011**
0
500
1.000
1.500
2.000
2.500
3.000
3.500
2007 2008 2009 2010 2011 2012 2013 2014 2015 2016 2017
Rest of Long HaulCentral/Eastern EuropeSouthern EuropeWestern EuropeNorthern Europe
*Long haul defined as tourist arrivals to destinations outside North America
Source: Tourism Economics
Visits, 000s
Mexico Long Haul* Outbound Travel
2006 2008 2010 2012 2014 2016 2018 2020
0%
5%
10%
15%
20%
25%
30%
35%
Northern EuropeWestern EuropeSouthern EuropeCentral/Eastern Europe
*Long haul defined as tourist arrivals to destinations outside North America
Source: Tourism Economics
% share of long haul* market
Europe's Share of Mexican Market
European Tourism in 2017: Trends & Prospects (Q2/2017)
34
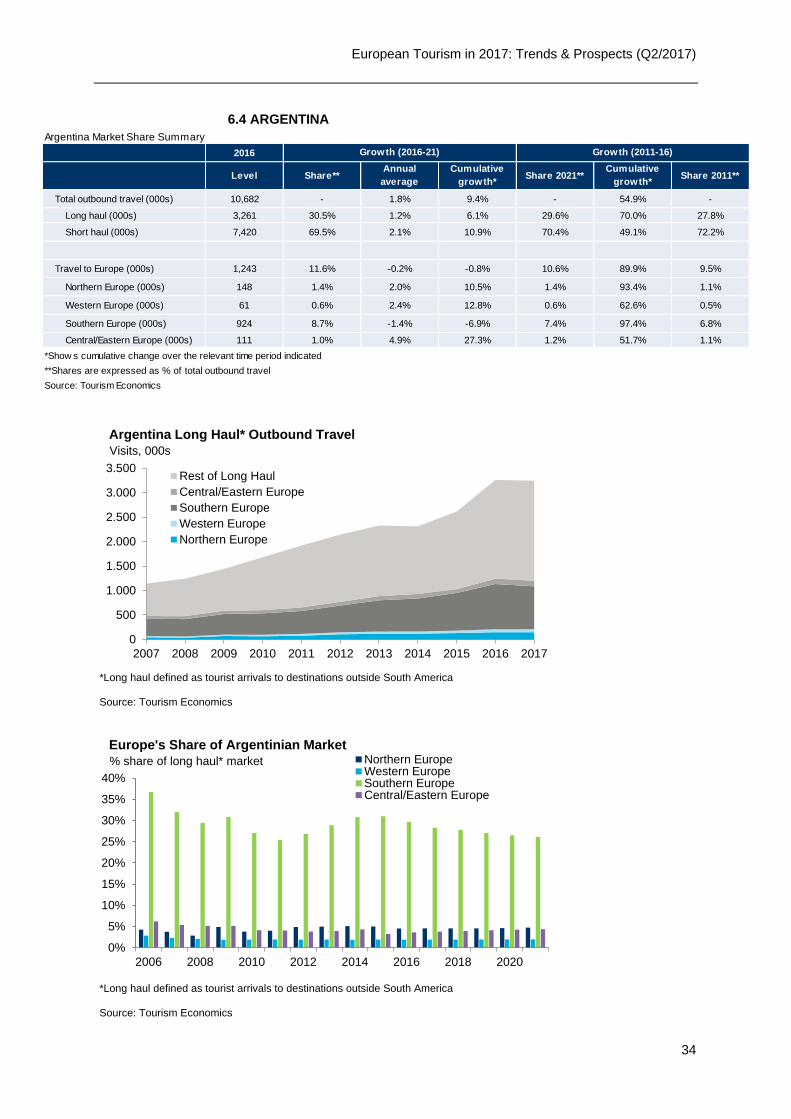
6.4 ARGENTINA
Argentina Market Share Summary
2016
Total outbound travel (000s) 10,682 - 1.8% 9.4% - 54.9% -
Long haul (000s) 3,261 30.5% 1.2% 6.1% 29.6% 70.0% 27.8%
Short haul (000s) 7,420 69.5% 2.1% 10.9% 70.4% 49.1% 72.2%
Travel to Europe (000s) 1,243 11.6% -0.2% -0.8% 10.6% 89.9% 9.5%
Northern Europe (000s) 148 1.4% 2.0% 10.5% 1.4% 93.4% 1.1%
Western Europe (000s) 61 0.6% 2.4% 12.8% 0.6% 62.6% 0.5%
Southern Europe (000s) 924 8.7% -1.4% -6.9% 7.4% 97.4% 6.8%
Central/Eastern Europe (000s) 111 1.0% 4.9% 27.3% 1.2% 51.7% 1.1%
*Show s cumulative change over the relevant time period indicated
**Shares are expressed as % of total outbound travel
Source: Tourism Economics
Growth (2016-21) Growth (2011-16)
Level Share**Annual
average
Cumulative
growth*Share 2021**
Cumulative
growth*Share 2011**
0
500
1.000
1.500
2.000
2.500
3.000
3.500
2007 2008 2009 2010 2011 2012 2013 2014 2015 2016 2017
Rest of Long Haul
Central/Eastern Europe
Southern Europe
Western Europe
Northern Europe
*Long haul defined as tourist arrivals to destinations outside South America
Source: Tourism Economics
Visits, 000s
Argentina Long Haul* Outbound Travel
2006 2008 2010 2012 2014 2016 2018 2020
0%
5%
10%
15%
20%
25%
30%
35%
40%
Northern EuropeWestern EuropeSouthern EuropeCentral/Eastern Europe
*Long haul defined as tourist arrivals to destinations outside South America
Source: Tourism Economics
% share of long haul* market
Europe's Share of Argentinian Market
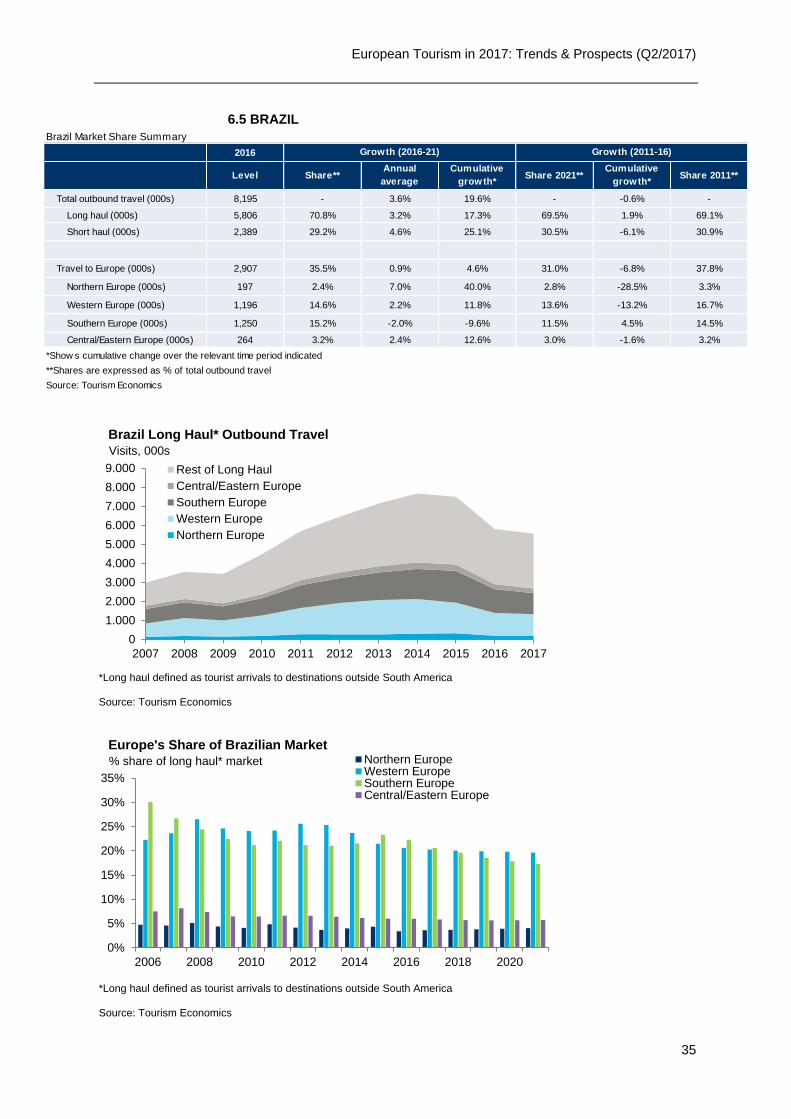
European Tourism in 2017: Trends & Prospects (Q2/2017)
35
6.5 BRAZIL
Brazil Market Share Summary
2016
Total outbound travel (000s) 8,195 - 3.6% 19.6% - -0.6% -
Long haul (000s) 5,806 70.8% 3.2% 17.3% 69.5% 1.9% 69.1%
Short haul (000s) 2,389 29.2% 4.6% 25.1% 30.5% -6.1% 30.9%
Travel to Europe (000s) 2,907 35.5% 0.9% 4.6% 31.0% -6.8% 37.8%
Northern Europe (000s) 197 2.4% 7.0% 40.0% 2.8% -28.5% 3.3%
Western Europe (000s) 1,196 14.6% 2.2% 11.8% 13.6% -13.2% 16.7%
Southern Europe (000s) 1,250 15.2% -2.0% -9.6% 11.5% 4.5% 14.5%
Central/Eastern Europe (000s) 264 3.2% 2.4% 12.6% 3.0% -1.6% 3.2%
*Show s cumulative change over the relevant time period indicated
**Shares are expressed as % of total outbound travel
Source: Tourism Economics
Growth (2016-21) Growth (2011-16)
Level Share**Annual
average
Cumulative
growth*Share 2021**
Cumulative
growth*Share 2011**
0
1.000
2.000
3.000
4.000
5.000
6.000
7.000
8.000
9.000
2007 2008 2009 2010 2011 2012 2013 2014 2015 2016 2017
Rest of Long Haul
Central/Eastern Europe
Southern Europe
Western Europe
Northern Europe
*Long haul defined as tourist arrivals to destinations outside South America
Source: Tourism Economics
Visits, 000s
Brazil Long Haul* Outbound Travel
2006 2008 2010 2012 2014 2016 2018 2020
0%
5%
10%
15%
20%
25%
30%
35%
Northern EuropeWestern EuropeSouthern EuropeCentral/Eastern Europe
*Long haul defined as tourist arrivals to destinations outside South America
Source: Tourism Economics
% share of long haul* market
Europe's Share of Brazilian Market
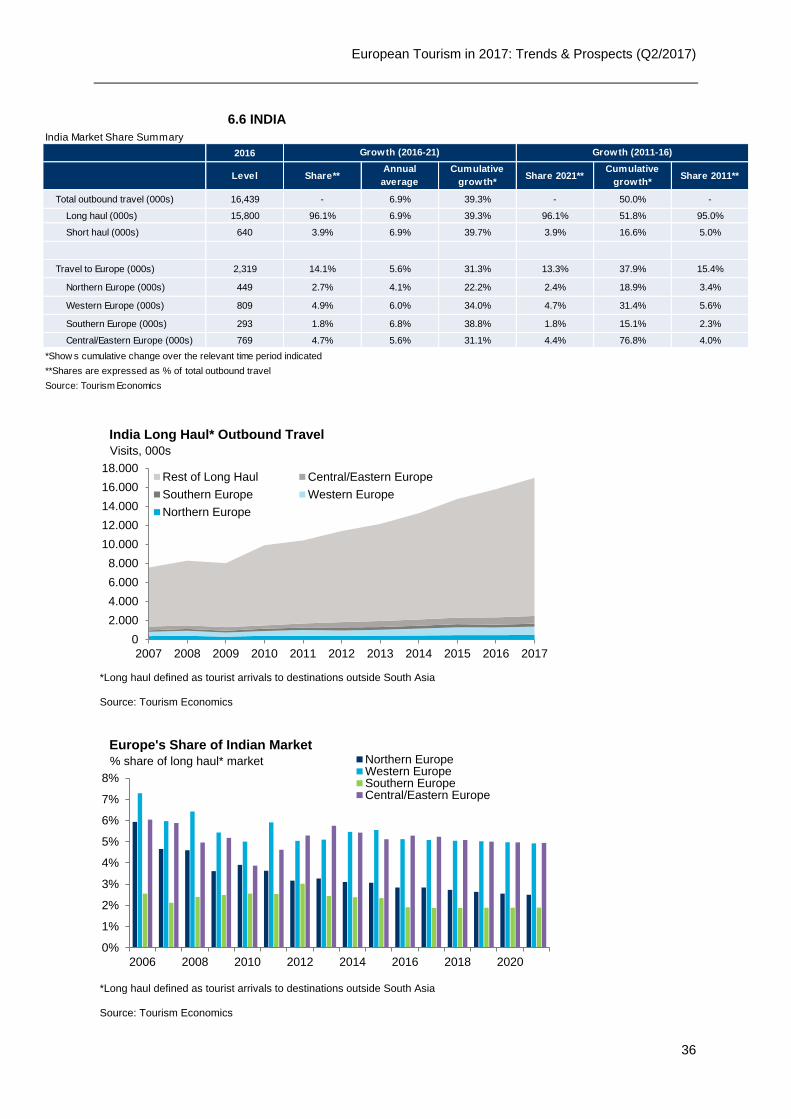
European Tourism in 2017: Trends & Prospects (Q2/2017)
36
6.6 INDIA
India Market Share Summary
2016
Total outbound travel (000s) 16,439 - 6.9% 39.3% - 50.0% -
Long haul (000s) 15,800 96.1% 6.9% 39.3% 96.1% 51.8% 95.0%
Short haul (000s) 640 3.9% 6.9% 39.7% 3.9% 16.6% 5.0%
Travel to Europe (000s) 2,319 14.1% 5.6% 31.3% 13.3% 37.9% 15.4%
Northern Europe (000s) 449 2.7% 4.1% 22.2% 2.4% 18.9% 3.4%
Western Europe (000s) 809 4.9% 6.0% 34.0% 4.7% 31.4% 5.6%
Southern Europe (000s) 293 1.8% 6.8% 38.8% 1.8% 15.1% 2.3%
Central/Eastern Europe (000s) 769 4.7% 5.6% 31.1% 4.4% 76.8% 4.0%
*Show s cumulative change over the relevant time period indicated
**Shares are expressed as % of total outbound travel
Source: Tourism Economics
Growth (2016-21) Growth (2011-16)
Level Share**Annual
average
Cumulative
growth*Share 2021**
Cumulative
growth*Share 2011**
0
2.000
4.000
6.000
8.000
10.000
12.000
14.000
16.000
18.000
2007 2008 2009 2010 2011 2012 2013 2014 2015 2016 2017
Rest of Long Haul Central/Eastern Europe
Southern Europe Western Europe
Northern Europe
*Long haul defined as tourist arrivals to destinations outside South Asia
Source: Tourism Economics
Visits, 000s
India Long Haul* Outbound Travel
2006 2008 2010 2012 2014 2016 2018 2020
0%
1%
2%
3%
4%
5%
6%
7%
8%
Northern EuropeWestern EuropeSouthern EuropeCentral/Eastern Europe
*Long haul defined as tourist arrivals to destinations outside South Asia
Source: Tourism Economics
% share of long haul* market
Europe's Share of Indian Market
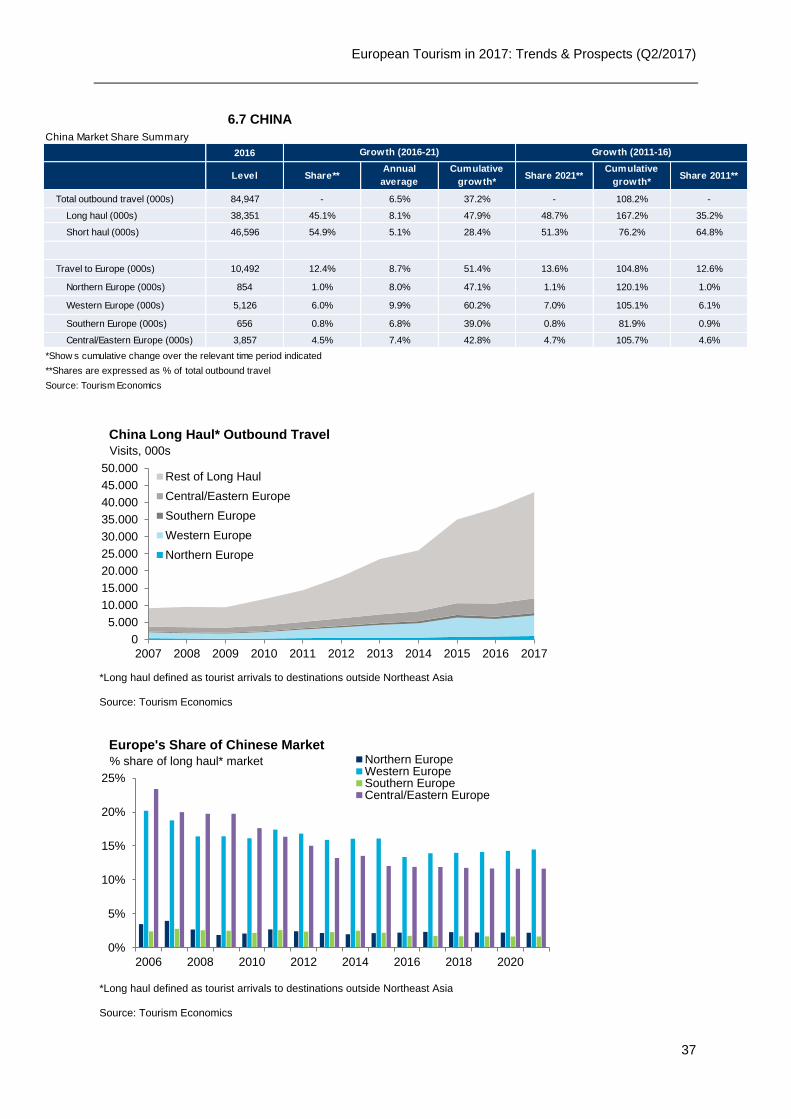
European Tourism in 2017: Trends & Prospects (Q2/2017)
37
6.7 CHINA
China Market Share Summary
2016
Total outbound travel (000s) 84,947 - 6.5% 37.2% - 108.2% -
Long haul (000s) 38,351 45.1% 8.1% 47.9% 48.7% 167.2% 35.2%
Short haul (000s) 46,596 54.9% 5.1% 28.4% 51.3% 76.2% 64.8%
Travel to Europe (000s) 10,492 12.4% 8.7% 51.4% 13.6% 104.8% 12.6%
Northern Europe (000s) 854 1.0% 8.0% 47.1% 1.1% 120.1% 1.0%
Western Europe (000s) 5,126 6.0% 9.9% 60.2% 7.0% 105.1% 6.1%
Southern Europe (000s) 656 0.8% 6.8% 39.0% 0.8% 81.9% 0.9%
Central/Eastern Europe (000s) 3,857 4.5% 7.4% 42.8% 4.7% 105.7% 4.6%
*Show s cumulative change over the relevant time period indicated
**Shares are expressed as % of total outbound travel
Source: Tourism Economics
Growth (2016-21) Growth (2011-16)
Level Share**Annual
average
Cumulative
growth*Share 2021**
Cumulative
growth*Share 2011**
0
5.000
10.000
15.000
20.000
25.000
30.000
35.000
40.000
45.000
50.000
2007 2008 2009 2010 2011 2012 2013 2014 2015 2016 2017
Rest of Long Haul
Central/Eastern Europe
Southern Europe
Western Europe
Northern Europe
*Long haul defined as tourist arrivals to destinations outside Northeast Asia
Source: Tourism Economics
Visits, 000s
China Long Haul* Outbound Travel
2006 2008 2010 2012 2014 2016 2018 2020
0%
5%
10%
15%
20%
25%
Northern EuropeWestern EuropeSouthern EuropeCentral/Eastern Europe
*Long haul defined as tourist arrivals to destinations outside Northeast Asia
Source: Tourism Economics
% share of long haul* market
Europe's Share of Chinese Market
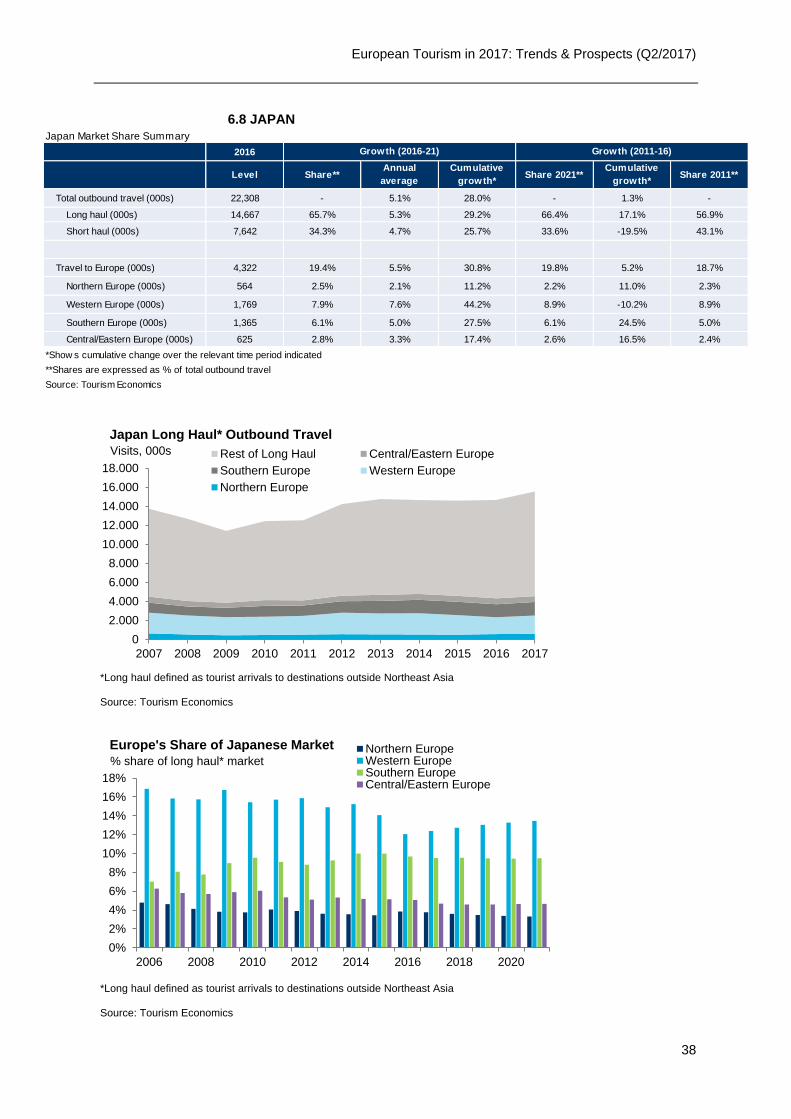
European Tourism in 2017: Trends & Prospects (Q2/2017)
38
6.8 JAPAN
Japan Market Share Summary
2016
Total outbound travel (000s) 22,308 - 5.1% 28.0% - 1.3% -
Long haul (000s) 14,667 65.7% 5.3% 29.2% 66.4% 17.1% 56.9%
Short haul (000s) 7,642 34.3% 4.7% 25.7% 33.6% -19.5% 43.1%
Travel to Europe (000s) 4,322 19.4% 5.5% 30.8% 19.8% 5.2% 18.7%
Northern Europe (000s) 564 2.5% 2.1% 11.2% 2.2% 11.0% 2.3%
Western Europe (000s) 1,769 7.9% 7.6% 44.2% 8.9% -10.2% 8.9%
Southern Europe (000s) 1,365 6.1% 5.0% 27.5% 6.1% 24.5% 5.0%
Central/Eastern Europe (000s) 625 2.8% 3.3% 17.4% 2.6% 16.5% 2.4%
*Show s cumulative change over the relevant time period indicated
**Shares are expressed as % of total outbound travel
Source: Tourism Economics
Growth (2016-21) Growth (2011-16)
Level Share**Annual
average
Cumulative
growth*Share 2021**
Cumulative
growth*Share 2011**
0
2.000
4.000
6.000
8.000
10.000
12.000
14.000
16.000
18.000
2007 2008 2009 2010 2011 2012 2013 2014 2015 2016 2017
Rest of Long Haul Central/Eastern Europe
Southern Europe Western Europe
Northern Europe
*Long haul defined as tourist arrivals to destinations outside Northeast Asia
Source: Tourism Economics
Visits, 000s
Japan Long Haul* Outbound Travel
2006 2008 2010 2012 2014 2016 2018 2020
0%
2%
4%
6%
8%
10%
12%
14%
16%
18%
Northern EuropeWestern EuropeSouthern EuropeCentral/Eastern Europe
*Long haul defined as tourist arrivals to destinations outside Northeast Asia
Source: Tourism Economics
% share of long haul* market
Europe's Share of Japanese Market
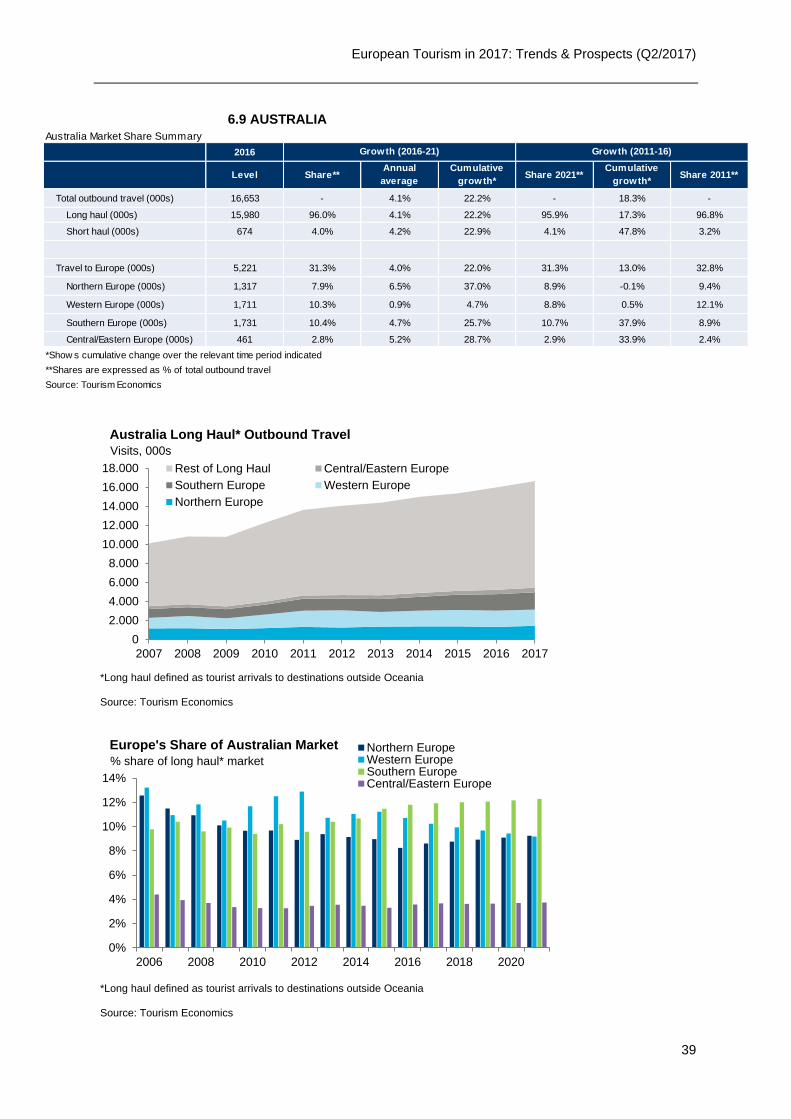
European Tourism in 2017: Trends & Prospects (Q2/2017)
39
6.9 AUSTRALIA
Australia Market Share Summary
2016
Total outbound travel (000s) 16,653 - 4.1% 22.2% - 18.3% -
Long haul (000s) 15,980 96.0% 4.1% 22.2% 95.9% 17.3% 96.8%
Short haul (000s) 674 4.0% 4.2% 22.9% 4.1% 47.8% 3.2%
Travel to Europe (000s) 5,221 31.3% 4.0% 22.0% 31.3% 13.0% 32.8%
Northern Europe (000s) 1,317 7.9% 6.5% 37.0% 8.9% -0.1% 9.4%
Western Europe (000s) 1,711 10.3% 0.9% 4.7% 8.8% 0.5% 12.1%
Southern Europe (000s) 1,731 10.4% 4.7% 25.7% 10.7% 37.9% 8.9%
Central/Eastern Europe (000s) 461 2.8% 5.2% 28.7% 2.9% 33.9% 2.4%
*Show s cumulative change over the relevant time period indicated
**Shares are expressed as % of total outbound travel
Source: Tourism Economics
Growth (2016-21) Growth (2011-16)
Level Share**Annual
average
Cumulative
growth*Share 2021**
Cumulative
growth*Share 2011**
0
2.000
4.000
6.000
8.000
10.000
12.000
14.000
16.000
18.000
2007 2008 2009 2010 2011 2012 2013 2014 2015 2016 2017
Rest of Long Haul Central/Eastern Europe
Southern Europe Western Europe
Northern Europe
*Long haul defined as tourist arrivals to destinations outside Oceania
Source: Tourism Economics
Visits, 000s
Australia Long Haul* Outbound Travel
2006 2008 2010 2012 2014 2016 2018 2020
0%
2%
4%
6%
8%
10%
12%
14%
Northern EuropeWestern EuropeSouthern EuropeCentral/Eastern Europe
*Long haul defined as tourist arrivals to destinations outside Oceania
Source: Tourism Economics
% share of long haul* market
Europe's Share of Australian Market
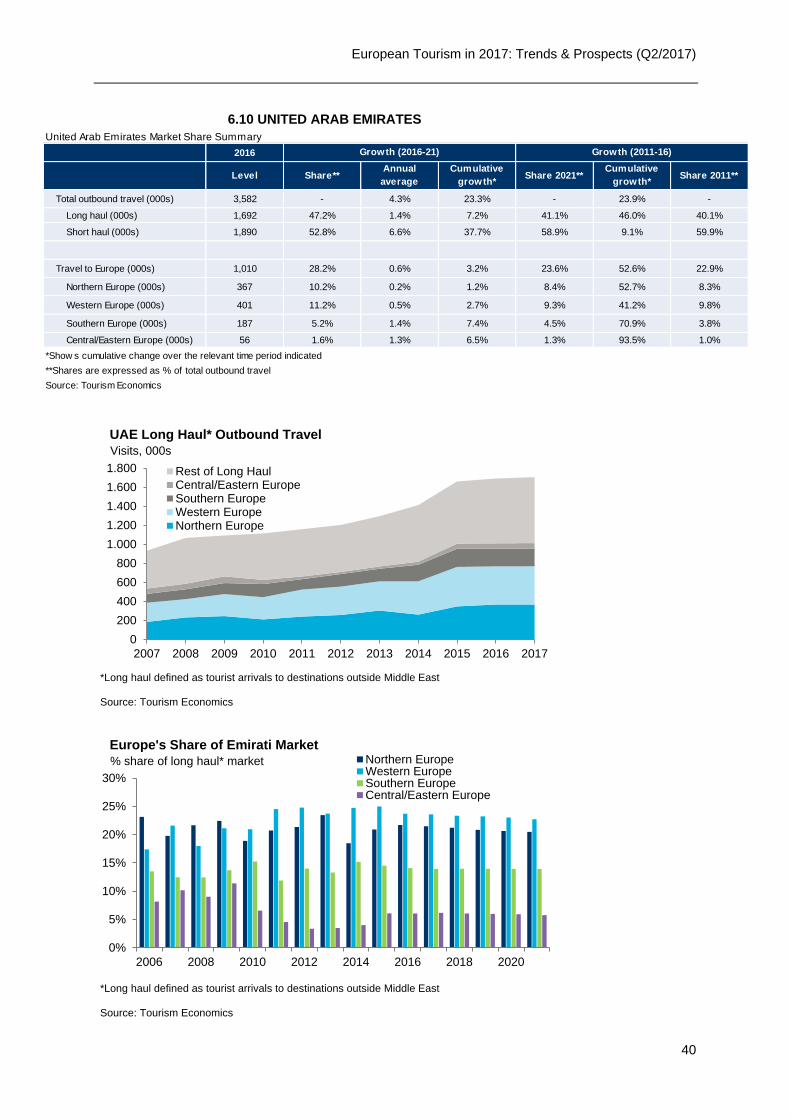
European Tourism in 2017: Trends & Prospects (Q2/2017)
40
6.10 UNITED ARAB EMIRATES
United Arab Emirates Market Share Summary
2016
Total outbound travel (000s) 3,582 - 4.3% 23.3% - 23.9% -
Long haul (000s) 1,692 47.2% 1.4% 7.2% 41.1% 46.0% 40.1%
Short haul (000s) 1,890 52.8% 6.6% 37.7% 58.9% 9.1% 59.9%
Travel to Europe (000s) 1,010 28.2% 0.6% 3.2% 23.6% 52.6% 22.9%
Northern Europe (000s) 367 10.2% 0.2% 1.2% 8.4% 52.7% 8.3%
Western Europe (000s) 401 11.2% 0.5% 2.7% 9.3% 41.2% 9.8%
Southern Europe (000s) 187 5.2% 1.4% 7.4% 4.5% 70.9% 3.8%
Central/Eastern Europe (000s) 56 1.6% 1.3% 6.5% 1.3% 93.5% 1.0%
*Show s cumulative change over the relevant time period indicated
**Shares are expressed as % of total outbound travel
Source: Tourism Economics
Growth (2016-21) Growth (2011-16)
Level Share**Annual
average
Cumulative
growth*Share 2021**
Cumulative
growth*Share 2011**
0
200
400
600
800
1.000
1.200
1.400
1.600
1.800
2007 2008 2009 2010 2011 2012 2013 2014 2015 2016 2017
Rest of Long HaulCentral/Eastern EuropeSouthern EuropeWestern EuropeNorthern Europe
*Long haul defined as tourist arrivals to destinations outside Middle East
Source: Tourism Economics
Visits, 000s
UAE Long Haul* Outbound Travel
2006 2008 2010 2012 2014 2016 2018 2020
0%
5%
10%
15%
20%
25%
30%
Northern EuropeWestern EuropeSouthern EuropeCentral/Eastern Europe
*Long haul defined as tourist arrivals to destinations outside Middle East
Source: Tourism Economics
% share of long haul* market
Europe's Share of Emirati Market
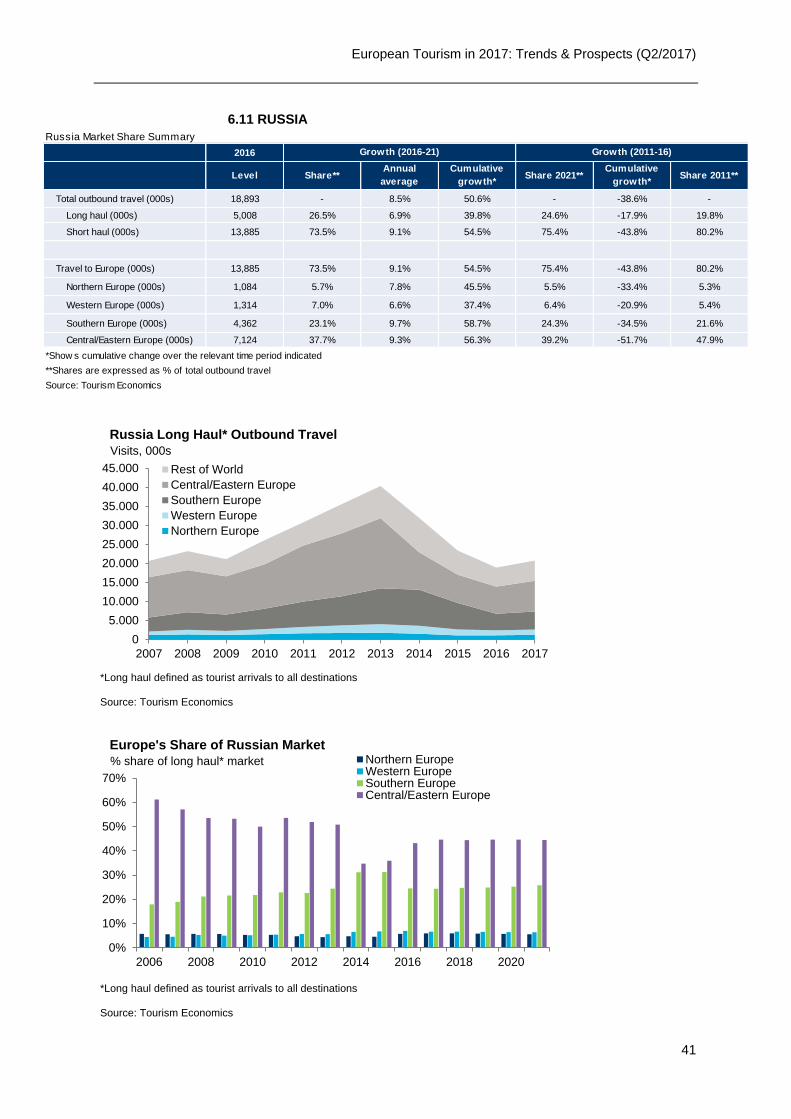
European Tourism in 2017: Trends & Prospects (Q2/2017)
41
6.11 RUSSIA
Russia Market Share Summary
2016
Total outbound travel (000s) 18,893 - 8.5% 50.6% - -38.6% -
Long haul (000s) 5,008 26.5% 6.9% 39.8% 24.6% -17.9% 19.8%
Short haul (000s) 13,885 73.5% 9.1% 54.5% 75.4% -43.8% 80.2%
Travel to Europe (000s) 13,885 73.5% 9.1% 54.5% 75.4% -43.8% 80.2%
Northern Europe (000s) 1,084 5.7% 7.8% 45.5% 5.5% -33.4% 5.3%
Western Europe (000s) 1,314 7.0% 6.6% 37.4% 6.4% -20.9% 5.4%
Southern Europe (000s) 4,362 23.1% 9.7% 58.7% 24.3% -34.5% 21.6%
Central/Eastern Europe (000s) 7,124 37.7% 9.3% 56.3% 39.2% -51.7% 47.9%
*Show s cumulative change over the relevant time period indicated
**Shares are expressed as % of total outbound travel
Source: Tourism Economics
Growth (2016-21) Growth (2011-16)
Level Share**Annual
average
Cumulative
growth*Share 2021**
Cumulative
growth*Share 2011**
0
5.000
10.000
15.000
20.000
25.000
30.000
35.000
40.000
45.000
2007 2008 2009 2010 2011 2012 2013 2014 2015 2016 2017
Rest of World
Central/Eastern Europe
Southern Europe
Western Europe
Northern Europe
*Long haul defined as tourist arrivals to all destinations
Source: Tourism Economics
Visits, 000s
Russia Long Haul* Outbound Travel
2006 2008 2010 2012 2014 2016 2018 2020
0%
10%
20%
30%
40%
50%
60%
70%
Northern EuropeWestern EuropeSouthern EuropeCentral/Eastern Europe
*Long haul defined as tourist arrivals to all destinations
Source: Tourism Economics
% share of long haul* market
Europe's Share of Russian Market
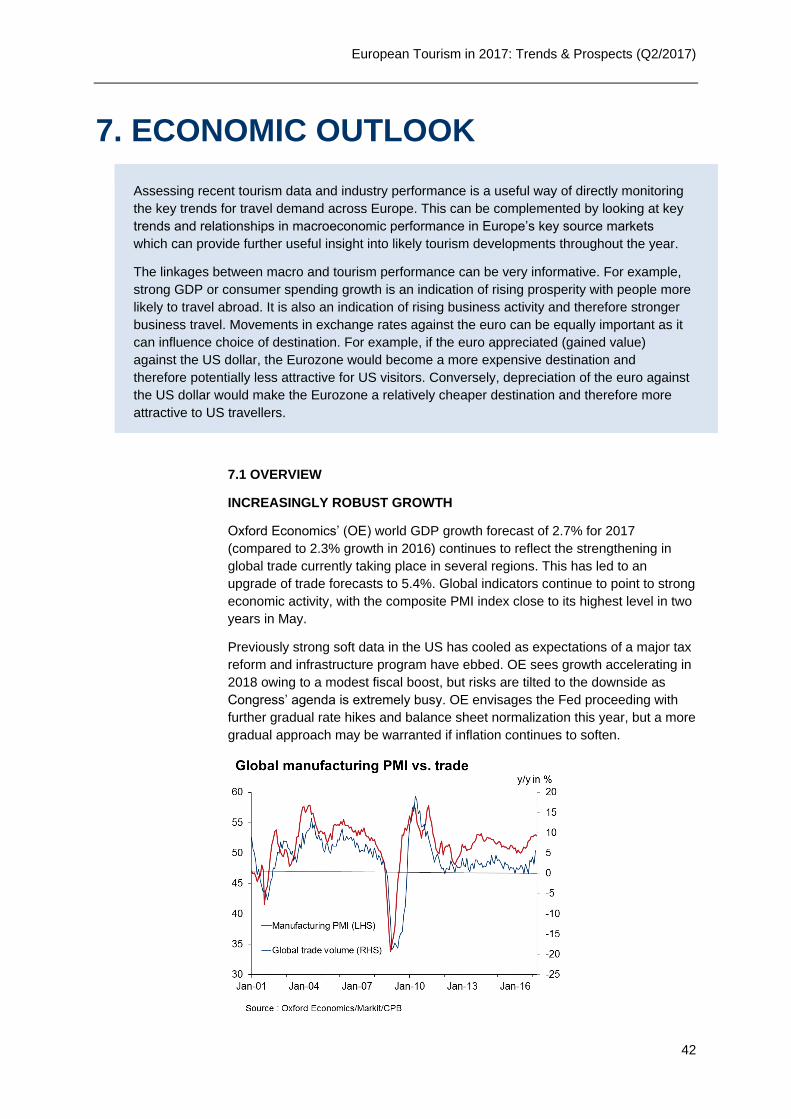
European Tourism in 2017: Trends & Prospects (Q2/2017)
42
7. ECONOMIC OUTLOOK
Assessing recent tourism data and industry performance is a useful way of directly monitoring
the key trends for travel demand across Europe. This can be complemented by looking at key
trends and relationships in macroeconomic performance in Europe’s key source markets
which can provide further useful insight into likely tourism developments throughout the year.
The linkages between macro and tourism performance can be very informative. For example,
strong GDP or consumer spending growth is an indication of rising prosperity with people more
likely to travel abroad. It is also an indication of rising business activity and therefore stronger
business travel. Movements in exchange rates against the euro can be equally important as it
can influence choice of destination. For example, if the euro appreciated (gained value)
against the US dollar, the Eurozone would become a more expensive destination and
therefore potentially less attractive for US visitors. Conversely, depreciation of the euro against
the US dollar would make the Eurozone a relatively cheaper destination and therefore more
attractive to US travellers.
7.1 OVERVIEW
INCREASINGLY ROBUST GROWTH
Oxford Economics’ (OE) world GDP growth forecast of 2.7% for 2017
(compared to 2.3% growth in 2016) continues to reflect the strengthening in
global trade currently taking place in several regions. This has led to an
upgrade of trade forecasts to 5.4%. Global indicators continue to point to strong
economic activity, with the composite PMI index close to its highest level in two
years in May.
Previously strong soft data in the US has cooled as expectations of a major tax
reform and infrastructure program have ebbed. OE sees growth accelerating in
2018 owing to a modest fiscal boost, but risks are tilted to the downside as
Congress’ agenda is extremely busy. OE envisages the Fed proceeding with
further gradual rate hikes and balance sheet normalization this year, but a more
gradual approach may be warranted if inflation continues to soften.
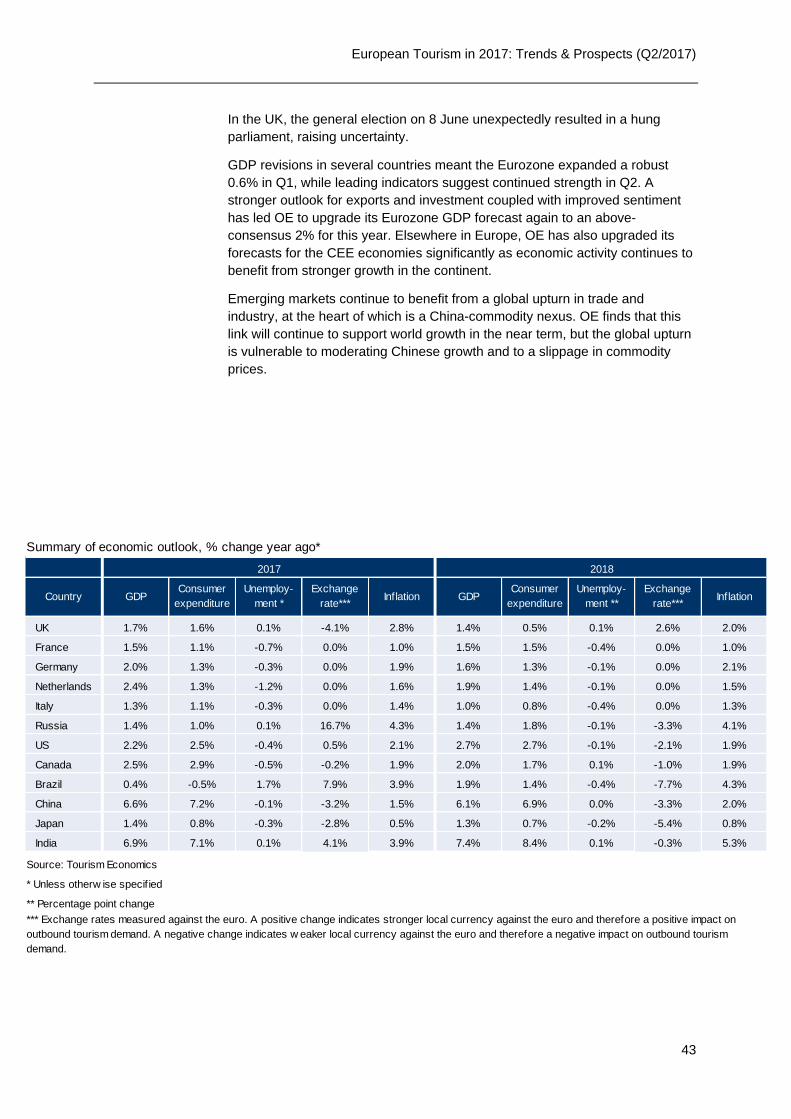
European Tourism in 2017: Trends & Prospects (Q2/2017)
43
In the UK, the general election on 8 June unexpectedly resulted in a hung
parliament, raising uncertainty.
GDP revisions in several countries meant the Eurozone expanded a robust
0.6% in Q1, while leading indicators suggest continued strength in Q2. A
stronger outlook for exports and investment coupled with improved sentiment
has led OE to upgrade its Eurozone GDP forecast again to an above-
consensus 2% for this year. Elsewhere in Europe, OE has also upgraded its
forecasts for the CEE economies significantly as economic activity continues to
benefit from stronger growth in the continent.
Emerging markets continue to benefit from a global upturn in trade and
industry, at the heart of which is a China-commodity nexus. OE finds that this
link will continue to support world growth in the near term, but the global upturn
is vulnerable to moderating Chinese growth and to a slippage in commodity
prices.
Summary of economic outlook, % change year ago*
UK 1.7% 1.6% 0.1% -4.1% 2.8% 1.4% 0.5% 0.1% 2.6% 2.0%
France 1.5% 1.1% -0.7% 0.0% 1.0% 1.5% 1.5% -0.4% 0.0% 1.0%
Germany 2.0% 1.3% -0.3% 0.0% 1.9% 1.6% 1.3% -0.1% 0.0% 2.1%
Netherlands 2.4% 1.3% -1.2% 0.0% 1.6% 1.9% 1.4% -0.1% 0.0% 1.5%
Italy 1.3% 1.1% -0.3% 0.0% 1.4% 1.0% 0.8% -0.4% 0.0% 1.3%
Russia 1.4% 1.0% 0.1% 16.7% 4.3% 1.4% 1.8% -0.1% -3.3% 4.1%
US 2.2% 2.5% -0.4% 0.5% 2.1% 2.7% 2.7% -0.1% -2.1% 1.9%
Canada 2.5% 2.9% -0.5% -0.2% 1.9% 2.0% 1.7% 0.1% -1.0% 1.9%
Brazil 0.4% -0.5% 1.7% 7.9% 3.9% 1.9% 1.4% -0.4% -7.7% 4.3%
China 6.6% 7.2% -0.1% -3.2% 1.5% 6.1% 6.9% 0.0% -3.3% 2.0%
Japan 1.4% 0.8% -0.3% -2.8% 0.5% 1.3% 0.7% -0.2% -5.4% 0.8%
India 6.9% 7.1% 0.1% 4.1% 3.9% 7.4% 8.4% 0.1% -0.3% 5.3%
Source: Tourism Economics
* Unless otherw ise specif ied
** Percentage point change
2017 2018
Country
*** Exchange rates measured against the euro. A positive change indicates stronger local currency against the euro and therefore a positive impact on
outbound tourism demand. A negative change indicates w eaker local currency against the euro and therefore a negative impact on outbound tourism
demand.
GDPConsumer
expenditure
Unemploy-
ment **
Exchange
rate***Inflation
Consumer
expenditure
Unemploy-
ment *
Exchange
rate***InflationGDP
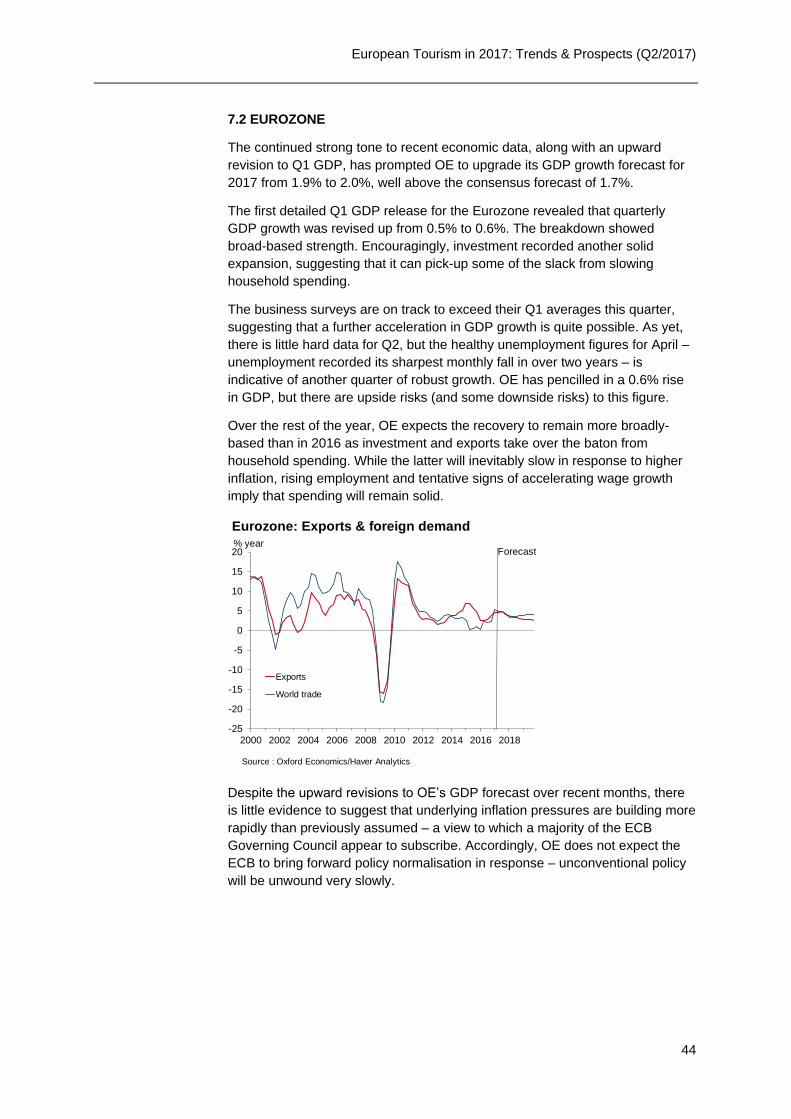
European Tourism in 2017: Trends & Prospects (Q2/2017)
44
7.2 EUROZONE
The continued strong tone to recent economic data, along with an upward
revision to Q1 GDP, has prompted OE to upgrade its GDP growth forecast for
2017 from 1.9% to 2.0%, well above the consensus forecast of 1.7%.
The first detailed Q1 GDP release for the Eurozone revealed that quarterly
GDP growth was revised up from 0.5% to 0.6%. The breakdown showed
broad-based strength. Encouragingly, investment recorded another solid
expansion, suggesting that it can pick-up some of the slack from slowing
household spending.
The business surveys are on track to exceed their Q1 averages this quarter,
suggesting that a further acceleration in GDP growth is quite possible. As yet,
there is little hard data for Q2, but the healthy unemployment figures for April –
unemployment recorded its sharpest monthly fall in over two years – is
indicative of another quarter of robust growth. OE has pencilled in a 0.6% rise
in GDP, but there are upside risks (and some downside risks) to this figure.
Over the rest of the year, OE expects the recovery to remain more broadly-
based than in 2016 as investment and exports take over the baton from
household spending. While the latter will inevitably slow in response to higher
inflation, rising employment and tentative signs of accelerating wage growth
imply that spending will remain solid.
Despite the upward revisions to OE’s GDP forecast over recent months, there
is little evidence to suggest that underlying inflation pressures are building more
rapidly than previously assumed – a view to which a majority of the ECB
Governing Council appear to subscribe. Accordingly, OE does not expect the
ECB to bring forward policy normalisation in response – unconventional policy
will be unwound very slowly.
-25
-20
-15
-10
-5
0
5
10
15
20
2000 2002 2004 2006 2008 2010 2012 2014 2016 2018
Exports
World trade
Source : Oxford Economics/Haver Analytics
Eurozone: Exports & foreign demand
% yearForecast
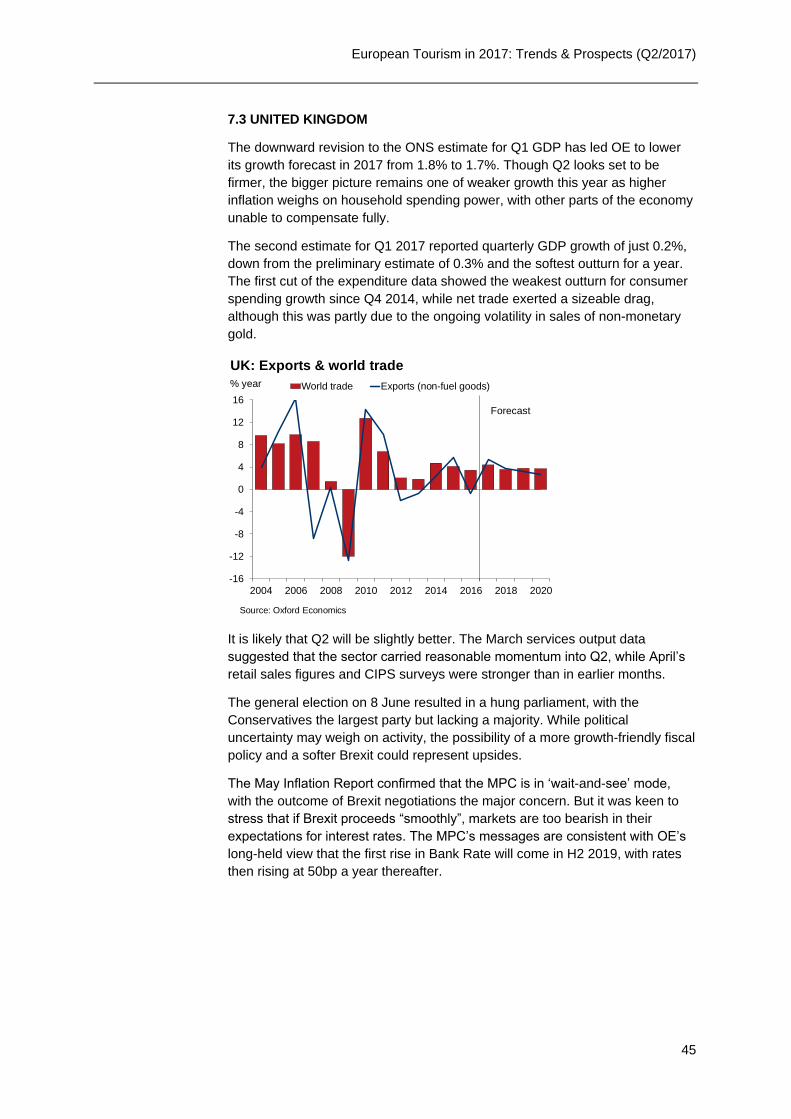
European Tourism in 2017: Trends & Prospects (Q2/2017)
45
7.3 UNITED KINGDOM
The downward revision to the ONS estimate for Q1 GDP has led OE to lower
its growth forecast in 2017 from 1.8% to 1.7%. Though Q2 looks set to be
firmer, the bigger picture remains one of weaker growth this year as higher
inflation weighs on household spending power, with other parts of the economy
unable to compensate fully.
The second estimate for Q1 2017 reported quarterly GDP growth of just 0.2%,
down from the preliminary estimate of 0.3% and the softest outturn for a year.
The first cut of the expenditure data showed the weakest outturn for consumer
spending growth since Q4 2014, while net trade exerted a sizeable drag,
although this was partly due to the ongoing volatility in sales of non-monetary
gold.
It is likely that Q2 will be slightly better. The March services output data
suggested that the sector carried reasonable momentum into Q2, while April’s
retail sales figures and CIPS surveys were stronger than in earlier months.
The general election on 8 June resulted in a hung parliament, with the
Conservatives the largest party but lacking a majority. While political
uncertainty may weigh on activity, the possibility of a more growth-friendly fiscal
policy and a softer Brexit could represent upsides.
The May Inflation Report confirmed that the MPC is in ‘wait-and-see’ mode,
with the outcome of Brexit negotiations the major concern. But it was keen to
stress that if Brexit proceeds “smoothly”, markets are too bearish in their
expectations for interest rates. The MPC’s messages are consistent with OE’s
long-held view that the first rise in Bank Rate will come in H2 2019, with rates
then rising at 50bp a year thereafter.
-16
-12
-8
-4
0
4
8
12
16
2004 2006 2008 2010 2012 2014 2016 2018 2020
World trade Exports (non-fuel goods)
Source: Oxford Economics
Forecast
UK: Exports & world trade
% year
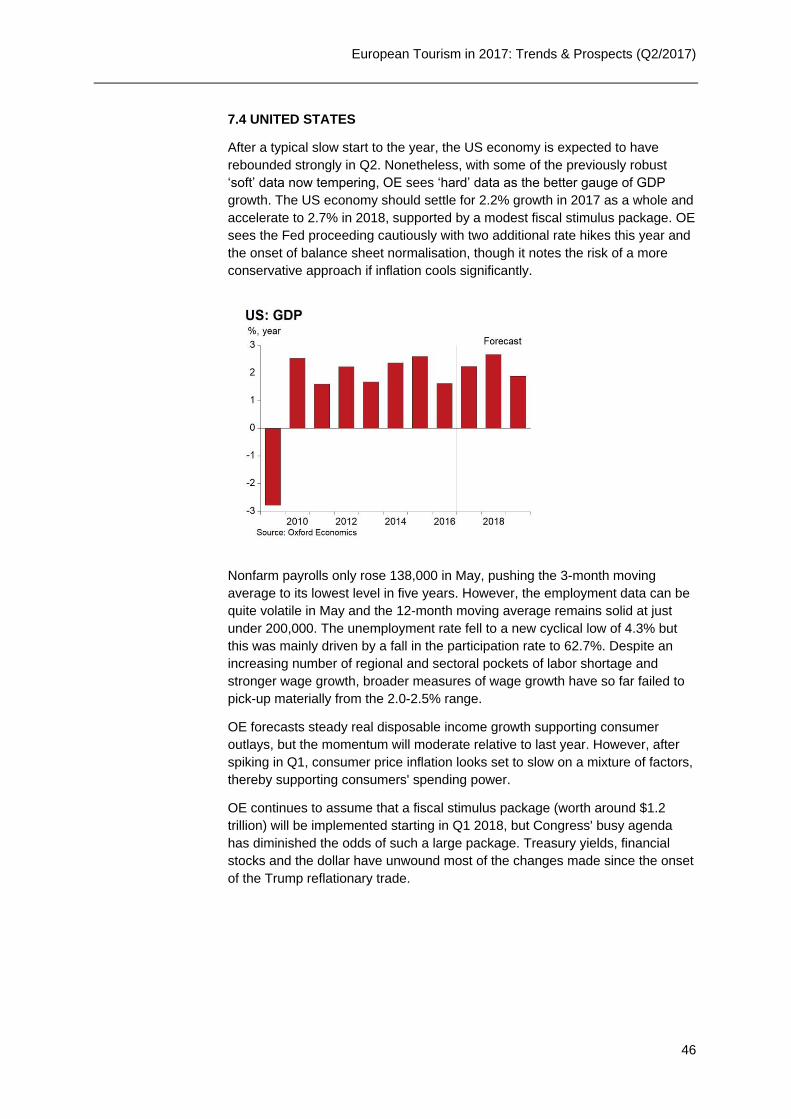
European Tourism in 2017: Trends & Prospects (Q2/2017)
46
7.4 UNITED STATES
After a typical slow start to the year, the US economy is expected to have
rebounded strongly in Q2. Nonetheless, with some of the previously robust
‘soft’ data now tempering, OE sees ‘hard’ data as the better gauge of GDP
growth. The US economy should settle for 2.2% growth in 2017 as a whole and
accelerate to 2.7% in 2018, supported by a modest fiscal stimulus package. OE
sees the Fed proceeding cautiously with two additional rate hikes this year and
the onset of balance sheet normalisation, though it notes the risk of a more
conservative approach if inflation cools significantly.
Nonfarm payrolls only rose 138,000 in May, pushing the 3-month moving
average to its lowest level in five years. However, the employment data can be
quite volatile in May and the 12-month moving average remains solid at just
under 200,000. The unemployment rate fell to a new cyclical low of 4.3% but
this was mainly driven by a fall in the participation rate to 62.7%. Despite an
increasing number of regional and sectoral pockets of labor shortage and
stronger wage growth, broader measures of wage growth have so far failed to
pick-up materially from the 2.0-2.5% range.
OE forecasts steady real disposable income growth supporting consumer
outlays, but the momentum will moderate relative to last year. However, after
spiking in Q1, consumer price inflation looks set to slow on a mixture of factors,
thereby supporting consumers' spending power.
OE continues to assume that a fiscal stimulus package (worth around $1.2
trillion) will be implemented starting in Q1 2018, but Congress' busy agenda
has diminished the odds of such a large package. Treasury yields, financial
stocks and the dollar have unwound most of the changes made since the onset
of the Trump reflationary trade.
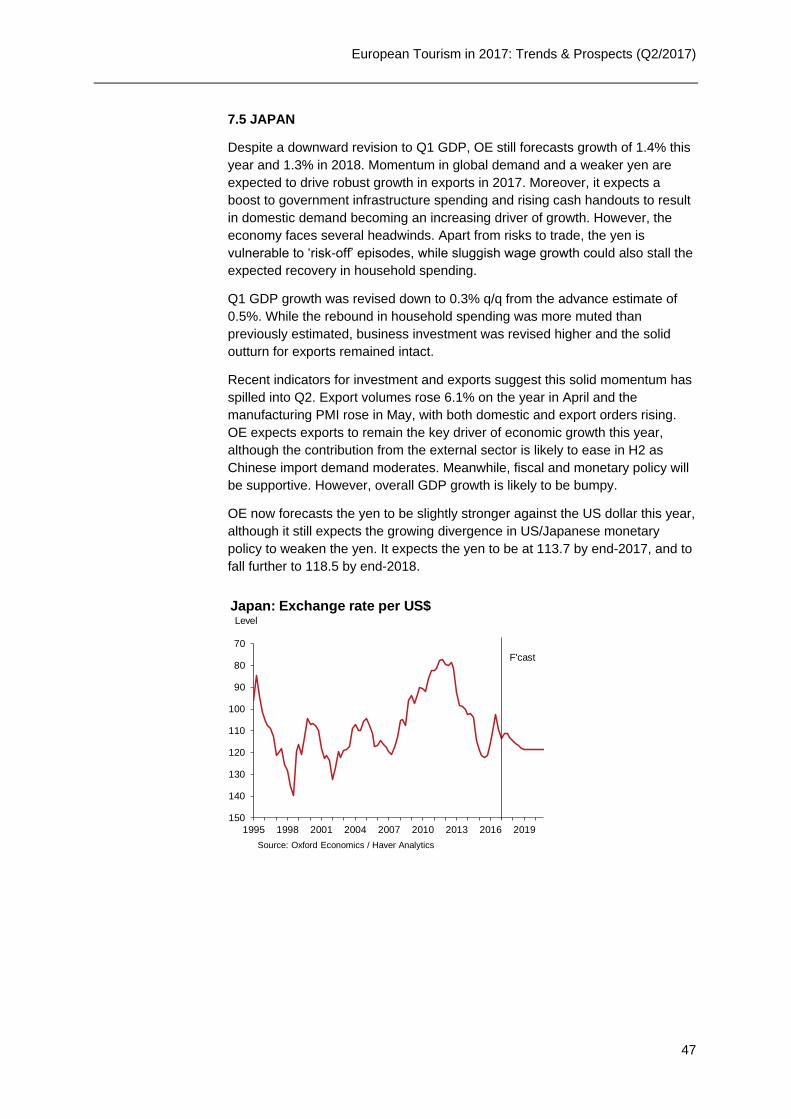
European Tourism in 2017: Trends & Prospects (Q2/2017)
47
7.5 JAPAN
Despite a downward revision to Q1 GDP, OE still forecasts growth of 1.4% this
year and 1.3% in 2018. Momentum in global demand and a weaker yen are
expected to drive robust growth in exports in 2017. Moreover, it expects a
boost to government infrastructure spending and rising cash handouts to result
in domestic demand becoming an increasing driver of growth. However, the
economy faces several headwinds. Apart from risks to trade, the yen is
vulnerable to ‘risk-off’ episodes, while sluggish wage growth could also stall the
expected recovery in household spending.
Q1 GDP growth was revised down to 0.3% q/q from the advance estimate of
0.5%. While the rebound in household spending was more muted than
previously estimated, business investment was revised higher and the solid
outturn for exports remained intact.
Recent indicators for investment and exports suggest this solid momentum has
spilled into Q2. Export volumes rose 6.1% on the year in April and the
manufacturing PMI rose in May, with both domestic and export orders rising.
OE expects exports to remain the key driver of economic growth this year,
although the contribution from the external sector is likely to ease in H2 as
Chinese import demand moderates. Meanwhile, fiscal and monetary policy will
be supportive. However, overall GDP growth is likely to be bumpy.
OE now forecasts the yen to be slightly stronger against the US dollar this year,
although it still expects the growing divergence in US/Japanese monetary
policy to weaken the yen. It expects the yen to be at 113.7 by end-2017, and to
fall further to 118.5 by end-2018.
70
80
90
100
110
120
130
140
150
1995 1998 2001 2004 2007 2010 2013 2016 2019
Source: Oxford Economics / Haver Analytics
Japan: Exchange rate per US$
F'cast
Level
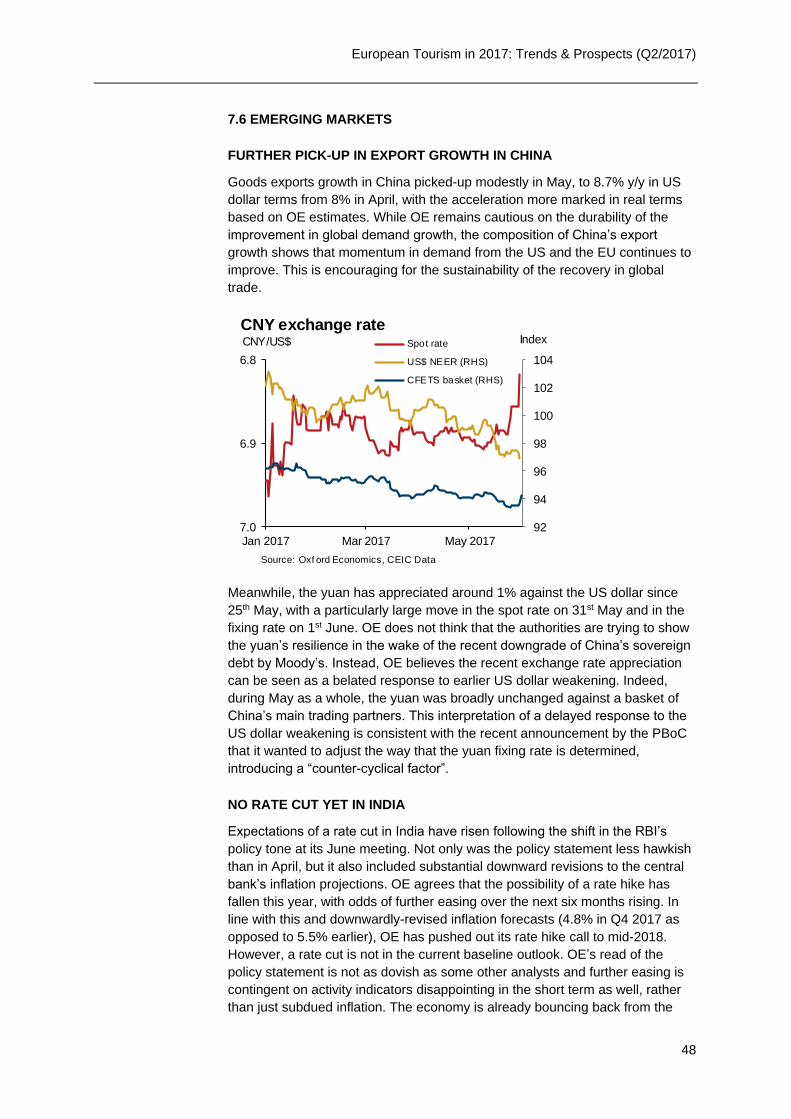
European Tourism in 2017: Trends & Prospects (Q2/2017)
48
7.6 EMERGING MARKETS
FURTHER PICK-UP IN EXPORT GROWTH IN CHINA
Goods exports growth in China picked-up modestly in May, to 8.7% y/y in US
dollar terms from 8% in April, with the acceleration more marked in real terms
based on OE estimates. While OE remains cautious on the durability of the
improvement in global demand growth, the composition of China’s export
growth shows that momentum in demand from the US and the EU continues to
improve. This is encouraging for the sustainability of the recovery in global
trade.
Meanwhile, the yuan has appreciated around 1% against the US dollar since
25th May, with a particularly large move in the spot rate on 31st May and in the
fixing rate on 1st June. OE does not think that the authorities are trying to show
the yuan’s resilience in the wake of the recent downgrade of China’s sovereign
debt by Moody’s. Instead, OE believes the recent exchange rate appreciation
can be seen as a belated response to earlier US dollar weakening. Indeed,
during May as a whole, the yuan was broadly unchanged against a basket of
China’s main trading partners. This interpretation of a delayed response to the
US dollar weakening is consistent with the recent announcement by the PBoC
that it wanted to adjust the way that the yuan fixing rate is determined,
introducing a “counter-cyclical factor”.
NO RATE CUT YET IN INDIA
Expectations of a rate cut in India have risen following the shift in the RBI’s
policy tone at its June meeting. Not only was the policy statement less hawkish
than in April, but it also included substantial downward revisions to the central
bank’s inflation projections. OE agrees that the possibility of a rate hike has
fallen this year, with odds of further easing over the next six months rising. In
line with this and downwardly-revised inflation forecasts (4.8% in Q4 2017 as
opposed to 5.5% earlier), OE has pushed out its rate hike call to mid-2018.
However, a rate cut is not in the current baseline outlook. OE’s read of the
policy statement is not as dovish as some other analysts and further easing is
contingent on activity indicators disappointing in the short term as well, rather
than just subdued inflation. The economy is already bouncing back from the
92
94
96
98
100
102
1046.8
6.9
7.0Jan 2017 Mar 2017 May 2017
IndexCNY/US$
CNY exchange rateSpot rate
US$ NEER (RHS)
CFETS basket (RHS)
Source: Oxf ord Economics, CEIC Data
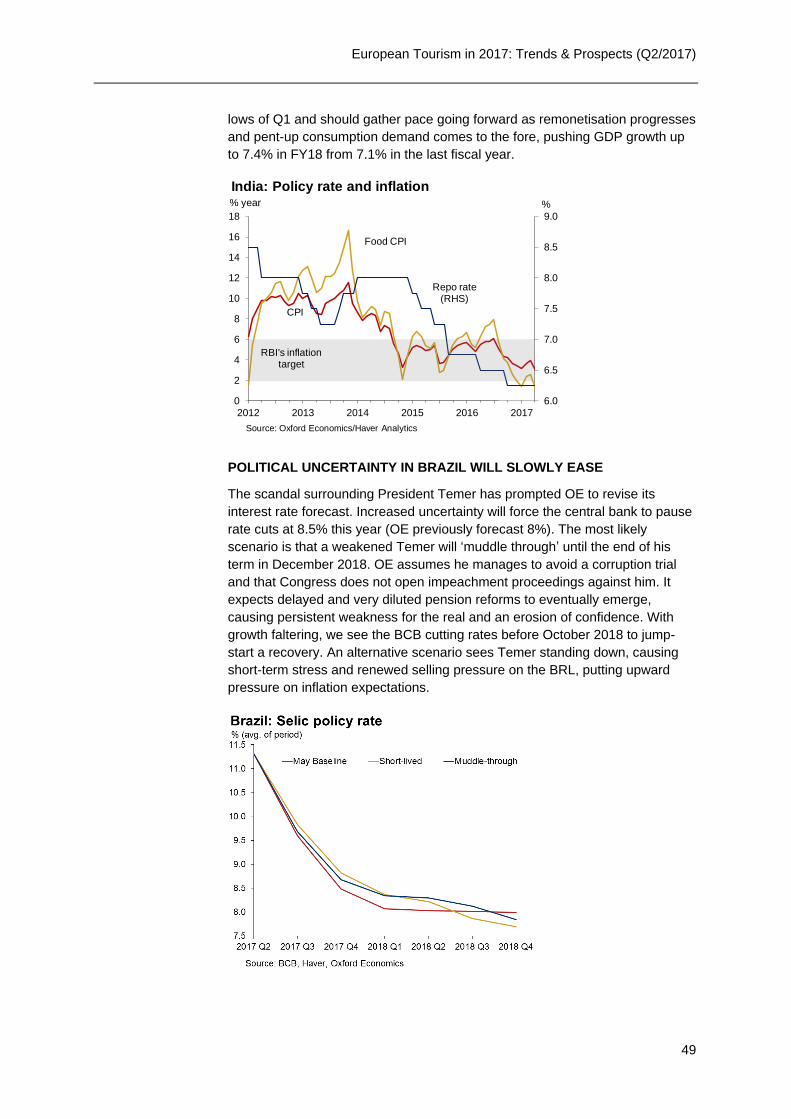
European Tourism in 2017: Trends & Prospects (Q2/2017)
49
lows of Q1 and should gather pace going forward as remonetisation progresses
and pent-up consumption demand comes to the fore, pushing GDP growth up
to 7.4% in FY18 from 7.1% in the last fiscal year.
POLITICAL UNCERTAINTY IN BRAZIL WILL SLOWLY EASE
The scandal surrounding President Temer has prompted OE to revise its
interest rate forecast. Increased uncertainty will force the central bank to pause
rate cuts at 8.5% this year (OE previously forecast 8%). The most likely
scenario is that a weakened Temer will ‘muddle through’ until the end of his
term in December 2018. OE assumes he manages to avoid a corruption trial
and that Congress does not open impeachment proceedings against him. It
expects delayed and very diluted pension reforms to eventually emerge,
causing persistent weakness for the real and an erosion of confidence. With
growth faltering, we see the BCB cutting rates before October 2018 to jump-
start a recovery. An alternative scenario sees Temer standing down, causing
short-term stress and renewed selling pressure on the BRL, putting upward
pressure on inflation expectations.
6.0
6.5
7.0
7.5
8.0
8.5
9.0
0
2
4
6
8
10
12
14
16
18
2012 2013 2014 2015 2016 2017
% year
Food CPI
Source: Oxford Economics/Haver Analytics
India: Policy rate and inflation
CPI
RBI's inflation target
Repo rate (RHS)
%
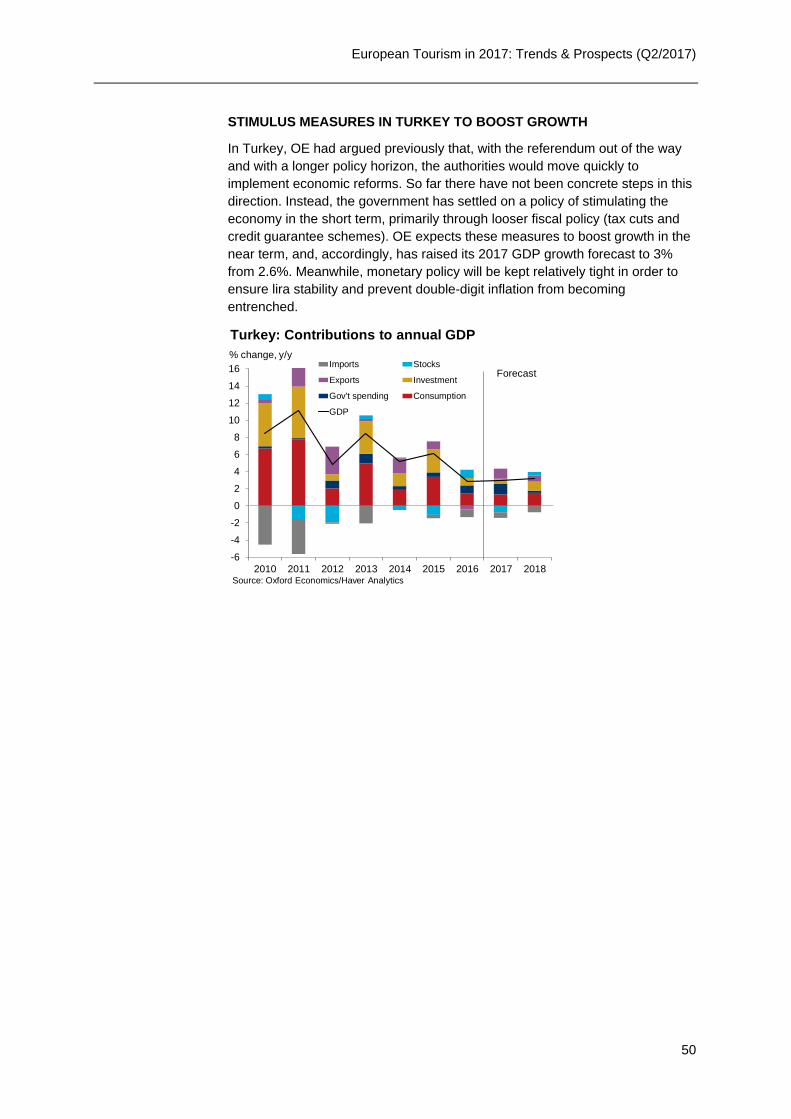
European Tourism in 2017: Trends & Prospects (Q2/2017)
50
STIMULUS MEASURES IN TURKEY TO BOOST GROWTH
In Turkey, OE had argued previously that, with the referendum out of the way
and with a longer policy horizon, the authorities would move quickly to
implement economic reforms. So far there have not been concrete steps in this
direction. Instead, the government has settled on a policy of stimulating the
economy in the short term, primarily through looser fiscal policy (tax cuts and
credit guarantee schemes). OE expects these measures to boost growth in the
near term, and, accordingly, has raised its 2017 GDP growth forecast to 3%
from 2.6%. Meanwhile, monetary policy will be kept relatively tight in order to
ensure lira stability and prevent double-digit inflation from becoming
entrenched.
-6
-4
-2
0
2
4
6
8
10
12
14
16
2010 2011 2012 2013 2014 2015 2016 2017 2018
Imports Stocks
Exports Investment
Gov't spending Consumption
GDP
Turkey: Contributions to annual GDP
Source: Oxford Economics/Haver Analytics
% change, y/y
Forecast
European Tourism in 2017: Trends & Prospects (Q2/2017)
51
8. APPENDIX 1
GLOSSARY OF COMMONLY USED TERMS AND ABBREVIATIONS
Airline industry indicators
ASK – Available Seat Kilometers. Indicator of airline supply, available seats x kilometers flown;
PLF – Passenger Load Factor. Indicator of airline capacity. Equal to revenue passenger
kilometers (RPK) / available seat kilometers (ASK);
RPK – Revenue Passenger Kilometers. Indicator of airline demand, paying passenger x
kilometers flown;
3mth mav – Three month moving average.
Hotel industry indicators
ADR – Average Daily Rate. Indicator of hotel room pricing, equal to hotel room revenue /
rooms sold in a given period;
Occ – Occupancy Rate. Indicator of hotel performance, equal to the number of hotel rooms
sold / room supply;
RevPAR – Revenue per Available Room. Indicator of hotel performance, equal to hotel room
revenue / rooms available in a given period.
Central Banks
BoE – Bank of England;
MPC – Monetary Policy Committee of BoE;
BoJ – Bank of Japan;
ECB – European Central Bank;
Fed – Federal Reserve (US);
RBI – Reserve Bank of India;
OBR – Office for Budget Responsibility;
PBoC – People’s Bank of China.
Economic indicators and terms
BP – Basis Point. A unit equal to one hundredth of a percentage point;
Broad money – Key indicator of money supply and liquidity including currency holdings as
well as bank deposits that can easily be converted to cash;
European Tourism in 2017: Trends & Prospects (Q2/2017)
52
CPI – Consumer Price Index. Measure of price inflation for consumer goods;
FDI – Foreign Direct Investment. Investment form one country into another, usually by
companies rather than governments;
GDP – Gross Domestic Product. The value of goods and services produced in a given
economy;
LCU – Local Currency Unit. The national unit of currency of a given country, e.g., pound, euro,
etc.;
PMI – Purchasing Managers’ Index. Indicator of producers’ sentiment and the direction of the
economy;
PPI – Purchase Price Index. Measure of inflation of input prices to producers of goods and
services;
PPP – Purchasing Power Parity. An implicit exchange rate which equalises the price of
identical goods and services in different countries so they can be expressed with a common
price;
QE – Quantitative Easing. Expansionary monetary policy pursued by central banks involving
asset purchases to reduce bond yields and increase liquidity in capital markets;
G7 – Group of seven industrialised countries comprising the United States, the United
Kingdom, France, Germany, Italy, Canada, and Japan.
European Tourism in 2017: Trends & Prospects (Q2/2017)
53
9. APPENDIX 2
ETC MEMBER ORGANISATIONS
Austria – Austrian National Tourist Office (ANTO)
Belgium: Flanders – Tourism Flanders
Wallonia – Wallonie-Belgique Tourisme (WBT)
Bulgaria – Bulgarian Ministry of Tourism
Croatia – Croatian National Tourist Board (CNTB)
Cyprus – Cyprus Tourism Organisation (CTO)
Czech Republic – CzechTourism
Denmark – VisitDenmark
Estonia – Estonian Tourist Board - Enterprise Estonia
Finland – Visit Finland – Finpro Ry
Germany – German National Tourist Board (GNTB)
Greece – Greek National Tourism Organisation (GNTO)
Hungary – Hungarian Tourism Ltd.
Iceland – Icelandic Tourist Board
Ireland – Fáilte Ireland and Tourism Ireland Ltd.
Italy – Italian Government Tourist Board
Latvia – Latvian Tourism Development Agency (TAVA)
Lithuania – Lithuanian State Department of Tourism
Luxembourg – Luxembourg for Tourism (LFT)
Malta – Malta Tourism Authority (MTA)
Monaco – Monaco Government Tourist and Convention Office
Montenegro – National Tourism Organisation of Montenegro
Norway – Innovation Norway
Poland – Polish Tourist Organisation (PTO)
Portugal – Turismo de Portugal, I.P.
Romania – Romanian Ministry of Tourism
San Marino – State Office for Tourism
Serbia – National Tourism Organisation of Serbia (NTOS)
Slovakia – Ministry of Transport and Construction of the Slovak Republic
Slovenia – Slovenian Tourist Board
Spain – Turespaña - Instituto de Turismo de España
Switzerland – Switzerland Tourism
Turkey – Ministry of Culture and Tourism


