MA – NANA PACIFIC PALISADES PEARL CITY PEARL CITY UPLANDS WAIMANO AND PARTS OF: CRESTVIEW SEAVIEW WAIAU WAIAWA CENTER ON THE FAMILY Aloha United Way EARL CITY AREA P C O M M U N I T Y P R O F I L E
Transcript
MA–
NANA
PACIFIC PALISADES
PEARL CITY
PEARL CITY UPLANDS
WAIMANO
AND PARTS OF:
CRESTVIEW
SEAVIEW
WAIAU
WAIAWA
CENTER
ON THE
FAMILYAloha United Way
EARL CITY AREAPC O M M U N I T Y P R O F I L E
This area, with almost 49,000 residents, includes the neighborhoods of Pearl City, PacificPalisades, Waimano, and parts of Waiawa and Waiau. The median age of 38.5 is higher than the
State average, reflecting the lower percentage of the population that is age 19 or younger in this com-munity and the higher percentage of adults ages 20 and above. More than 50% of the residents in thePearl City Area are Asian, primarily Japanese or Filipino, but this area also has some of the highestconcentrations of African American residents in the State. About 15% of the residents identify them-selves as Hawaiian or Part-Hawaiian.
The per capita income in the Pearl City Area is slightly higher than the County and State averages,as is the percentage of home ownership. The unemployment rate is lower than in most communities.In a Statewide student survey, about two-thirds of the adolescents responding in this communityreported strong neighborhood ties. Although a higher proportion of parents here, compared to othercommunities, believe their schools are safe, only about one-third of the 8th graders in a Departmentof Education survey reported feeling safe at school.
The data for other indicators of child and family well-being in the Pearl City Area are similar to, orbetter than, the State averages. Most children have health insurance coverage. Proportionally moreparents here than in other communities report that they help their children with homework and stayinvolved with the schools in other ways as well. The 3rd graders in this area do very well on theirSAT scores. School attendance is very good, and the percent of high school seniors in the Pearl CityArea with plans for college is the second-highest in the State.
EARL CITY AREAP
NTRODUCTIONIHawai‘i no– ka ‘oi—Hawai‘i the best—is a sentiment shared by many people in our island
state. Those who have left and yearn to return home speak movingly about missing the bestbeaches in the world, delicious local grinds found no-where else, a mix of ethnicities at
school, play, and work, and the aloha spirit that infuses even the smallest act. There are so manyother things we can point to with pride:
• Hawai‘i has the lowest rates of child deaths and teen deaths in the nation
• Life expectancy is higher in Hawai‘i than anywhere else in the nation
• Three-fourths of Hawai‘i’s families eat dinner together 5 or more times a week
• More than 80% of Hawai‘i’s people feel they can rely on others in their community for help
• The average donation to charity is higher in Hawai‘i at every income level when compared to mainland giving.
There are, of course, many serious problems that require our attention and action. Some of thesemay seem monumental and insurmountable, such as the problem of drug abuse, but Hawai‘i’s people, working together, have overcome major obstacles in the past and can do so in the future.
This is one of 43 community profiles developed by the Center on the Family that can be used as aresource to improve conditions for children and families in your neighborhood. The profiles providedata and information about the people who live in specific geographic areas encompassed by a public high school and all of its feeder intermediate and elementary schools. Factual informationprovides a good starting point for making informed decisions and plans for strategic action. We hopethat this first-ever presentation of data at the school/community-complex level will provide you witha better understanding of your community and spur you to take action to keep Hawai‘i no– ka ‘oi.
PEARL CITYAREA
48,86138.5
79.8%16.3%2.7%
53.2%3.7%
14.2%28.2%1.6%5.6%2.2%4.0%
15.4%21.4%
POPULATION BY AGE
Under 5
5 - 19
20 - 34
35 - 64
65 and over
85 and over
0% 10% 20% 30% 40% 50%
ETHNICITY
Caucasian
African-American
Chinese
Filipino
Japanese
Korean
Other Asian & Asian combinations
Native Hawaiian
Native Hawaiian in combination
Other Pacific Islander
Other or multi-racial
0% 5% 10% 15% 20% 25% 30%
Pearl City AreaState of Hawai‘i
Pearl City AreaState of Hawai‘i
Management &Professional
24.9%
Service15.2%
Sales & Office28.7%
Construction, Extraction& Maintenance
8.2%
Production,Transportation & Moving
7.5%
Armed Forces15.2%
Farming, Fishing &Forestry
0.2%
YOUR NEIGHBORS AT WORK
Total PopulationMedian age
EMOGRAPHICSDHONOLULU
COUNTYSTATE
OF HAWAI‘I
Percent choosing only 1 race Caucasian African-American Asian:
Chinese Filipino Japanese Korean Other Asian and Asian combinations
Other Pacific Islander Native HawaiianNative Hawaiian alone or in combination with 1 or more other racesSome other race or choosing 2 or more races
876,15635.7
80.1%21.3%2.4%
46.0%6.1%
14.2%18.4%2.5%4.9%3.2%5.6%
17.5%21.2%
1,211,53736.2
78.6%24.3%1.8%
41.6%4.7%
14.1%16.7%1.9%4.2%2.8%6.6%
19.8%22.7%
RACE AND ETHNICITY
Number of familiesFamilies with children under age 18Families with children, headed by married coupleAverage household sizeAdolescents reporting close family ties Parents report checking child’s homework andother public school involvementAdolescents reporting poor parental supervision Parents feeling positive about students’ safetyPersons receiving Temporary Assistance to NeedyFamilies (TANF)Families receiving food stampsPopulation ages 21-64 with disabilitiesHouseholds lacking telephone service
205,67244.3%77.4%
3.045.0%
63.9%45.7%68.7%
5.0%12.2%16.8%1.7%
287,06845.0%74.8%
2.946.2%
63.2%46.3%66.8%
5.4%13.2%17.7%2.0%
AMILYF
Per capita incomeHome ownership - owner occupied housing unitsResidential stability - lived in same house from1995-2000Residents who are U.S. citizens born in HawaiiNew immigrants - foreign-born residents whoentered Hawaii since 1990Residents over age 5 with language other thanEnglish at homePopulation over age 16 in the labor forceCivilian UnemploymentAdults with high school diploma or higherAdults with Bachelor's Degree or higherAdolescents reporting unsafe neighborhoodsAdolescents lacking close neighborhood ties Teachers with 5+ years at their schoolTeachers with advanced degreesTeachers reporting a safe school environment
$21,99854.6%
56.3%55.8%
6.5%
28.9%447,320
6.2%84.8%27.9%45.8%38.7%68.3%17.9%67.7%
$21,52656.5%
56.8%56.9%
6.0%
26.6%612,773
6.3%84.6%26.2%43.9%38.6%66.4%19.1%68.2%
OMMUNITYCHONOLULU
COUNTYSTATE
OF HAWAI‘I
HONOLULUCOUNTY
STATEOF HAWAI‘I
**
*
*
*These data represent responses from 6th, 8th, 10th, and 12th graders from both public and privateschools. Many communities had a higher proportion of young respondents and some communitieshad a low response rate overall. Age and sample size may affect the results.
11,66938.6%78.8%
3.145.3%
65.0%44.1%72.9%
3.5%8.6%
14.7%0.5%
$22,35967.2%
64.1%64.0%
3.4%
23.9%27,206
5.6%88.0%22.8%45.4%33.2%71.2%16.5%68.2%
PEARL CITYAREA
PEARL CITYAREA
80%70%60%50%40%30%20%10%0% Teachers Parents Students
SCHOOL SAFETY PERCEPTIONS
Pearl City AreaState of Hawai‘i
Percent of teachers, parents, and students whoreport their schools are safe
30%
25%
20%
15%
10%
5%
0%Unemployment
RatePersons
ReceivingTANF
FamiliesReceiving Food
Stamps
Pearl City AreaState of Hawai‘i
ECONOMIC INDICATORS
94.5%7
13.4%66.6%
72.9%28.3%
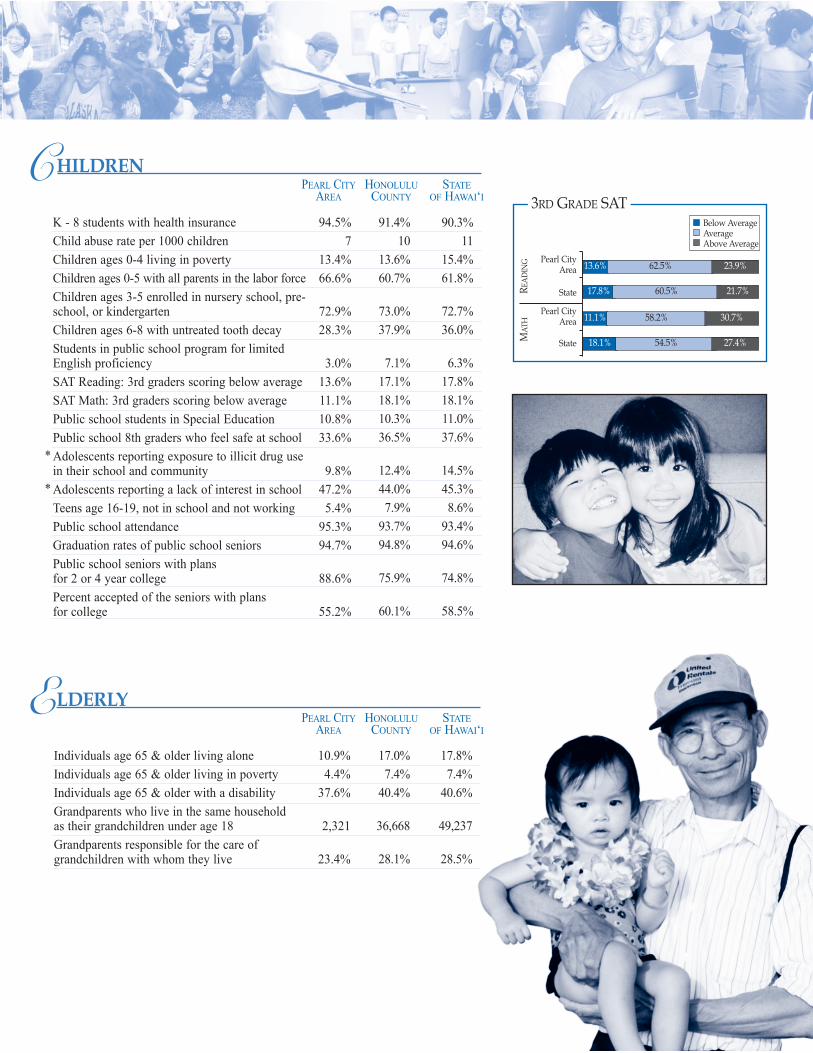
3.0%13.6%11.1%10.8%33.6%
9.8%47.2%5.4%
95.3%94.7%
88.6%
55.2%
PEARL CITYAREA
10.9%4.4%
37.6%
2,321
23.4%
PEARL CITYAREA
Pearl CityArea
State
Pearl CityArea
State
Below AverageAverageAbove Average
3RD GRADE SAT
MAT
HRE
AD
ING 13.6% 62.5% 23.9%
17.8% 60.5% 21.7%
11.1% 58.2% 30.7%
18.1% 54.5% 27.4%
K - 8 students with health insuranceChild abuse rate per 1000 childrenChildren ages 0-4 living in povertyChildren ages 0-5 with all parents in the labor forceChildren ages 3-5 enrolled in nursery school, pre-school, or kindergartenChildren ages 6-8 with untreated tooth decayStudents in public school program for limitedEnglish proficiencySAT Reading: 3rd graders scoring below average SAT Math: 3rd graders scoring below average Public school students in Special EducationPublic school 8th graders who feel safe at schoolAdolescents reporting exposure to illicit drug usein their school and community Adolescents reporting a lack of interest in schoolTeens age 16-19, not in school and not workingPublic school attendanceGraduation rates of public school seniorsPublic school seniors with plans for 2 or 4 year college Percent accepted of the seniors with plans for college
91.4%10
13.6%60.7%
73.0%37.9%
7.1%17.1%18.1%10.3%36.5%
12.4%44.0%7.9%
93.7%94.8%
75.9%
60.1%
90.3%11
15.4%61.8%
72.7%36.0%
6.3%17.8%18.1%11.0%37.6%
14.5%45.3%8.6%
93.4%94.6%
74.8%
58.5%
HILDRENCHONOLULU
COUNTYSTATE
OF HAWAI‘I
Individuals age 65 & older living aloneIndividuals age 65 & older living in povertyIndividuals age 65 & older with a disabilityGrandparents who live in the same household as their grandchildren under age 18Grandparents responsible for the care of grandchildren with whom they live
17.0%7.4%
40.4%
36,668
28.1%
17.8%7.4%
40.6%
49,237
28.5%
LDERLYEHONOLULU
COUNTYSTATE
OF HAWAI‘I
*
*
CENTER
ON THE
FAMILY
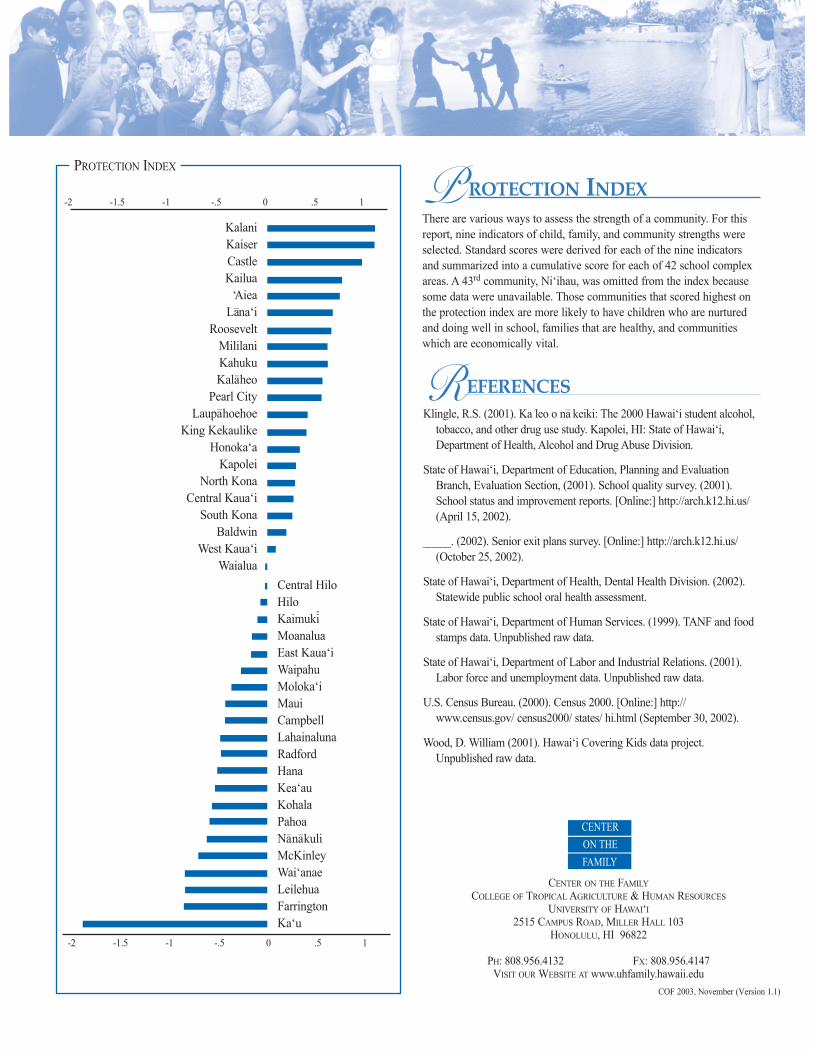
There are various ways to assess the strength of a community. For thisreport, nine indicators of child, family, and community strengths wereselected. Standard scores were derived for each of the nine indicatorsand summarized into a cumulative score for each of 42 school complexareas. A 43rd community, Ni‘ihau, was omitted from the index becausesome data were unavailable. Those communities that scored highest onthe protection index are more likely to have children who are nurturedand doing well in school, families that are healthy, and communitieswhich are economically vital.
ROTECTION INDEXP
Klingle, R.S. (2001). Ka leo o na– keiki: The 2000 Hawai‘i student alcohol,tobacco, and other drug use study. Kapolei, HI: State of Hawai‘i,Department of Health, Alcohol and Drug Abuse Division.
State of Hawai‘i, Department of Education, Planning and EvaluationBranch, Evaluation Section, (2001). School quality survey. (2001).School status and improvement reports. [Online:] http://arch.k12.hi.us/(April 15, 2002).