Page 1
ii | P a g e P e a r s o n I n f o r m 5 . 1 E d u c a t i o n I n t e l l i g e n c e Copyright © 2009 Pearson Education, Inc. or its affiliate(s). All rights reserved. Contact NCS Pearson, Inc., Educational Assessment, San Antonio, Texas; 1-800-228-0752.
Pearson Inform 5.1
User Guide
Differences between the Primary Dashboard and the Student Dashboard Date: 1/26/2010
Copyright © 2009 Pearson Education, Inc. or its affiliate(s).
All rights reserved. No part of this publication may be reproduced or transmitted in any form or by any means, electronic or
mechanical, including photocopy, recording, or any information storage and retrieval system, without permission in writing from the
copyright owner. Contact NCS Pearson, Inc., Educational Assessment, San Antonio, Texas; 1-800-228-0752.
“Pearson,” the Pearson logo and "Pearson Inform" are trademarks of Pearson Education, Inc. or its affiliate(s) in the U.S. and/or
other countries.
Page 2
Table of Contents 1 THE STUDENT DASHBOARD ........................................................................................................................3
1.1 STUDENT SEARCH..........................................................................................................................................3 1.2 STUDENT DASHBOARD TABS.........................................................................................................................6 1.3 STUDENT COMPOSITE VIEW PANES .............................................................................................................12
2 THE PRIMARY DASHBOARD......................................................................................................................15
2.1 DASHBOARD TABS AND ICONS ....................................................................................................................15 2.2 TOOLBAR.....................................................................................................................................................16 2.3 SETTING UP THE DASHBOARD DEFAULT VIEW ............................................................................................18 2.4 DASHBOARDS, DYNAMIC REPORTS & STATIC REPORTS..............................................................................21
Page 3
3 | P a g e P e a r s o n I n f o r m 5 . 1 E d u c a t i o n I n t e l l i g e n c e Copyright © 2009 Pearson Education, Inc. or its affiliate(s). All rights reserved. Contact NCS Pearson, Inc., Educational Assessment, San Antonio, Texas; 1-800-228-0752.
1 The Student Dashboard
1.1 Student Search
To Conduct a Student Search from the Student Dashboard:
Click the Student Dashboard icon on the toolbar.
Figure 1-1
The Student Dashboard will display.
Figure 1-2
Click the Student Search icon on the toolbar.
Figure 1-3
Page 4
The Student Search pop-up window displays.
Figure 1-4
Conduct a basic student search by clicking on a letter in the alphabetical list displayed. For example, click the link for the letter B.
A list of student names displays.
Figure 1-5
Click on a students name in the list.
Page 5
5 | P a g e P e a r s o n I n f o r m 5 . 1 E d u c a t i o n I n t e l l i g e n c e Copyright © 2009 Pearson Education, Inc. or its affiliate(s). All rights reserved. Contact NCS Pearson, Inc., Educational Assessment, San Antonio, Texas; 1-800-228-0752.
The Student Composite View displays:
Figure 1-6
From the Student Composite View you are able to view the following data:
o Student Assessment Profile
o AIP
o Student Test History
o Charts/Graphs – Student AIP Profile
o Group & Intervention History
o Parent/Student Responsibilities
o Course Grades
NOTE: The aligned Instructional Resources and Learning Standards can be viewed from the
Student Assessment Profile. To view, click on a color-coded bar in the graph and the pop-up box
will display.
Figure 1-7
Page 6
NOTE: The Group & Intervention History and Parent/Student Responsibilities panes may generate
out of screenshot. To view the panes in their entirety, minimize the other panes and
maximize the panes you wish to see.
1.2 Student Dashboard Tabs
There are five main tabs used in the Student Dashboard to view student data:
Student Assessment Profile View
Click the Student Assessment Profile View icon.
The Student Assessment Profile displays in the Student Dashboard.
Figure 1-8
The following Chart Controls are accessible:
o View in Chart
o View as Table
o View in Criteria
o Query Controls
o More Chart Info
o Print/PDF – View as PDF and print.
Student Dashboard
Tabs
Page 7
7 | P a g e P e a r s o n I n f o r m 5 . 1 E d u c a t i o n I n t e l l i g e n c e Copyright © 2009 Pearson Education, Inc. or its affiliate(s). All rights reserved. Contact NCS Pearson, Inc., Educational Assessment, San Antonio, Texas; 1-800-228-0752.
AIP View
Click the AIP View icon.
The AIP View displays in the Student Dashboard.
Figure 1-9
Select the applicable AIP from the drop-down menu. The contents of your screen will
automatically update based on your selection.
o NOTE: You can also click the Refresh icon to update the contents of the AIP
pane. Clicking on the Refresh Icon will run a new query of the database to
update the contents of the student’s AIP.
Click the Educator’s Comment icon to add comments regarding AIPs.
Page 8
The Add Educator Comment pop-up window displays.
Figure 1-10
o Enter the applicable comments and click the Save button.
o Click the New button to add additional comments.
In the Parent/Student Responsibilities section, click to add a goal.
o The Add Goal pop-up window displays.
Figure 1-11
o Enter your goal details and click the Save button.
Page 9
9 | P a g e P e a r s o n I n f o r m 5 . 1 E d u c a t i o n I n t e l l i g e n c e Copyright © 2009 Pearson Education, Inc. or its affiliate(s). All rights reserved. Contact NCS Pearson, Inc., Educational Assessment, San Antonio, Texas; 1-800-228-0752.
Score Entry View
In order to do manual score entry, assessments must be defined in advance using the assessment
management tools.
NOTE: If necessary, change your context to Teacher in order to access the Score Entry View.
Click the Score Entry View icon.
The Year and Grade Level buttons display.
Figure 1-12
Select the applicable drop-down menu option for each.
The Test button displays.
Figure 1-13
Select the applicable test, e.g., [BOY] AIMSWeb.
The Score Entry View page displays for the applicable test.
Figure 1-14
Page 10
Click the Edit All Scores icon located in the Student Dashboard above the First Name
column to change scores for the respective students. The locked icon changes to the
unlocked edit icon above each applicable column.
Click on the assessment score field for a student in the list to modify/enter the score.
Upon completing the required edits, click the Lock All Scores icon located in the Student
Dashboard above the First Name column.
Student Course Grade View
Click the Course Grades View icon.
The Course Grades pane displays in the Student Dashboard.
Figure 1-15
Scroll over each section of the pane to view details.
Click the column headers to change the sort order.
Click the Print/PDF icon to print the Course Grades pane.
Student Composite View
Click the Student Composite View icon.
Page 11
11 | P a g e P e a r s o n I n f o r m 5 . 1 E d u c a t i o n I n t e l l i g e n c e Copyright © 2009 Pearson Education, Inc. or its affiliate(s). All rights reserved. Contact NCS Pearson, Inc., Educational Assessment, San Antonio, Texas; 1-800-228-0752.
The Student Composite View pane displays in the Student Dashboard.
Figure 1-16
From the Student Composite View you are able to view the following data:
o Student Assessment Profile
o AIP
o Student Test History
o Charts/Graphs – Student AIP Profile
o Group & Intervention History
o Parent/Student Responsibilities
o Course Grades
NOTE: The aligned Instructional Resources and Learning Standards can be viewed from the
Student Assessment Profile. To view, click on a color-coded bar in the graph and the pop-up box
will display.
Figure 1-17
Page 12
NOTE: The Group & Intervention History and Parent/Student Responsibilities panes may generate
out of screenshot. To view the panes in their entirety, minimize the other panes and
maximize the panes you wish to see.
1.3 Student Composite View Panes
There are several panes, icons, and features that comprise the Student Composite View. Let’s take
a look at each section of the Student Composite View:
Student Assessment Profile:
o Click the Chart Controls Toolbar icons to control your view of the
student’s data.
o Click on a color-coded bar in the graph to access the aligned Instructional
Resources and Learning Standards. (See Figure 1‐7)
Academic Improvement Plan (AIP):
o Scroll over each section of the AIP pane to view details, e.g., Student Test History,
Parent/Student Responsibilities, etc.
Figure 1-18
o Click the Refresh icon to update the contents of the AIP pane if you make any
modifications.
Page 13
13 | P a g e P e a r s o n I n f o r m 5 . 1 E d u c a t i o n I n t e l l i g e n c e Copyright © 2009 Pearson Education, Inc. or its affiliate(s). All rights reserved. Contact NCS Pearson, Inc., Educational Assessment, San Antonio, Texas; 1-800-228-0752.
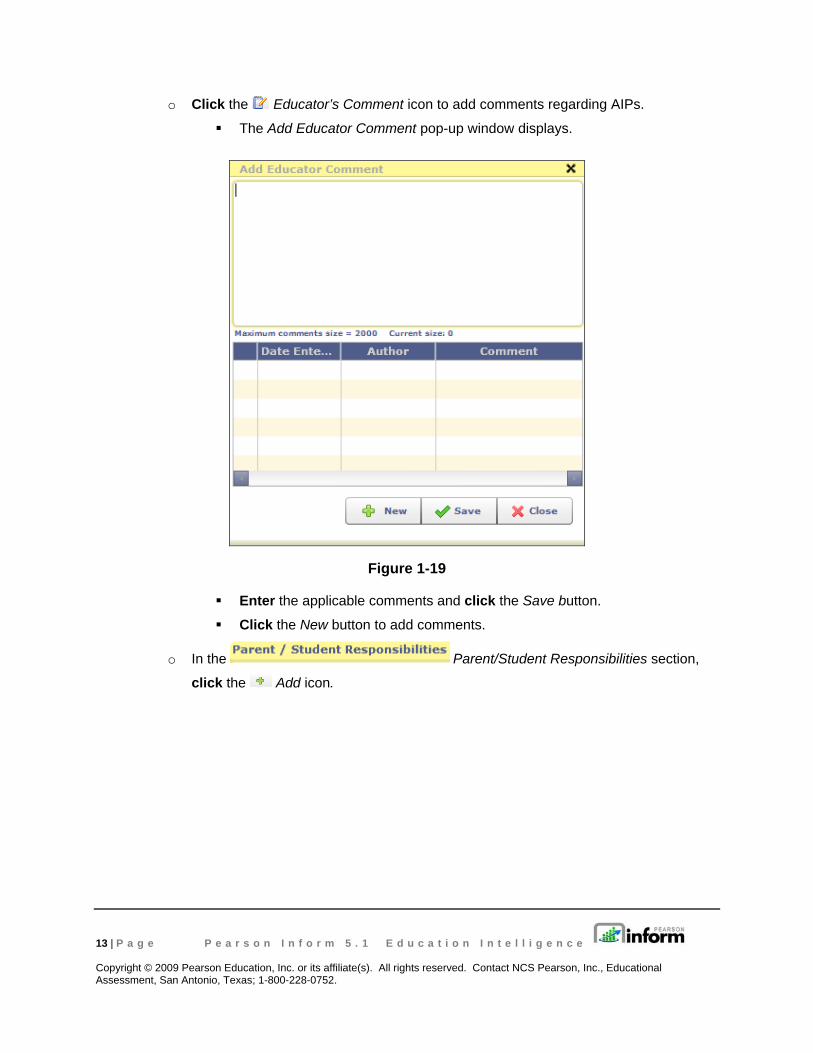
o Click the Educator’s Comment icon to add comments regarding AIPs.
The Add Educator Comment pop-up window displays.
Figure 1-19
Enter the applicable comments and click the Save button.
Click the New button to add comments.
o In the Parent/Student Responsibilities section, click the Add icon.
Page 14
The Add Goal pop-up window displays.
Figure 1-20
Enter/select the applicable goal details and click the Save button.
o Scroll over and review the details of the Student Test
History section.
o Scroll over and review the details of the Charts/Graphs – Student AIP Profile section.
o Scroll over and review the details of the Group &
Intervention History section.
o Scroll over and review the details of the Course Grades section.
Figure 1-21
Page 15
15 | P a g e P e a r s o n I n f o r m 5 . 1 E d u c a t i o n I n t e l l i g e n c e Copyright © 2009 Pearson Education, Inc. or its affiliate(s). All rights reserved. Contact NCS Pearson, Inc., Educational Assessment, San Antonio, Texas; 1-800-228-0752.
2 The Primary Dashboard
2.1 Dashboard Tabs and Icons The Dashboard Tabs allow end users to quickly move around in the system and open different
pages where the end user can view and remove existing reports; create dashboards, queries, and
reports; look up student information and scores; receive system messages; create AIPs; specify
intervention groups; and look up proficiency profiles.
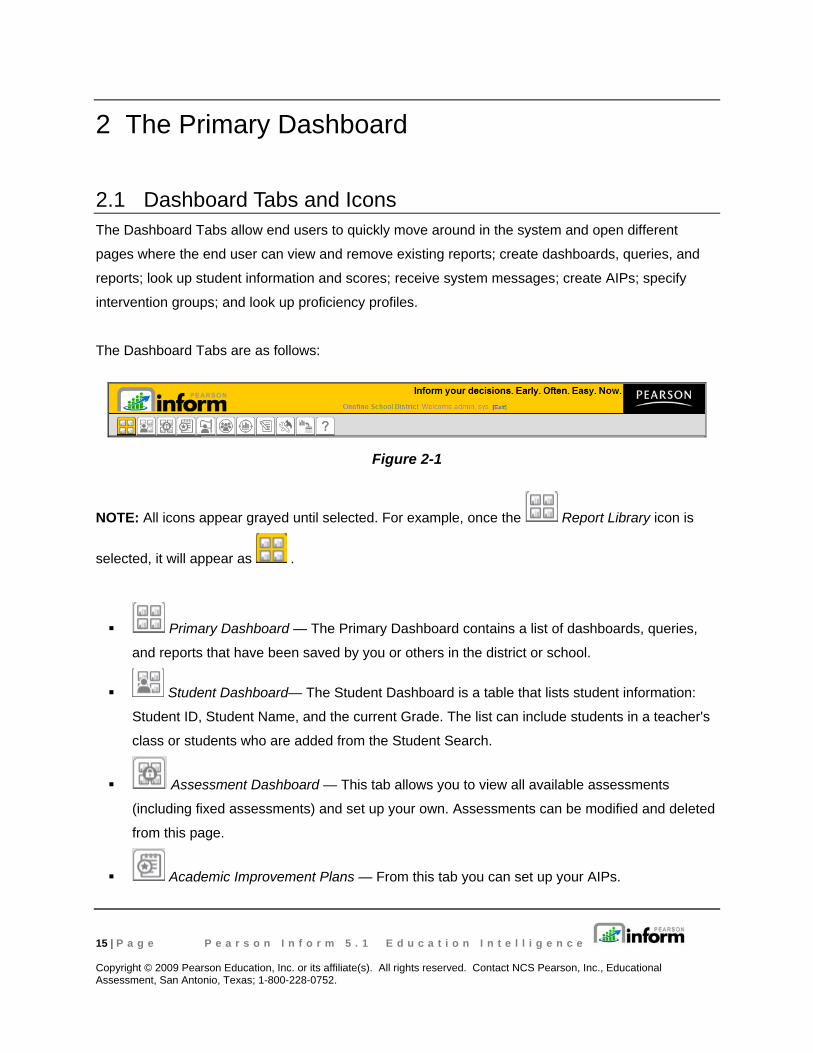
The Dashboard Tabs are as follows:
Figure 2-1
NOTE: All icons appear grayed until selected. For example, once the Report Library icon is
selected, it will appear as .
Primary Dashboard — The Primary Dashboard contains a list of dashboards, queries,
and reports that have been saved by you or others in the district or school.
Student Dashboard— The Student Dashboard is a table that lists student information:
Student ID, Student Name, and the current Grade. The list can include students in a teacher's
class or students who are added from the Student Search.
Assessment Dashboard — This tab allows you to view all available assessments
(including fixed assessments) and set up your own. Assessments can be modified and deleted
from this page.
Academic Improvement Plans — From this tab you can set up your AIPs.
Page 16
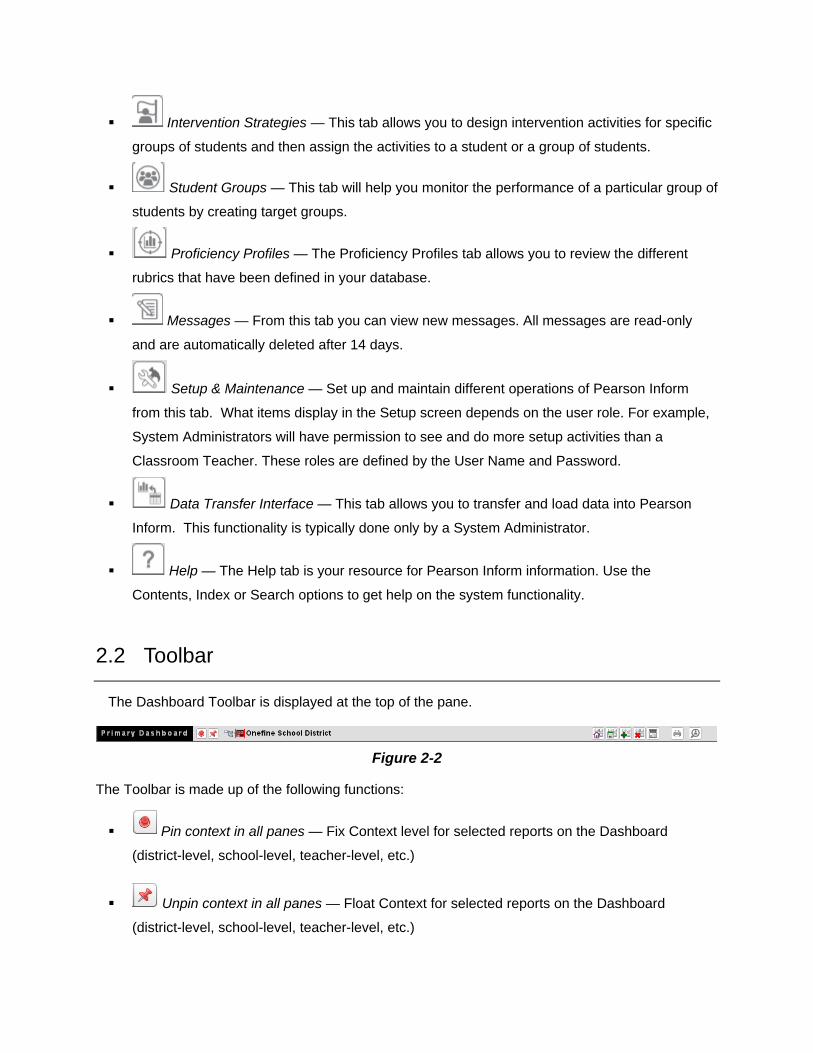
Intervention Strategies — This tab allows you to design intervention activities for specific
groups of students and then assign the activities to a student or a group of students.
Student Groups — This tab will help you monitor the performance of a particular group of
students by creating target groups.
Proficiency Profiles — The Proficiency Profiles tab allows you to review the different
rubrics that have been defined in your database.
Messages — From this tab you can view new messages. All messages are read-only
and are automatically deleted after 14 days.
Setup & Maintenance — Set up and maintain different operations of Pearson Inform
from this tab. What items display in the Setup screen depends on the user role. For example,
System Administrators will have permission to see and do more setup activities than a
Classroom Teacher. These roles are defined by the User Name and Password.
Data Transfer Interface — This tab allows you to transfer and load data into Pearson
Inform. This functionality is typically done only by a System Administrator.
Help — The Help tab is your resource for Pearson Inform information. Use the
Contents, Index or Search options to get help on the system functionality.
2.2 Toolbar
The Dashboard Toolbar is displayed at the top of the pane.
Figure 2-2
The Toolbar is made up of the following functions:
Pin context in all panes — Fix Context level for selected reports on the Dashboard
(district-level, school-level, teacher-level, etc.)
Unpin context in all panes — Float Context for selected reports on the Dashboard
(district-level, school-level, teacher-level, etc.)
Page 17
17 | P a g e P e a r s o n I n f o r m 5 . 1 E d u c a t i o n I n t e l l i g e n c e Copyright © 2009 Pearson Education, Inc. or its affiliate(s). All rights reserved. Contact NCS Pearson, Inc., Educational Assessment, San Antonio, Texas; 1-800-228-0752.
Click for Context Navigator — Navigate to the district, school, teacher, course, or section
level of a report.
School District — Represents the district-level view for the Dashboard.
Reload Default Dashboard — Reset the Dashboard to the default view.
Save Dashboard to Library — Save the reports displayed in the Dashboard to your library.
Create New Report — Create a new report.
Clear Dashboard — Clear all data being viewed in the Dashboard (this does not delete the
data; it only clears them from your view).
Toggle Tiles in all Panes – Toggle the report control bars in and out of view.
Print / PDF — View your report as a PDF file and print.
Student Search — Perform a student search and view student performance profiles.
Page 18
2.3 Setting up the Dashboard Default View
At any time you can change the default view displayed for the Dashboard by deleting, editing or
even adding a new view. The following steps walk you through setting up your Dashboard Default
View:
From the home page, click the Setup & Maintenance tab.
The Setup & Maintenance page displays.
Figure 2-3
Click Default Daily Views.
Figure 2-4
The Manage Default Daily Views page displays. On this page you can edit, remove or
add a daily view.
Page 19
19 | P a g e P e a r s o n I n f o r m 5 . 1 E d u c a t i o n I n t e l l i g e n c e Copyright © 2009 Pearson Education, Inc. or its affiliate(s). All rights reserved. Contact NCS Pearson, Inc., Educational Assessment, San Antonio, Texas; 1-800-228-0752.
Figure 2-5
To add a view, click Add a new record.
Figure 2-6
The Default Daily View Editor displays.
Click in the Description field
o Give your Default Daily View a name that describes what it is displaying. For
example, if it is a report showing last year’s state test scores, call it “[08-09] State
Test Scores.
Select the Type: of view desired, based on who will see this Default Daily View when logging
in.
o Role-Based means it will display for a person based on their user role: system
admin, school admin, district admin, teacher, etc.
o Context-based means the Default Daily View applies to the context level: any user
who logs in at the district level, the school level, or the classroom (teacher) level
regardless of their role.
Page 20
o Personal means the Default Daily View will display only for the user who created it.
Report Sandbox: choose this radio button if you want to choose your Default Daily View from
an existing report or dashboard in the Report Library.
Assessment Sandbox: choose this radio button if you want to choose your Default Daily View
from the reports in the Assessment Sandbox. Reports
Click Save or Cancel.
Figure 2-7
Page 21
21 | P a g e P e a r s o n I n f o r m 5 . 1 E d u c a t i o n I n t e l l i g e n c e Copyright © 2009 Pearson Education, Inc. or its affiliate(s). All rights reserved. Contact NCS Pearson, Inc., Educational Assessment, San Antonio, Texas; 1-800-228-0752.
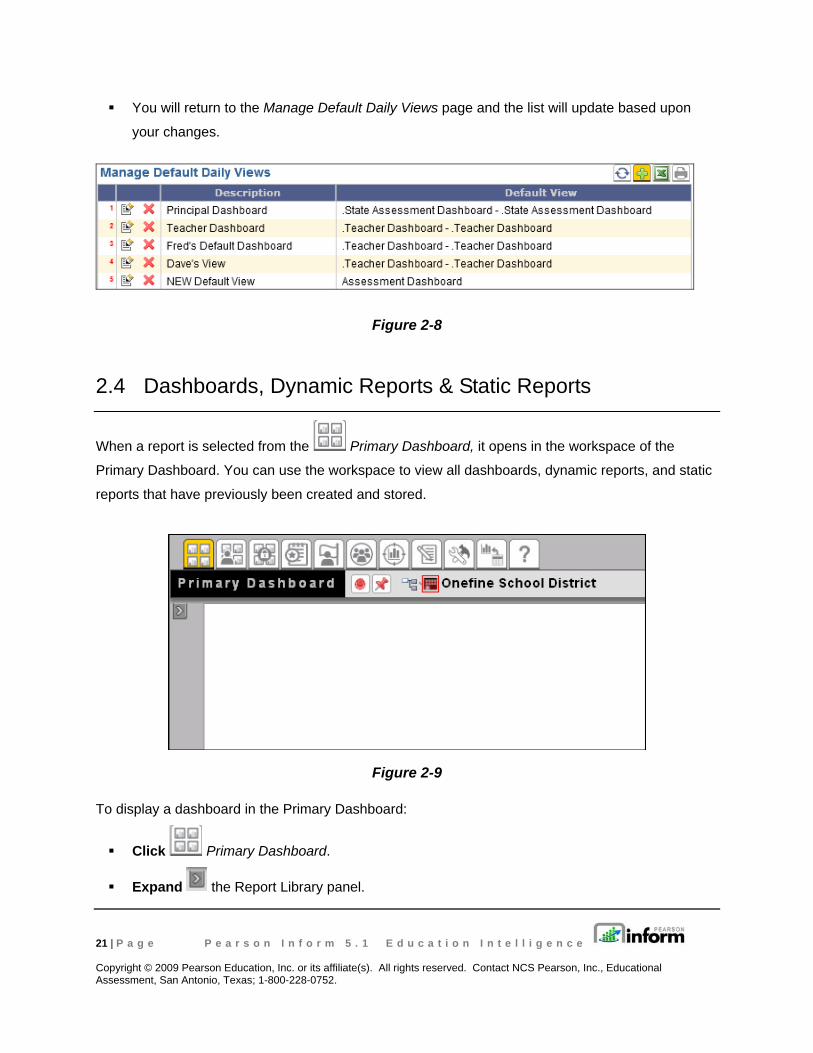
You will return to the Manage Default Daily Views page and the list will update based upon
your changes.
Figure 2-8
2.4 Dashboards, Dynamic Reports & Static Reports
When a report is selected from the Primary Dashboard, it opens in the workspace of the
Primary Dashboard. You can use the workspace to view all dashboards, dynamic reports, and static
reports that have previously been created and stored.
Figure 2-9
To display a dashboard in the Primary Dashboard:
Click Primary Dashboard.
Expand the Report Library panel.
Page 22
Figure 2-10
The Report Library panel will display.
Figure 2-11
Page 23
23 | P a g e P e a r s o n I n f o r m 5 . 1 E d u c a t i o n I n t e l l i g e n c e Copyright © 2009 Pearson Education, Inc. or its affiliate(s). All rights reserved. Contact NCS Pearson, Inc., Educational Assessment, San Antonio, Texas; 1-800-228-0752.
Click to expand the Shared Library and view saved dashboards and reports.
Figure 2-12
Click on a dashboard title.
Figure 2-13
Page 24
The selected dashboard generates and displays in the Primary Dashboard.
Figure 2-14
To display a dynamic report:
Click on a dynamic report title.
To display a static report:
Click on a static report title.
All report types will display in a separate window. Each window will have independent toolbars for
modifying the report:
The Chart View Toolbar contains:
View Data as Chart
View Data as Table
Query Controls
View Drilldown Data
The Chart Control Toolbar contains:
Chart Type drop-down
Toggle Legend
Swap Chart Variables
More Chart Info
Page 25
25 | P a g e P e a r s o n I n f o r m 5 . 1 E d u c a t i o n I n t e l l i g e n c e Copyright © 2009 Pearson Education, Inc. or its affiliate(s). All rights reserved. Contact NCS Pearson, Inc., Educational Assessment, San Antonio, Texas; 1-800-228-0752.
Additionally, the option to Print/PDF and Save Report to Library will be available in each
report window.
To display a collection of dashboards, dynamic reports, and static reports at the same time:
Click on the first dashboard or report you want to display.
Figure 2-15
Press and hold the <Ctrl> key on your keyboard while you click on other items you want to
display.
Figure 2-16
Page 26
Drag-and-drop the titles from the library into the Primary Dashboard.
Figure 2-17
The selected reports generate and display in the right pane. (See Figure 2-14)
Click Save Dashboard to Library to store the collection as a new dashboard in the
Report Library.