Forward-looking statements Except for the historical information contained herein, the matters discussed in this presentation include forward-looking statements. In particular, all statements that express forecasts, expectations and projections with respect to future matters, including trends in results of operations, margins, growth rates, overall market trends, the impact of interest or exchange rates, the availability of financing, anticipated cost savings and synergies and the execution of Pearson's strategy, are forward- looking statements. By their nature, forward-looking statements involve risks and uncertainties because they relate to events and depend on circumstances that will occur in future. They are based on numerous assumptions regarding Pearson's present and future business strategies and the environment in which it will operate in the future. There are a number of factors which could cause actual results and developments to differ materially from those expressed or implied by these forward-looking statements, including a number of factors outside Pearson's control. These include international, national and local conditions, as well as competition. They also include other risks detailed from time to time in Pearson's publicly-filed documents and you are advised to read, in particular, the risk factors set out in Pearson's latest annual report and accounts, which can be found on its website (www.pearson.com/investors). Any forward-looking statements speak only as of the date they are made, and Pearson gives no undertaking to update forward-looking statements to reflect any changes in its expectations with regard thereto or any changes to events, conditions or circumstances on which any such statement is based. Readers are cautioned not to place undue reliance on such forward- looking statements. 1
Transcript
Forward-looking statements
Except for the historical information contained herein, the matters discussed in this presentation include forward-looking
statements. In particular, all statements that express forecasts, expectations and projections with respect to future matters,
including trends in results of operations, margins, growth rates, overall market trends, the impact of interest or exchange rates,
the availability of financing, anticipated cost savings and synergies and the execution of Pearson's strategy, are forward-
looking statements. By their nature, forward-looking statements involve risks and uncertainties because they relate to events
and depend on circumstances that will occur in future. They are based on numerous assumptions regarding Pearson's
present and future business strategies and the environment in which it will operate in the future.
There are a number of factors which could cause actual results and developments to differ materially from those expressed or
implied by these forward-looking statements, including a number of factors outside Pearson's control. These include
international, national and local conditions, as well as competition. They also include other risks detailed from time to time in
Pearson's publicly-filed documents and you are advised to read, in particular, the risk factors set out in Pearson's latest annual
report and accounts, which can be found on its website (www.pearson.com/investors).
Any forward-looking statements speak only as of the date they are made, and Pearson gives no undertaking to update
forward-looking statements to reflect any changes in its expectations with regard thereto or any changes to events, conditions
or circumstances on which any such statement is based. Readers are cautioned not to place undue reliance on such forward-
looking statements.
1
Higher Education
Investor Day
Friday 17 June 2016
Image by Photographer’s Name (Credit in black type) or
Image by Photographer’s Name (Credit in white type)
Image placeholder
Image by Photographer’s Name (Credit in black type) or
Image by Photographer’s Name (Credit in white type)
Presentation Title Arial Bold 7 pt
Agenda
3
Time Topic Speakers
1215 – 1300 Registration and light lunch for guests
1300 – 1310 Welcome - Outline of the day John Fallon
Higher Education market backdrop
1310 – 1320Drivers of demand and supply
Structural change
Tim Bozik
Tim Bozik
Courseware
1320 – 1400
How we go to market
Pearson’s market position
What is Higher Education courseware?
Structural change in Higher Education
Our Higher Education courseware strategy
Personalised learning and efficacy
Opportunities, risks and transition in Higher Education
Institutional courseware solutions
Summary and market forecast
Robin Baliszewski
Tim Bozik
Tim Bozik
Tim Bozik
Tim Bozik
Angie McAllister
Tim Bozik
Don Kilburn
Tim Bozik
1400 – 1440 Coffee Break and product demos The Team
Time Topic Speakers
Technology and Scale Opportunities in Higher Ed
1440 – 1455 Global Product Platform enabling new models Albert Hitchcock
Online Program Management
1455 – 1515
Institutional solutions & online learning
Our strategy
What is OPM?
How we go to market
Case studies
Pearson’s market position
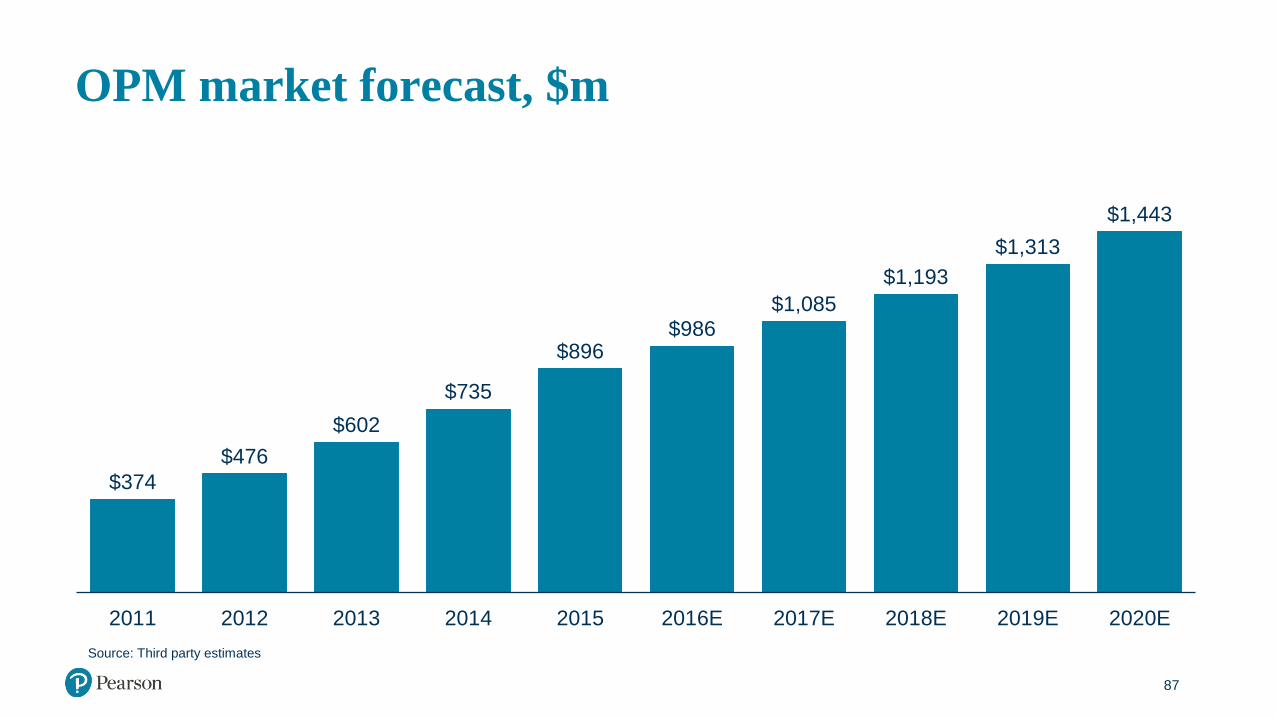
OPM Market forecast
Dave Daniels
Dave Daniels
Todd Hitchcock
Todd Hitchcock
Todd Hitchcock
Todd Hitchcock
Todd Hitchcock
Higher Education and our 2018 Goals
1515 – 1530 Outlook for Higher Education businesses Coram Williams
1530 – 1545Fireside Chat
Professor Ed Byrne, Principal, King’s College London
Rod Bristow & Ed
Byrne
1545 – 1550 Summary and Conclusions of the Day John Fallon
1550 – 1630 Q&A – Panel discussion The Team
1630 – 1700 Drinks & breakout session booths All
Higher Education courseware and OPM (2015)
Higher Education 2.8%
Higher Education 2.9%
4
Higher Education
Courseware
27.2%
Higher Education Services –
Online Programme Management
5.0%
North America
Core
Growth
Structural trends – our growth opportunity
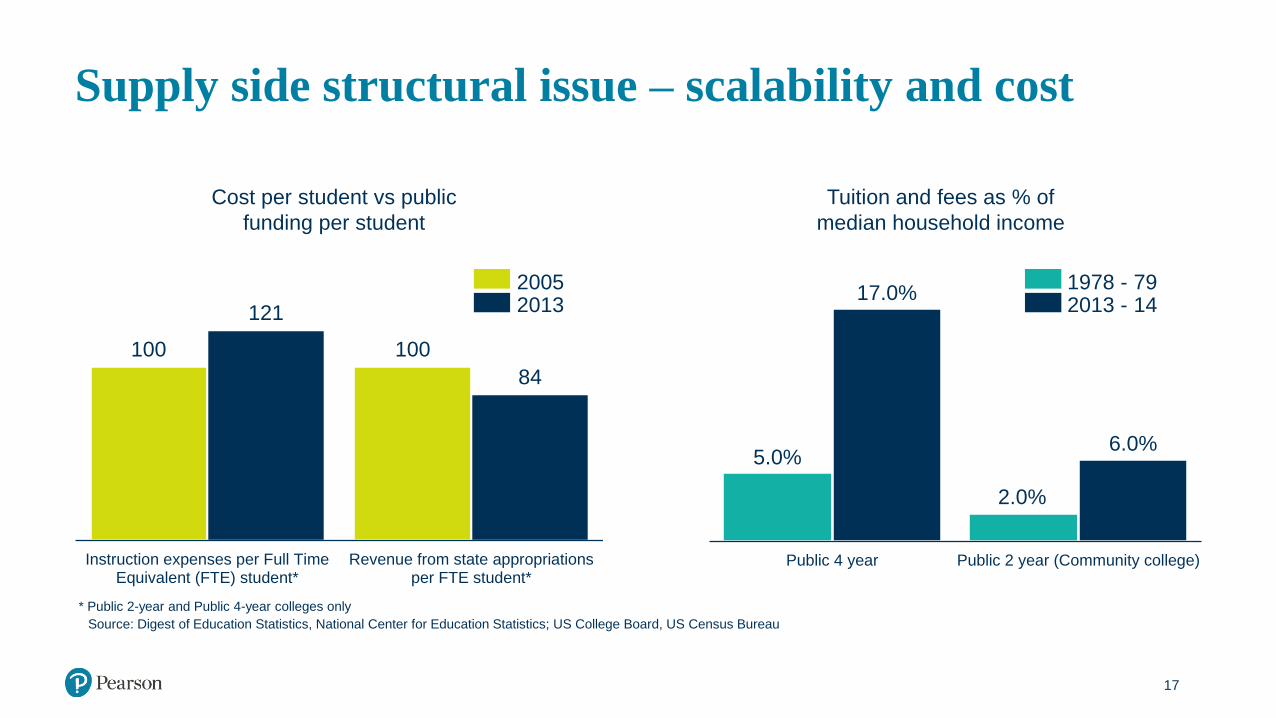
• The economic value of an education is greater than ever
• The cost of an education is increasing; public funding is under pressure
• The process of getting an education remains inefficient; translating education into employment is
uneven and highly variable
• Technology creates opportunities to make learning more affordable, accessible, flexible, personal and
effective
• Education market is continuously evolving
Our strategy enables us to manage the transition, mitigate the threat, and maximise the
opportunity
5
The world’s learning company – our strategy
• World class capabilities in educational courseware and assessment
• Strong portfolio of products and services, powered by technology
• Combining these core capabilities with related services, enabling our partners to scale online, reaching
more people and ensuring better learning outcomes
• A larger market opportunity for Pearson, with a sharper focus on the fastest-growing education markets
and stronger financial returns
Real value lies in improving productivity, student completion and employability
6
Simplification of technology and infrastructure
Enterprise and Enabling Platforms
Cloud & Infrastructure Platforms
Learning Application & Service Platforms
Se
cu
rity
Pearson products and services
Pearson Content
The User Experience
Technology & Product Platforms
High level of
change &
innovation
Increased
investment
Lower level
of change
Stable,
reliable and
repeatable
Shift
investment
from
‘plumbing’
7
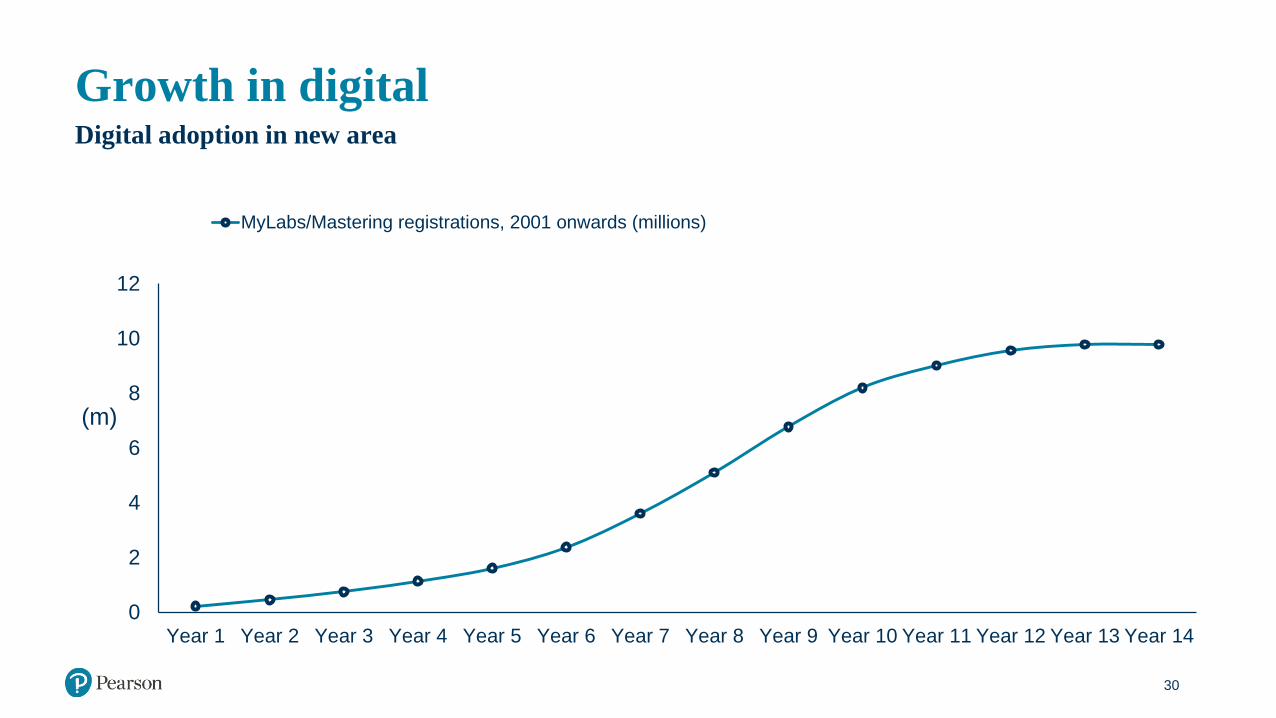
Grow in digital supplemental: defining a new category
8
-
2
4
6
8
10
12
Year 1 Year 2 Year 3 Year 4 Year 5 Year 6 Year 7 Year 8 Year 9 Year 10 Year 11 Year 12 Year 13 Year 14
Mitigating risks: new entrantsOpen Education Resources (OER)
Currently use in own
course
Used in place of
publisher courseware
Used to supplement
publisher courseware
Don’t use in own
course
Used to use in own course
45
96.1% 99.0%
3.9% 1.0%
0%
20%
40%
60%
80%
100%
Math & Statistics Science
3.62% 1.03%3.90%
1.02%0%
20%
40%
60%
80%
100%
Math & Statistics Science
Source: NAVSTEM. Sample size of 3.1m course enrolments tracking adoptions at 370 of the largest 4year universities in STEM disciplines, around 65% of the total 4 year market.
2014
2015
OER courseware trendsFaculty adoption of courseware, 2015
Commercial
OER
Mitigating risks: new entrants
OER Mylab/Mastering
Essential content for course
Proven pedagogy, leading IP
Digital homeworking platforms
Engaging Digital content
24/7 support
Adaptive learning
Classroom analytics/Instructor dashboards
Support for peer-to-peer learning via Learning catalytics
Instructor support and professional development
ADA Accountability
46
Managing transition: rental
• Affect changing over time
• Initially positive as distributors bought stock to launch rental programmes
• Then negative as rental a cheaper substitute than used while distributors fought for share
• Rental market consolidation and shift to digital will soften impact over time
47
Managing transition: optimise text
48
Managing the transition: optimise text
49
7.57.3
7.0
6.4
4.3
2.9 2.8
1.0
2009 2010 2011 2012 2013 2014 2015 2016E
Warehouse capacity, millions of sq ft
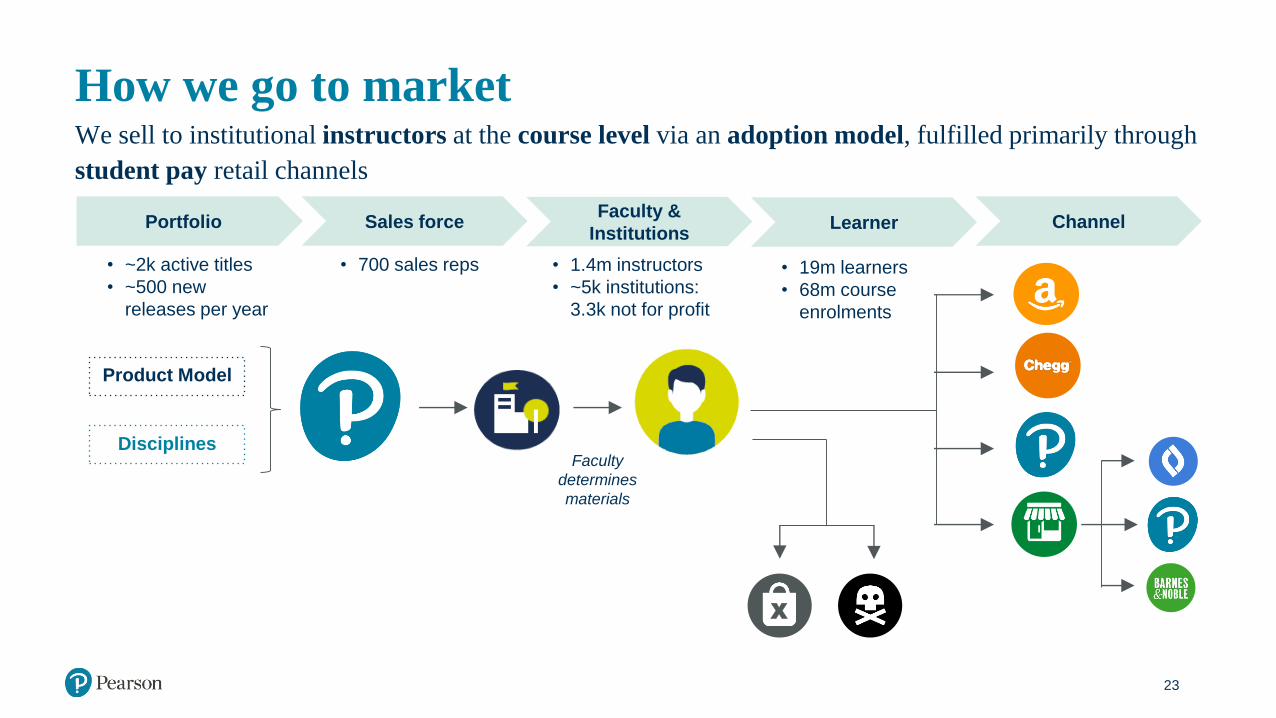
Managing the transition: channelWe sell to institutional instructors at the course level via an adoption model, fulfilled primarily through
student pay retail channels
50
Portfolio Sales forceFaculty &
InstitutionsLearner Channel
• ~2k active titles
• ~500 new
releases per year
• 19m learners
• 68m course
enrolments
• 1.4m instructors
• ~5k institutions:
3.3k not for profit
• 700 sales reps
Faculty
determines
materials
Product Model
Disciplines
X
Maximise opportunity: institutional partnerships
51
Faculty
determines
materials
X
Institution
…to future stateFrom current market …
Student
Pearson has
direct relationship
with institution
Faculty
determines
materials
Maximise opportunity: scale competitive advantage
Faculty
Adoption share
Institutional
relationships
Quality &
Breadth of IP
Service &
Analytics
Capability
LMS
Integration
Implementation
and PD
Capability
Pearson
Cengage
McGraw-Hill
Wiley
52
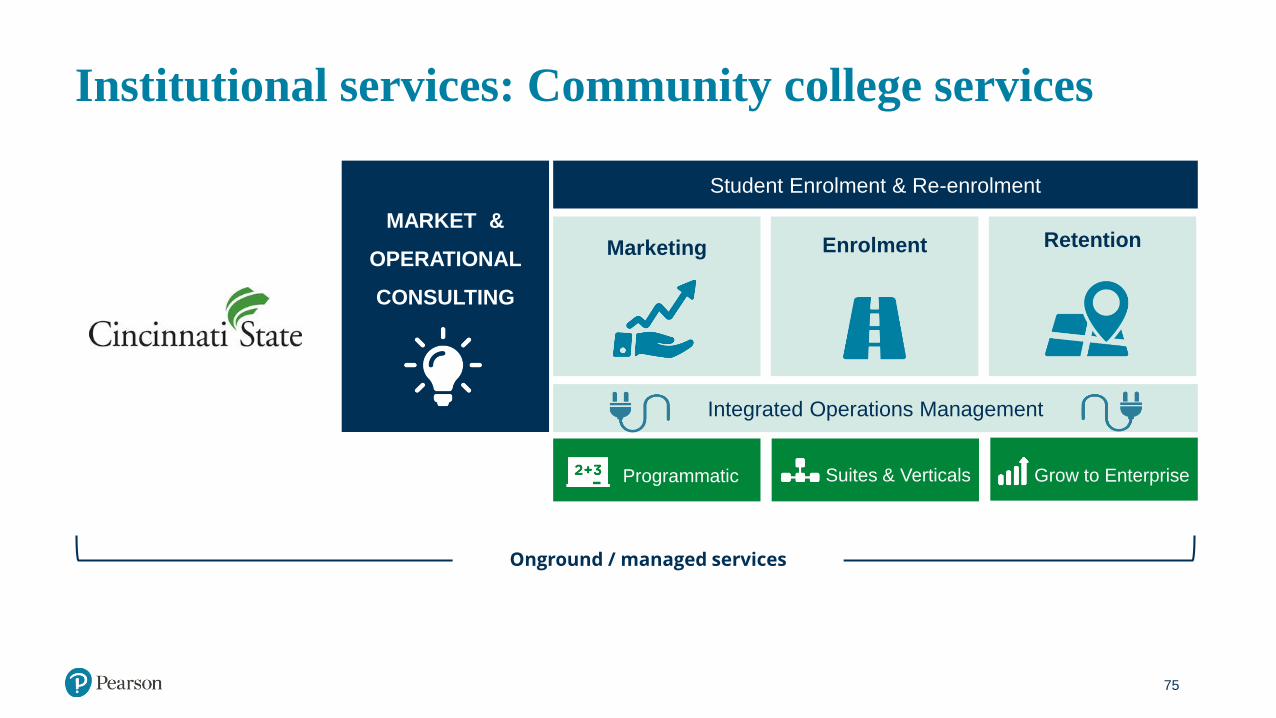
Institutional partnerships case studies
with Southern New
Hampshire University
College of Online and
Continuing Education,
supporting curriculum
development, online tutoring,
enterprise wide content and
data integration, eBooks with
a print-on-demand option
and data and
analytics services
for Jones County Junior
College, an enterprise
adoption of cross-discipline
digital content, where content
is purchased via an upfront
course fee and integrated
with university IT systems.
E.g.
with Broward College to
launch new competency-
based workforce certification
pathways focused on IT and
Healthcare.
with Charles A. Dana Center
at The University of Texas at
Austin to provide web-based
course resources to
Community Colleges across
Texas as part of the New
Mathways Project -
shortening the time taken to
earn college credit in
mathematics
Broader institutional courseware partnerships
Course design
collaboration
Strategic
Partnership
Digital Direct
Access
Employability
partnership
53
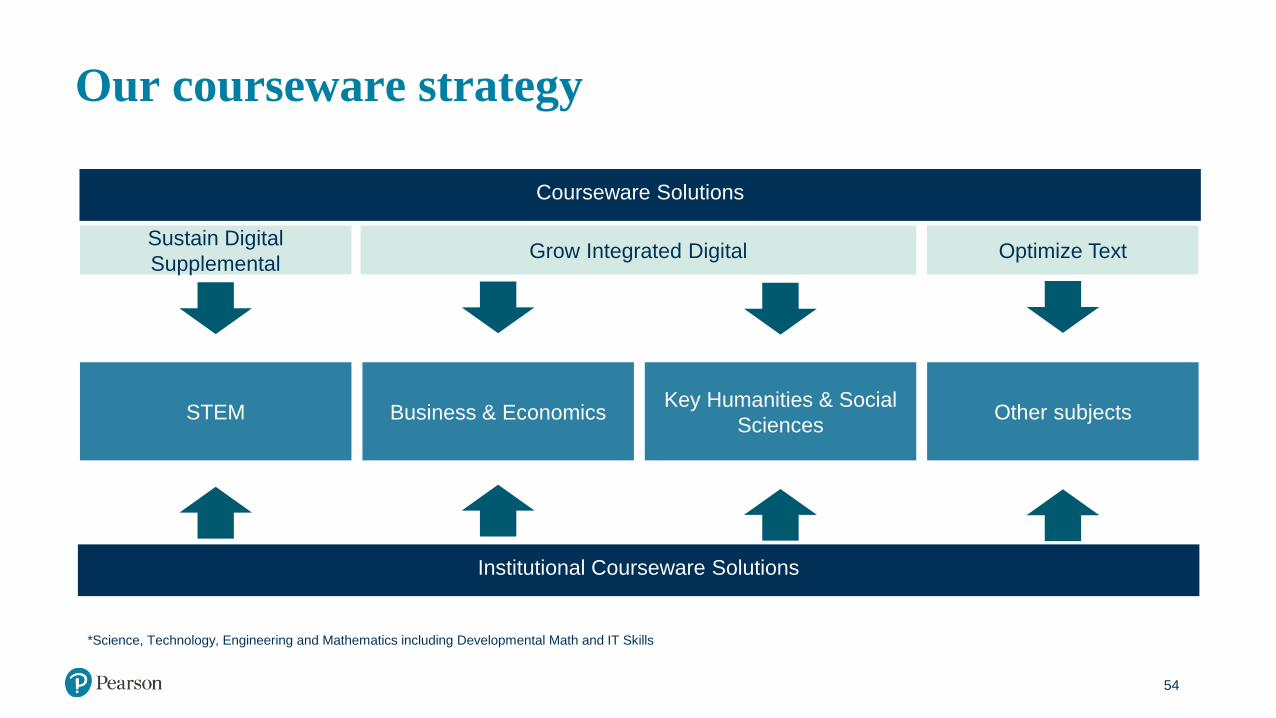
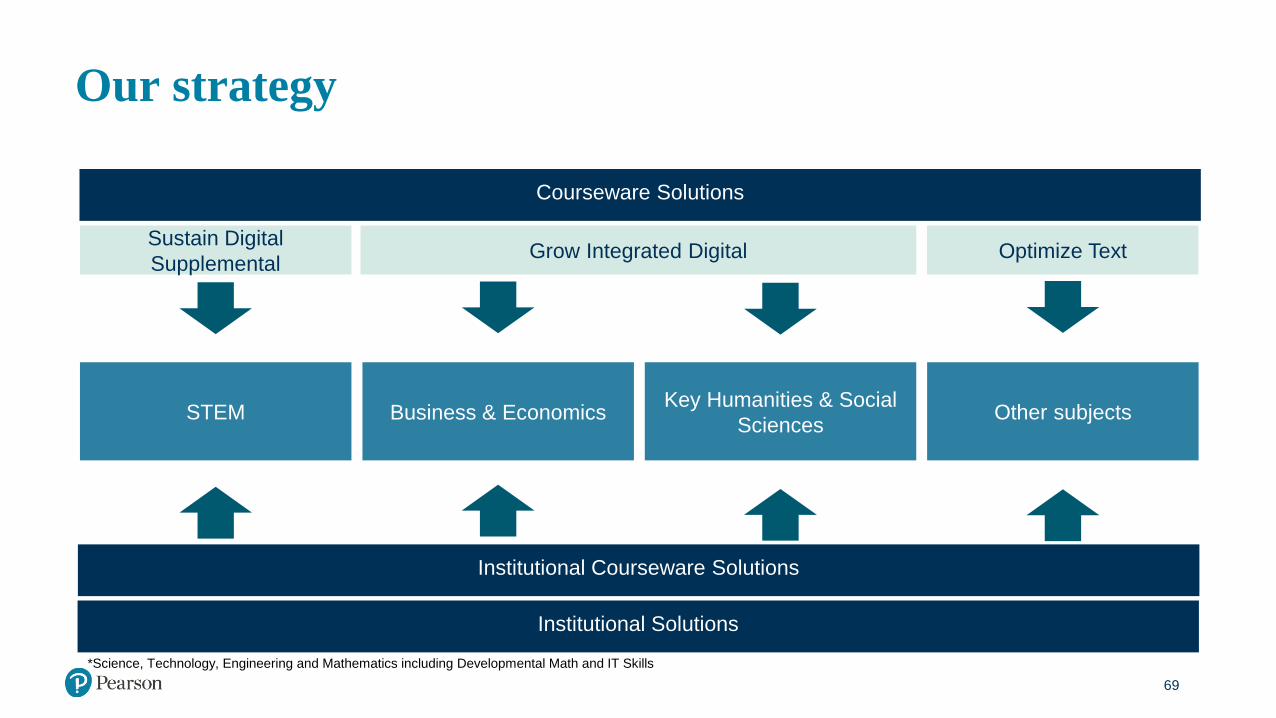
Our courseware strategy
*Science, Technology, Engineering and Mathematics including Developmental Math and IT Skills
Optimize TextSustain Digital
SupplementalGrow Integrated Digital
Institutional Courseware Solutions
STEM Business & EconomicsKey Humanities & Social
SciencesOther subjects
Courseware Solutions
54
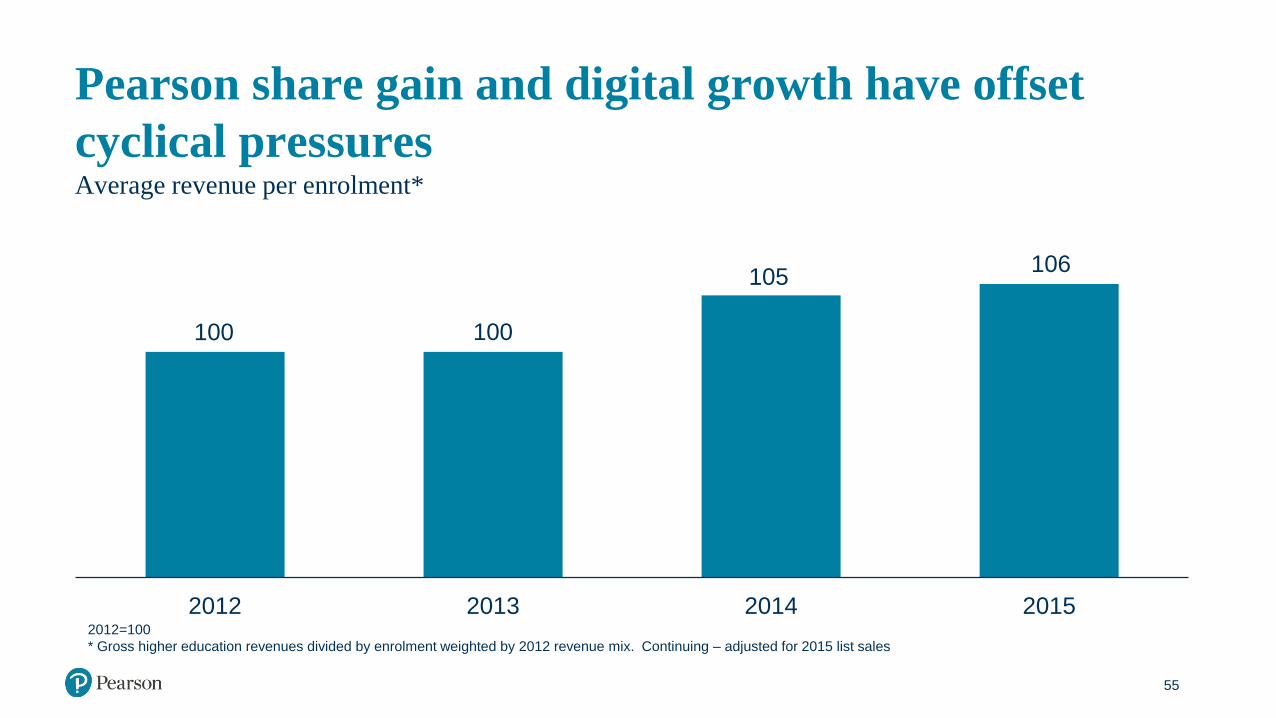
Pearson share gain and digital growth have offset
cyclical pressuresAverage revenue per enrolment*
2012 2013 2014 20152012=100
* Gross higher education revenues divided by enrolment weighted by 2012 revenue mix. Continuing – adjusted for 2015 list sales
55
100 100
105106
US Higher Education courseware market
56
-6.0%
-4.0%
-2.0%
0.0%
2.0%
4.0%
6.0%
8.0%
Enrollment OER Rental/used Selling Model Digital Total Market
Forecast components of market growth across a typical economic cycle