62
Pearson Pearson results presentation results presentation 3 March 2003
| Date post: | 15-Dec-2015 |
| Category: |
Documents |
| Upload: | rosa-briskey |
| View: | 228 times |
| Download: | 3 times |

Pearson Pearson results presentation results presentation
3 March 2003
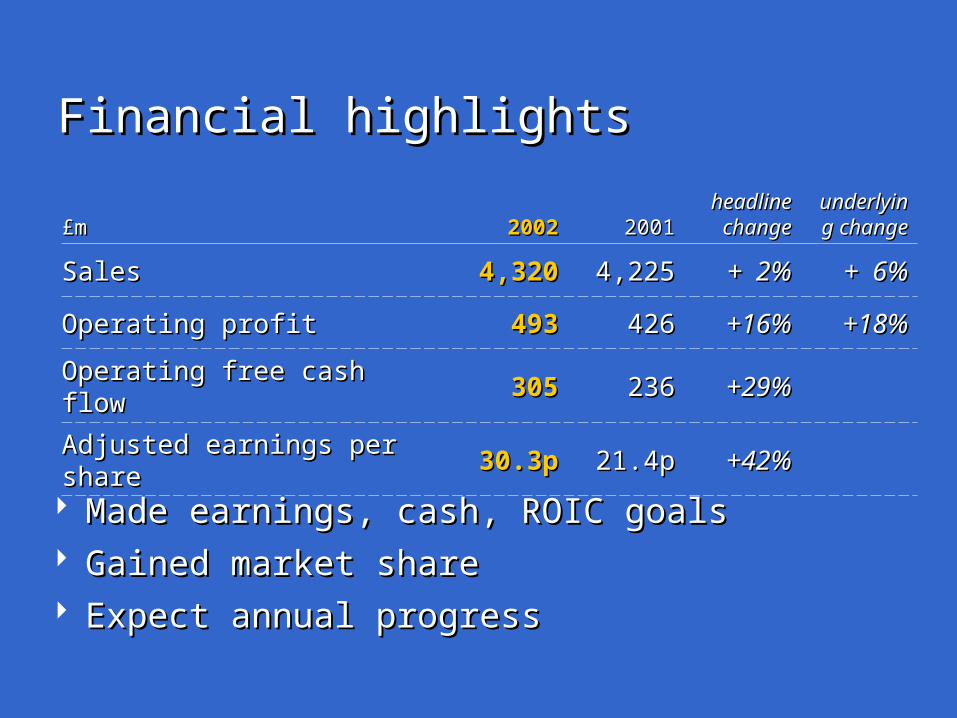
Financial highlightsFinancial highlights
£m£m 20022002 20012001headline headline changechange
underlyinunderlying changeg change
SalesSales 4,3204,320 4,2254,225 + 2%+ 2% + 6%+ 6%
Operating profitOperating profit 493493 426426 +16%+16% +18%+18%
Operating free cash flowOperating free cash flow 305305 236236 +29%+29%
Adjusted earnings per shareAdjusted earnings per share 30.3p30.3p 21.4p21.4p +42%+42%
Made earnings, cash, ROIC goalsMade earnings, cash, ROIC goals Gained market shareGained market share Expect annual progressExpect annual progress

20032003
Further significant growthFurther significant growth earningsearnings cashcash returnsreturns
Annual progress beyondAnnual progress beyond

Pearson Pearson financial performance financial performance
Financial headlinesFinancial headlines
Underlying sales growth despite FT downturnUnderlying sales growth despite FT downturn
Margins improvedMargins improved
Good progress on cash and returnsGood progress on cash and returns
Balance sheet strengthenedBalance sheet strengthened
Financial reportingFinancial reporting
Improved clarityImproved clarity
Portfolio changes largely completePortfolio changes largely complete
Post-internet basisPost-internet basis
Reconciliation packReconciliation pack
Improved segmental analysisImproved segmental analysis

SalesSales
£m£m 20022002 20012001headline headline changechange
underlying underlying changechange
EducationEducation 2,7562,756 2,6042,604 +6%+6% +11%+11%
FT groupFT group 726726 801801 - 9%- 9% - 8%- 8%
PenguinPenguin 838838 820820 +2%+2% +5%+5%
Total salesTotal sales 4,3204,320 4,2254,225 +2%+2% +6%+6%

Operating profitsOperating profits
£m£m 20022002 20012001headline headline changechange
underlying underlying changechange
EducationEducation 326326 274274 +19%+19% +22%+22%
FT groupFT group 8080 7272 +11%+11% + 8%+ 8%
PenguinPenguin 8787 8080 + 9%+ 9% +11%+11%
Continuing operationsContinuing operations 493493 426426 +16%+16% +18%+18%
TelevisionTelevision soldsold 3737 —— ——
Operating profits Operating profits 493493 463463 + 6%+ 6% +18%+18%BEFORE GOODWILL, INTEGRATION COSTS AND NON-OPERATING ITEMSBEFORE GOODWILL, INTEGRATION COSTS AND NON-OPERATING ITEMS
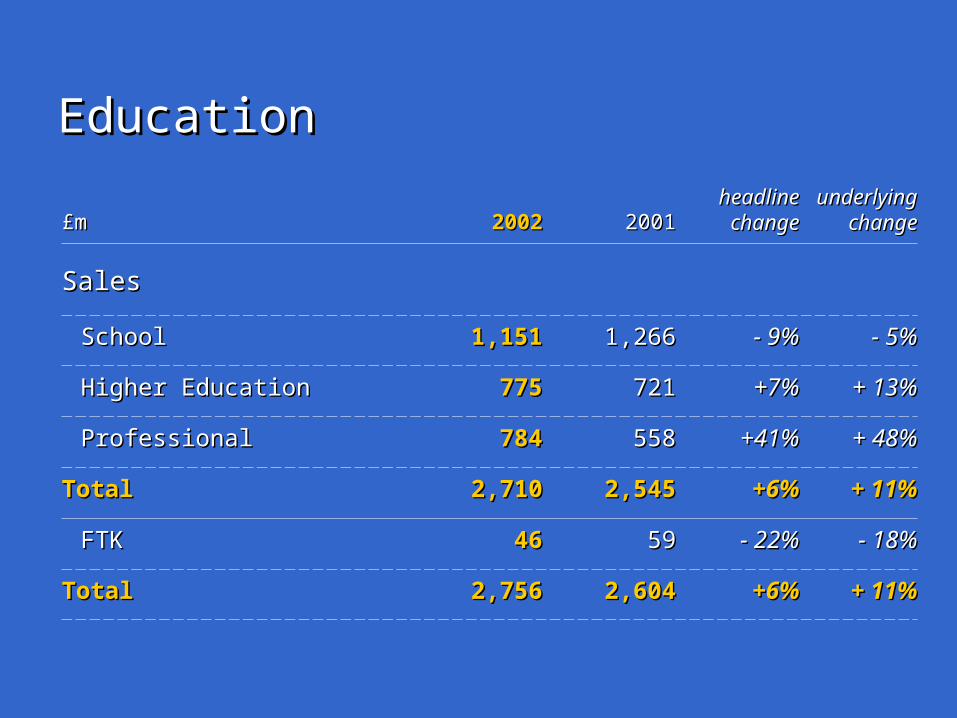
EducationEducation
£m£m 20022002 20012001headline headline changechange
underlying underlying changechange
SalesSales
SchoolSchool 1,1511,151 1,2661,266 - 9%- 9% - 5%- 5%
Higher EducationHigher Education 775775 721721 +7%+7% + 13%+ 13%
ProfessionalProfessional 784784 558558 +41%+41% + 48%+ 48%
TotalTotal 2,7102,710 2,5452,545 +6%+6% + 11%+ 11%
FTKFTK 4646 5959 - 22%- 22% - 18%- 18%
TotalTotal 2,7562,756 2,6042,604 +6%+6% + 11%+ 11%
EducationEducation
£m£m 20022002 20012001headline headline changechange
underlying underlying changechange
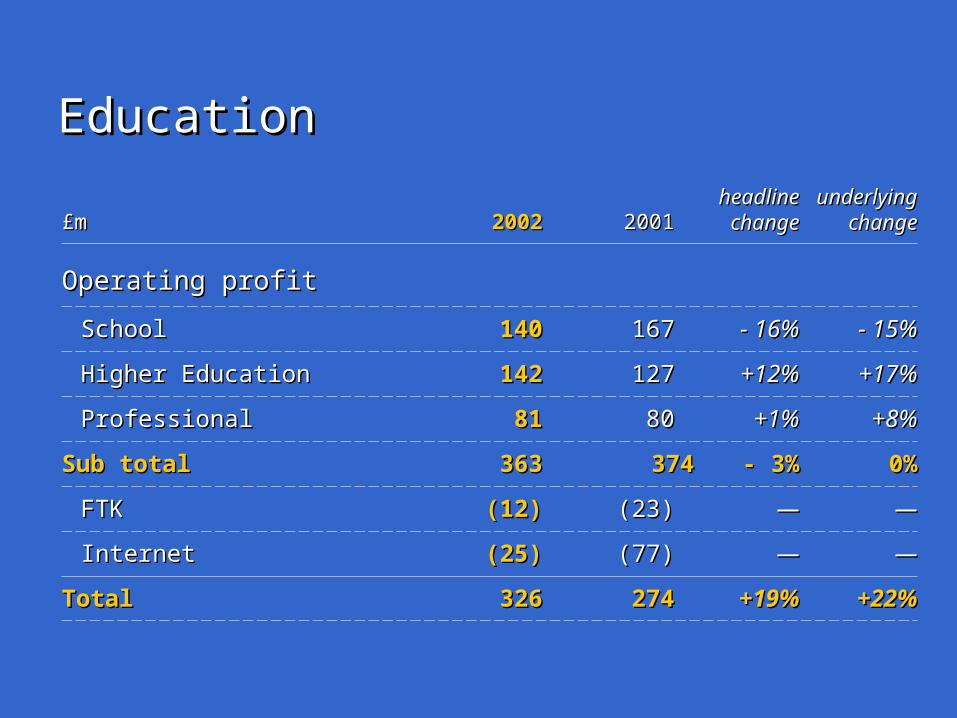
Operating profitOperating profit
SchoolSchool 140140 167167 - 16%- 16% - 15%- 15%
Higher EducationHigher Education 142142 127127 +12%+12% +17%+17%
ProfessionalProfessional 8181 8080 +1%+1% +8%+8%
Sub totalSub total 363363 374374 - 3%- 3% 0%0%
FTKFTK (12)(12) (23)(23) —— ——
InternetInternet (25)(25) (77)(77) —— ——
TotalTotal 326326 274274 +19%+19% +22%+22%

EducationEducationSegmental sales & margin mix Segmental sales & margin mix
2001
50%
28%
22%
2002
School
Higher Ed
Professional
42%
29%
29%13%
17%
14%
12%
18%
10%School
Professional
Higher Ed
Note: 2002 includes £20m of back office costs and £11m additional pension charge
Operating profit margins
FT GroupFT Group
£m £m 20022002 20012001headline headline changechange
underlying underlying changechange
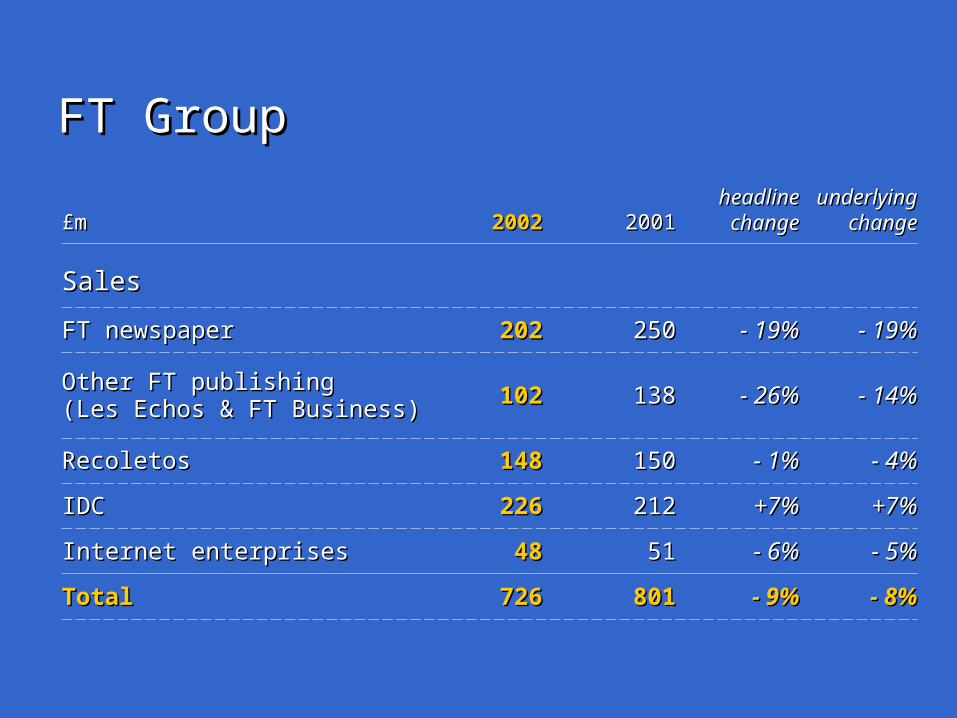
SalesSales
FT newspaperFT newspaper 202202 250250 - 19%- 19% - 19%- 19%
Other FT publishingOther FT publishing(Les Echos & FT Business)(Les Echos & FT Business) 102102 138138 - 26%- 26% - 14%- 14%
RecoletosRecoletos 148148 150150 - 1%- 1% - 4%- 4%
IDCIDC 226226 212212 +7%+7% +7%+7%
Internet enterprisesInternet enterprises 4848 5151 - 6%- 6% - 5%- 5%
TotalTotal 726726 801801 - 9%- 9% - 8%- 8%
FT GroupFT Group
£m £m 20022002 20012001headline headline changechange
underlying underlying changechange
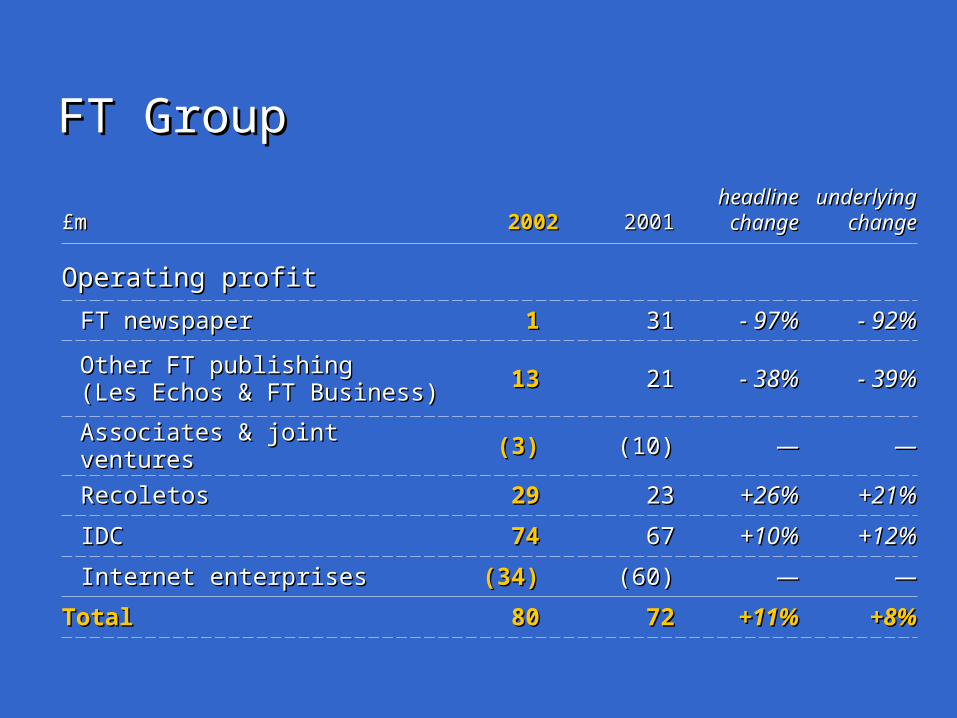
Operating profitOperating profit
FT newspaperFT newspaper 11 3131 - 97%- 97% - 92%- 92%
Other FT publishingOther FT publishing(Les Echos & FT Business)(Les Echos & FT Business) 1313 2121 - 38%- 38% - 39%- 39%
Associates & joint venturesAssociates & joint ventures (3)(3) (10)(10) —— ——
RecoletosRecoletos 2929 2323 +26%+26% +21%+21%
IDCIDC 7474 6767 +10%+10% +12%+12%
Internet enterprisesInternet enterprises (34)(34) (60)(60) —— ——
TotalTotal 8080 7272 +11%+11% +8%+8%
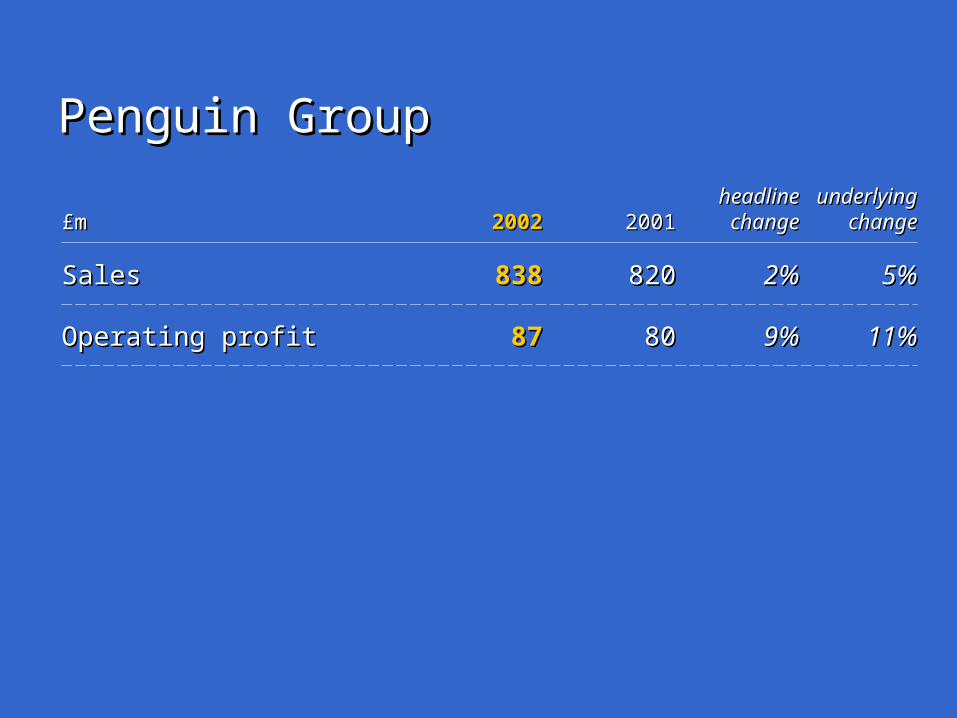
Penguin GroupPenguin Group
£m£m 20022002 20012001headline headline changechange
underlying underlying changechange
SalesSales 838838 820820 2%2% 5%5%
Operating profitOperating profit 8787 8080 9%9% 11%11%

Adjusted earnings per shareAdjusted earnings per share
£m£m 20022002 20012001 varvarHeadline Headline
changechange
Operating profit Operating profit (incl RTL for ’01)(incl RTL for ’01) 493493 463463 +30+30 +6%+6%
InterestInterest (94)(94) (169)(169) +75+75 ——
TaxationTaxation (131)(131) (100)(100) - 31- 31 ——
Profit after taxProfit after tax 268268 194194 +74+74 +38%+38%
MinoritiesMinorities (27)(27) (24)(24) - 3- 3 ——
Adjusted profitAdjusted profit 241241 170170 +71+71 +42%+42%
Adjusted earnings per shareAdjusted earnings per share 30.3p30.3p 21.4p21.4p +8.9p+8.9p +42%+42%
Dividend per shareDividend per share 23.4p23.4p 22.3p22.3p +1.1p+1.1p +5%+5%2001 restated for frs192001 restated for frs19before goodwill, integration costs and non-operating itemsbefore goodwill, integration costs and non-operating items

$ sensitivity$ sensitivity
5¢ change for full year5¢ change for full year == approximately 1p EPS impact approximately 1p EPS impact
20022002 20012001
Average full year rateAverage full year rate 1.511.51 1.441.44
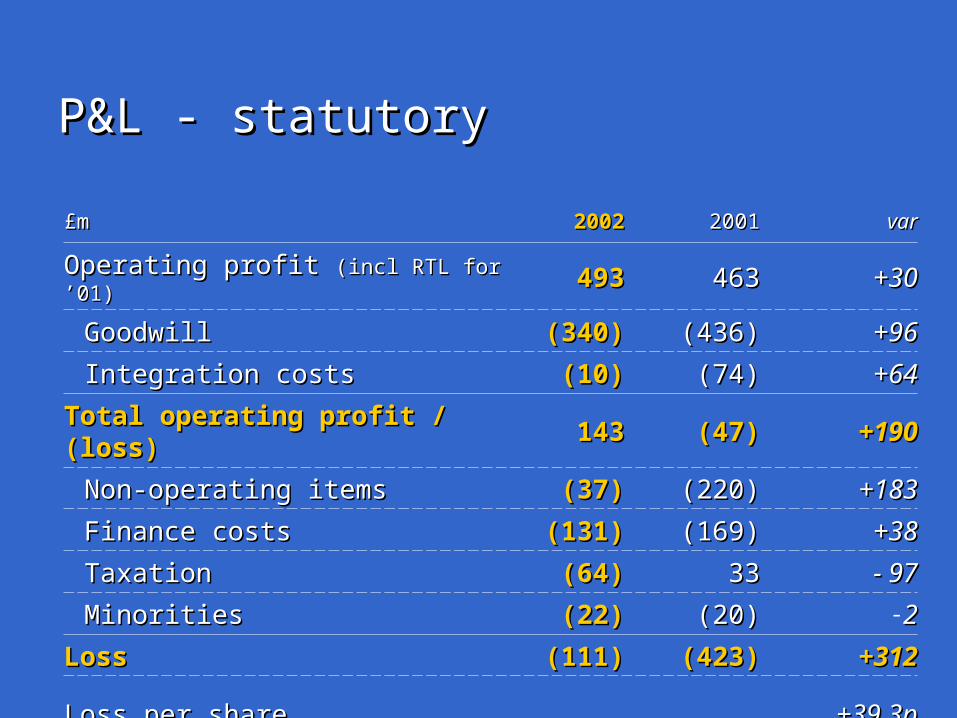
P&L - statutoryP&L - statutory
£m£m 20022002 20012001 varvar
Operating profit Operating profit (incl RTL for ’01)(incl RTL for ’01) 493493 463463 +30+30
GoodwillGoodwill (340)(340) (436)(436) +96+96
Integration costsIntegration costs (10)(10) (74)(74) +64+64
Total operating profit / (loss)Total operating profit / (loss) 143143 (47)(47) +190+190
Non-operating itemsNon-operating items (37)(37) (220)(220) +183+183
Finance costsFinance costs (131)(131) (169)(169) +38+38
TaxationTaxation (64)(64) 3333 - 97- 97
MinoritiesMinorities (22)(22) (20)(20) -22
LossLoss (111)(111) (423)(423) +312+312
Loss per shareLoss per share(13.9)p(13.9)p (53.2)p(53.2)p +39.3p+39.3p
2001 RESTATED FOR FRS192001 RESTATED FOR FRS19

Falling integration costsFalling integration costs
£m£m 20022002 20012001 20002000 19991999
Simon & SchusterSimon & Schuster —— —— 99 9595
NCSNCS 77 2929 44 ——
DKDK 33 4545 2727 ——
TotalTotal 1010 7474 4040 9595
Cash impactCash impact 4444 6969 6161 110110
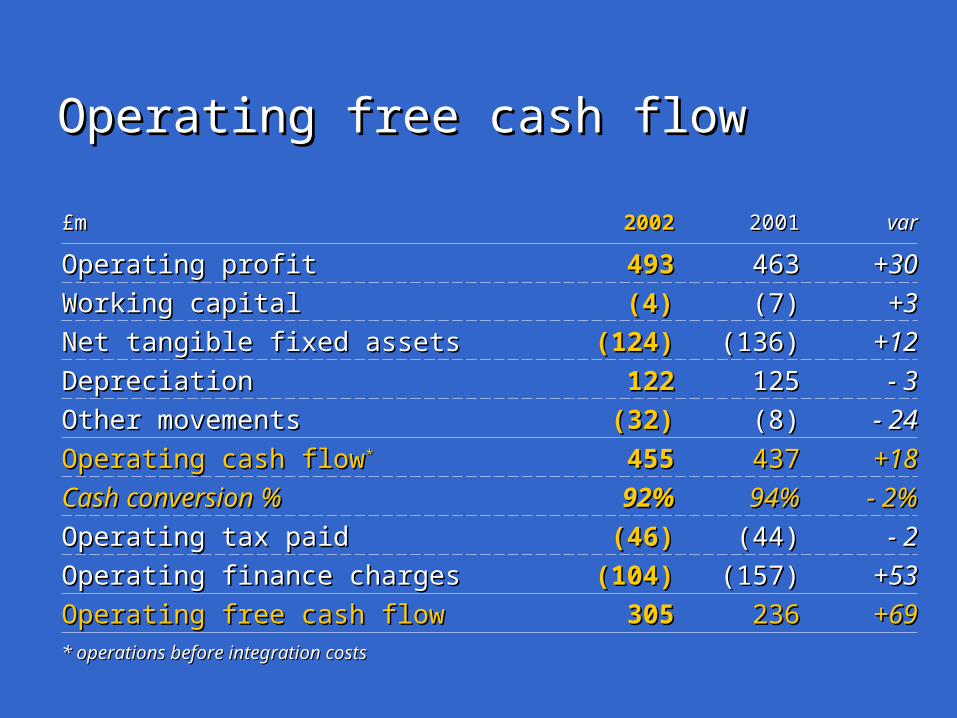
Operating free cash flowOperating free cash flow
£m£m 20022002 20012001 varvar
Operating profitOperating profit 493493 463463 +30+30
Working capitalWorking capital (4)(4) (7)(7) +3+3
Net tangible fixed assetsNet tangible fixed assets (124)(124) (136)(136) +12+12
DepreciationDepreciation 122122 125125 - 3- 3
Other movementsOther movements (32)(32) (8)(8) - 24- 24
Operating cash flowOperating cash flow** 455455 437437 +18+18
Cash conversion %Cash conversion % 92%92% 94%94% - 2%- 2%
Operating tax paidOperating tax paid (46)(46) (44)(44) - 2- 2
Operating finance chargesOperating finance charges (104)(104) (157)(157) +53+53
Operating free cash flowOperating free cash flow 305305 236236 +69+69* operations before integration costs* operations before integration costs

Average working capitalAverage working capital20022002
av w/cav w/c20012001
av w/cav w/c20022002
2002 at2002 atconstant constant
salessales
improvementimprovement
£m£m£m£m %%
Penguin / Pearson EdPenguin / Pearson Ed
% sales% sales
1,0921,092
31.9%31.9%
1,0901,090
30.3%30.3%
1,0391,039 5353 5%5%
FT GroupFT Group
% sales% sales
(35)(35)
(4.4)%(4.4)%
(38)(38)
(5.2)%(5.2)%
(41)(41) 66 17%17%
GroupGroup
% sales% sales
1,0571,057
25.0%25.0%
1,0521,052
24.4%24.4%
1,0291,029 2828 3%3%

Balance sheetBalance sheet£m£m 20022002 20012001 varvar
Intangible assetsIntangible assets 3,6103,610 4,1934,193 - 583- 583
Tangible assetsTangible assets 503503 542542 - 39- 39
Operating working capitalOperating working capital 811811 894894 - 83- 83
Other net assets Other net assets 55 690690 - 685- 685Net trading assetsNet trading assets 4,9294,929 6,3196,319 - 1,390- 1,390
Shareholders’ fundsShareholders’ funds 3,3383,338 3,7973,797 - 459- 459
Deferred taxDeferred tax (174)(174) (272)(272) +98+98
ProvisionsProvisions 165165 239239 - 74- 74
MinoritiesMinorities 192192 176176 +16+16
Net debtNet debt 1,4081,408 2,3792,379 - 971- 971Capital employedCapital employed 4,9294,929 6,3196,319 - 1,390- 1,3902001 RESTATED FOR FRS192001 RESTATED FOR FRS19

Current pension positionCurrent pension positionActuarial Status – Funded SchemesActuarial Status – Funded Schemes
UKUK
£1bn defined benefit£1bn defined benefit
£43m surplus in 2001£43m surplus in 2001
17% contribution level agreed17% contribution level agreed
RoWRoW
mainly US and Canadamainly US and Canada
£60m defined benefit£60m defined benefit
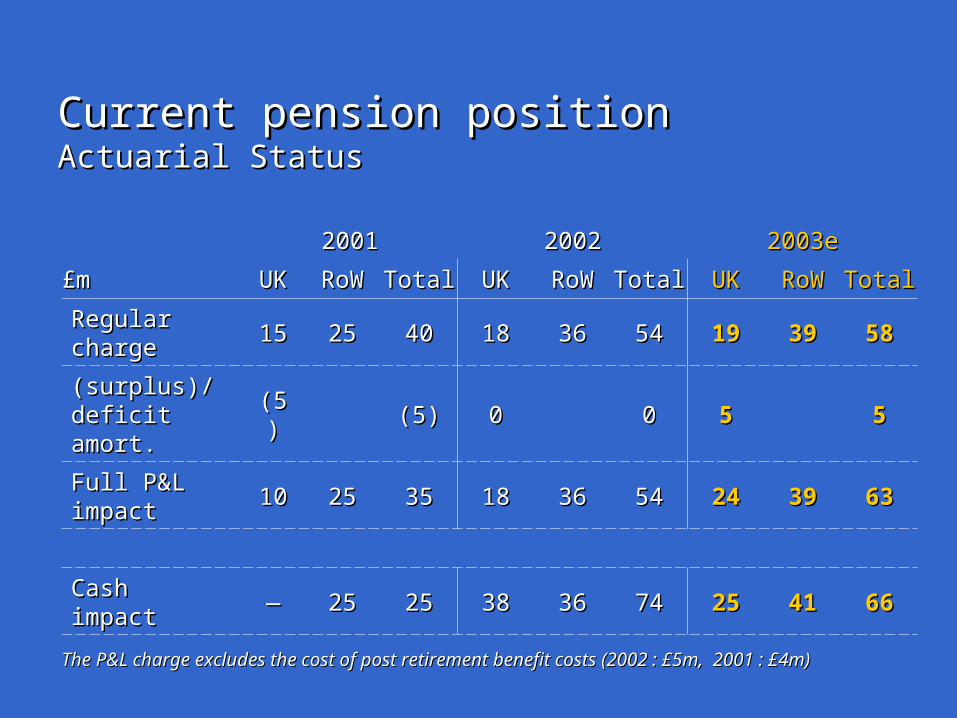
Current pension positionCurrent pension positionActuarial StatusActuarial Status
20012001 20022002 2003e2003e
£m£m UKUK RoWRoW TotalTotal UKUK RoWRoW TotalTotal UKUK RoWRoW TotalTotal
Regular Regular chargecharge 1515 2525 4040 1818 3636 5454 1919 3939 5858
(surplus)/(surplus)/deficit amort.deficit amort. (5)(5) (5)(5) 00 00 55 55
Full P&L Full P&L impactimpact 1010 2525 3535 1818 3636 5454 2424 3939 6363
Cash Cash impactimpact —— 2525 2525 3838 3636 7474 2525 4141 6666
The P&L charge excludes the cost of post retirement benefit costs (2002 : £5m, 2001 : £4m)The P&L charge excludes the cost of post retirement benefit costs (2002 : £5m, 2001 : £4m)

Impact of pension accountingImpact of pension accounting 20022002 2003E2003E
£m£m SSAP24SSAP24 FRS17FRS17 SSAP24SSAP24 FRS17FRS17
Operating chargeOperating charge (54)(54) (53)(53) (63)(63) (58)(58)
Interest benefit / (charge)Interest benefit / (charge) -- 44 -- (5)(5)
Profit before taxProfit before tax (54)(54) (49)(49) (63)(63) (63)(63)
£m£m 20012001 20022002
Net liability after tax (frs 17)Net liability after tax (frs 17)
UKUK 5151 149149
RoW (mainly us)RoW (mainly us) 2222 2525
Total net liability after tax (frs 17)Total net liability after tax (frs 17) 7373 174174

Return on invested capitalReturn on invested capital
Operating profitOperating profit
lessless
Cash taxCash tax
Net operating assetsNet operating assets
plusplus
Gross goodwillGross goodwill
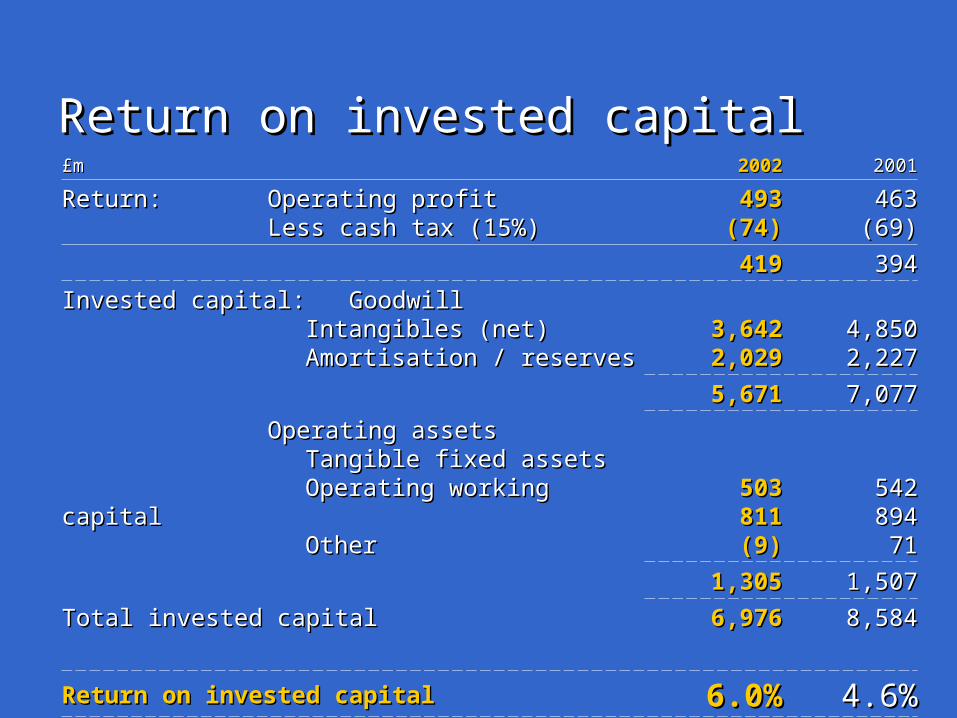
Return on invested capitalReturn on invested capital£m£m 20022002 20012001
Return: Return: Operating profitOperating profitLess cash tax (15%)Less cash tax (15%)
493493(74)(74)
463463(69)(69)
419419 394394
Invested capital:Invested capital: GoodwillGoodwillIntangibles (net)Intangibles (net)Amortisation / reservesAmortisation / reserves
3,6423,6422,0292,029
4,8504,8502,2272,227
5,6715,671 7,0777,077
Operating assetsOperating assetsTangible fixed assetsTangible fixed assetsOperating working capitalOperating working capitalOtherOther
503503811811(9)(9)
5425428948947171
1,3051,305 1,5071,507
Total invested capitalTotal invested capital 6,9766,976 8,5848,584
Return on invested capital Return on invested capital 6.0%6.0% 4.6%4.6%

2003 financial priorities 2003 financial priorities
Deliver steady earnings growthDeliver steady earnings growth
Improve cash generationImprove cash generation
Maintain balance sheet strengthMaintain balance sheet strength
Improve return on invested capitalImprove return on invested capital

PearsonPearson
AgendaAgenda
OutlookOutlook

Total sales £4,320m
School 27%
Higher Education 18%
Professional 19%
AgendaAgenda
OutlookOutlook
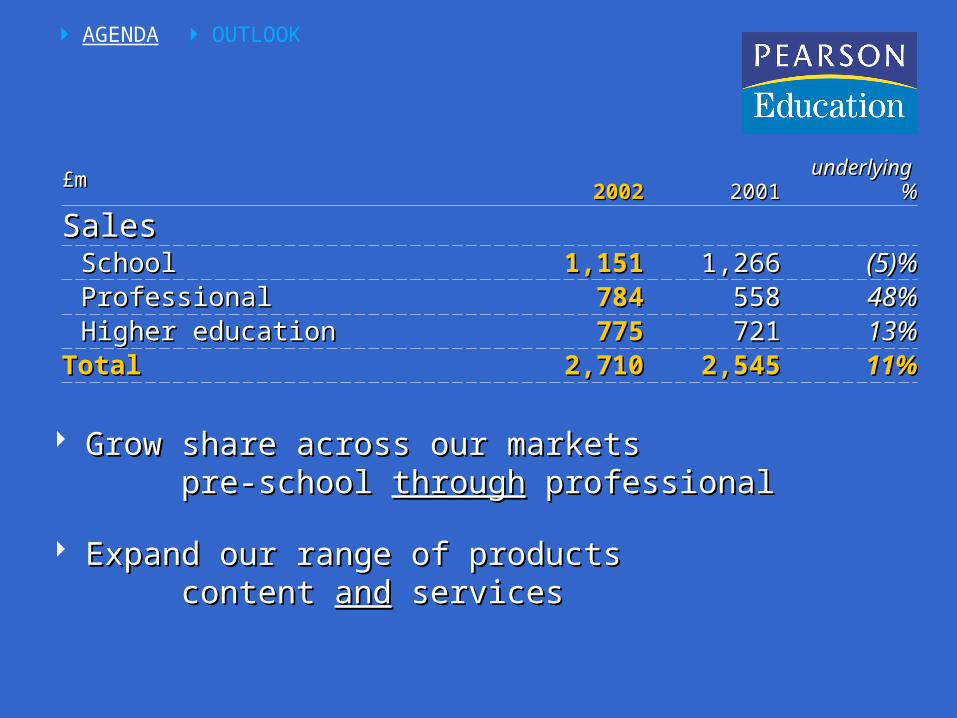
Grow share across our marketsGrow share across our marketspre-school pre-school throughthrough professional professional
AGENDA OUTLOOK
Expand our range of productsExpand our range of productscontent content andand services services
£m£m20022002 20012001
underlying underlying %%
SalesSalesSchoolSchool 1,1511,151 1,2661,266 (5)%(5)%ProfessionalProfessional 784784 558558 48%48%Higher educationHigher education 775775 721721 13%13%
TotalTotal 2,7102,710 2,5452,545 11%11%

School 27%
Higher Education 18%
Professional 19%
AGENDA OUTLOOK
FT Group 17%
Penguin 19%

SchoolSchool
AGENDA OUTLOOK
£m£m 20022002 20012001U/L U/L
changechange
SalesSales 1,1511,151 1,2661,266 - 5%- 5%
ProfitProfit 140140 167167 - 15%- 15%
Gain share profitably in publishingGain share profitably in publishing
Make leadership in online learning payMake leadership in online learning pay
Build on leadership in testingBuild on leadership in testing

Adoption opportunitiesAdoption opportunitiesChange in value of new adoptions ’o2/’03Change in value of new adoptions ’o2/’03$m$m
Pearson estimates of changes in: a) value of adoption opportunitiesb) value of adoptions in which Pearson is competing
SchoolSchool
AGENDA OUTLOOK
Pearson
Total
2002
-100
-220
2003
+30
+140
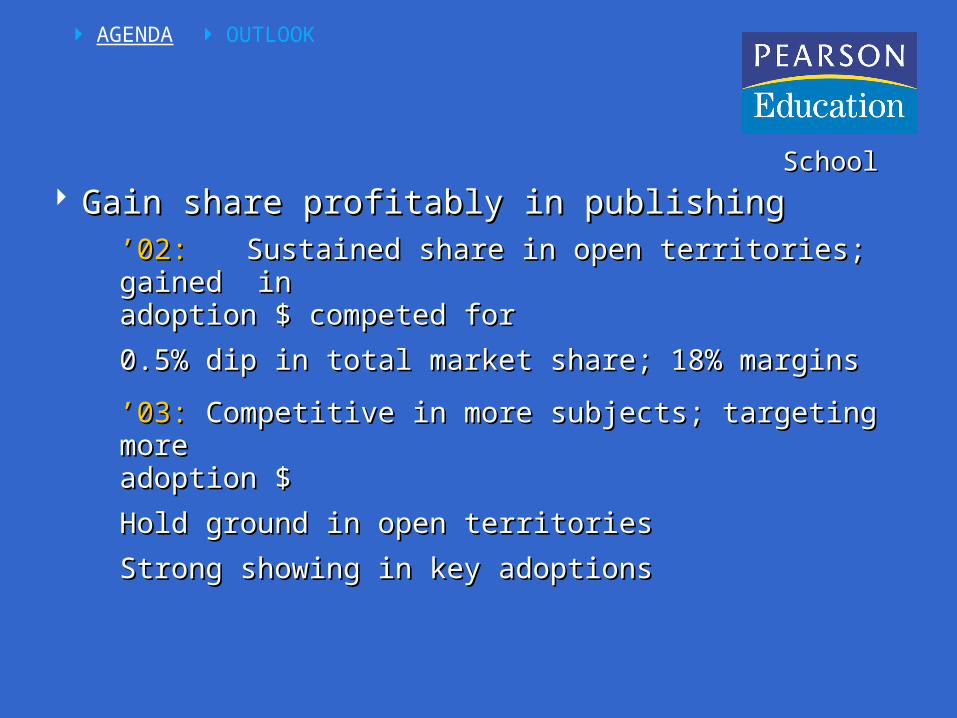
Gain share profitably in publishingGain share profitably in publishing’’02:02: Sustained share in open territories; gained in Sustained share in open territories; gained in
adoption $ competed foradoption $ competed for
0.5% dip in total market share; 18% margins0.5% dip in total market share; 18% margins
’’03:03: Competitive in more subjects; targeting more Competitive in more subjects; targeting more adoption $adoption $
Hold ground in open territoriesHold ground in open territories
Strong showing in key adoptionsStrong showing in key adoptions
SchoolSchool
AGENDA OUTLOOK
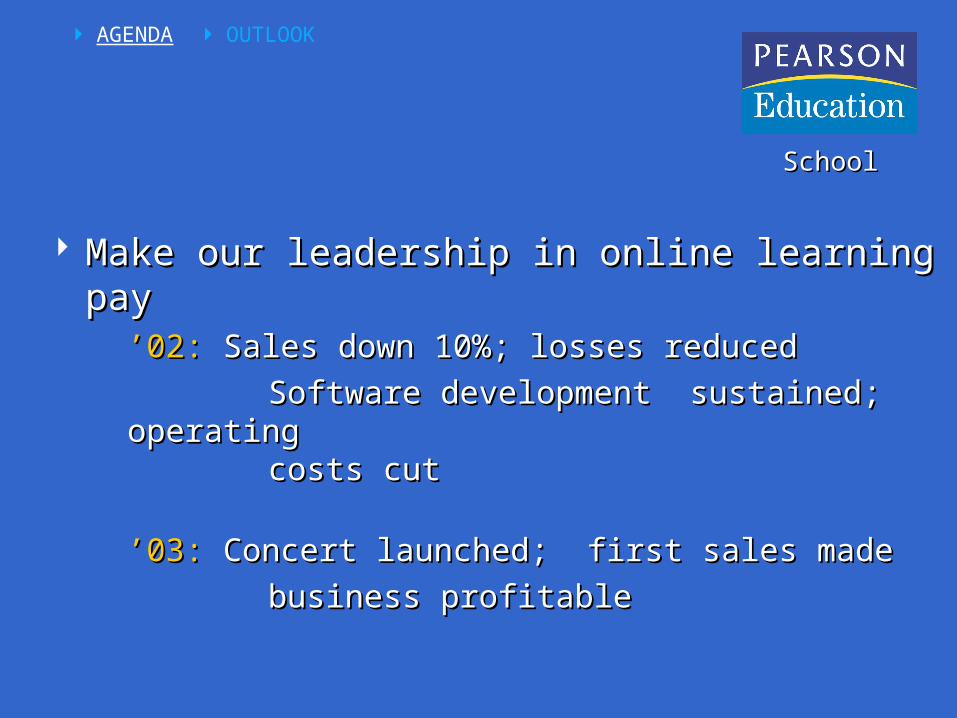
Make our leadership in online learning payMake our leadership in online learning pay’’02:02: Sales down 10%; losses reduced Sales down 10%; losses reduced
Software development sustained; operating Software development sustained; operating costs cutcosts cut
’’03:03: Concert launched; first sales made Concert launched; first sales made
business profitablebusiness profitable
SchoolSchool
AGENDA OUTLOOK

Build on leadership in testingBuild on leadership in testing’’02:02: 3% growth (after 13% in ’01) 3% growth (after 13% in ’01)
Major contracts renewed; new contracts signedMajor contracts renewed; new contracts signed
’’03:03: Benefits of new contracts start to kick in Benefits of new contracts start to kick in
winning our share of NCLB revenueswinning our share of NCLB revenues
SchoolSchool
AGENDA OUTLOOK

Protect margins in technology publishingProtect margins in technology publishing
Make corporate training profitableMake corporate training profitable
Expand certification contractsExpand certification contracts
Exploit surge in government spendingExploit surge in government spending
ProfessionalProfessional
AGENDA OUTLOOK
£M£M 20022002 20012001U/L U/L
changechange
SalesSales 784784 558558 +48%+48%
ProfitProfit 8181 8080 +8%+8%

Protect margins in technology publishingProtect margins in technology publishing’’02:02: US revenues down 12%; 20% decline in ’01 US revenues down 12%; 20% decline in ’01
Double-digit margins held; 1% market share Double-digit margins held; 1% market share gaingain
’’03:03: Hold margins Hold marginsConsider prospectsConsider prospects
ProfessionalProfessional
AGENDA OUTLOOK

Make corporate training profitableMake corporate training profitable’’02:02: Unprofitable operations sold Unprofitable operations sold
’’03:03: Other divisions integrated Other divisions integrated Within FT & Government SolutionsWithin FT & Government Solutions
ProfessionalProfessional
AGENDA OUTLOOK

Expand certification contractsExpand certification contracts’’02:02: Investment in testing centres Investment in testing centres
’’03:03: First full year of centres, new contracts First full year of centres, new contracts
ProfessionalProfessional
AGENDA OUTLOOK

Exploit surge in federal testing and trainingExploit surge in federal testing and training’’02:02: TSA contract won; task complete in 6 months TSA contract won; task complete in 6 months
further $300m new contracts signedfurther $300m new contracts signed
’’03:03: $1 billion contracted through 2007 $1 billion contracted through 2007strong pipelinestrong pipeline
ProfessionalProfessional
AGENDA OUTLOOK

Driving NCS ahead of acquisition modelDriving NCS ahead of acquisition model
68
90
139
2000 2001 2002
NCS Pearson profitsNCS Pearson profits$ million$ million
AGENDA OUTLOOK
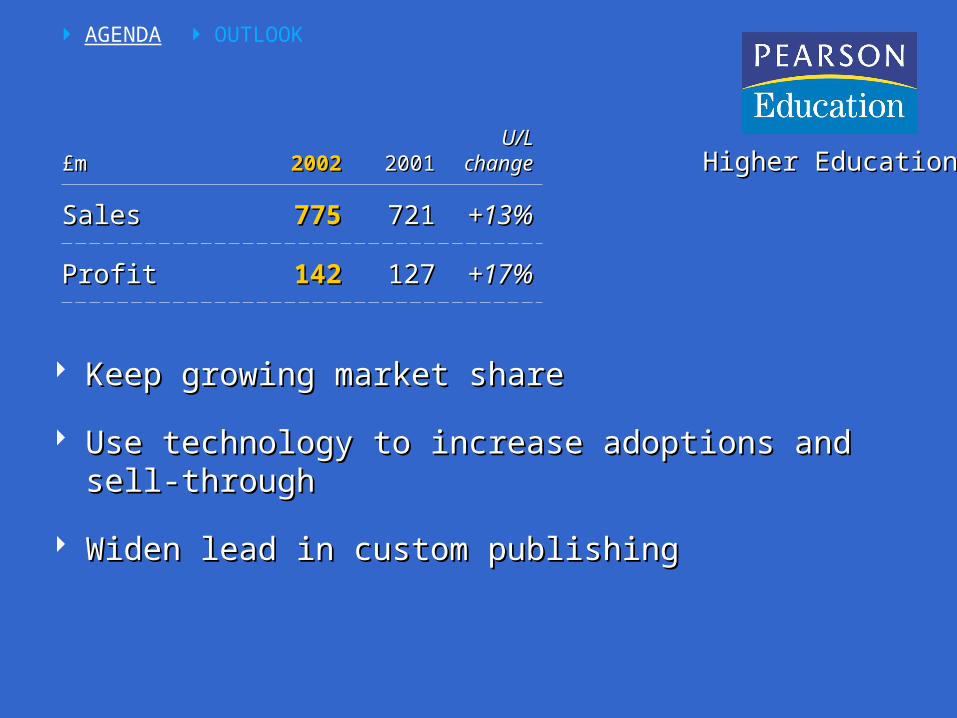
Keep growing market shareKeep growing market share
Use technology to increase adoptions and sell-throughUse technology to increase adoptions and sell-through
Widen lead in custom publishingWiden lead in custom publishing
Higher EducationHigher Education
AGENDA OUTLOOK
£m£m 20022002 20012001U/L U/L
changechange
SalesSales 775775 721721 +13%+13%
ProfitProfit 142142 127127 +17%+17%
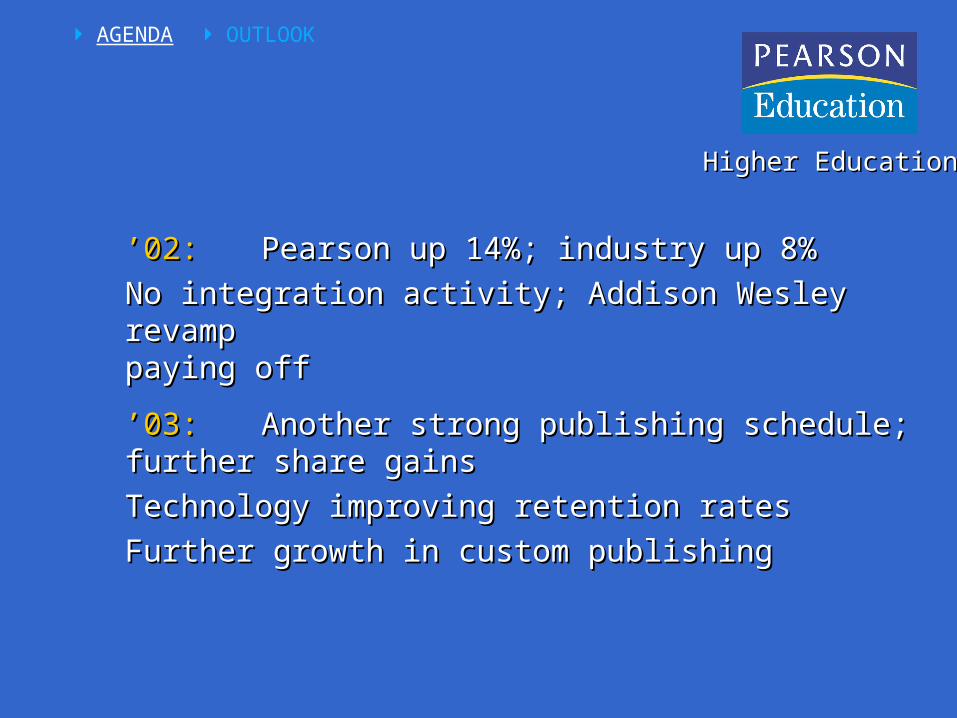
’’02:02: Pearson up 14%; industry up 8%Pearson up 14%; industry up 8%
No integration activity; Addison Wesley revamp No integration activity; Addison Wesley revamp
paying offpaying off
’’03:03: Another strong publishing schedule; Another strong publishing schedule; further share gainsfurther share gains
Technology improving retention ratesTechnology improving retention rates
Further growth in custom publishingFurther growth in custom publishing
Higher EducationHigher Education
AGENDA OUTLOOK

2003: 2003:
US school grows againUS school grows again
Professional faces tough revenue comparisonsProfessional faces tough revenue comparisons
Higher Ed outperforms its marketHigher Ed outperforms its market
Margins benefit from revenue mix Margins benefit from revenue mix and management actionand management action
AGENDA OUTLOOK

FT Group 17%
AgendaAgenda
OutlookOutlook
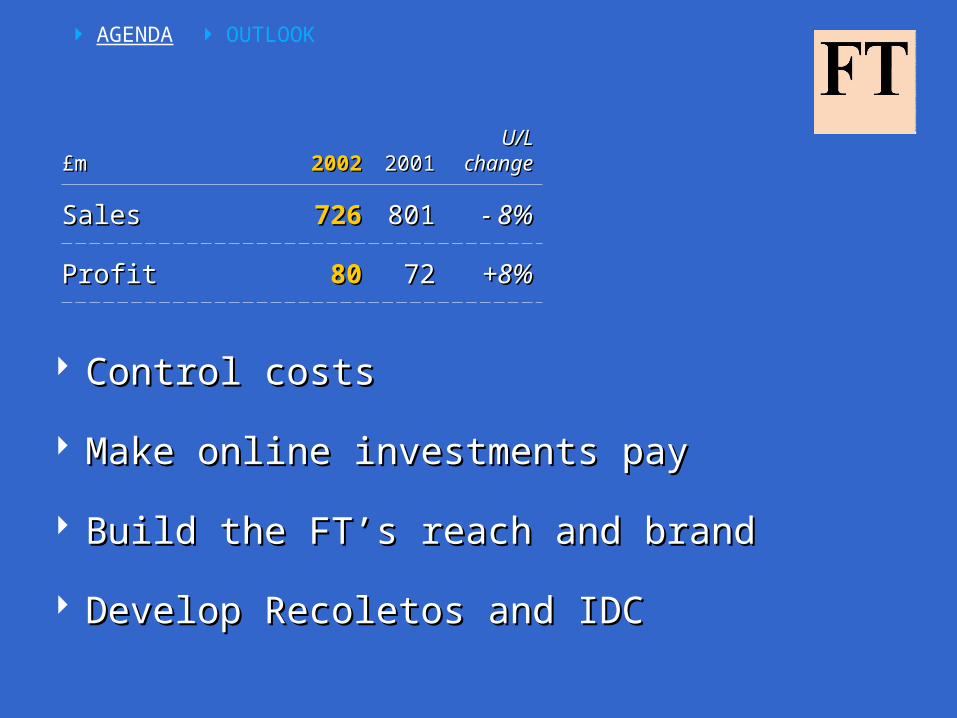
£m£m 20022002 20012001U/L U/L
changechange
SalesSales 726726 801801 - 8%- 8%
ProfitProfit 8080 7272 +8%+8%
Control costsControl costs
Make online investments payMake online investments pay
Build the FT’s reach and brandBuild the FT’s reach and brand
Develop Recoletos and IDC Develop Recoletos and IDC
AGENDA OUTLOOK
Control costsControl costs’’02:02: FT costs down £80m lower than 2000 FT costs down £80m lower than 2000
’’03:03: Cost savings fund modest investmentCost savings fund modest investment
AGENDA OUTLOOK

Make on-line investments payMake on-line investments pay’’02:02: FT.com revenues up 9%; broke even in Q4FT.com revenues up 9%; broke even in Q4
On-line businesses fully integratedOn-line businesses fully integrated
’’03:03: Subscriptions add revenueSubscriptions add revenueUsers add reachUsers add reach
AGENDA OUTLOOK

Build our reach and brandBuild our reach and brand’’02:02: Circulation down 5%Circulation down 5%
Readership, ad share and quality maintainedReadership, ad share and quality maintainedFT.com audience up 30% to 3.5 millionFT.com audience up 30% to 3.5 million
’’03:03: Defend and extend leadership in UK and Defend and extend leadership in UK and EuropeEurope
Add subscribers in USAdd subscribers in USEstablish ourselves in AsiaEstablish ourselves in Asia
AGENDA OUTLOOK
Develop RecoletosDevelop Recoletos’’02:02: Tight cost controlTight cost control
Successful revamp of MarcaSuccessful revamp of Marca
’’03:03: Focus on core marketsFocus on core marketsSustain profit momentumSustain profit momentum
AGENDA OUTLOOK

Develop IDCDevelop IDC’’02:02: 95% customer renewal rates95% customer renewal rates
MLSPS integratedMLSPS integratedNew products launchedNew products launched
’’03:03: Tend the businessTend the business
Make the most of ComstockMake the most of Comstock - integration - integration - real-time pricing - real-time pricing
AGENDA OUTLOOK
IDC 31%
FT Group revenues

2003:2003:
No sign of an advertising recoveryNo sign of an advertising recovery
Tight cost controlsTight cost controls
Phased, incremental investment plannedPhased, incremental investment planned
Further profits growth at Recoletos Further profits growth at Recoletos
IDC to deliver double digit revenue and earnings growthIDC to deliver double digit revenue and earnings growth
AGENDA OUTLOOK

AgendaAgenda
OutlookOutlook
Penguin 19%
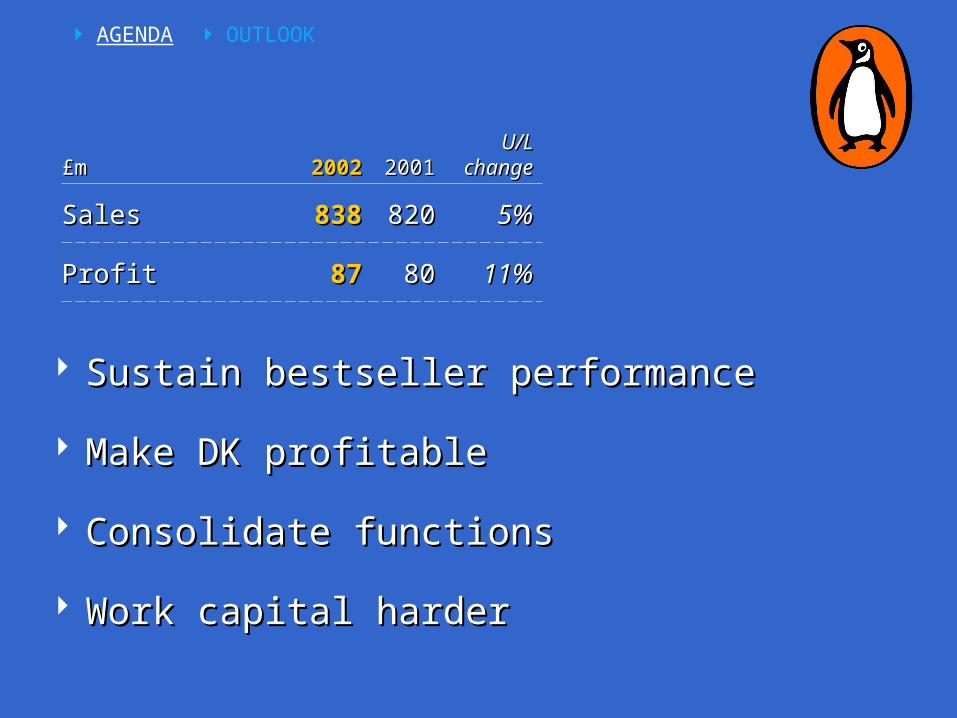
£m£m 20022002 20012001U/L U/L
changechange
SalesSales 838838 820820 5%5%
ProfitProfit 8787 8080 11%11%
AGENDA OUTLOOK
Sustain bestseller performanceSustain bestseller performance
Make DK profitableMake DK profitable
Consolidate functionsConsolidate functions
Work capital harderWork capital harder

Sustain bestseller performanceSustain bestseller performance’’02:02: Most #1’s in US; 10 year best in UKMost #1’s in US; 10 year best in UK
’’03:03: New and old books, new imprintsNew and old books, new imprints
AGENDA OUTLOOK

Make DK profitableMake DK profitable’’02:02: £15m profit improvement, 5% margin£15m profit improvement, 5% margin
’’03:03: Further benefits from integrationFurther benefits from integrationPublishing revitalisedPublishing revitalisedMajor education programmesMajor education programmes
AGENDA OUTLOOK

Consolidate functionsConsolidate functions
AGENDA OUTLOOK

Pearson: the world’s largest book companyPearson: the world’s largest book company
SOURCE: ANNUAL REPORTS, ANALYST REPORTSSOURCE: ANNUAL REPORTS, ANALYST REPORTSNOTE: 2001 MEDIAN GBP / USD EXCHANGE RATE = 1.45NOTE: 2001 MEDIAN GBP / USD EXCHANGE RATE = 1.45
Estimated 2001 book revenues ($m)Estimated 2001 book revenues ($m)
869
959
988
1,000
1,828
1,858
2,322
4,188
Harcourst / Reed
New Corp(HarperCollins)
Holtzbrinck
Scholastic
Bertelsmann
McGraw Hill
Pearson
AGENDA OUTLOOK
Houghton Mifflin
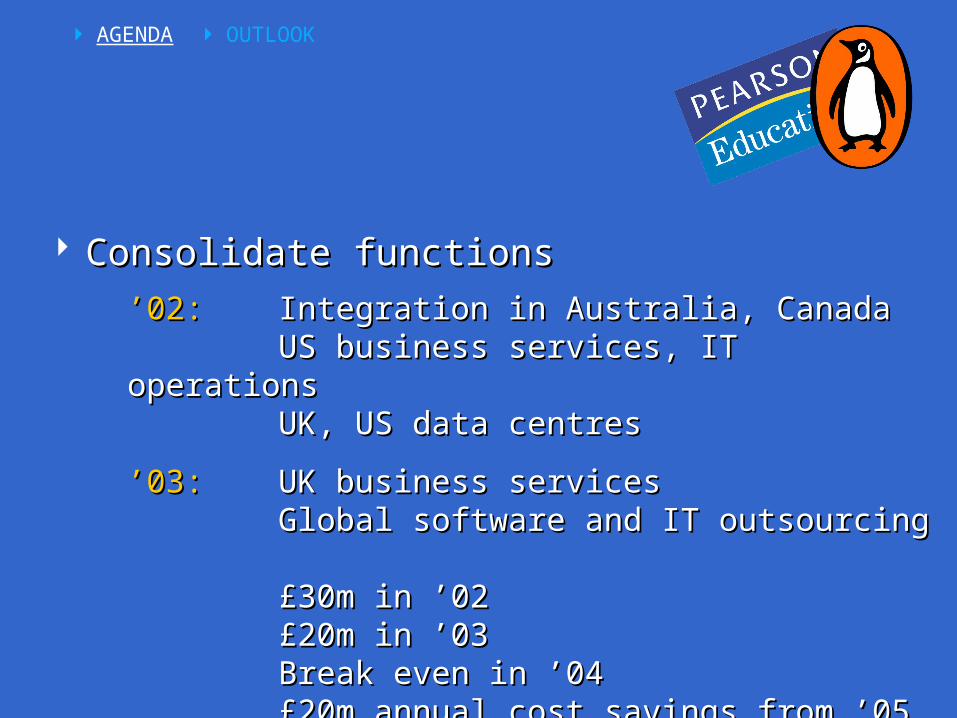
Consolidate functionsConsolidate functions
’’02:02: Integration in Australia, CanadaIntegration in Australia, CanadaUS business services, IT operationsUS business services, IT operationsUK, US data centresUK, US data centres
’’03:03: UK business servicesUK business servicesGlobal software and IT outsourcingGlobal software and IT outsourcing
£30m in ’02£30m in ’02£20m in ’03 £20m in ’03 Break even in ’04 Break even in ’04 £20m annual cost savings from ’05£20m annual cost savings from ’05
AGENDA OUTLOOK

Ahead of our marketAhead of our market
Sales growthSales growth
Margin growthMargin growth
AGENDA OUTLOOK
2003:2003:

2003:2003:
Significant earnings growthSignificant earnings growth
Further progress in free cash flowFurther progress in free cash flow
Improved return on invested capitalImproved return on invested capital


![]Mark Scheme (Results) January 2019 Pearson Edexcel ...](https://static.documents.pub/doc/80x56/6175a33a4d4dc05cbe4db1b2/mark-scheme-results-january-2019-pearson-edexcel-.jpg)


