Supporting Information to Mikutta & Rothwell S1 Peat Bogs as Hotspots for Organoarsenical Formation and Persistence Christian Mikutta a,b, * and James J. Rothwell c a Section for Environmental Chemistry and Physics, Department of Plant and Environmental Sciences, University of Copenhagen, DK-1871 Frederiksberg C, Denmark b Soil Chemistry Group, Institute of Biogeochemistry and Pollutant Dynamics, Department of Envi- ronmental Systems Science, CHN, ETH Zurich, 8092 Zurich, Switzerland c Upland Environments Research Unit, Geography, School of Environment, Education and Develop- ment, The University of Manchester, Manchester M13 9PL, U.K. Supporting Information (27 pages, 13 figures, 10 tables) Table of Contents 1. Field site characteristics ...................................................................................................... S2 2. Down-core distributions of major and trace elements......................................................... S3 3. ESEM-EDS analyses of peat samples ................................................................................. S5 4. Total element contents and C/N ratios of peat samples analyzed by XAS ......................... S6 5. Synchrotron measurements and data treatment ................................................................... S6 6. Principal component analysis and target-transform testing for As ..................................... S7 7. Linear combination fit analyses for As ............................................................................... S10 8. Arsenic EXAFS shell-fit analyses ....................................................................................... S12 9. Principal component analysis and target-transform testing for Fe ...................................... S15 10. Linear combination fit analyses for Fe ................................................................................ S18 11. Aqueous-phase measurements ............................................................................................ S19 12. Concentration and speciation of extractable solid-phase As ............................................... S21 13. Sulfur speciation analyses and results ................................................................................. S22 14. References ........................................................................................................................... S26 *Corresponding author Email: [email protected]Phone: +45-35334364
Transcript
Supporting Information to Mikutta & Rothwell
S1
Peat Bogs as Hotspots for Organoarsenical Formation and Persistence
Christian Mikuttaa,b,* and James J. Rothwellc
aSection for Environmental Chemistry and Physics, Department of Plant and Environmental Sciences, University of Copenhagen, DK-1871 Frederiksberg C, Denmark
bSoil Chemistry Group, Institute of Biogeochemistry and Pollutant Dynamics, Department of Envi-ronmental Systems Science, CHN, ETH Zurich, 8092 Zurich, Switzerland
cUpland Environments Research Unit, Geography, School of Environment, Education and Develop-ment, The University of Manchester, Manchester M13 9PL, U.K.
Supporting Information
(27 pages, 13 figures, 10 tables)
Table of Contents
1. Field site characteristics ...................................................................................................... S2
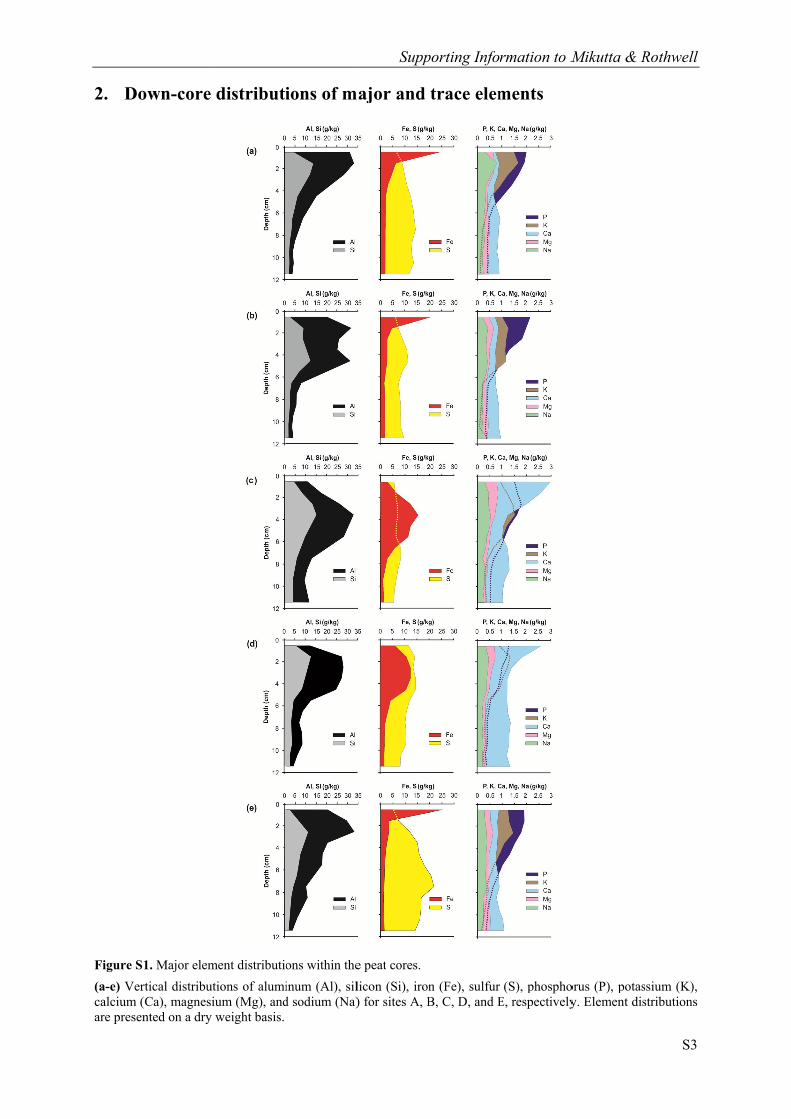
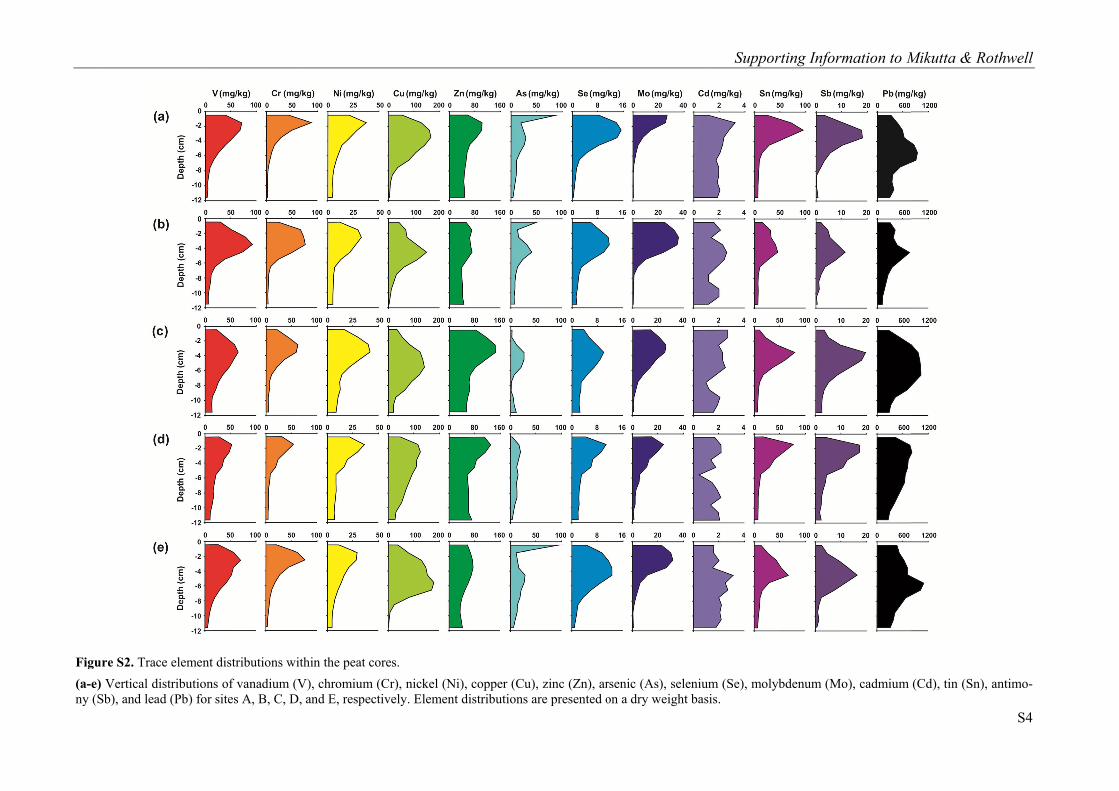
2. Down-core distributions of major and trace elements ......................................................... S3
3. ESEM-EDS analyses of peat samples ................................................................................. S5
4. Total element contents and C/N ratios of peat samples analyzed by XAS ......................... S6
5. Synchrotron measurements and data treatment ................................................................... S6
6. Principal component analysis and target-transform testing for As ..................................... S7
7. Linear combination fit analyses for As ............................................................................... S10
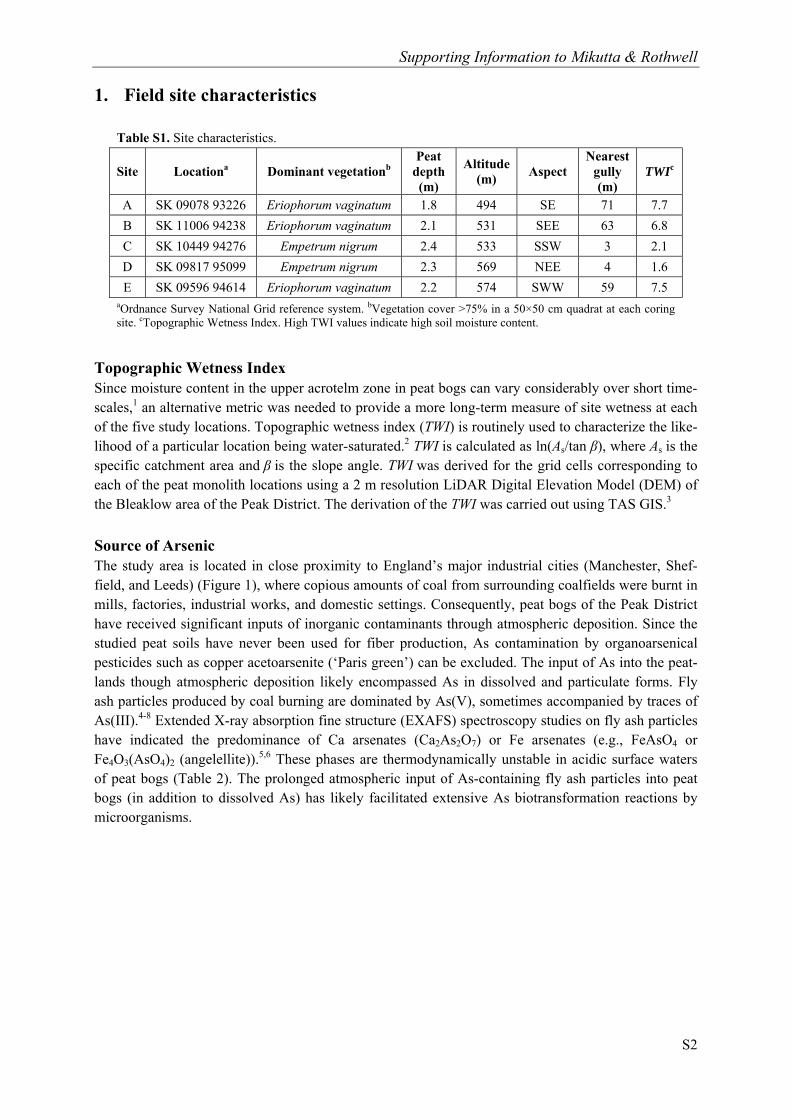
Topographic Wetness Index Since moisture content in the upper acrotelm zone in peat bogs can vary considerably over short time-scales,1 an alternative metric was needed to provide a more long-term measure of site wetness at each of the five study locations. Topographic wetness index (TWI) is routinely used to characterize the like-lihood of a particular location being water-saturated.2 TWI is calculated as ln(As/tan β), where As is the specific catchment area and β is the slope angle. TWI was derived for the grid cells corresponding to each of the peat monolith locations using a 2 m resolution LiDAR Digital Elevation Model (DEM) of the Bleaklow area of the Peak District. The derivation of the TWI was carried out using TAS GIS.3
Source of Arsenic The study area is located in close proximity to England’s major industrial cities (Manchester, Shef-field, and Leeds) (Figure 1), where copious amounts of coal from surrounding coalfields were burnt in mills, factories, industrial works, and domestic settings. Consequently, peat bogs of the Peak District have received significant inputs of inorganic contaminants through atmospheric deposition. Since the studied peat soils have never been used for fiber production, As contamination by organoarsenical pesticides such as copper acetoarsenite (‘Paris green’) can be excluded. The input of As into the peat-lands though atmospheric deposition likely encompassed As in dissolved and particulate forms. Fly ash particles produced by coal burning are dominated by As(V), sometimes accompanied by traces of As(III).4-8 Extended X-ray absorption fine structure (EXAFS) spectroscopy studies on fly ash particles have indicated the predominance of Ca arsenates (Ca2As2O7) or Fe arsenates (e.g., FeAsO4 or Fe4O3(AsO4)2 (angelellite)).5,6 These phases are thermodynamically unstable in acidic surface waters of peat bogs (Table 2). The prolonged atmospheric input of As-containing fly ash particles into peat bogs (in addition to dissolved As) has likely facilitated extensive As biotransformation reactions by microorganisms.
Table S1. Site characteristics.
Site Locationa Dominant vegetationb Peat
depth (m)
Altitude (m)
Aspect Nearest
gully (m)
TWIc
A SK 09078 93226 Eriophorum vaginatum 1.8 494 SE 71 7.7
B SK 11006 94238 Eriophorum vaginatum 2.1 531 SEE 63 6.8
C SK 10449 94276 Empetrum nigrum 2.4 533 SSW 3 2.1
D SK 09817 95099 Empetrum nigrum 2.3 569 NEE 4 1.6
E SK 09596 94614 Eriophorum vaginatum 2.2 574 SWW 59 7.5 aOrdnance Survey National Grid reference system. bVegetation cover >75% in a 50×50 cm quadrat at each coring site. cTopographic Wetness Index. High TWI values indicate high soil moisture content.
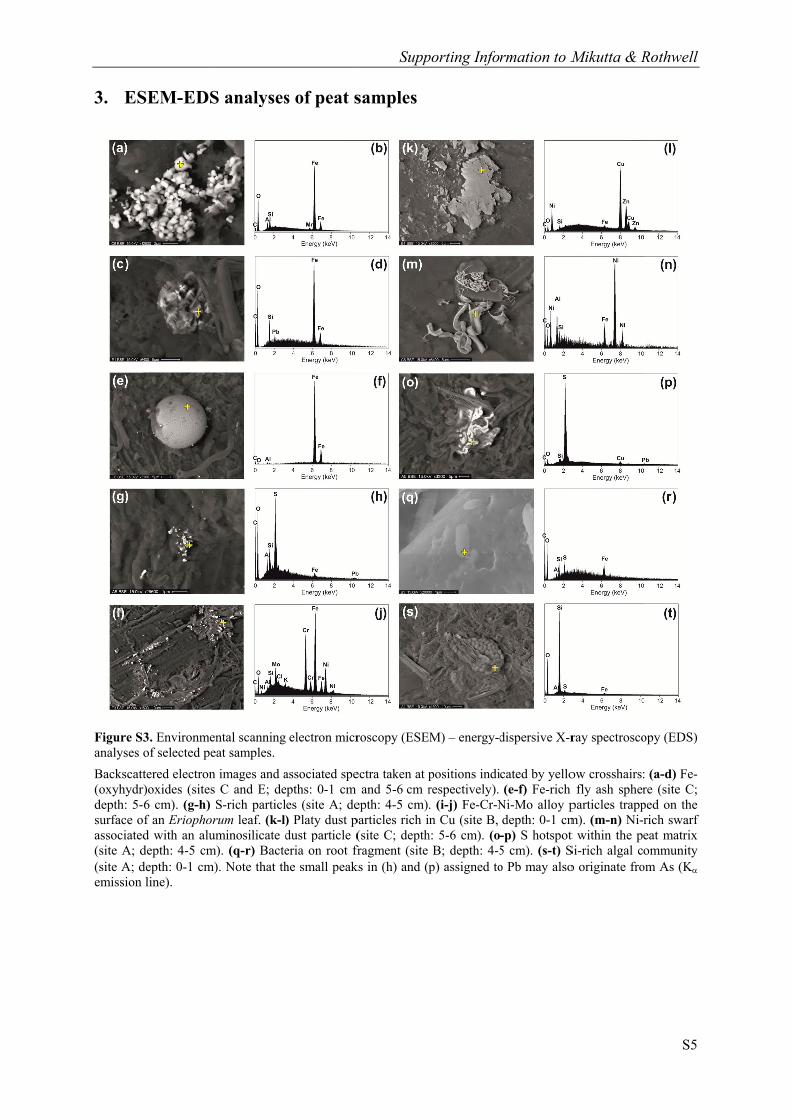
of an Eriophord with an aludepth: 4-5 cmdepth: 0-1 cm)line).
S analyses
ental scanning eat samples.
n images and as C and E; deS-rich particlrum leaf. (k-l)
uminosilicate dm). (q-r) Bacte
). Note that th
s of peat s
electron micr
associated speepths: 0-1 cm es (site A; de) Platy dust pdust particle (eria on root frhe small peak
Supp
samples
roscopy (ESE
ectra taken at pand 5-6 cm r
epth: 4-5 cm)particles rich i(site C; depth
fragment (site ks in (h) and (p
porting Infor
M) – energy-d
positions indirespectively). . (i-j) Fe-Cr-Nn Cu (site B,
h: 5-6 cm). (oB; depth: 4-5
p) assigned to
rmation to M
dispersive X-r
cated by yello(e-f) Fe-rich
Ni-Mo alloy pdepth: 0-1 cm-p) S hotspot 5 cm). (s-t) So Pb may also
Mikutta & R
ray spectrosco
ow crosshairs:fly ash spher
particles trappm). (m-n) Ni-t within the pSi-rich algal co originate fro
Rothwell
S5
opy (EDS)
: (a-d) Fe-re (site C; ped on the rich swarf eat matrix ommunity
om As (K
Supporting Information to Mikutta & Rothwell
S6
4. Total element contents and C/N ratios of peat samples analyzed by XAS
5. Synchrotron measurements and data treatment
Homogenized powdered peat samples placed in Al sample holders were analyzed by bulk As K-edge (11867 eV), Fe K-edge (7112 eV), and S K-edge (2472 eV) X-ray absorption spectroscopy (XAS) at beamlines 11-2 (As), 4-1 (Fe), and 4-3 (S) of the Stanford Synchrotron Radiation Lightsource (SSRL, Menlo Park, CA, USA). For the S and Fe XAS measurements the total absorber concentration in the samples was adjusted to ≤2000 mg/kg (S) and ≤10 g/kg (Fe) with BN. The beamlines were equipped with Si(220) (φ = 90°) (4-1, 11-2) and Si(111) (φ = 0°) (4-3) double-crystal monochromators. Higher harmonics in the beam were reduced by monochromator detuning (4-1: 60%, 11-2: 40%) or by using harmonic rejection mirrors (4-3). Arsenic and Fe X-ray absorption near edge structure (XANES) and extended X-ray absorption fine structure (EXAFS) spectra were recorded in fluorescence-yield mode at ~10 K (As) or ~15 K (Fe) using closed-cycle He(l) cryostats and a 100-element (As) or a 32-element (Fe) solid-state Ge detector. Undesired fluorescence radiation during the As measurements was suppressed by a 3-µ Ge filter, Al foil, and a home-made scatter-guard. For the Fe measurements, a 3-µ Mn filter and the scatter-guard were used. The monochromators were calibrated by setting the first inflection point of the L3 absorption edge of elemental Au to 11919 eV for As or of the K absorption edge of elemental Fe to 7112 eV for Fe. The metal foils were simultaneously measured in transmission mode with the samples in order to correct for possible energy shifts during the sample measurements. Up to six scans per sample were collected, averaged, and dead-time corrected if necessary. For S XANES measurements, the samples were placed in He atmosphere (<0.1% (v/v) O2) and measured at 100-120 K in fluorescence-yield mode using a He(l) cryostream (nozzle temperature: ~8 K) and a Lytle detector. The monochromator was calibrated to the white-line energy of a Na2S2O3 standard (2472.02 eV). The calibration was checked at regular intervals, and up to four scans per sample were collected and averaged.
Table S2. Total element contents and C/N ratios of peat samples analyzed by XAS. Values are given on a dry weight basis.
Sample Depth (cm)
Fe (g/kg)
As (mg/kg)
C (wt.%)
N (wt.%)
C/N (wt.)
S (g/kg)
A2 2-3 4.34 24 50.8 2.12 24 5.42
A3 4-5 2.05 25 50.0 1.66 30 7.02
A4 6-7 1.94 10 46.3 1.06 44 5.00
B2 2-3 2.92 14 47.6 3.03 16 3.87
B3 4-5 2.82 40 49.4 2.20 22 3.71
B4 6-7 1.73 12 49.6 1.75 28 3.92
C2 2-3 12.3 12 48.1 2.57 19 2.16
C3 4-5 12.2 26 51.8 2.29 23 2.36
C4 6-7 5.73 9 51.3 2.32 22 2.40
D3 4-5 10.3 10 50.3 2.17 23 2.87
D4 6-7 3.16 10 51.9 2.12 24 2.54
D5 8-9 1.84 10 50.2 2.68 19 2.71
E1 0-1 24.8 92 46.4 2.93 16 2.72
E2 2-3 3.30 15 48.6 2.76 18 6.30
E3 4-5 1.87 27 50.3 2.82 18 8.33
Supporting Information to Mikutta & Rothwell
S7
All XAS spectra were processed in Athena9 using standard procedures. The Autobk algorithm was applied for background removal using a linear pre-edge line between 50 and 200 eV before the edge, E0, and a normalization range of 150-755 eV (As) or 150-590 eV (Fe) (E-E0). The edge energy, E0, was defined as (first) zero crossing of the second XANES derivative. By default a quadratic polyno-mial was used as a post-edge line. The frequency cut-off parameter, Rbkg, was set to 0.85-1.0 for As or to 0.9 for Fe, and the k weight in the background function determination was generally set to three. For the S XANES spectra, the pre-edge and normalization range was 10-70 eV (E0-E) and 60-125 eV (E-E0), respectively, and the k weight for the background function determination was set to two.
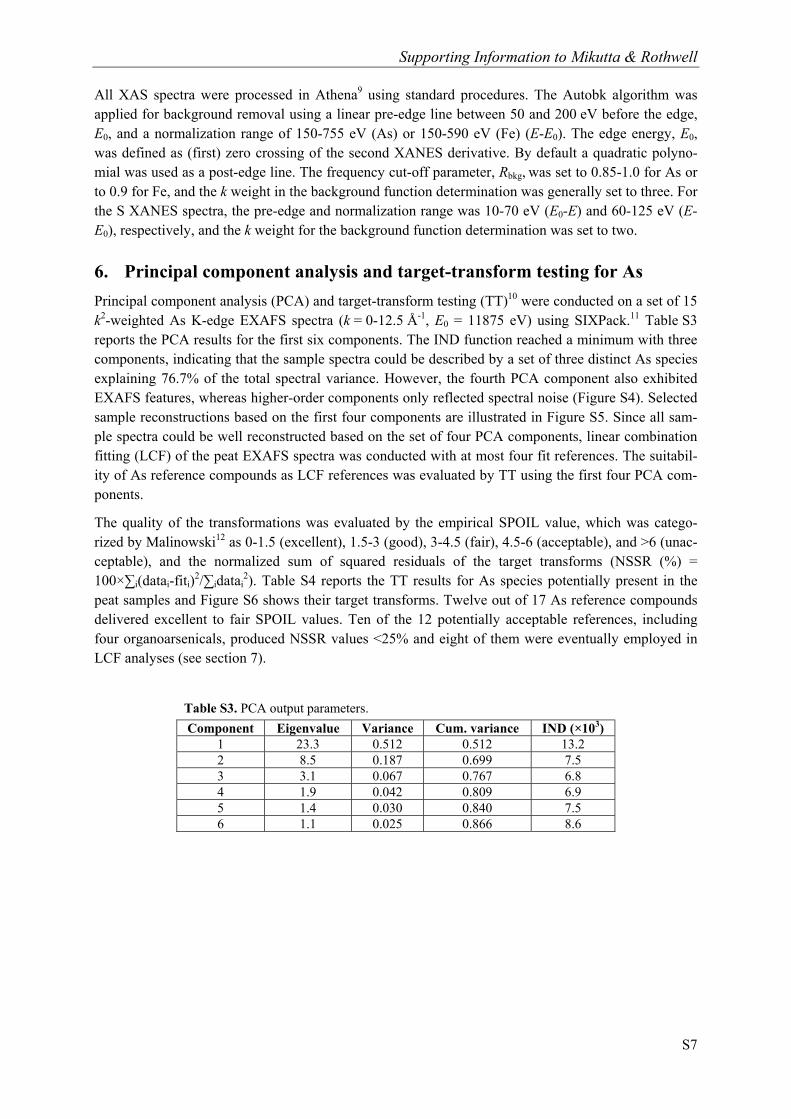
6. Principal component analysis and target-transform testing for As
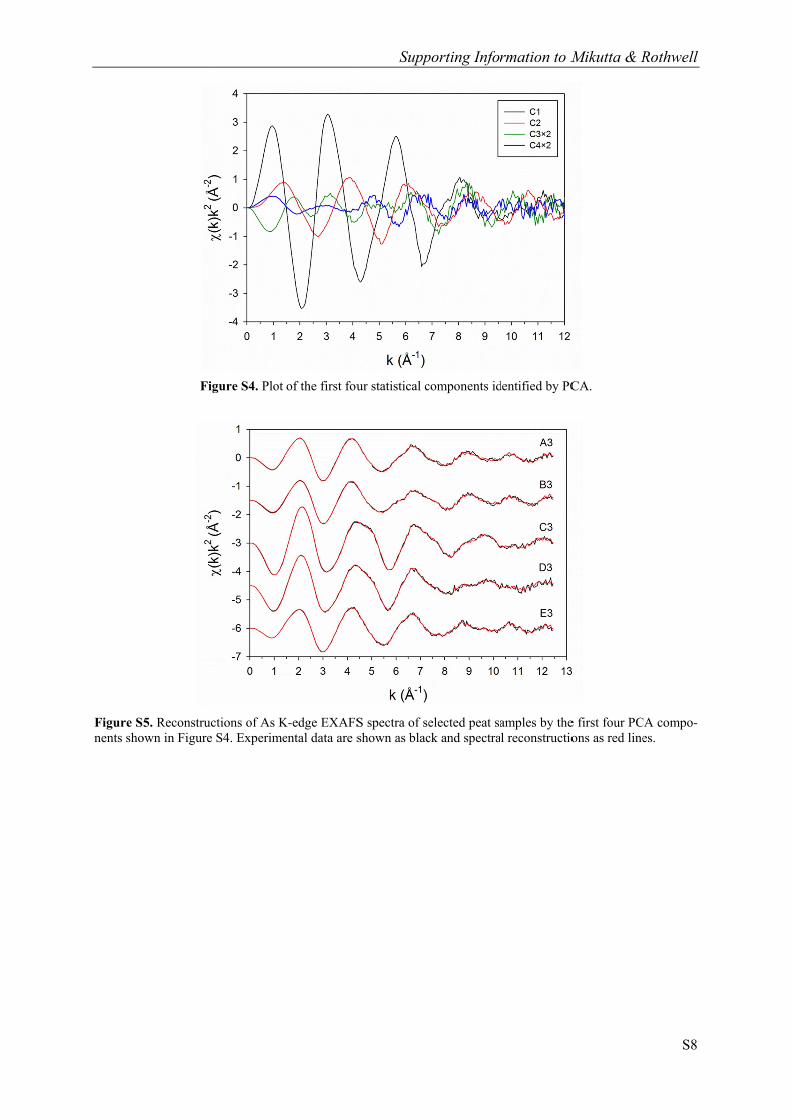
Principal component analysis (PCA) and target-transform testing (TT)10 were conducted on a set of 15 k2-weighted As K-edge EXAFS spectra (k = 0-12.5 Å-1, E0 = 11875 eV) using SIXPack.11 Table S3 reports the PCA results for the first six components. The IND function reached a minimum with three components, indicating that the sample spectra could be described by a set of three distinct As species explaining 76.7% of the total spectral variance. However, the fourth PCA component also exhibited EXAFS features, whereas higher-order components only reflected spectral noise (Figure S4). Selected sample reconstructions based on the first four components are illustrated in Figure S5. Since all sam-ple spectra could be well reconstructed based on the set of four PCA components, linear combination fitting (LCF) of the peat EXAFS spectra was conducted with at most four fit references. The suitabil-ity of As reference compounds as LCF references was evaluated by TT using the first four PCA com-ponents.
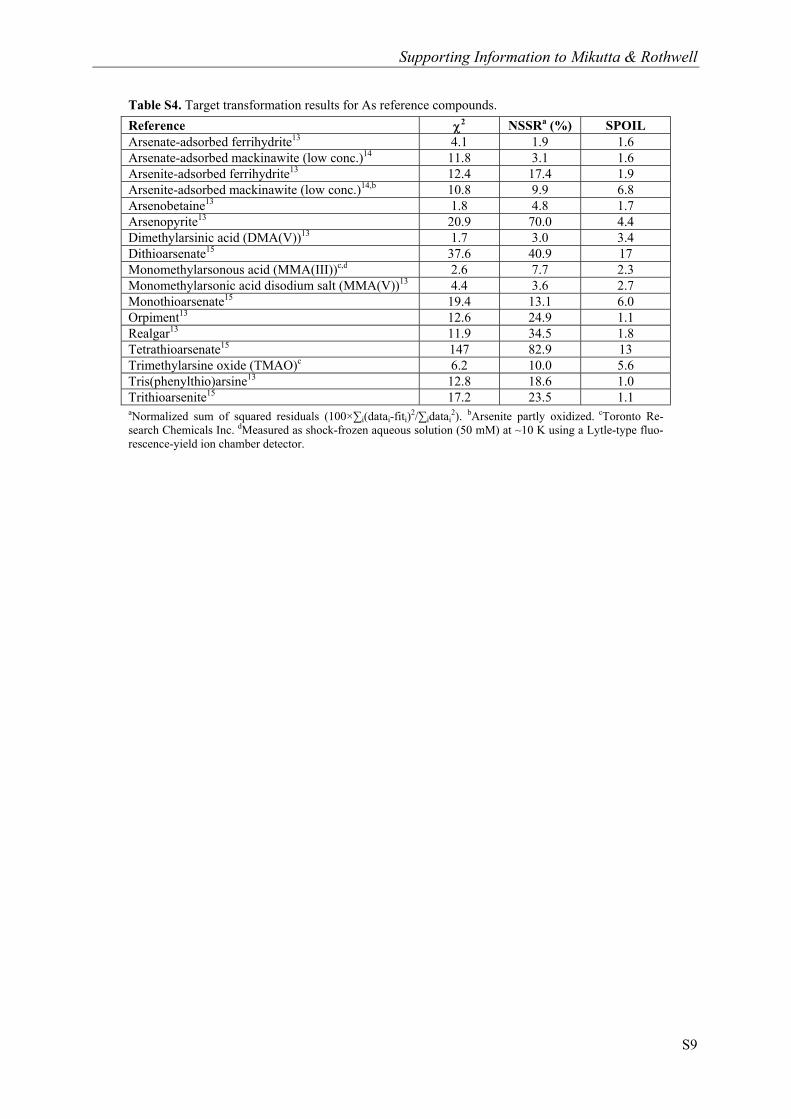
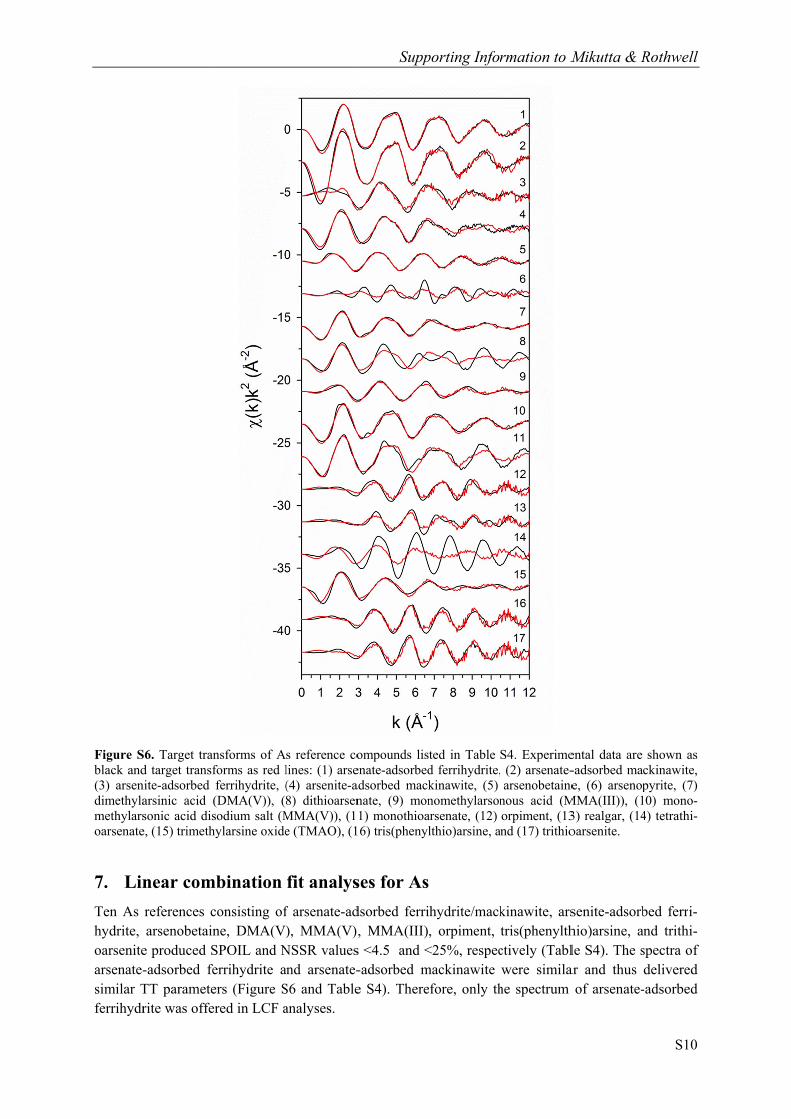
The quality of the transformations was evaluated by the empirical SPOIL value, which was catego-rized by Malinowski12 as 0-1.5 (excellent), 1.5-3 (good), 3-4.5 (fair), 4.5-6 (acceptable), and >6 (unac-ceptable), and the normalized sum of squared residuals of the target transforms (NSSR (%) = 100×∑i(datai-fiti)
2/∑idatai2). Table S4 reports the TT results for As species potentially present in the
peat samples and Figure S6 shows their target transforms. Twelve out of 17 As reference compounds delivered excellent to fair SPOIL values. Ten of the 12 potentially acceptable references, including four organoarsenicals, produced NSSR values <25% and eight of them were eventually employed in LCF analyses (see section 7).
senite-adsorbhio)arsine, ale S4). The sar and thus
of arsenate-
Rothwell
S10
shown as ckinawite, pyrite, (7)
10) mono-4) tetrathi-
bed ferri-nd trithi-
spectra of delivered -adsorbed
Supporting Information to Mikutta & Rothwell
S11
Note that the presence of NO3 and SO4 in the peat porewaters indicates suboxic conditions (Table 2), which render Fe(III)-(oxyhydr)oxides more likely As sorbents than Fe sulfides. Nonetheless, because we cannot rule out the presence of Fe sulfides, the fit fraction of ‘arsenate-adsorbed ferrihydrite’ is conservatively referred to as ‘Fe-bound arsenate’. The trithioarsenite spectrum also produced a low SPOIL value (Table S4). In this compound As(III) is bound to three S atoms as in tris(phenylthio)arsine. Thioarsenites are unstable in suboxic low-pH solutions and rapidly convert into thioarsenates16 which were ruled out by TT (Table S4). Consequently, trithioarsenite was excluded from LCF analyses. Linear combination fitting was performed over k = 0.5-12.5 Å-1 (kw = 2) in Athe-na9 without any fit constraint. The edge energy, E0, was set to 11875 eV for all sample and reference spectra. Our fit procedure involved fitting all combinations of the eight remaining As references using at most four of them as standards (154 comb.). In order to ensure that the k2 weighting of all experi-mental spectra and fit references did not bias the fit results by emphasizing low-Z neighbors of As, all spectra were additionally fit with a k weight of three. We generally found a good agreement between both fit results for each sample. These tests also showed that As(V) organoarsenicals may partly sub-stitute for each other depending on the fit k weight, hence we summarized the fit fractions of arsenobe-taine, monomethylarsonate, and dimethylarsinic acid as ‘organic As(V)’. Differences in the fit frac-tions for individual reference compounds used in k2- and k3-weighted fits ranged from <1 (tris(phenylthio)arsine) to 44 atom% (arsenobetaine) with averages for all samples of 1-16 atom% (‘global average’ = 7 atom%). We thus consider the uncertainty of the fit fractions to be ±10 atom% at best.
Since MMA(III) was fit with substantial fractions (Table 1), suggesting the presence of methylated As(III) compounds in the peat, we additionally tested whether this fit reference could be replaced by either arsenite-adsorbed ferrihydrite (if not included in a final fit) or dissolved arsenite17 as a reference for physisorbed arsenite. Therefore, we replaced MMA(III) in the best fits by either of these two As(III) references. For all but one sample with a low MMA(III) fraction of <10 atom% (sample D5) the figures of merit of the resulting fits deteriorated significantly (median: 24%). Figure S7 shows the final LCFs of all peat spectra and Table 1 reports the corresponding fit results.
Figure Sblack and
8. Ar
In order As in peAs(III) ((Figure 2using Arsults forapproximretical pinitio FEincludedthe numb
number
2(As-O
value wathen detetude reduports the1.4±0.5
S7. Arsenic Kd red lines, res
rsenic EX
to validate at samples fr
(Table 1) and2c). Shell fitrtemis.9 Sincr the k3-weigmately 2-11 Åhase-shift an
EFF 8.4 codd two single ber of fit par
of independe
O), which con
as also used ermined fromuction factore correspondO atoms a
-edge EXAFSspectively. Th
XAFS shel
the LCF resfrom sites C ad hence S atos of k2- and kce the k weigghted spectraÅ-1 (Table Snd amplitude
de18 using arsscattering parameters was
ent data poin
nverged tow
for the C sam a multisper, S0
2, was seding EXAFS
and 2.2±0.7
S LCFs of allhe correspondi
ll-fit analy
sults, we exeand D. Theseoms did not sk3-weighted ght had no ina are presen5) using a He functions osenobetaineaths: As-O as reduced in
nts. The Deb
ards 0.003(2
amples. For ectrum fit andet to 1.0. FigS parametersC atoms w
Supp
l peat samplesing fit results
yses
emplarily anae samples didsignificantly EXAFS specnfluence on
nted. The EXHanning windof the scattehydrate19 an
and As-C. Oworder to kee
bye-Waller pa
2) Å2 in a m
each sampled later fixed
gure S8 shows. All fits d
were fit at 1
porting Infor
s. Experimentare reported in
alyzed the lod not containcontribute toctra were conthe final EX
XAFS spectrdow functionring paths u
nd DMA(V)2
wing to the ep the numbe
arameter, 2
multispectrum
e series, the d in individuaws the fits indelivered sim1.69±0.01 Å
rmation to M
tal data and mn Table 1.
ocal coordinn appreciableo their Fourienducted in r-
XAFS parama were Fourn with a sill wused were ca20 as input slimited Fourer of fit varia
, of the As-C
m fit of samp
energy-shift al sample fitsr- and q-spa
milar parameÅ and 1.89±
Mikutta & R
model fits are
nation enviroe amounts ofer-transform-space over 0
t parameter, s. The passivace, and Tabeter estimate±0.02 Å, res
Rothwell
S12
shown as
nment of f S-bound
ms at ~2 Å 0.9-1.8 Å the fit re-med over
Å-1. Theo-h the ab-he model m ranges, r than the
defined as
e D. This
E0, was ve ampli-ble S5 re-es: About pectively
Supporting Information to Mikutta & Rothwell
S13
( x ± n). The interatomic As-C distances agree well with the average As-C distance in arsenobe-
taine hydrate (1.86(1)-1.92(1) Å, x = 1.90 Å) and DMA(V) (1.895(2) Å) as determined by X-ray dif-fraction.19,20 The As-O distances are consistent with the average As-O bond distance in DMA(V) (1.662(2) and 1.720(2) Å, x = 1.691 Å)20 and arsenate-adsorbed ferrihydrite (1.69 Å),21 which was fit with up to 30% (Table 1). Note also that the LCF results indicated the presence of up to 31% of simple methylated As(III) compounds in the C and D samples (Table 1). Despite that the average As-O bond distances of these compounds are ~0.1 Å longer compared to those of As(V) compounds, the fit As-O distances of about 1.70 Å correspond reasonably well with the low-to-moderate fit fractions of MMA(III) in the analyzed samples. The high coordination numbers of C atoms determined by shell-fit analyses generally support the presence of more complex alkylated As(V) compounds such as arseno-betaine or arsenosugars in the peat. Overall, our shell-fit results are consistent with the LCF results implying the presence of substantial amounts of organic As in the peat samples (Table 1).
Figure S
(left) Maand (righblack anddifferent
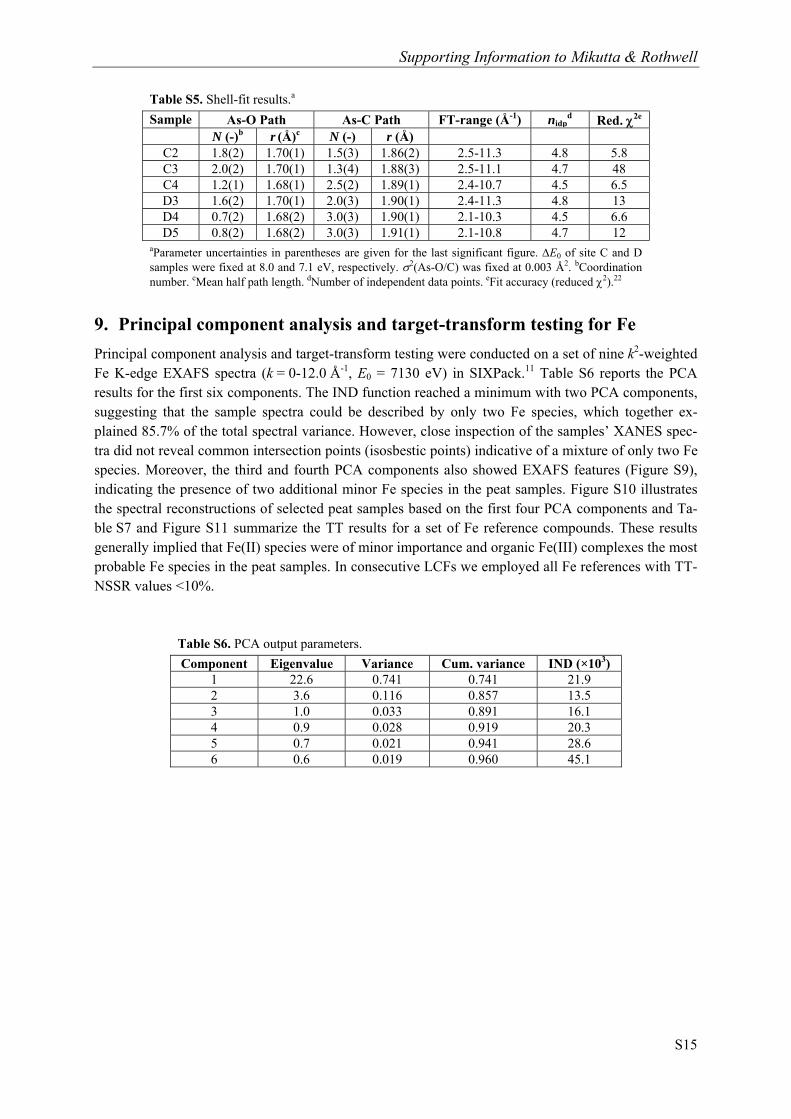
8. Shell fits of
agnitude and rht) real part od model fits ascale of the y
f k3-weighted
real part of Foof the back-Foas red lines. T-axis in the le
aParameter uncertainties in parentheses are given for the last significant figure. E0 of site C and D samples were fixed at 8.0 and 7.1 eV, respectively. 2(As-O/C) was fixed at 0.003 Å2. bCoordination number. cMean half path length. dNumber of independent data points. eFit accuracy (reduced 2).22
9. Principal component analysis and target-transform testing for Fe
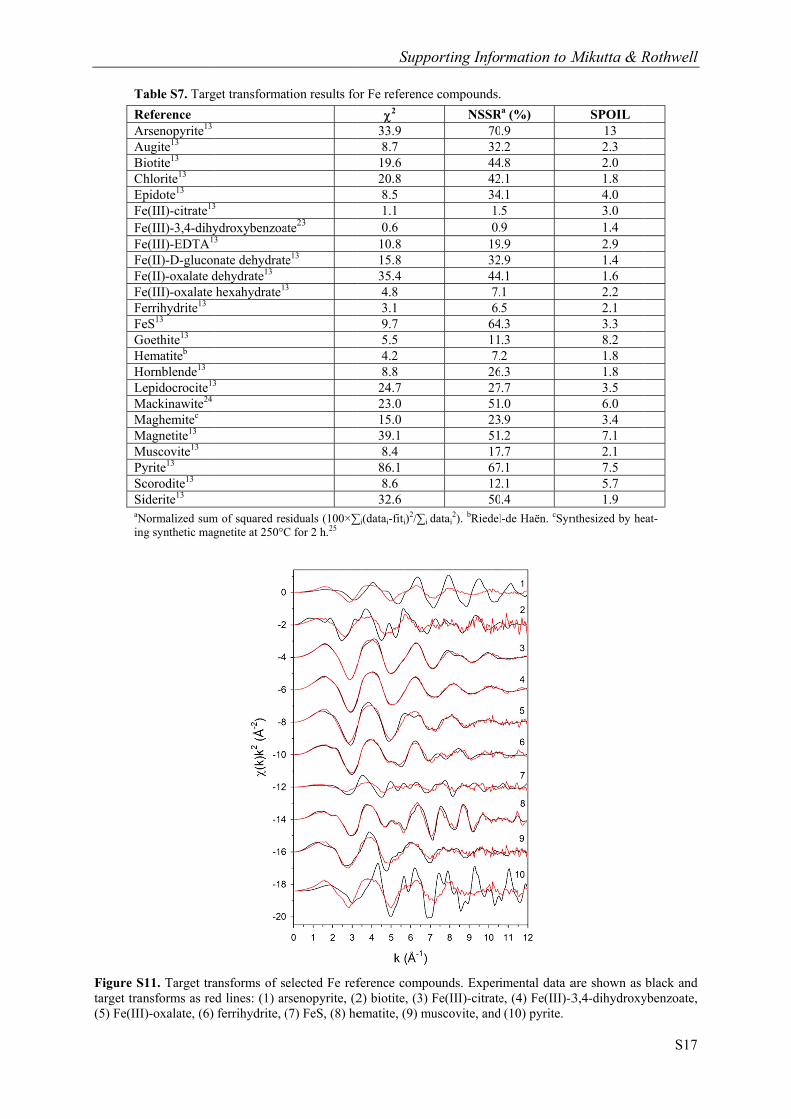
Principal component analysis and target-transform testing were conducted on a set of nine k2-weighted Fe K-edge EXAFS spectra (k = 0-12.0 Å-1, E0 = 7130 eV) in SIXPack.11 Table S6 reports the PCA results for the first six components. The IND function reached a minimum with two PCA components, suggesting that the sample spectra could be described by only two Fe species, which together ex-plained 85.7% of the total spectral variance. However, close inspection of the samples’ XANES spec-tra did not reveal common intersection points (isosbestic points) indicative of a mixture of only two Fe species. Moreover, the third and fourth PCA components also showed EXAFS features (Figure S9), indicating the presence of two additional minor Fe species in the peat samples. Figure S10 illustrates the spectral reconstructions of selected peat samples based on the first four PCA components and Ta-ble S7 and Figure S11 summarize the TT results for a set of Fe reference compounds. These results generally implied that Fe(II) species were of minor importance and organic Fe(III) complexes the most probable Fe species in the peat samples. In consecutive LCFs we employed all Fe references with TT-NSSR values <10%.
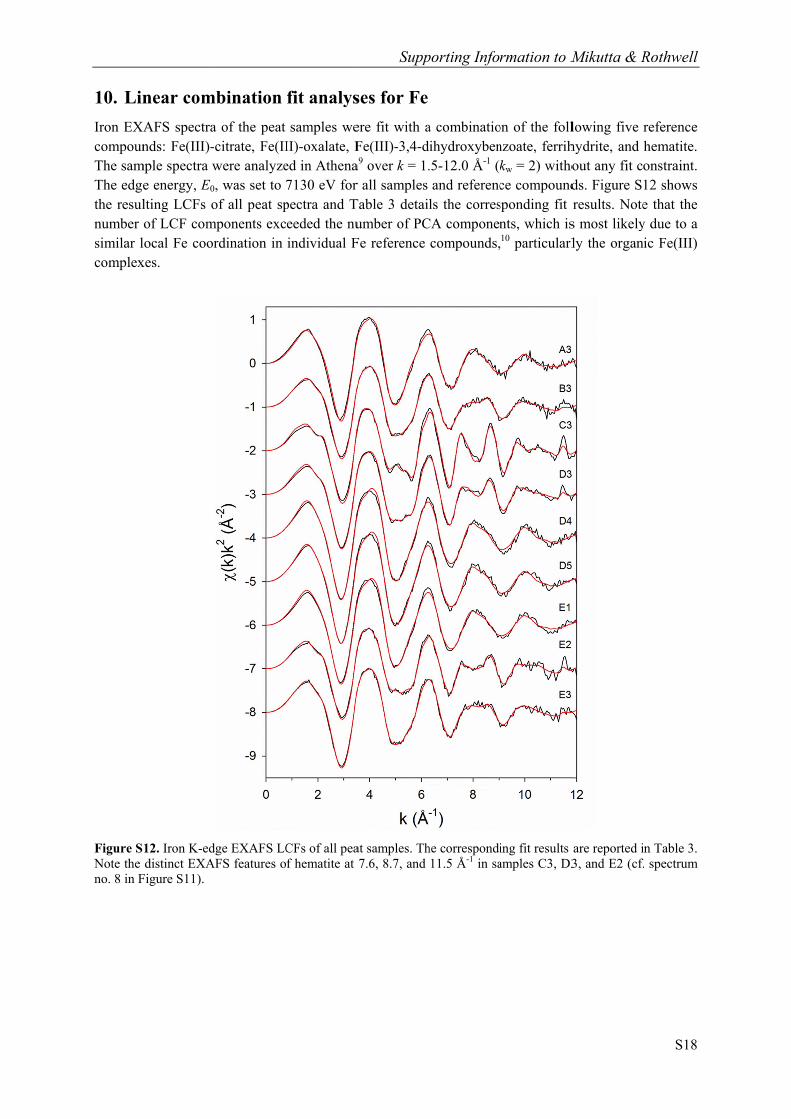
Iron EXcompounThe samThe edgethe resulnumber similar lcomplex Figure SNote the no. 8 in F
near com
AFS spectrands: Fe(III)-
mple spectra we energy, E0
lting LCFs oof LCF com
local Fe coorxes.
12. Iron K-eddistinct EXA
Figure S11).
mbination
a of the peat citrate, Fe(IIwere analyze, was set to
of all peat spmponents exc
rdination in
dge EXAFS LCAFS features o
fit analys
samples weII)-oxalate, Fed in Athena7130 eV for pectra and Teeded the nuindividual F
CFs of all peaf hematite at
Supp
ses for Fe
ere fit with aFe(III)-3,4-da9 over k = 1.r all samples Table 3 detaiumber of PCFe reference
at samples. Th7.6, 8.7, and
porting Infor
a combinatioihydroxyben.5-12.0 Å-1 (kand referencls the corres
CA componencompounds,
he correspondi11.5 Å-1 in sa
rmation to M
on of the follnzoate, ferrihkw = 2) withoce compoundsponding fit nts, which is10 particularl
ing fit results amples C3, D3
Mikutta & R
lowing five hydrite, and out any fit cds. Figure Sresults. Notes most likelyly the organ
are reported i3, and E2 (cf.
Rothwell
S18
reference hematite. onstraint. 12 shows e that the y due to a ic Fe(III)
in Table 3. . spectrum
Supporting Information to Mikutta & Rothwell
S19
11. Aqueous-phase measurements
Total As (Astot) and Fe concentrations in pore- and streamwaters were determined by ICP-MS (Agilent 7500cx) and ICP-AES (Perkin-Elmer Optima 5300), respectively, following acidification with double-distilled HNO3 to 2% (v/v) (BDH). Stock solutions of Astot and Fe (CertiPUR, VWR) were used to prepare 1, 5, 10, 50, and 100 µg/L standards. Operational blanks and certified reference materials (NIST SPS-SW1 and LGC 1643) were analyzed with each sample batch. Recoveries were >98% and the detection limit for Astot was 0.07 µg/L. A total organic carbon analyzer (Shimadzu TOC-V CPN) was used to measure concentrations of total carbon (TC) and inorganic carbon (IC) in the water sam-ples. Dissolved organic carbon (DOC) was calculated by subtracting IC from TC. The detection limit for DOC was 1.5 mg/L. Sulfate and NO3 were determined by ion chromatography (Metrohm 882 Compact) with inline ultrafiltration, a Metrosep A Supp 5 anion column, and PR2 guard. The detection limit of the anions was 0.2 mg/L.
Aqueous inorganic and organic As species (arsenite, arsenate, MMA(V), DMA(V), and arsenobetaine) were determined by anion exchange HPLC-ICP-MS. The HPLC system (Agilent 1200 Infinity with 1260 Quaternary pump and 1260 Auto sampler) consisted of a Hamilton PRP-X100 anion exchange column (10 µm, 4.6 mm × 250 mm), eluent A (50 mM (NH4)2CO3, 0.1 g/L EDTA, 0.5 mL of a 100 mg/L Ge solution/L, and 20 mL/L methanol) and eluent B (deionized H2O). The mobile phase was modified as follows: t = 0 min: A = 10% and B = 90%, t = 2.1 min: A = 80% and B = 20%, t = 5 min: A = 10% and B = 90%. The flow rate was 1 mL/min, the column oven temperature 30°C, and the injection volume 50 µL. ICP-MS (Agilent 7500cx) was used to monitor the signal intensity of As at m/z 75. Selenium was monitored at m/z 77 to check for the occurrence of 40Ar37Cl (Cl interference on m/z 75). Peak areas were determined using the time-resolved analysis software built into Masshunter (Workstation Version A.02.01 Build 84). Example chromatograms for aqueous samples are shown in Figure S13. Arsenic standards used for identification of As species and chromatogram quantification were prepared from 1000 mg/L stock solutions of arsenite and arsenate (CPAchem, France). MMA(V) standards were prepared from monosodium acid methane arsonate and DMA(V) standards from dime-thylarsinic acid (Supelco). Arsenobetaine standards were prepared from calibration solution 0353 (1031 mg arsenobetaine/L; European Commission Community Bureau of Reference). Arsenic species solutions of 2, 5, 10, 50, and 100 µg As/L for each of the As species were used for quantification. The As detection limit for the As species analyzed was 0.1 µg/L. When analyzing As species with HPLC-ICP-MS using a PRP-X100 anion exchange column, trimethylarsine oxide (TMAO) may be mistaken-ly identified as arsenite since their retention times are similar. To confirm that arsenite peaks were not biased by the presence of TMAO, five water samples were amended with 10% (v/v) H2O2 (AnalaR, VWR) in order to convert arsenite into arsenate. The results show that the arsenite peaks disappeared after H2O2 addition (Figure S13), indicating that TMAO was not present in our samples.
Figure S
(a) SeparDMA(V)porewateICP-MS and (5) ar
13. Arsenic sp
ration of five A), (4) MMA(Vr sample fromanalysis. (d) Srsenate. Note
peciation in po
As species by V), and (5) ar
m site E measuSeparation of the scale diffe
ore- and stream
HPLC-ICP-Mrsenate. The cured (b) beforef three As specerence of the y
Supp
amwaters.
MS for porewachromatograme and (c) aftercies in streamy-axis in pane
betaine, (2) arnd (c) are forv) H2O2 prior enobetaine, (2
Rothwell
S20
rsenite, (3) r the same to HPLC-
2) arsenite,
Supporting Information to Mikutta & Rothwell
S21
12. Concentration and speciation of extractable solid-phase As
Arsenic species in peat samples were quantified by HPLC-ICP-MS following a HNO3 extraction pro-cedure26 to validate our XAS results. Approximately 0.1 g of milled peat was placed in 50 mL poly-propylene tubes and extracted with 10 mL of double-distilled 0.28 M HNO3. Samples were first agitat-ed with a vortex mixer at 1500 rpm for 5 min, left overnight, and then re-agitated at 1750 rpm for 5 min. Samples were then heated in a microwave oven (MARSXpress, CEM) using a sequential pro-gram (ramp to 60°C over 5 min, hold for 60 min at 60°C, ramp to 95°C over 5 min, hold for 60 min at 95°C). After digestion, samples were allowed to cool before 0.9 mL of the supernatants was passed through 0.45-µm syringe filters into 1.5 mL HPLC vials. Then, 0.1 mL of 30% H2O2 was added to each vial and samples were left for reaction overnight. This step oxidizes inorganic arsenite to arse-nate, thus giving a better peak separation of arsenobetaine and DMA(V), which elute adjacent to arse-nite. Afterwards, 0.1 mL of 2 M NaOH was added to each sample prior to As speciation analysis by HPLC-ICP-MS as described in SI section 11. All samples were extracted and analyzed in duplicate. The results of the peat extractions are summarized in Table S8. Table S8. Concentration and speciation of extractable solid-phase As.a
Sample Depth Inorganic As MMA(V)b DMA(V) Asobc ∑As speciesd Total extractable As
(cm) (mg/kg)
A2 2-3 8.28 (48)
0.06 (0.3)
1.43 (8)
4.43 (26)
14.2 (82)
17.3
A3 4-5 12.3 (46)
0.42 (2)
2.58 (10)
6.05 (23)
21.3 (80)
26.5
A3.5 5-6 8.57 (42)
0.50 (2)
2.48 (12)
4.78 (24)
16.3 (80)
20.3
B2 2-3 4.75 (31)
0.15 (1)
2.73 (18)
5.08 (33)
12.7 (82)
15.4
B3 4-5 16.3 (52)
0.67 (2)
4.05 (13)
4.17 (13)
25.2 (81)
31.1
B4 6-7 4.92 (42)
0.68 (6)
2.10 (18)
2.17 (19)
9.87 (84)
11.7
C2 2-3 4.19 (40)
0.04 (0.4)
1.25 (12)
2.52 (24)
7.99 (77)
10.4
C3 4-5 2.89 (36)
<LOD (0)
1.06 (13)
2.46 (31)
6.43 (81)
7.95
C4 6-7 0.84 (16)
0.10 (2)
1.08 (21)
2.24 (42)
4.27 (81)
5.28
D3 4-5 0.99 (24)
<LOD (0)
0.71 (17)
1.74 (42)
3.43 (84)
4.09
D4 6-7 0.37 (12)
<LOD (0)
0.59 (19)
1.47 (47)
2.43 (78)
3.10
D5 8-9 0.36 (14)
<LOD (0)
0.47 (18)
1.21 (46)
2.05 (77)
2.66
E1.5 1-2 3.04 (29)
0.07 (1)
1.73 (17)
4.19 (40)
9.04 (87)
10.4
E2 2-3 6.79 (33)
0.12 (1)
2.24 (11)
7.08 (35)
16.2 (79)
20.5
E3 4-5 10.4 (49)
0.14 (1)
1.46 (7)
4.15 (19)
16.2 (75)
21.4
aValues in parenthesis are the percentage contribution of respective As fractions to total extractable As. The average rela-tive percentage difference ± relative standard deviation was 13.9 ± 9.8. bMay originate from MMA(III) oxidation during sample treatment. cArsenobetaine. dSum of mean inorganic As, MMA(V), DMA(V), and arsenobetaine fractions.
Supporting Information to Mikutta & Rothwell
S22
13. Sulfur speciation analyses and results
Normalized S K-edge XANES spectra were deconvoluted in WinXAS 3.227 following the fitting ap-proach recommended by Manceau and Nagy.28 Deconvolution of the spectra was performed in the energy range 2466-2488 eV using two arctan functions, the edge steps of reduced and oxidized S spe-cies, and seven Gaussian functions representing S s → p transition peaks of inorganic sulfide, exocy-clic/elemental, heterocyclic, sulfoxide, sulfone, sulfonate, and sulfate S. The positions, step heights and full widths at half maximum (fwhm) of the arctan functions were fit. Their fwhm were constrained to be equal. Likewise, the fwhm of inorganic sulfide, exocyclic/elemental, heterocyclic, and sulfoxide S were constrained to be equal as were those of sulfone, sulfonate, and sulfate S. The center positions and amplitudes of all Gaussians were fit, and the peak areas obtained were corrected for the oxidation-state dependent absorption cross-section of S using the generic equation of Manceau and Nagy.28 The atomic fraction of each S species in the peat samples was then calculated by dividing its corrected peak area by the total peak area sum. Tables S9 and S10 summarize the fit results.
Supporting Information to Mikutta & Rothwell
S23
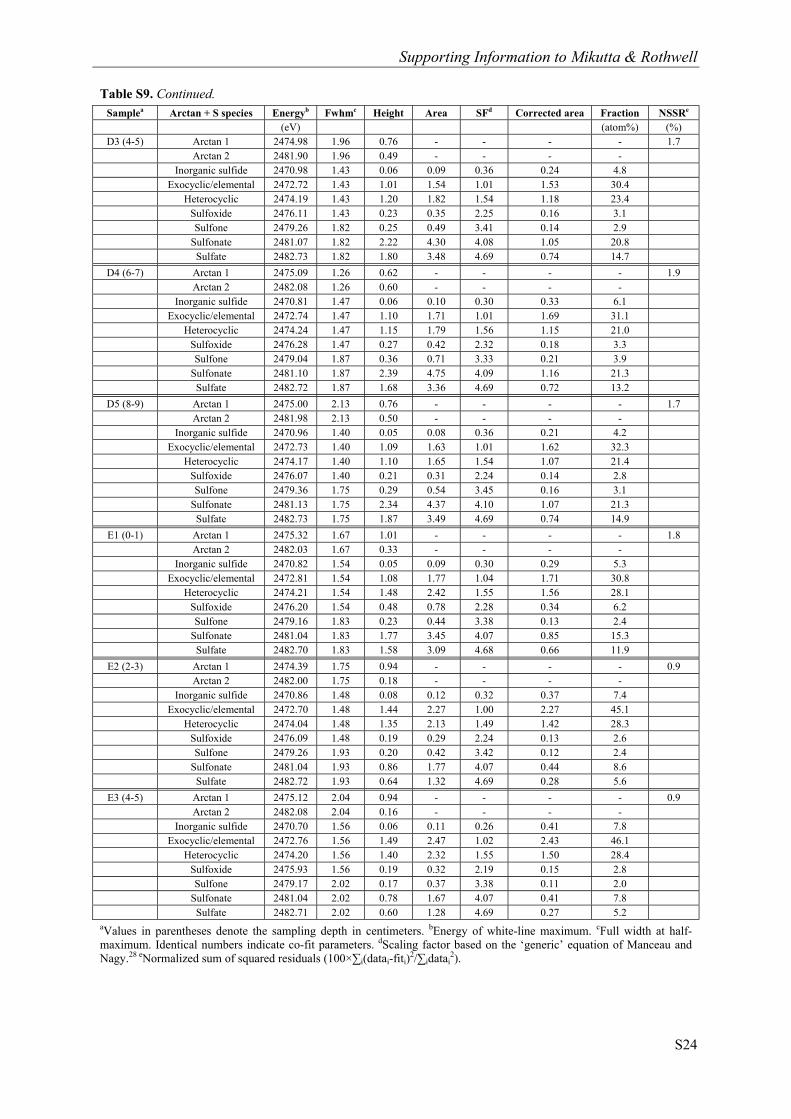
Table S9. Gaussian deconvolution of normalized S K-edge XANES spectra of peat samples and atomic frac-tions of S functionalities after correction for the oxidation state-dependent absorption cross-section of S.
Samplea Arctan + S species Energyb Fwhmc Height Area SFd Corrected area Fraction NSSRe (eV) (atom%) (%)
aValues in parentheses denote the sampling depth in centimeters. bEnergy of white-line maximum. cFull width at half-maximum. Identical numbers indicate co-fit parameters. dScaling factor based on the ‘generic’ equation of Manceau and Nagy.28 eNormalized sum of squared residuals (100×∑i(datai-fiti)
2/∑idatai2).
Supporting Information to Mikutta & Rothwell
S24
Table S9. Continued. Samplea Arctan + S species Energyb Fwhmc Height Area SFd Corrected area Fraction NSSRe
aValues in parentheses denote the sampling depth in centimeters. bEnergy of white-line maximum. cFull width at half-maximum. Identical numbers indicate co-fit parameters. dScaling factor based on the ‘generic’ equation of Manceau and Nagy.28 eNormalized sum of squared residuals (100×∑i(datai-fiti)
2/∑idatai2).
Supporting Information to Mikutta & Rothwell
S25
Table S10. Summary of the solid-phase speciation of S.
Average: 3.92 6 35 27 4 3 15 10 68 6 25 aAsterisks indicate overestimated values based on Fe XAS results and total S concentrations. bSum of inorganic sulfide, exocyclic/elemental, and heterocyclic S. cSum of sulfoxide and sulfone S. This S fraction is likely overestimated due to post-edge absorption features of reduced S species. dSum of sulfonate and sulfate S.
Supporting Information to Mikutta & Rothwell
S26
14. References 1. Holden, J.; Burt, T. P., Hydrological studies on blanket peat: The significance of the acrotelm-
catotelm model. J. Ecol. 2003, 91, 86-102. 2. Beven, K. J.; Kirkby, M. J., A physically based, variable contributing area model of basin
hydrology. Hydrol. Sci. Bull. 1979, 24, 43-69. 3. Lindsay, J. B., The Terrain Analysis System: A tool for hydro-geomorphic applications. Hydrol.
Process. 2005, 19, 1123-1130. 4. Nelson, P. F.; Shah, P.; Strezov, V.; Halliburton, B.; Carras, J. N., Environmental impacts of coal
combustion: A risk approach to assessment of emissions. Fuel 2010, 89, 810-816. 5. Catalano, J. G.; Huhmann, B. L.; Luo, Y.; Mitnick, E. H.; Slavney, A.; Giammar, D. E., Metal
release and speciation changes during wet aging of coal fly ashes. Environ. Sci. Technol. 2012, 46, 11804-11812.
6. Luo, Y.; Giammar, D. E.; Huhmann, B. L.; Catalano, J. G., Speciation of selenium, arsenic, and zinc in class C fly ash. Energy Fuels 2011, 25, 2980-2987.
7. Galbreath, K. C.; Zygarlicke, C. J., Formation and chemical speciation of arsenic-, chromium-, and nickel-bearing coal combustion PM2.5. Fuel Process. Technol. 2004, 85, 701-726.
8. Goodarzi, F.; Huggins, F. E., Monitoring the species of arsenic, chromium and nickel in milled coal, bottom ash and fly ash from a pulverized coal-fired power plant in western Canada. J. Environ. Monit. 2001, 3, 1-6.
9. Ravel, B.; Newville, M., ATHENA, ARTEMIS, HEPHAESTUS: Data analysis for X-ray absorption spectroscopy using IFEFFIT. J. Synchrotron Rad. 2005, 12, 537-541.
10. Manceau, A.; Marcus, M. A.; Tamura, N., Quantitative speciation of heavy metals in soils and sediments by synchrotron X-ray techniques. In Applications of Synchrotron Radiation in Low-Temperature Geochemistry and Environmental Science, Fenter, P. A.; Rivers M. L.; Sturchio, N. C.; Sutton, S. R., Eds. Mineralogical Society of America and Geochemical Society: Washington DC, 2002; pp 341-428.
11. Webb, S. M., SIXPack: A graphical user interface for XAS analysis using IFEFFIT. Phys. Scr. 2005, T115, 1011-1014.
12. Malinowski, E. R., Theory of error for target factor analysis with applications to mass spectrometry and nuclear magnetic resonance spectrometry. Anal. Chim. Acta 1978, 103, 339-354.
13. Langner, P.; Mikutta, C.; Kretzschmar, R., Arsenic sequestration by organic sulphur in peat. Nature Geosci. 2012, 5, 66-73.
14. Farquhar, M. L.; Charnock, J. M.; Livens, F. R.; Vaughan, D. J., Mechanisms of arsenic uptake from aqueous solution by interaction with goethite, lepidocrocite, mackinawite, and pyrite: An X-ray absorption spectroscopy study. Environ. Sci. Technol. 2002, 36, 1757-1762.
15. Suess, E.; Scheinost, A. C.; Bostick, B. C.; Merkel, B. J.; Wallschlaeger, D.; Planer-Friedrich, B., Discrimination of thioarsenites and thioarsenates by X-ray absorption spectroscopy. Anal. Chem. 2009, 81, 8318-8326.
16. Planer-Friedrich, B.; Suess, E.; Scheinost, A. C.; Wallschläger, D., Arsenic speciation in sulfidic waters: Reconciling contradictory spectroscopic and chromatographic evidence. Anal. Chem. 2010, 82, 10228-10235.
17. Ramírez-Solís, A.; Mukopadhyay, R.; Rosen, B. P.; Stemmler, T. L., Experimental and theoretical characterization of arsenite in water: Insights into the coordination environment of As-O. Inorg. Chem. 2004, 43, 2954-2959.
18. Ankudinov, A. L.; Ravel, B.; Rehr, J. J.; Conradson, S. D., Real-space multiple-scattering calculation and interpretation of x-ray-absorption near-edge structure. Phys. Rev. B 1998, 58, 7565-7576.
19. Cannon, J. R.; Edmonds, J. S.; Francesconi, K. A.; Raston, C. L.; Saunders, J. B.; Skelton, B. W.; White, A. H., Isolation, crystal structure and synthesis of arsenobetaine, a constituent of the western rock lobster, the dusky shark, and some samples of human urine. Aust. J. Chem. 1981, 34, 787-798.
20. Betz, R.; McCleland, C.; Marchand, H., The monoclinic polymorph of dimethylarsinic acid. Acta Cryst. 2011, E67, m1013.
Supporting Information to Mikutta & Rothwell
S27
21. Voegelin, A.; Weber, F.-A.; Kretzschmar, R., Distribution and speciation of arsenic around roots in a contaminated riparian floodplain soil: Micro-XRF element mapping and EXAFS spectroscopy. Geochim. Cosmochim. Acta 2007, 71, 5804-5820.
22. Kelly, S. D.; Hesterberg, D.; Ravel, B., Analysis of soils and minerals using X-ray absorption spectroscopy. In Methods of Soil Analysis. Part 5: Mineralogical Methods, Ulery, A. L.; Drees, L. R., Eds. Soil Science Society of America: Madison, Wisconsin, USA, 2008; pp 387-463.
23. Mikutta, C., X-ray absorption spectroscopy study on the effect of hydroxybenzoic acids on the formation and structure of ferrihydrite. Geochim. Cosmochim. Acta 2011, 75, 5122-5139.
24. Johnston, S. G.; Burton, E. D.; Keene, A. F.; Planer-Friedrich, B.; Voegelin, A.; Blackford, M. G.; Lumpkin, G. R., Arsenic mobilization and iron transformations during sulfidization of As(V)-bearing jarosite. Chem. Geol. 2012, 334, 9-24.
25. Schwertmann, U.; Cornell, R. M., Iron Oxides in the Laboratory. Preparation and Characterization. 2 ed.; Wiley-VCH: 2000.
26. Zhu, Y.-G.; Sun, G.-X.; Lei, M.; Teng, M.; Liu, Y.-X.; Chen, N.-C.; Wang, L.-H.; Carey, A. M.; Deacon, C.; Raab, A., et al., High percentage inorganic arsenic content of mining impacted and nonimpacted chinese rice. Environ. Sci. Technol. 2008, 42, 5008-5013.
27. Ressler, T., WinXAS: A program for X-ray absorption spectroscopy data analysis under MS-Windows. J. Synchrotron Rad. 1998, 5, 118-122.
28. Manceau, A.; Nagy, K. L., Quantitative analysis of sulfur functional groups in natural organic matter by XANES spectroscopy. Geochim. Cosmochim. Acta 2012, 99, 206-223.