Full paper Strategies for high quality injection moulding of polymer nanopillars Rasmus H. Pedersen*, Qian Xu, John M. Stormonth-Darling, Nikolaj Gadegaard* ––––––––– Dr. R. H. Pedersen, Q. Xu, Dr. J. M. Stormonth-Darling, Prof. N. Gadegaard Division of Biomedical Engineering, School of Engineering, University of Glasgow, Glasgow G12 8LT, United Kingdom E-mail: [email protected], [email protected] –––––––––
Injection moulding is a proven technology for high-throughput production of nanostructures,
but high quality replication of pillar-type structures is a considerable challenge, due to the
complexities of cavity filling at the timescales involved. We have developed a platform to
systematically study the effects of nanostructures with aspect ratios up to 1.2:1 on the quality
of moulding, and also considered options for polymer and tooling material. A master template
containing nanostructures with a continuous variation in height is produced by a novel
fabrication approach using a plasma polymerized hexane layer, deposited with a gradient in
thickness, as a sacrificial etch mask. Injection moulding results show that process parameters
(tooling temperature and cooling time), material (polystyrene and polycarbonate) as well as a
tool surface coating can control the stretching of nanopillar replica dimensions, allowing a
variety of final pattern heights using a single master.
- 2 -
1. Introduction
Injection moulding has been used for decades in the industrial manufacture of plastic parts on
the mm-scale and above but has in more recent years shown to facilitate the replication of
surface topographies on the nm-scale, for both academic[1–5] and industrial applications (Blu-
ray Discs). Injection moulding provides a level of throughput significantly higher than that of
nanoimprint lithography and related techniques used for replicating topographies in polymeric
materials, and is capable of providing hundreds to thousands of parts in a single day in a
research environment. Thus, injection moulding has been proven a relevant technology for a
wide range of applications that have otherwise employed methods such as soft lithography or
nanoimprint/hot embossing.
A rapidly growing application area is that of cell and tissue engineering taking advantage of
the added functionality topographical surfaces may offer [6,7]. Using injection moulding it is
possible to manufacture large quantities of samples relevant to the experiment and with
suitable physical properties such as transparency (for microscopy) or mechanical strength
(orthopaedic applications). However, it is important to fully characterize and understand the
replication process in order to ensure production of final parts with the intended geometry.
The injection moulding process is inherently intended to produce final parts, i.e. no further
processing is required, with very high fidelity towards the original. When replicating parts
where the nanofeatures are produced as indentations in the sample surface, this is easily
achieved, at least for modest height-to-width aspect ratios[3], although molding of dense
structures can be challenging. However, when trying to injection mould nanosized raised
features, filling of, and removal from, the inlay cavities is a complex process, depending
critically on the temperature of the polymer melt during the process. This is determined not
only by the process parameters, but also by the thermal conductivity of the insert itself.
- 3 -
Commonly used nickel inlays provides efficient heat transfer from the polymer to the tooling,
which may cool the polymer melt below the glass transition temperature before the nanosized
cavities are completely filled. As a result, it has been difficult to successfully replicate “pillar”
type structures using nickel inlays. Conversely, polyimide, for example, has a much lower
thermal conductivity, and the nanosized cavities can easily be filled. Cooling is in fact so
slow, that the polymer is still malleable as it is being removed from the cavity, leading to the
stretching of the resulting pillars[5]. Similar effects have also been described in nanoimprint
experiments[8]. Thus, a further enhancement of the range of pillar heights present on the
sample can be obtained. This provides a further layer of control in the replication process, in
essence adding “tunability”, and meaning a single master, produced at high cost, can be
employed to produce cheap replicas with a variety of dimensions. In order to do this,
however, a further understanding of the stretching process must be obtained in order to
efficiently predict the final replica geometry. In this work, we seek to study this stretching
effect in greater detail, aiming to obtain an understanding of the effects of the process
variables, in order to fully control the high-throughput replication of polymer nanostructures.
Specifically, we wish to study the complex interplay between polymer temperature,
polymer/tool interaction energy, and pattern dimension/aspect ratio.
In the present application, we wish to systematically study the parameter space in an efficient
manner. Of specific interest is a method of producing a structure with variations in heights of
features across the surface, as this allows study of a large variety of aspect ratios from a single
sample. Such a structure can be described as 2.5-dimensional (2.5D), the term used for the
capability of standard micromachining or milling equipment. A number of approaches have
been used to extend standard 2D nanofabrication to 2.5D from a top-down fabrication
perspective. The simplest is to perform multiple lithography and/or etch steps in order to
manufacture a multilevel structure[9–11]. This approach has the advantage of not introducing
- 4 -
any new process elements, but it is cumbersome and limited in applicability as smooth
variations cannot be produced. Thermal reflow of polymer structures[12–14] does provide
smooth structures, but the type of structure obtainable is limited due to the nature of the
process. Alternatively, greyscale lithography (i.e. varying the thickness of the developed resist
structures by careful control of the exposure dose) is a versatile method, capable of producing
both smooth[15] and stepped[16,17] height variations. However, the process often requires the
use of customized process parameters such as the choice of resist and can lead to excessive
pattern definition times in the case of serial exposure techniques. The process presented in this
work provides the possibility of fabricating smooth surface height variations, without the need
for substantial modification of any pre-existing 2D pattern definition scheme. The height
variation is supplied by an additional polymer layer deposited after the lithographic
processing is complete. As such, it provides a simple way to introduce 2.5D capability into an
existing process flow.
The particular nanostructure used in this work is a regular array of nanoscale dots. This choice
is motivated by two factors: Firstly, this type of structure is known to be relevant for cell
adhesion and differentiation experiments[18]. Secondly, using single-pixel exposure during
electron beam lithography, the required exposure time is drastically reduced, and a large area
can be nanopatterned in a relatively short time.
- 5 -
2. Experimental Section
2.1. Master Fabrication and Replication
Figure 1. Fabrication flow of topographical gradient structures (not to scale). a) An array of aluminium nanodots is defined on the substrate using electron beam lithography and lift-off. b) plasma polymerized hexane (ppHex) is deposited through a mask opening resulting in a thickness gradient. c) After plasma etching using the ppHex as a sacrificial layer, the gradient is transferred to the substrate. Pattern dimensions remain defined by the unetched aluminium. d) The aluminium layer is removed by wet etching, finalizing the master. The master is replicated by injection moulding as described in the main text. Figure 1 displays an overview of the fabrication process of masters of nanopillar arrays. A
clean quartz substrate is coated with a 110 nm layer of PMMA (Elvacite 2041, Lucite
International), and a 20 nm layer of aluminium is evaporated on the sample for charge
compensation during exposure. A regular dot array (300 nm pitch, 9x9 mm2 area) is defined
by single-pixel exposure using a Vistec VB6 UHR EWF system. The total exposure time is
approximately 1.5 hours. After development in 1:3 MIBK:IPA, 40 nm of aluminium is
evaporated on the surface and the structure is lifted off in hot (50oC) microposit remover 1165
(Shipley). The aluminium layer acts as a hard mask, ensuring the desired pattern is transferred
faithfully in a subsequent etch step.
To define a continuous variation (gradient) in the eventual pattern height, the sample is coated
with a thin layer of plasma polymerized hexane (ppHex). The deposition takes place in a
custom-built borosilicate glass chamber at a pressure of approximately 0.4 mbar and RF
power of 50 W. Further details of the ppHex deposition process have been published
previously[19]. A poly olefin plastomer (POP) mask with a 5 mm deep opening is
- 6 -
manufactured by moulding from a machined aluminium master. It is placed in contact with
the substrate during the deposition, as shown in Figure 2 (insert). This mask restricts the flow
of molecular species near the sample surface, causing a decaying deposition rate across the
sample surface. As the decrease in rate begins some distance in front of the mask opening the
mask opening is placed 2 mm away from the beginning of the patterned area. The deposition
rate is monitored by a quartz crystal microbalance during the process and deposition is
terminated at a thickness of approximately 45 nm at the edge of the patterned area. After
deposition, the sample is blow-dried with clean nitrogen to remove any particulates formed
during the plasma deposition.
The nanopattern defined in aluminium, and the superimposed gradient defined in ppHex, are
transferred to the substrate using a CHF3/Ar RIE process (Oxford Instruments 80+ RIE). The
etch is timed to stop shortly after all the plasma polymer material has been etched. After
etching, the aluminium is removed by wet etching, and the sample is thoroughly cleaned.
Finally, the sample is coated with a monolayer of (tridecafluoro-1,1,2,2-
tetrahydrooctyl)trichlorosilane (F13-TCS, 97%, Sigma-Aldrich), by immersion in a solution
of the silane in heptane for about 15 minutes followed by a rinse in heptane.
In industrial scale injection moulding, a complete one-piece tool is typically employed for
each pattern/design. This is however not cost effective in a research setting, where the pattern
will change frequently. Therefore, we employ a three-piece tool-frame-inlay structure, where
the general shape of the moulded piece is defined by the tool and frame, while the specific
pattern is determined by a small inlay[4]. Due to its brittle nature, silicon or quartz is generally
not suited for direct use as an inlay. Instead, a replication technique is used to produce the
final inlay. The most common technique is electroplating of nickel, but this is not suitable for
moulding of nanopillars, as described above. Instead, we employ UV-nanoimprint lithography
to form an all-polymer inlay. The quartz master containing the nanopillar gradient is gently
- 7 -
pressed into contact with a 770 µm thick polyimide substrate (Cirlex®, Katco Ltd.) coated
with a 50 µm layer of SU-8 3050 (microChem) at a temperature of 96oC. The SU-8 is then
exposed by a 365 nm UV LED for 4 minutes, after which the stack is cooled and separated.
The polyimide piece with patterned SU-8 layer can be used directly as an inlay for injection
moulding, or the inlays can be coated with a non-adhesive coating, as discussed below. For
this process, a layer of 15 nm silicon nitride is deposited on the inlay by chemical vapour
deposition and coated with a self-assembled monolayer of F13-TCS by vapour deposition in a
petri dish heated to 150 oC. Polymer replication is performed in a commercial injection
moulding machine (Victory 28, Engel GmbH). The polymer melt temperate was 280 oC for
polycarbonate, and 260oC for polystyrene, while the tool temperature and cooling time was
varied as specified below.
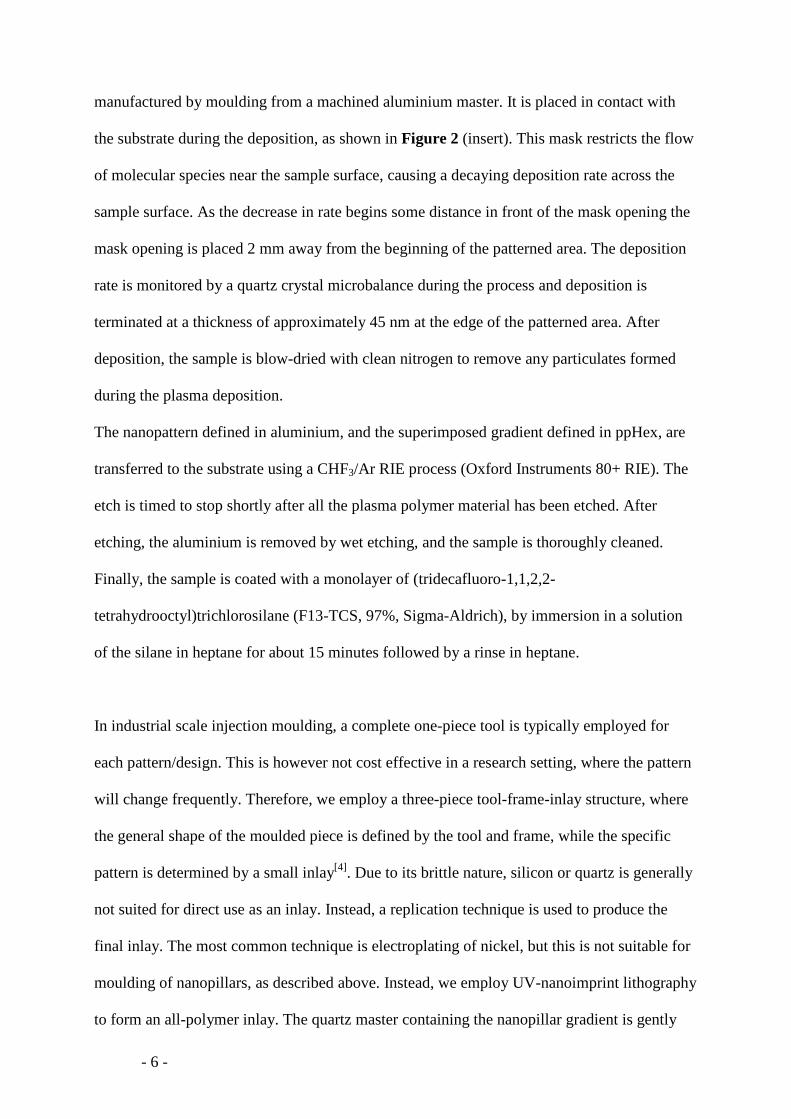
Figure 2. Profiles of plasma polymerized hexane gradients deposited using masks of various sizes of opening. Thickness was normalised to a value of 1 at the mask opening to enable direct comparison of profiles. Insert displays a schematic of the deposition conditions with the location of the nanopatterned area shown.
2.2 Surface Energy Measurements
To measure the surface energy of the relevant materials, we apply the commonly used
Fowkes theory[20]. The contact angle on the surface is measured using two liquids with
- 8 -
different polar characteristics, in this case water and diiodomethane. The surface tension
parameters of the surface can then be derived from applying the following geometric mean
relation of the polar and dispersive components of the surface energy:
( ) ( )ds
dl
ps
pll γγ+γγ=θ+γ 2cos1
in which θ is the contact angle, γ is surface energy, and l and s refer to liquid and solid, p and
d to polar and dispersive components, respectively.
After determining the surface energy of the various materials involved in the present context,
a work of adhesion W12 between two particular surfaces can be calculated using a harmonic
mean (it has been suggested that a harmonic mean is more appropriate than the
mathematically simpler geometric mean for polymer-polymer interactions[21]):
pp
pp
dd
dd
γ+γγγ
+γ+γγγ
=W21
21
21
2112 4
While this method is in principle fairly straightforward, it relies on accurate knowledge of the
polar and dispersive components of the surface tension of the liquids used. However, there are
several different numbers available in literature. Additionally, contact angle measurements
can be very sensitive to the specific conditions under which the measurement was acquired.
Therefore, great care must be taken if one desires to directly apply or compare surface energy
values obtained by different laboratories. Application of results is best restricted to analysis of
the experiments directly in question. In this work, we use values of the liquid surface tension
parameters taken from[20], as γp = 46.4 mNm-1, γd = 26.4 mNm-1 for water, and γp
= 0 mNm-1,
γd = 50.8 mNm-1 for diiodomethane. Contact angle measurements were obtained using a
commercial goniometer (attension Theta) with a drop size of 1 µl. Averages contact angle
values of at least 10 different drops each analysed at more than 100 individual frames were
used.
- 9 -
3. Results and Discussion
3.1 Gradient Formation
The desired result is to have a gradient on depth only in one direction, the ppHex deposition
direction. The thickness should be constant in the transverse direction. This is ensured by
controlling the lateral size of the opening in the mask during deposition. If the mask opening
is similar in size to the dot array structure, the mask sidewalls influence the deposition rate,
and a significant variation in the thickness of the film in the direction perpendicular to the
opening is observed, which is undesirable. However, modifying the mask to have an opening
much larger (in this case, 16 mm wide opening, 9 mm wide dot array), produces a uniform
gradient across the nanostructured surface.
The decay of the deposition rate depends on the size of the mask opening. Figure 2 shows
thickness profiles for mask openings from 5 mm to 0.05 mm. For the purpose of this
investigation, mask openings of 0.26 and 0.05 mm were obtained not from POP but instead by
using spacers cut from plastic sheets with a glass slide as lid. This difference in nature may
serve to explain the slightly different behaviour in advance of the mask opening. A general
trend is observed, whereby a decrease in the mask opening directly correlates with a steeper
slope of the deposition gradient. For this work, we are interested in gradients over long
distances, leading to the use of 5 mm openings for our samples. However, this demonstrates
that accurate control over the gradient parameters is obtainable with this process.
The produced gradients in ppHex are transferred to the substrate using dry plasma etching.
Due to selectivity of the etch, the scale of the gradient is enhanced compared to the range of
ppHex thicknesses produced. The selectivity has been measured as approximately 4.4:1 for
- 10 -
the CHF3/Ar-based RIE of quartz. After finalizing the samples, they were characterized by
SEM (FEI Nova 630) and AFM (Veeco Dimension 3100). AFM images were processed using
Gwyddion software to obtain depth data. Figure 3 displays profiles and selected images of
obtained structures (masters, injection moulding inlays, and replicas). As is seen, the inlay
used for injection moulding is a faithful replica of the master. The injection moulding replica
shows mostly faithful replication, but with enhancement in the depth at the deepest levels.
The SEM images reveal considerable surface roughness at the low end of the range, present in
the master and replicated in the injection moulded sample. In this range of the array, the
height is determined by only a slight break-through of the sacrificial ppHex mask. Evidently,
there is some non-uniformity in either the etch process or the layer thickness, that leads
directly to the observed roughness. AFM measurements reveal a surface roughness (Rq) of
approximately 1.8 nm at x=2, compared to 0.5 nm at x=9. At the low end of the range, the
relative size of the roughness compared to the pillar height is therefore considerably larger.
We believe that further optimization of the process could remove this effect.
Figure 3. Depth profile and selected SEM images of Qz pillar master and pillar-type injection moulded replica in polycarbonate at process conditions giving close to perfect replication of master dimensions (80oC tool temperature, 5 seconds cooling time, uncoated inlay). The change in contrast from master to replica is a consequence of the SEM detector system used for non-conducting samples.
- 11 -
3.2 Pillar Stretching
The final result of the injection moulding process is determined by two different sets of
parameters. Firstly, the choice of polymer and inlay material, and secondly, the machine
parameters employed during the process. Using the gradient master as a template for these
studies produces a comprehensive and highly extensive set of data. For the purpose of
analysis, all data is converted in to a relative height compared to the master, to enable direct
comparison of effects at various nominal pattern heights.
Depending on the final application, the choice of polymer may be fixed, due to restrictions on
e.g. biocompatability, transparency, or other parameters. In other cases, however, there may
be a number of options available. For the injection moulding inlay, one can use the native
surface or apply a surface coating[22,23]. Together, these choices define the surface energy at
the polymer/inlay interface. In this study we have used two different polymers: polycarbonate
(PC, Makrolon OD2015) and polystyrene (PS, Total 1810) and two different inlay surfaces:
untreated SU-8 and fluorosilane (F13-TCS) with intermediate CVD silicon nitride. The use of
a replication method for production of the inlay means both these options are easily produced
from the same original master.
Apart from material choice, the injection moulding process is determined by a range of
process conditions, including tool and melt temperature, injection speed, hold pressure and
time, shot volume, and more. In developing the injection moulding process for use with
nanostructures, we have found that while the injection speed and pressures are important for
obtaining an overall high quality of the finished part, the dimensions of the nanostructures
themselves are largely determined by the thermal characteristics of the polymer melt as it
comes in to contact with the tool and subsequently released. The two most important
- 12 -
parameters in this context are the tool temperature and the hold or cooling time. For this
study, three tool temperatures (one on either side of the nominally optimal (ie. the values
recommended by the supplier for general injection moulding conditions) value of 80oC for
polycarbonate and 50oC for polystyrene) and two cooling times (short – 5 seconds and long –
20 seconds) were used. As will be discussed below, polycarbonate turned out to give superior
quality to polystyrene. Therefore, detailed investigation of process parameters was performed
only with this material.
Due to the time-consuming nature of acquiring AFM data on the high number of samples,
each data point (i.e. a specific combination of pattern height, polymer, inlay, and moulding
parameters) is based on a single AFM image containing 50-100 individual nanopillars. The
sample for analysis was picked randomly from 10 samples produced at each condition, after
the conditions were changes and appeared stable on the user interface of the machine. To get a
picture of the influence of the various parameters, we have consolidated the data in the
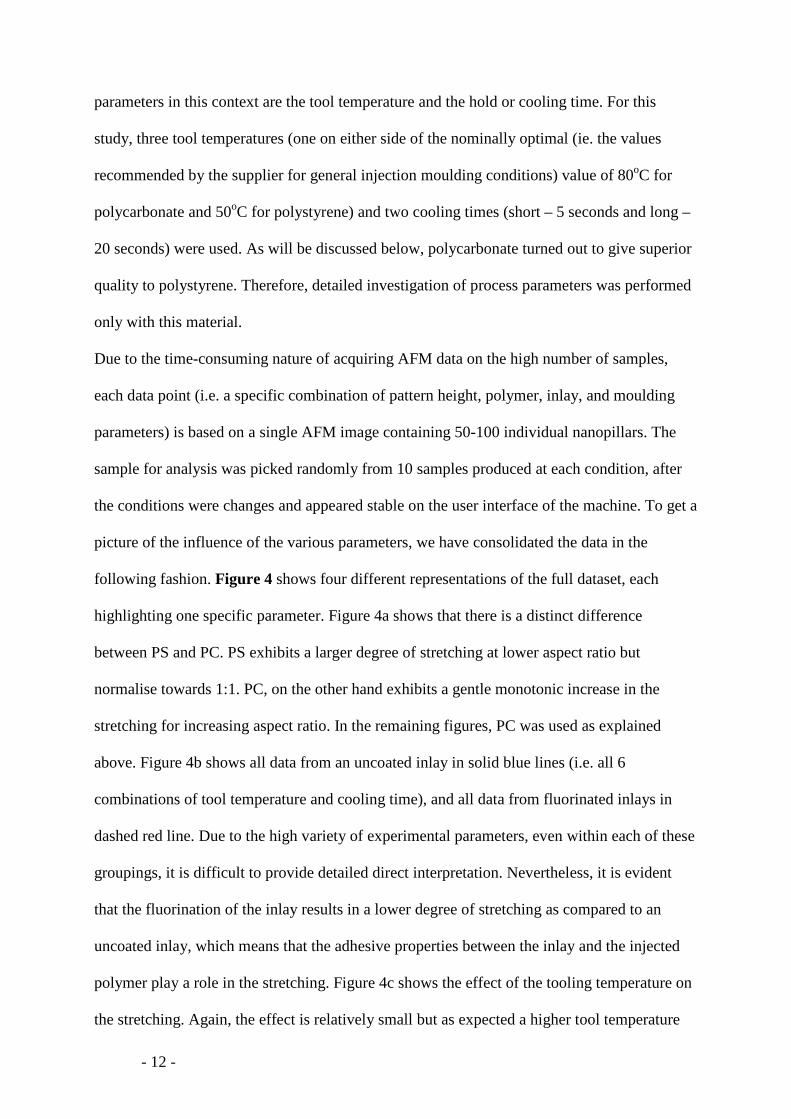
following fashion. Figure 4 shows four different representations of the full dataset, each
highlighting one specific parameter. Figure 4a shows that there is a distinct difference
between PS and PC. PS exhibits a larger degree of stretching at lower aspect ratio but
normalise towards 1:1. PC, on the other hand exhibits a gentle monotonic increase in the
stretching for increasing aspect ratio. In the remaining figures, PC was used as explained
above. Figure 4b shows all data from an uncoated inlay in solid blue lines (i.e. all 6
combinations of tool temperature and cooling time), and all data from fluorinated inlays in
dashed red line. Due to the high variety of experimental parameters, even within each of these
groupings, it is difficult to provide detailed direct interpretation. Nevertheless, it is evident
that the fluorination of the inlay results in a lower degree of stretching as compared to an
uncoated inlay, which means that the adhesive properties between the inlay and the injected
polymer play a role in the stretching. Figure 4c shows the effect of the tooling temperature on
the stretching. Again, the effect is relatively small but as expected a higher tool temperature
- 13 -
also results in an increase in the stretching. Finally in Figure 4d we can see cooling times of 5
and 20 seconds, a significant effect cannot be immediately observed.
Figure 4. The effects of four different injection moulding parameters and the pattern aspect ratio: a) choice of polymer. b) choice of injection moulding inlay coating. c) Choice of tool temperature. d) Choice of cooling time. Polymer nanopillar heights are displayed relative to the master dimension. Each subplot highlights one parameter choice, showing permutations of other parameters in the same linestyle. For a), the process conditions were 20 seconds cooling time, melt temperature 280 oC (PC)/250 oC (PS), and tool temperature 80 oC (PC)/50 oC (PS), with uncoated and fluorinated inlays. In b)-d) the plotted lines represent measurements from the full range of parameters for PC alone. The parameter space was: Uncoated or fluorinated inlay, cooling time 5 or 20 seconds, Tool temperature 65 oC, 80 oC, or 95 oC. Melt temperature was 280 oC for all experiments. Each of the plotted lines corresponds to a single combination of all parameters, with the parameter identified in the caption kept constant. The permutations used in each subplot is explicitly stated in the figure. Depending on the parameter choice the polymer is clearly stretched to dimensions larger than the original. For further discussion on the relative impact of the parameters, see main text.
- 14 -
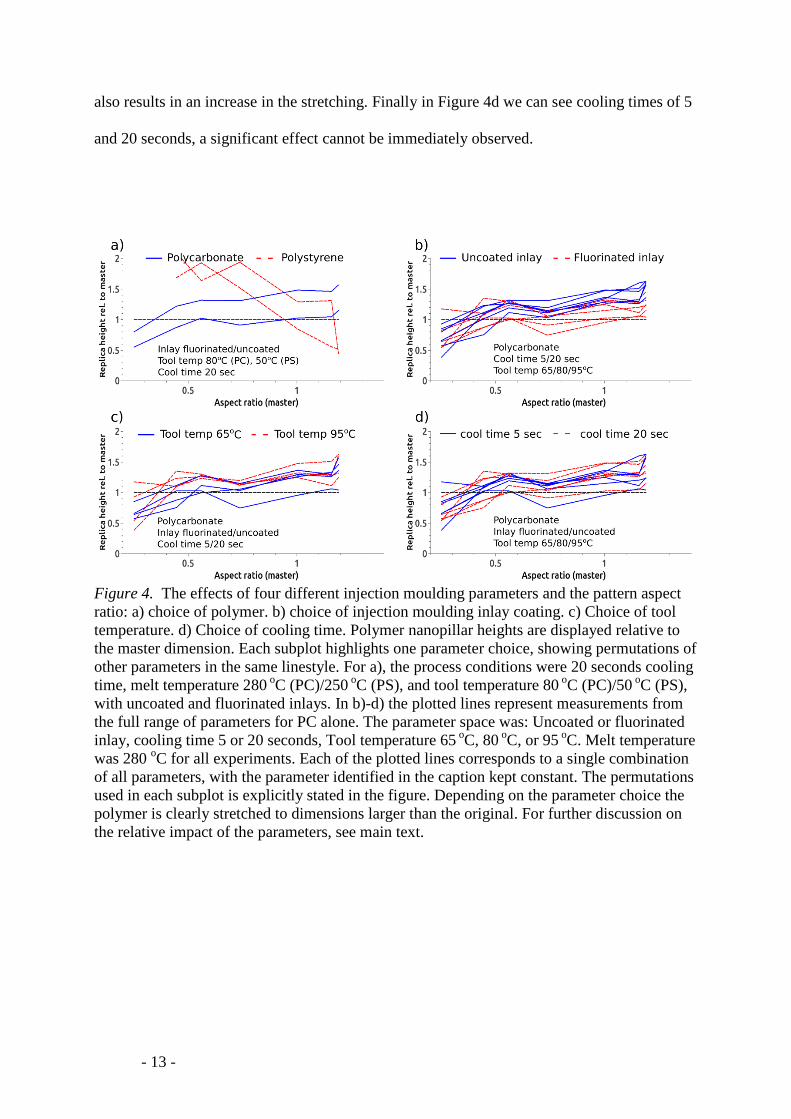
Figure 5. Processing and analysis of the data from figure 4, showing directly the relative effects of experimental parameters on the height of injection moulded nanopillars. The width of the coloured band is determined by the variation of all other parameters with the parameter in question held constant. For instance, “coating” data is found by dividing the relative height observed with an untreated inlay from that of a fluorinated inlay, averaged over all the different process conditions (polymer, cool time, tool temp, polymer). Thus, a value of 1 corresponds to the given parameter having no effect on the polymer dimension. The choice of polymer is the most important parameter. Temperature control parameters in the moulding process produce a finer level of control.
To assist in evaluating relative importance of parameters, Figure 5 shows directly the
average relative difference between the solid and dashed lines from figure 4. This number is
obtained in the following manner: For each parameter group, the relative difference is taken
from measurements where only this parameter is varied, with all others constant. The average
is then taken across all these available pairs. . Thus, in this figure, a value of 1 indicates that
the parameter in question has no measurable effect on the final pattern height, the effect
increasing with higher (or lower) values. The width of the coloured bands shows the standard
deviation on the values, considering both the variation in the AFM analysis on one injection
moulded replica for each parameter set, as well as the variation due to the grouping and
averaging procedure. The width of the bands is high compared to the differences in average,
with significant overlap between the different parameters. Such overlap is unsurprising, since
the performed analysis does not completely de-couple the different parameters. It should be
- 15 -
stressed that the objective of this analysis is not to show statistically significant differences
between parameters, but to compare them against each other. It is not unexpected that
variation of the parameters studied provides differences in results that are very close to each
other. Nevertheless, this overlap does mean that conclusions from this analysis are to be taken
as indications of trends only. We will show below how a detailed analysis of a specific subset
of parameters can provide a more statistically solid background.
We can now determine an order of importance of parameters on the final result: Polymer
choice is most important, the two temperature control parameters (tool temperature and
cooling time) are of similar importance, while the inlay coating is of slightly lower
importance.
To increase our understanding of the cause of the large effects of the polymer choice, and
relatively small effects of the inlay coating, on injection moulding results, knowledge of the
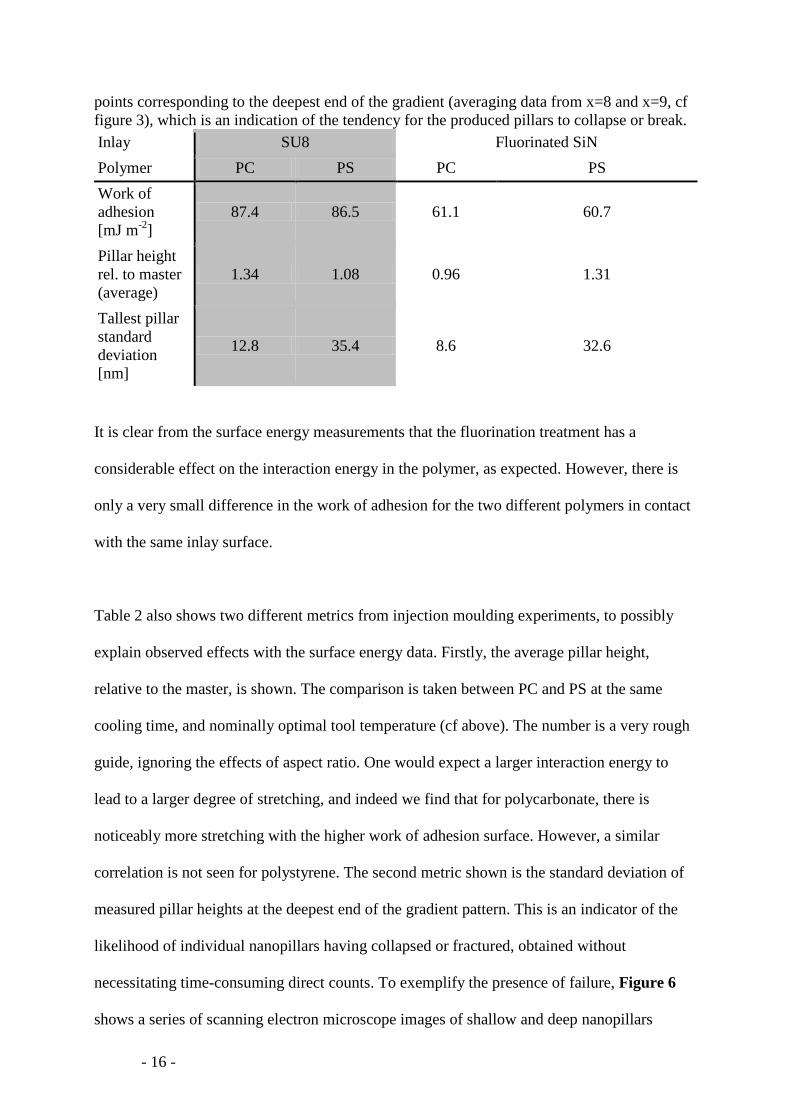
surface and interaction energies of the materials in question is desirable. Table 1 and 2 show
the surface energy measurements performed on polymer and inlay surfaces, and calculated
values for the work of adhesion of the relevant polymer-inlay combinations. Calculations
were performed using the procedure described in section 2.2.
Table 1. Obtained contact angle values (degrees) and calculated surface tension parameters (mN m-1) of surfaces relevant to this study. Surface tension is calculated by the geometric mean method (Fowkes theory). Surface θ(water) θ(diiodomethane) γp γd γ SU8 81.3±2.8 35.2±0.5 1.6 41.9 43.5 Fluorinated SiN 91.3±1.4 70.4±2.5 2.7 22.7 25.3 Polystyrene 88.1±2.6 31.6±0.5 0.3 43.5 43.9 Polycarbonate 88.0±1.5 28.6±0.8 0.2 44.8 45.0
Table 2. Calculated adhesion energies for the inlay-polymer combinations used in this study. Adhesion energies were calculated using the harmonic mean. Table also shows average pillar stretching values from injection moulded samples produces with the specified material combination. Finally, the table shows the standard deviation of measurements at the two data
- 16 -
points corresponding to the deepest end of the gradient (averaging data from x=8 and x=9, cf figure 3), which is an indication of the tendency for the produced pillars to collapse or break. Inlay SU8 Fluorinated SiN Polymer PC PS PC PS Work of adhesion [mJ m-2]
87.4 86.5 61.1 60.7
Pillar height rel. to master (average)
1.34 1.08 0.96 1.31
Tallest pillar standard deviation [nm]
12.8 35.4 8.6 32.6
It is clear from the surface energy measurements that the fluorination treatment has a
considerable effect on the interaction energy in the polymer, as expected. However, there is
only a very small difference in the work of adhesion for the two different polymers in contact
with the same inlay surface.
Table 2 also shows two different metrics from injection moulding experiments, to possibly
explain observed effects with the surface energy data. Firstly, the average pillar height,
relative to the master, is shown. The comparison is taken between PC and PS at the same
cooling time, and nominally optimal tool temperature (cf above). The number is a very rough
guide, ignoring the effects of aspect ratio. One would expect a larger interaction energy to
lead to a larger degree of stretching, and indeed we find that for polycarbonate, there is
noticeably more stretching with the higher work of adhesion surface. However, a similar
correlation is not seen for polystyrene. The second metric shown is the standard deviation of
measured pillar heights at the deepest end of the gradient pattern. This is an indicator of the
likelihood of individual nanopillars having collapsed or fractured, obtained without
necessitating time-consuming direct counts. To exemplify the presence of failure, Figure 6
shows a series of scanning electron microscope images of shallow and deep nanopillars
- 17 -
produced at low and high stretching conditions, clearly showing a higher failure rate in one of
the conditions, Figure 6d. For further background on this metric, see supporting information.
Again we observe correlation for polycarbonate, with higher interaction energy leading to
higher degree of failure; however this correlation does not extend to polystyrene. We
therefore conclude that the differences observed between the two polymers are not due to the
interaction energy with the inlay surface, but rather due to intrinsic material parameters. The
yield stress, i.e. the longitudinal stress level beyond which a material undergoes irreversible
deformation is noticeably lower for polystyrene than polycarbonate (63 MPa for
polycarbonate, 42 MPa for polystyrene), and this leads to a much higher rate of failure of
polystyrene pillars, especially at the deeper end of the height range. This in turn obscures any
effects due to the interaction energy from observation. It also serves to partially explain the
surprising trend seen for PS, where the relative stretching was observed to decrease as the
aspect ratio increases (figure 4a). In fact, this observed decrease is caused mainly by the
highly increased amount of nanopillar collapse or breakage, as this causes not only an
increase in the standard deviation, but also a decrease in the average. However, it remains
surprising that the relative stretching at the low-to-midrange of the array is seen to be higher
than for PC, as this effect cannot be explained by the obtained surface energy measurements.
We believe the main cause of this anomaly to be a high variance in the measurement, possibly
in conjunction with the surface roughness of the master, as discussed above.
Considering the remaining two parameters studied, tool temperature and cooling time, we saw
from figure 5 that both yield similar levels of control over the final result. Considering also
aspect ratio effects, there is a slight yet clear trend where the effect of the cooling time
becomes relatively more important compared to the tool temperature as the aspect ratio
increases.
- 18 -
This may be attributed to the volume of polymer injected into the nanocavities. As the
dimensions of the nanopillars increase so will the contact area between the replica and the
inlay. This in turn leads to an increased frictional force which is likely to contribute to the
observed stretching as a function of the aspect ratio – or pillar dimensions.
Figure 6. Electron microscope images of shallow (approximately 50 nm high) (a,c) and deep (approximately 150 nm high) (b,d) polycarbonate nanopillars, produced at a tool temperature of 50oC (a,b) or 90 oC (c,d). Shallow, unstretched, pillars are highly uniform, while the tall pillars show a significantly increased defect density for the higher temperature.
Increasing the cooling time from 5 to 20 seconds is an undesirable adjustment, since it more
than doubles the complete cycle time of the process. Hence, adjustment of the tool
temperature is of greater interest from the viewpoint of maximizing efficiency and
throughput. We therefore performed a more detailed study on the level of control offered,
with results seen in Figure 7 displays more detailed results of the amount of control offered.
As is seen, the height of the nanopillars can be controllably extended from near the nominal
value to approximately 1.5 times larger.
- 19 -
Figure 7 also shows further clarity of an effect noticeably from figure 4. The relative amount
of stretching is not just determined by the process parameters, but is also affected strongly by
the aspect ratio of the structures. There is a general trend of increasing stretching with
increasing aspect ratio. However, the correlation is not linear, with a noticeable plateau in the
mid-range with aspect ratios around 0.6-1.1. This plateau behaviour is consistent across all
process parameters. Above this aspect ratio, the stretching increases noticeably. This can be
considered a critical point where the cavity sidewall interactions become sufficiently high to
have a dominating effect on the amount of stretching. This explanation is supported by the
parameter comparison in figure 5, where it is seen that the effect of the surface coating
becomes increasingly important in this range. The drop-off at low aspect ratio may also be
influenced by the lower quality of the master pattern, as discussed in relation to figure 3
above.
Figure 7. Stretching of polycarbonate nanopillar structures as a function of the tool temperature during injection moulding and the aspect ratio of the master pattern, shown as height relative to the master dimension. To summarize the above discussion, our investigation into the applicability of injection
moulding for replication of nanopillar structures reveals that the choice of material and
- 20 -
process parameters have dramatic effect on the process outcome. We have shown that
polystyrene is mechanically less stable, while polycarbonate can sustain a higher degree of
stretching without failure. Reducing the interaction energy by employing a fluorinated inlay
additionally reduces defectivity. Control of the polymer temperature during the injection
moulding process provides a fine layer of control of the geometry of the produced nanopillar
structures, the relative effect determined also by the aspect ratio of the structure. Thus, for
polycarbonate, we are able to choose with confidence the process parameters required to
produce the exact geometry as needed by a specific application.
4. Conclusions
In conclusion, this work has presented a detailed study of the challenges of high-throughput
injection moulding of polymer nanopillar arrays. Using a novel fabrication platform featuring
smooth variations in pattern heights we are able to gain detailed information about the
influence of pattern dimensions in an efficient manner. We accomplish this by adding a
sacrificial layer of plasma polymerized hexane, deposited with a gradient in thickness, to a
standard lithography and etch fabrication process.
We have investigated the effects of a number of different process parameters on the
replication process, having observed a “stretching” effect of the nanopillars, particularly at
high aspect ratios. By choosing polycarbonate polymer and an anti-adhesion treatment on the
injection moulding inlay we are able to minimize the risk of failure of high aspect ratio
nanopillars. By additionally controlling the tool temperature during injection, we can fine tune
the produced polymer structures, with heights controllably modified compared to the master.
Conditions that gave the most faithful replication were a tool temperature of 80oC and a
cooling time of 5 seconds.
- 21 -
The produced nanopillar samples have immediate applications for cell-surface interaction
studies, and the knowledge obtained regarding tunability of the injection moulding process, in
particular for polycarbonate, will enable us to improve efficiency of the sample production in
the future, as the height tunability reduces the requirement of expensive fabrication of masters
with different depths.
Acknowledgements: The work has been partially funded by the Engineering and Physical
Sciences Research Council (EPSRC), grant no EP/F047851/1, and the Glasgow Research
Partnership in engineering (GRPe). The work was supported by the EC-funded project
NAPANIL (Contract no. FP7-CP-IP214249-2). J. M. Stormonth-Darling was supported by an
EPSRC Doctoral Training Allowance scholarship. Mr Paul Reynolds is acknowledged for
useful discussions and assistance with injection moulding and Prof. Morgan Alexander at
Nottingham University for discussions relating to plasma polymerisation.
Received: Month XX, XXXX; Revised: Month XX, XXXX; Published online:
((For PPP, use “Accepted: Month XX, XXXX” instead of “Published online”)); DOI:
[16] S. Balslev, T. Rasmussen, P. Shi, A. Kristensen, Proc. SPIE 2006, 61100C.
[17] N. Unno, J. Taniguchi, S. Ide, S. Ishikawa, Y. Ootsuka, K. Yamabe, T. Kanbara, J. Phys. Conf. Ser. 2009, 191, 012014.
[18] P. M. Reynolds, R. H. Pedersen, J. Stormonth-Darling, M. J. Dalby, M. O. Riehle, N. Gadegaard, Nano Lett. 2013, 13, 570.
[19] R. H. Pedersen, M. Hamzah, S. Thoms, P. Roach, M. R. R. Alexander, N. Gadegaard, Microelectron. Eng. 2010, 87, 1112.
[20] B. Janczuk, W. Wojcik, A. Zdziennicka, J. Colloid Interface Sci. 1993, 157, 384.
[21] S. Wu, J. Polym. Sci. Part C 1971, 30, 19.
[22] K. Bobzin, N. Bagcivan, A. Gillner, C. Hartmann, J. Holtkamp, W. Michaeli, F. Klaiber, M. Schöngart, S. Theiß, Prod. Eng. 2011, 5, 415.
[23] M. Matschuk, N. B. Larsen, J. Micromechanics Microengineering 2013, 23, 025003.
- 23 -
We show tunable reproduction of polymer nanostructures by injection moulding. Using a novel fabrication method to produce a master with a gradient in pattern height we conduct detailed investigations of the injection moulding process of nanopillar structures. Material choice and moulding parameters lead to optimization and control of the final result. R. H. Pedersen, Q. Xu, J. M. Stormonth-Darling, N. Gadegaard* Strategies for high quality injection moulding of polymer nanopillars
- 24 -
Supporting Information Strategies for high quality injection moulding of polymer nanopillars Rasmus H. Pedersen*, Qian Xu, John M. Stormonth-Darling, Nikolaj Gadegaard* In the main text we used the standard deviation on the nanopillar height, as measured by AFM, as a metric for quantifying the quality of produced structures.. In this supporting information, we show two example images to demonstrate the validity of this correlation. Figure S1 shows AFM images from a low-defectivity and high-defectivity conditions. Table S1 lists the exact process conditions for the images, and details the results of the analysis. In the low-defectivity case, it is clear that all or most pillars are intact and as a result the standard deviation of the height is low. In contrast, for the high-defectivity case, many of the pillars have either broken in the middle or collapsed. Analysis therefore produces a large standard deviation. Thus, this metric can be used to quantify the quality of the sample in question.
Figure S1. AFM images of injection moulded nanopillar structures produced with parameters yielding a) low defectivity or b) high defectivity. Table S1. Parameters and analysis for images shown in figure S1, showing the correlation between observably broken nanopillars and the measured standard deviation of pillar height. Sample Low defectivity - fig S1a) High defectivity – fig S1b) Parameters Polycarbonate
Tool temp 65°C cool time 5 sec Uncoated inlay
Polystyrene Tool temp 50°C cool time 20 sec Fluorinated inlay