35

Pedestrian Safety Application (ANSA & META)
PEDESTRIAN TOOL
HEADFORM TESTING
Table of Contents
1. Introduction....................................................................................................................................31.1. Data files................................................................................................................................3
2. ANSA PEDESTRIAN TOOL...........................................................................................................4 2.1 Introduction............................................................................................................................4 2.2. Prerequisites.........................................................................................................................5 2.3. Model description.................................................................................................................5 2.4 Creation of the Reference Lines............................................................................................6 2.5 Determination of Target Points..............................................................................................9 2.6 Headform Single Point Positioning......................................................................................12 2.7 Headform Multi Point Positioning........................................................................................13
3. META PEDESTRIAN TOOL........................................................................................................14 3.1 Introduction..........................................................................................................................14 3.2 Headform Testing................................................................................................................15
3.2.1 2d Post Process of Target Points Results..................................................................15 3.2.2 3d Post Process of Target Points Results..................................................................21 3.2.3 Custom Post Process of Target Points Results..........................................................23 3.2.4 Results Overview – No Raster....................................................................................24 3.2.4 Results Overview – Raster EU Phase 1/2..................................................................26
3.3 Legform Testing...................................................................................................................28 3.3.1 2d Post Process of Target Points Results..................................................................28 3.3.2 3d Post Process of Target Points Results..................................................................30 3.3.3 Custom Post Process of Target Points Results..........................................................30 3.3.4 Results Overview .......................................................................................................30
3.4 Upperl leg Testing...............................................................................................................32 3.4.1 2d Post Process of Target Points Results..................................................................32 3.4.2 3d Post Process of Target Points Results..................................................................34 3.4.3 Custom Post Process of Target Points Results..........................................................34 3.4.4 Results Overview .......................................................................................................34
BETA CAE Systems S.A. 2

Pedestrian Safety Application (ANSA & META)
1. Introduction
This application example presents the functionality of ANSA and μETA Pedestrian tool. It is a complete tool (from pre to post processing) where the user can set up and evaluate a Pedestrian Safety test procedure. Specifically, in the current document a Headform is going to be positioned on impact points whose position is calculated for EuroNCAP protocol For this purpose the example will go through the following steps:
1. Creation of reference lines
2. Determination of target points
3. Positioning of the Headform on the target points
Afterwards, the post process of the results with μETA (for Headform, Legform and Upper leg) will be demonstrated in the following steps:
1. 2d Post Process of Hit Points Results2. 3d Post Process of Hit Points Results3. Results Overview (creation of Annotations, mapping of values on bonnet / bumper,
projection of impacted area and area calculation for Headform EU phases, creation of overview 2d plots)
1.1. Data files
The files of this application example are located in the directory: /tutorials_and_examples/examples/pedestrian_safety/
HEADFORM_TEST_TUTORIAL_initial.ansa The initial ANSA databaseHEADFORM_TEST_TUTORIAL_initial.pc The initial input deckbonnet.pc Include file for the vehicleImpactor.pc Include file for the headformPedestrianWithIncludePam.bs Multi positioning script functionMetaPost/Pedstrian_report_template.pptx
Report template file
MetaPost/ResultsOverview_bonnet.pc Input file of the model with a finer mesh of the bonnet to be used in μETA for the results overview
MetaPost/ResultsOverview_EU_phase1_raster.pc
Raster according to EC Regulation
MetaPost/Target_Points_files Folder including ASCII Target Points files MetaPost/Settings_sessions Folder including session files for settingsMetaPost/Solution Folder with one solution of Headform testing
BETA CAE Systems S.A. 3

Pedestrian Safety Application (ANSA & META)
2. ANSA PEDESTRIAN TOOL
2.1 Introduction
The Pedestrian function of ANSA is a tool that enables the user to set up a complete test concerned to the pedestrian protection, according to EU phase 1 and 2, EuroNCAP v5.1, JNCAP, TRIAS63 and the EuroNCAP Grinds proposal of 2010.EU phases 1 and 2 set out the basic requirements for the protection of pedestrians and other vulnerable road users in the form of tests and limit values for the type of vehicles and of frontal protection systems as separate technical units.EuroNCAP protocol aims to encourage improvement of vehicle performance concerning the pedestrian safety through leg form, upper leg form and child/adult head form testing.
Afterwards, the post process of the results with μETA will be demonstrated in the following steps:1. Headform testing2. Legform testing3. Upper leg testing
BETA CAE Systems S.A. 4
Pedestrian Safety Application (ANSA & META)
2.2. Prerequisites
The user doesn't have to have a deep knowledge of the cor. The main steps of such kind of tests are explained in the current document. Also there is no need of the user to be familiar with ANSA or with a specific solver, because Pedestrian tool is a common ANSA tool for all decks and its steps are explained in detail in the current application example.
2.3. Model description
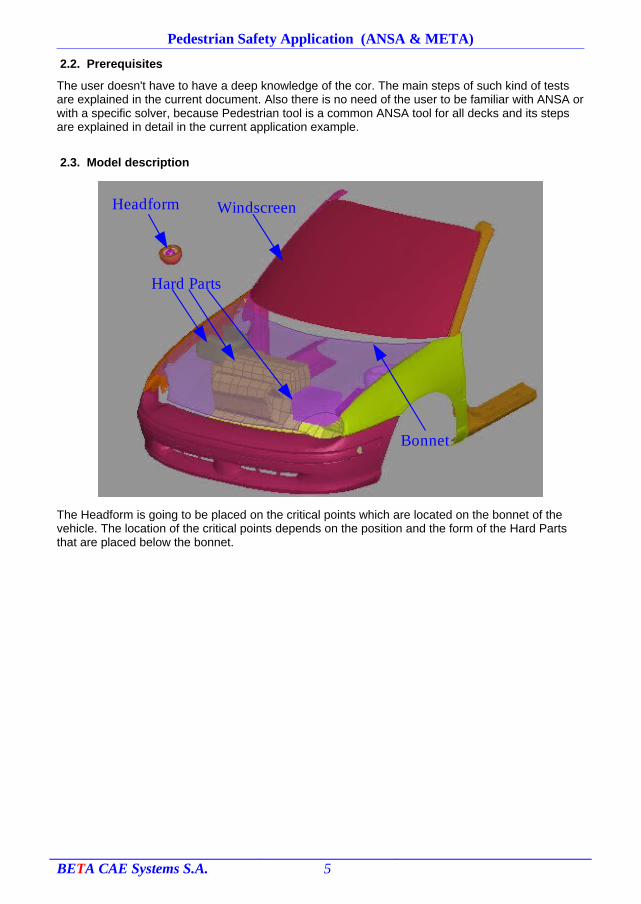
The Headform is going to be placed on the critical points which are located on the bonnet of the vehicle. The location of the critical points depends on the position and the form of the Hard Parts that are placed below the bonnet.
BETA CAE Systems S.A. 5
Headform
Bonnet
Windscreen
Hard Parts
Pedestrian Safety Application (ANSA & META)
2.4 Creation of the Reference Lines
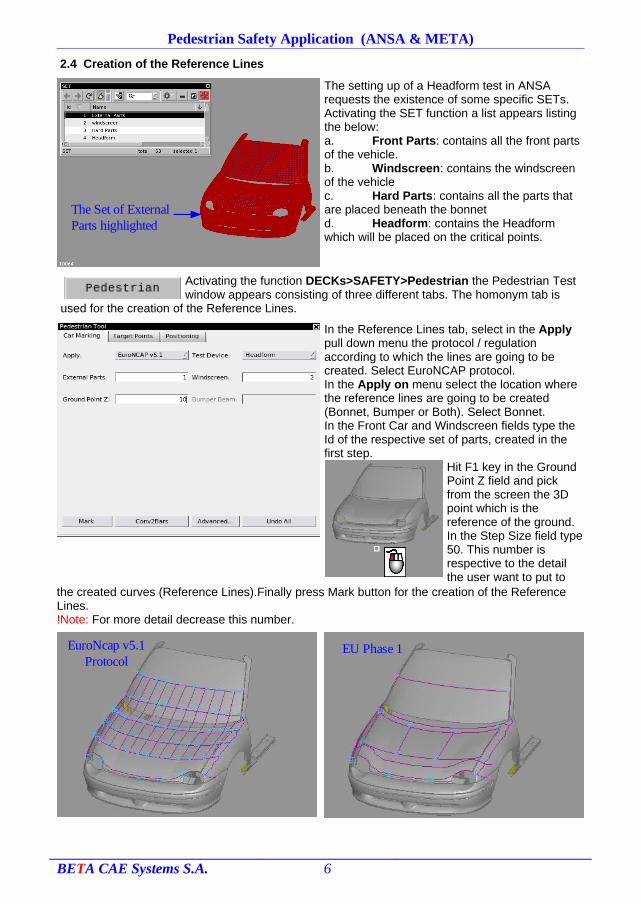
The setting up of a Headform test in ANSA requests the existence of some specific SETs. Activating the SET function a list appears listing the below:a. Front Parts: contains all the front parts of the vehicle.b. Windscreen: contains the windscreen of the vehiclec. Hard Parts: contains all the parts that are placed beneath the bonnetd. Headform: contains the Headform which will be placed on the critical points.
Activating the function DECKs>SAFETY>Pedestrian the Pedestrian Test window appears consisting of three different tabs. The homonym tab is
used for the creation of the Reference Lines.
In the Reference Lines tab, select in the Apply pull down menu the protocol / regulation according to which the lines are going to be created. Select EuroNCAP protocol.In the Apply on menu select the location where the reference lines are going to be created (Bonnet, Bumper or Both). Select Bonnet.In the Front Car and Windscreen fields type the Id of the respective set of parts, created in the first step.
Hit F1 key in the Ground Point Z field and pick from the screen the 3D point which is the reference of the ground.In the Step Size field type 50. This number is respective to the detail the user want to put to
the created curves (Reference Lines).Finally press Mark button for the creation of the Reference Lines.!Note: For more detail decrease this number.
BETA CAE Systems S.A. 6
The Set of External Parts highlighted
EuroNcap v5.1Protocol
EU Phase 1

Pedestrian Safety Application (ANSA & META)Pressing the Advanced button there is access to the values of the corresponding Protocol. This way one can set one's user defined values.These values can be saved in the ANSA.defaults file and one is able to launch ANSA with the desired default values.If there is need to to restore the original default values then button Restore Defaults must be pressed.
For user defined reference line, press WAD (Wrap around distance) Line button in order to create one.
In the Length field type 1900 and in the Name field type Added. Also check the flag Trim with Side Lines.
The creation of the Reference Lines results in the creation of the respective sets for their easier manipulation. Sets are also created for the respective points.
!Note: The user defined WAD Lines will be taken into consideration by the pedestrian tool only if they will be placed inside the respective Set.
BETA CAE Systems S.A. 7

Pedestrian Safety Application (ANSA & META)Press the button Conv2Beams and ANSA will create above the curves beams which are going to be used for reference reasons in post processing. The beams enable the user to locate the zone where the Impact points belong to, to
interpolate the HIC values on the bonnet and to create annotations on the hit points locations. In LS-DYNA DECK SECTION_BEAM_ELFORM 3 will be created.
BETA CAE Systems S.A. 8
Pedestrian Safety Application (ANSA & META)
2.5 Determination of Target Points
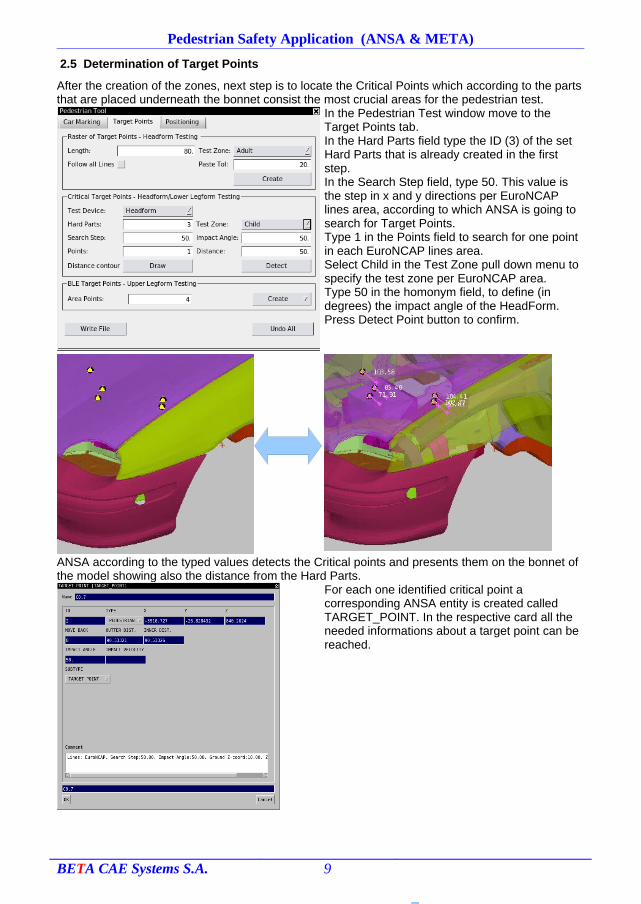
After the creation of the zones, next step is to locate the Critical Points which according to the parts that are placed underneath the bonnet consist the most crucial areas for the pedestrian test.
In the Pedestrian Test window move to the Target Points tab.In the Hard Parts field type the ID (3) of the set Hard Parts that is already created in the first step.In the Search Step field, type 50. This value is the step in x and y directions per EuroNCAP lines area, according to which ANSA is going to search for Target Points.Type 1 in the Points field to search for one point in each EuroNCAP lines area.Select Child in the Test Zone pull down menu to specify the test zone per EuroNCAP area.Type 50 in the homonym field, to define (in degrees) the impact angle of the HeadForm.Press Detect Point button to confirm.
ANSA according to the typed values detects the Critical points and presents them on the bonnet of the model showing also the distance from the Hard Parts.
For each one identified critical point a corresponding ANSA entity is created called TARGET_POINT. In the respective card all the needed informations about a target point can be reached.
BETA CAE Systems S.A. 9

Pedestrian Safety Application (ANSA & META)In order to have an overview of the distance between the Hard Parts and the bonnet press the Draw button.The elements of the bonnet SET will be drawn according to their distance from the Hard Parts. The respective color palette is simultaneously visible.
Pedestrian tool enables the user to use also another way in order to detect the crucial points according to EuroNCAP protocol.The creation of a Raster of Target Points (available for EU phase 1 and 2 and EuroNCAP) first needs to type a length of its square areas. Here type 50.In the Side Tol field type the distance of 10. This distance dictates the length of the last step of the raster closing on the rightand left side reference lines.In the Test Zone pull down menu select Child.If the the raster would be created for Adult test then, the set which includes the Windscreen should be input.To confirm press Create Raster button.
Press the Write File button in order to create an ASCII file with the coordinates of the points that have been detected.
The Undo button is available and can be pressed in order to delete the created Raster and detected Critical Target Points.
BETA CAE Systems S.A. 10

Pedestrian Safety Application (ANSA & META)The respective sets of Raster Target Points and Critical Points have been created for their easier manipulation.
!Note: In order to include any user defined 3D points in the exported ASCII File, put them into the respective SET.
BETA CAE Systems S.A. 11
Pedestrian Safety Application (ANSA & META)
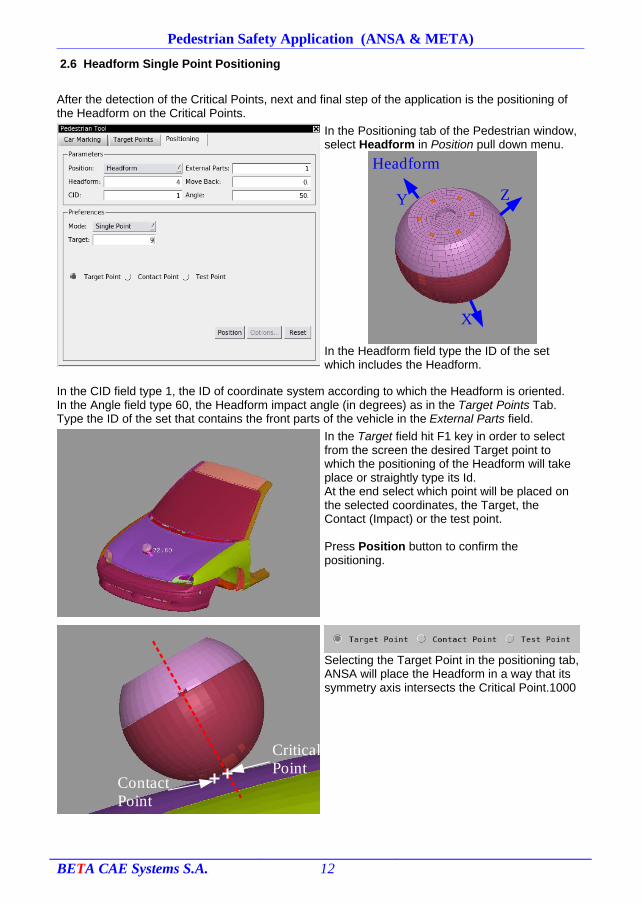
2.6 Headform Single Point Positioning
After the detection of the Critical Points, next and final step of the application is the positioning of the Headform on the Critical Points.
In the Positioning tab of the Pedestrian window, select Headform in Position pull down menu.
In the Headform field type the ID of the set which includes the Headform.
In the CID field type 1, the ID of coordinate system according to which the Headform is oriented.In the Angle field type 60, the Headform impact angle (in degrees) as in the Target Points Tab.Type the ID of the set that contains the front parts of the vehicle in the External Parts field.
In the Target field hit F1 key in order to select from the screen the desired Target point to which the positioning of the Headform will take place or straightly type its Id.At the end select which point will be placed on the selected coordinates, the Target, the Contact (Impact) or the test point.
Press Position button to confirm the positioning.
Selecting the Target Point in the positioning tab, ANSA will place the Headform in a way that its symmetry axis intersects the Critical Point.1000
BETA CAE Systems S.A. 12
X
ZY
Headform
Contact Point
Critical Point

Pedestrian Safety Application (ANSA & META)
Activating the Contact Point flag then ANSA will place the Headform in a way that the Contact Point coincide with the Critical point.
2.7 Headform Multi Point Positioning
The Pedestrian Tool of ANSA gives user the ability to apply a multi positioning to all the identified critical points and create files ready to be solved.
In the Preferences area of the Positioning tab turn the Mode pull down menu to the option Multi Point and press the Options button.
In the Multi Point Options window, select the HEADFORM_TEST_TUTORIAL_initial.pc which is the master file for the solver. In the Include Files Name field, type the name of the include file for each point.Select the path of the directory where the created files will be placed, type the name of the μETA file which is going to be created and type a name for the csv file which will contain a list with all the target points and their coordinates.
Finally select which target points will be taken into account (Critical Points, Raster Points, BLE or All).Press OK to confirm and in the Positioning tab press Position Item button in order to initiate the multi positioning.For each critical point a folder will be created where a copy of the master file and the include file, which will contain the transformation matrix for the corresponding positioning, will be placed.The μETA file which is created contains the coordinates, the velocity, the type and the impact angle of each target point for use in the post processing with μETA.If no velocity keyword has been defined in the Master file a value can be typed in the Velocity field in order to create one and included it in the new Include file.
The process explained above can be done also through the script function PedestrianWithIncludePam.bs placed in the scripts folder in the ANSA installation directory.
BETA CAE Systems S.A. 13
Contact Point PositioningTarget Point
Positioning
Contact Point
The Contact Point is the Critical Point

Pedestrian Safety Application (ANSA & META)3. META PEDESTRIAN TOOL
3.1 Introduction
μETA offers a toolbar specially developed to facilitate the post process of pedestrian analysis. Open μETA and select Toolbars > Pedestrian to open the respective Toolbar. Alternatively select Pedestrian at the μETA launcher, so that μETA opens directly with Pedestrian toolbar open. The toolbar is split into three tabs. The fields in the tabs change automatically according to the selected type of testing – Headform, Legform or Upper leg.
The first tab, Process Target Points, is for the 2d and 3d post process of the results files of all target points.
The second tab, Results Overview, is for the visualization of an overview of all results on a single 3d model. For Headfrom testing the user can create colored annotations with the HIC values, map the values on the bonnet (either by passing the values inside a circular area or through interpolation), create the projection of the impacted area and calculate either the area percentage above a threshold value or the value for a given area percentage. For Legform and Upper leg the user can create colored annotations with the values of interest and 2d plots of the values to the Y coordinate.
The third tab, Settings, contains some settings used at the processes of the first two tabs.
Due to the size of the files only one set of PAMCRASH results files for Headform is provided as example file for the Process Target Points tab. However, there are example files for the Results Overview for Headform, Legform and Upper leg testing.
BETA CAE Systems S.A. 14

Pedestrian Safety Application (ANSA & META)
3.2 Headform Testing
3.2.1 2d Post Process of Target Points Results
Select the tab Process Target Points Results.
In File Format select PAMCRASH.
In Unit System select mm – kg – msec (the unit system of the results).
In Target Points file select the file MetaList.txt in folder MetaPost/Target_Points_files. This is an ASCII file with the data for each target point. This file is output by ANSA at the automatic positioning of the head for all the target points (version v13.1.0 and after). The most important columns in the file are- Name: The name of the target point.- Node Id: The id of the raster's node defining the hit position.- X / Y / Z Coordinates: The coordinates of the hit position.- Value: The HIC value which will be calculated for this position.A blank file can also be selected. In this case the file will be output by μETA after the 2d post process of the hit points, but some data of the hit points will be missing, like the node id of the raster corresponding to the hit position, the coordinates of the node and other.
The columns for the coordinates are needed for the creation of annotations and the mapping of the results on the bonnet at Results Overview tab with the No Raster option. In case the columns for the coordinates are empty, they can be approximated and filled in at the 3d post process of the target points. However, it is advised to fill the exact coordinates in the ASCII file. The columns for the node ids are needed for the creation of annotations and the interpolation of the results on the bonnet at Results Overview tab with the Raster EU Phase 1/2 option.
In Directory Containing Target Points Results Files select the folder /MetaPost/Solution/Version01. It is the folder that contains all the results files (in the tutorial files only one is contained). μETA will search in this folder AND all the subfolders for results files of the specified deck.
In Directory for Images/Videos/Report select a folder where the pictures and the videos will be saved and where the html report shall be created, if selected.
In Node Id on Head set 192282. The history results file must contain the acceleration and displacement results for this node in order for μETA to calculate the HIC value and to plot the displacements. In case Radioss format is used there is an extra option to use an accelerometer instead of node.
In Contact Id between Head & Bonnet set 2. This is an optional input.
Go to Settings tab. Here are some optional settings that can be defined.Set Report type to BOTH (for Headform the available options are PPTX, HTML or BOTH) and leave the HIC time interval to 36 (this is the interval that will be used for the HIC calculation).Leave the default HIC Safe Limit and HIC Critical Limit. These values are used in the summary table in the created report, so that each result is colored according to the HIC value.
BETA CAE Systems S.A. 15

Pedestrian Safety Application (ANSA & META)In Session for 2d plots Settings a session file can be defined. If the checkbox is activated, this session file will be executed after the 2d plots for each target point are created. So the user can apply some settings for the 2d plots by including the respective commands in this session file. An example of such a session file is the file /MetaPost/Settings_sessions/pedestrian_session_for_2d_plots_headform.ses.
Activate the checkbox Session for Slide Settings and choose the file /MetaPost/Settings_sessions/pedestrian_session_for_2d_slide_headform.ses. This session will be executed after the creation of the slide with the images of the 2d plots for each target point. So, the user can change the size of the images or move them in the slides by including the respective commands in this session file.
By default all the created windows with the 2d plots are deleted automatically after the creation of the report slides. There is the option to keep the windows by activating the flag Do not delete windows. However, this might result to the creation of a large number of windows, so it is advised not to be used unless there is a reason (e.g. to create the session for the 2d plots settings).
The settings tab should look as below.
In the main menu select Tools > Report > Report Composer to open the Report Composer tool. Click on Open Presentation and open the file /MetaPost/Pedestrian_report_template.pptx.Press Esc to close the Report Composer window.
BETA CAE Systems S.A. 16
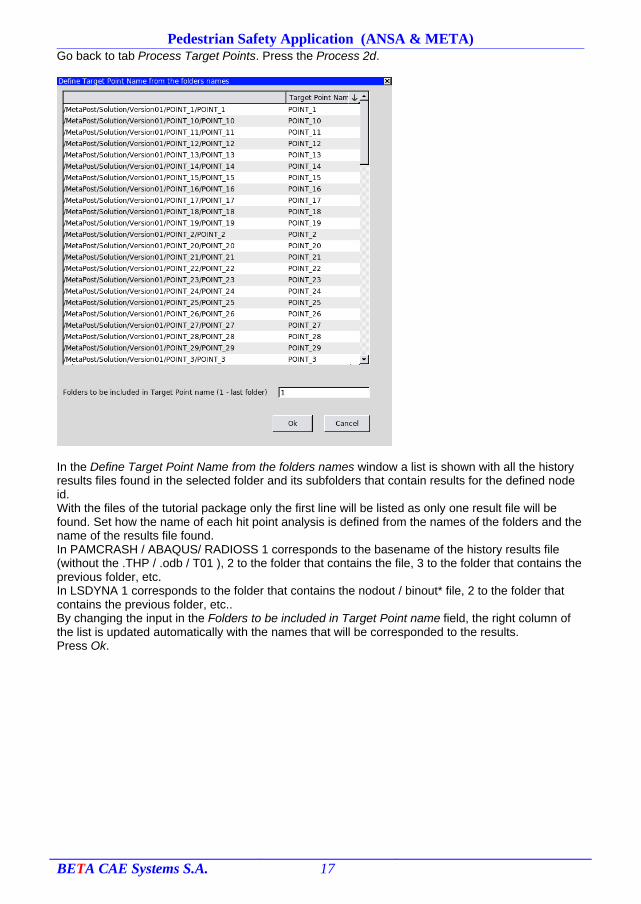
Pedestrian Safety Application (ANSA & META)Go back to tab Process Target Points. Press the Process 2d.
In the Define Target Point Name from the folders names window a list is shown with all the history results files found in the selected folder and its subfolders that contain results for the defined node id. With the files of the tutorial package only the first line will be listed as only one result file will be found. Set how the name of each hit point analysis is defined from the names of the folders and the name of the results file found. In PAMCRASH / ABAQUS/ RADIOSS 1 corresponds to the basename of the history results file (without the .THP / .odb / T01 ), 2 to the folder that contains the file, 3 to the folder that contains the previous folder, etc. In LSDYNA 1 corresponds to the folder that contains the nodout / binout* file, 2 to the folder that contains the previous folder, etc.. By changing the input in the Folders to be included in Target Point name field, the right column of the list is updated automatically with the names that will be corresponded to the results.Press Ok.
BETA CAE Systems S.A. 17
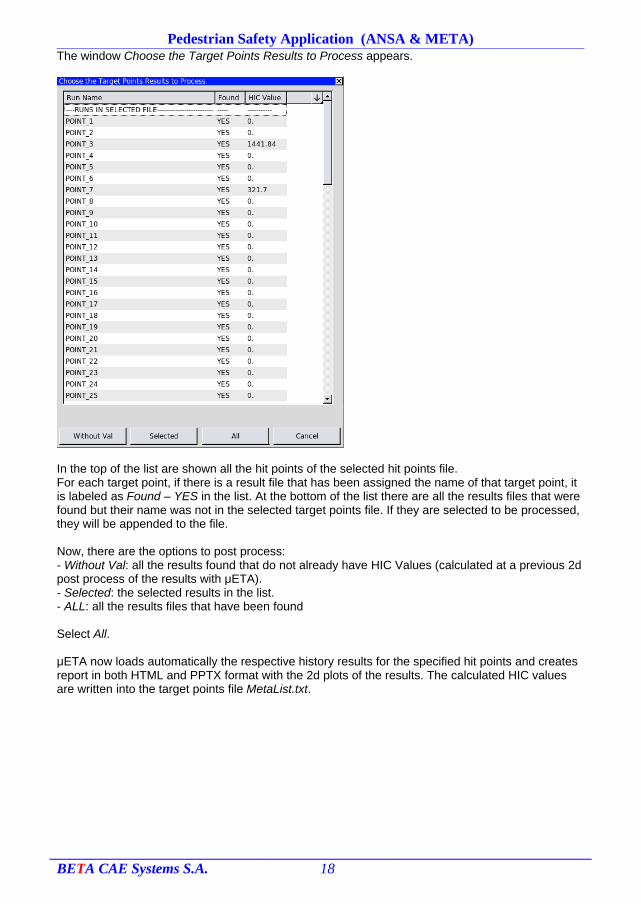
Pedestrian Safety Application (ANSA & META)The window Choose the Target Points Results to Process appears.
In the top of the list are shown all the hit points of the selected hit points file.For each target point, if there is a result file that has been assigned the name of that target point, it is labeled as Found – YES in the list. At the bottom of the list there are all the results files that were found but their name was not in the selected target points file. If they are selected to be processed, they will be appended to the file.
Now, there are the options to post process:- Without Val: all the results found that do not already have HIC Values (calculated at a previous 2d post process of the results with μETA).- Selected: the selected results in the list.- ALL: all the results files that have been found
Select All.
μETA now loads automatically the respective history results for the specified hit points and creates report in both HTML and PPTX format with the 2d plots of the results. The calculated HIC values are written into the target points file MetaList.txt.
BETA CAE Systems S.A. 18
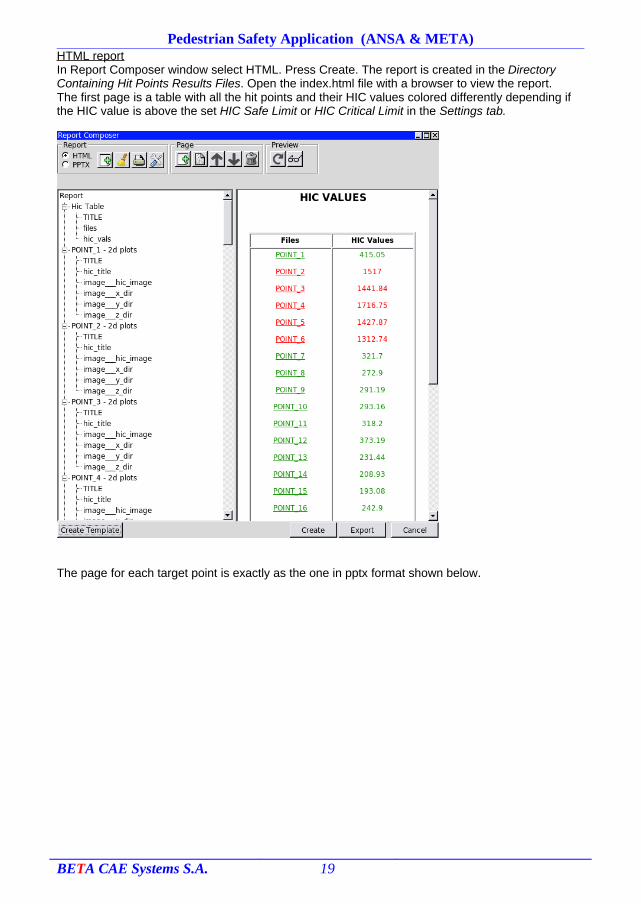
Pedestrian Safety Application (ANSA & META)HTML reportIn Report Composer window select HTML. Press Create. The report is created in the Directory Containing Hit Points Results Files. Open the index.html file with a browser to view the report.The first page is a table with all the hit points and their HIC values colored differently depending if the HIC value is above the set HIC Safe Limit or HIC Critical Limit in the Settings tab.
The page for each target point is exactly as the one in pptx format shown below.
BETA CAE Systems S.A. 19
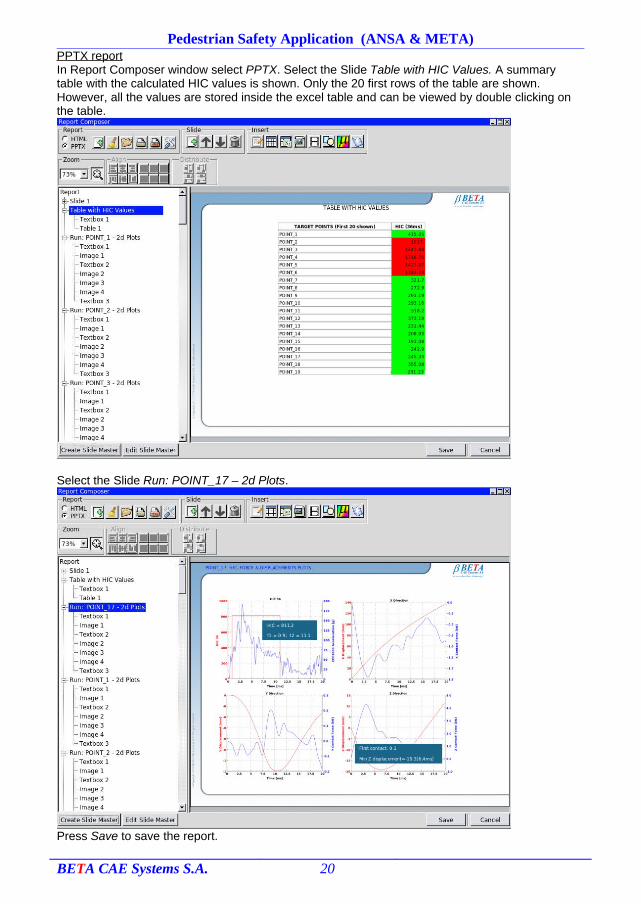
Pedestrian Safety Application (ANSA & META)PPTX reportIn Report Composer window select PPTX. Select the Slide Table with HIC Values. A summary table with the calculated HIC values is shown. Only the 20 first rows of the table are shown. However, all the values are stored inside the excel table and can be viewed by double clicking on the table.
Select the Slide Run: POINT_17 – 2d Plots.
Press Save to save the report.
BETA CAE Systems S.A. 20

Pedestrian Safety Application (ANSA & META)
3.2.2 3d Post Process of Target Points Results
If the 2d Post Process of Target Points Results has not preceded, follow the instructions in the paragraph to fill the fields File Format, Unit System, Target Points file, Directory Containing Target Points Results Files and Directory for Images/Videos/Report.Activate the 3D Post Process of Target Points Results checkbox.
Press … and select the POINT_17.DSY file from the file manager or type the filename and press Enter. The model is loaded. Select Pick Parts, pick with the left mouse button the bonnet Pid and press middle mouse button to confirm.Select NEGATIVE (the car is orientated facing the opposite direction of the global x-axis) and SECTION (SECTION: cut sections of the model on the middle of the head will be shown in the videos – MODEL: the model will be shown in the video clipped by cut planes on the middle of the head) .
Go to Settings tab. In Report type select BOTH.In case the 3d results files have a specific name pattern different than the default ones (PAMCRASH - .DSY, DYNA – d3plot, ABAQUS - .odb, RADIOSS – A001, FEMZIP files - .fz), the name pattern to seach for can be defined in the field File Name to search. For example if the results files are named POINT1.3d_res, POINT2.3d_res, etc define *.3d_res.
In Session for Model/Video Settings a session file can be defined. If the checkbox is activated, this session file will be executed right before the videos for each target point are recorded. So the user can set the colors, drawing styles, visibility of the model by including the respective commands in this session file. An example of such a session file is the file /MetaPost/Settings_sessions/pedestrian_session_for_videos_headform.ses.
Activate the checkbox Session for Slide Settings and choose the file /MetaPost/Settings_sessions/pedestrian_session_for_3d_slide.ses. This session will be executed after the creation of the slide with the videos of displacements for each target point. So, the user can change the size of the videos or move them in the slides by including the respective commands in this session file.
Go back to tab Process Target Points. Press Process 3D.
The interfaces for defining the name and selecting which target points to process appear also here as in the 2d post process. μETA creates automatically a report in both html and pptx format with gif videos showing the deformations around the area of each target point.
BETA CAE Systems S.A. 21
Pedestrian Safety Application (ANSA & META)
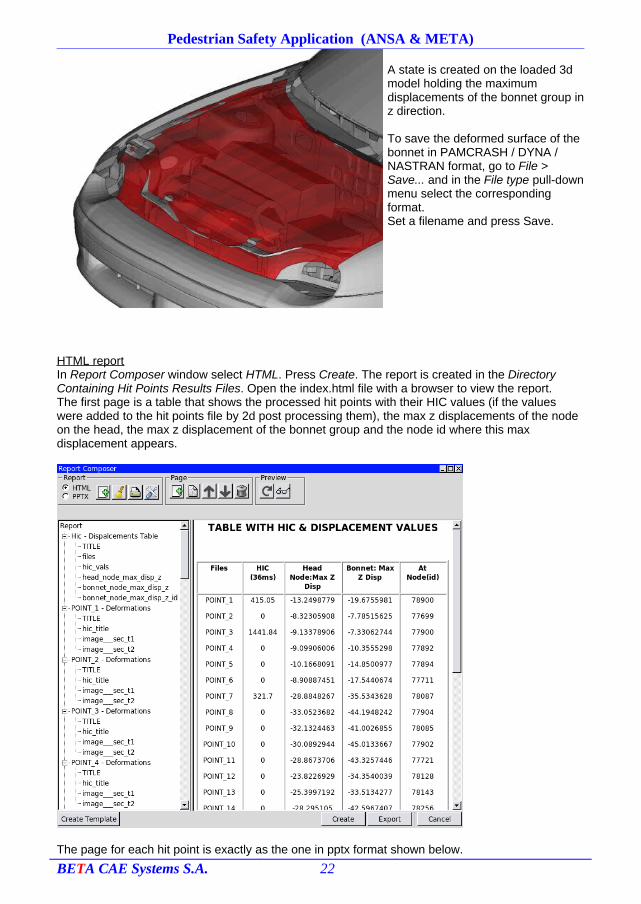
A state is created on the loaded 3d model holding the maximum displacements of the bonnet group in z direction.
To save the deformed surface of the bonnet in PAMCRASH / DYNA / NASTRAN format, go to File > Save... and in the File type pull-down menu select the corresponding format. Set a filename and press Save.
HTML reportIn Report Composer window select HTML. Press Create. The report is created in the Directory Containing Hit Points Results Files. Open the index.html file with a browser to view the report.The first page is a table that shows the processed hit points with their HIC values (if the values were added to the hit points file by 2d post processing them), the max z displacements of the node on the head, the max z displacement of the bonnet group and the node id where this max displacement appears.
The page for each hit point is exactly as the one in pptx format shown below.
BETA CAE Systems S.A. 22

Pedestrian Safety Application (ANSA & META)
PPTX reportIn Report Composer window select PPTX. Select the Slide Run: POINT_17 – Deformations.
3.2.3 Custom Post Process of Target Points Results
The user can either use the standard process of μETA for the 2d and 3d post processing of the results or can set a custom μETA session file to be executed for each result. This means that the post process can be performed once manually, recorded, and then used for the automatic procedure. The user should only pay attention to the μETA variables used in order to pass the input data to and from the session file. An example is the session file /MetaPost/Settings_sessions/pedestrian_custom_post_process.ses included in the package.
BETA CAE Systems S.A. 23

Pedestrian Safety Application (ANSA & META)
3.2.4 Results Overview – No Raster
In Target Points File select /MetaPost/Target_Points_files/ResultsOverview_Headform.txt . In Load bonnet press … and select the /MetaPost/ResultsOverview_bonnet.pc file from the file manager or type the filename and press Enter. The model is loaded. Select Pick Parts, pick with the left mouse button the bonnet Pid and press middle mouse button to confirm.Select No raster.
Press Annotation. ΜETA creates two annotations at the position of each Target Point (according to the coordinates in the target points file). One annotation has the name of the target point. The other annotation is circular and has value based coloring, meaning it is colored according to the HIC value and the defined fringebar. The range of the fringe is defined according to the HIC Safe Limit and HIC Critical Limit in the Settings tab.To show the exact HIC value in the annotations, open Annotations window, go to tab Text and type $val as text of the annotation. Other information (coordinates, name) are also available in the context menu of the annotation's text in Annotations window.
BETA CAE Systems S.A. 24

Pedestrian Safety Application (ANSA & META)In Map Radius set 40 and press Map HIC Values.The values are passed from the target points to the defined group Bonnet in the specified radius. The range of the fringe is defined from the HIC Safe Limit and HIC Critical Limit in the Settings tab.
The view can be easily switched between the one with the annotations and the one with the contour plot on the bonnet through the use of the HIC Contour menu button.To use the new EuroNCAP palette select Fringebar Palette > 6 colors.To define custom range press right mouse button on the palette and select Spacing … . Type the values in the fields and press Enter.
BETA CAE Systems S.A. 25

Pedestrian Safety Application (ANSA & META)
3.2.4 Results Overview – Raster EU Phase 1/2
In case the raster for the EU phase 1 / 2 is available as connected line elements, it is possible to interpolate the HIC values on the bonnet and make calculations on the projected area.
In Results Overview tab select Raster EU phase 1 / 2. If the No Raster option has not preceded, follow the instructions in the paragraph to fill the fields Target Points File, load the model and define the Bonnet group.In Load raster press … and select the /MetaPost/ResultsOverview_EU_phase1_raster.pc file from the file manager or type the filename and press Enter. The model is loaded. In Raster Group select From Visible.
Press Annotations.
μETA creates for each point of the raster, whose information is available in the target points file, two annotations. One annotation has the name of the target point. The other annotation is circular and has value based coloring, meaning it is colored according to the HIC value and the defined fringebar. The range of the fringe is defined according to the HIC Safe Limit and HIC Critical Limit in the Settings tab.
BETA CAE Systems S.A. 26

Pedestrian Safety Application (ANSA & META)Press Interpolate HIC & Project Surface. The following take place:- A new state with the interpolated HIC values is created for the bonnet model. - A group is created for the bonnet model with only the shell elements that have values interpolated.- A new model is created that corresponds to the projected impacted area of the bonnet at z = 0 with the interpolated HIC values.
In Area Model Id set the id of the model that appears in the title for model META projected area.In Threshold Value type 1000 and press Calculate Area.In the message window it is displayed:
---------------------------------------Area Calculation ResultsTotal Visible Area: 658820Area above 1000: 24312.3Area percentage above 1000: 3.69 %
In Area Pcnt type 33 and press Calculate Value.In the message window it is displayed:
---------------------------------------Percentage Calculation ResultsValue for area above 33 % : 298.80
μETA variables are also created with the above values in order to be passed easily into the report.
BETA CAE Systems S.A. 27
Pedestrian Safety Application (ANSA & META)
3.3 Legform Testing
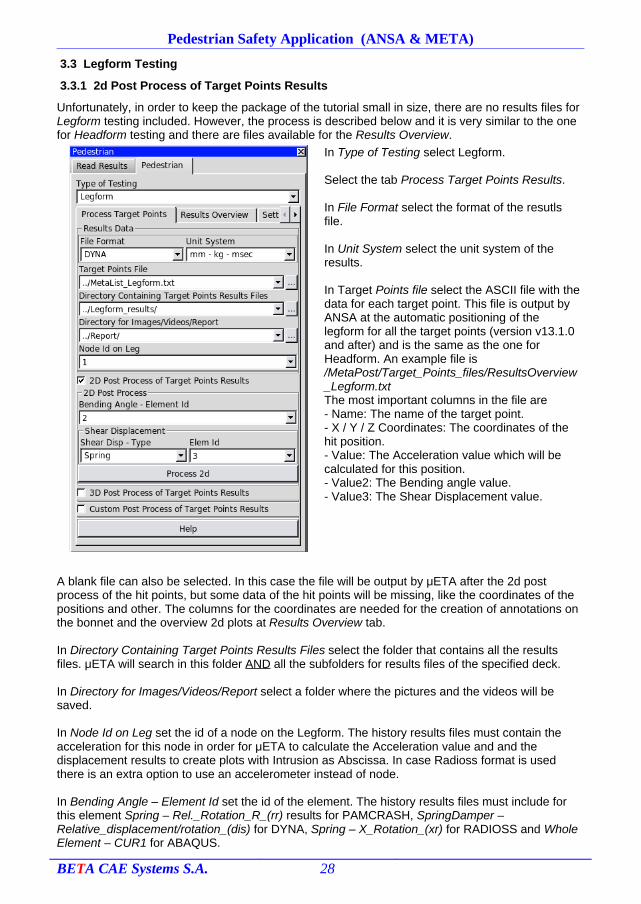
3.3.1 2d Post Process of Target Points Results
Unfortunately, in order to keep the package of the tutorial small in size, there are no results files for Legform testing included. However, the process is described below and it is very similar to the one for Headform testing and there are files available for the Results Overview.
In Type of Testing select Legform.
Select the tab Process Target Points Results.
In File Format select the format of the resutls file.
In Unit System select the unit system of the results.
In Target Points file select the ASCII file with the data for each target point. This file is output by ANSA at the automatic positioning of the legform for all the target points (version v13.1.0 and after) and is the same as the one for Headform. An example file is /MetaPost/Target_Points_files/ResultsOverview_Legform.txt The most important columns in the file are- Name: The name of the target point.- X / Y / Z Coordinates: The coordinates of the hit position.- Value: The Acceleration value which will be calculated for this position.- Value2: The Bending angle value.- Value3: The Shear Displacement value.
A blank file can also be selected. In this case the file will be output by μETA after the 2d post process of the hit points, but some data of the hit points will be missing, like the coordinates of the positions and other. The columns for the coordinates are needed for the creation of annotations on the bonnet and the overview 2d plots at Results Overview tab.
In Directory Containing Target Points Results Files select the folder that contains all the results files. μETA will search in this folder AND all the subfolders for results files of the specified deck.
In Directory for Images/Videos/Report select a folder where the pictures and the videos will be saved.
In Node Id on Leg set the id of a node on the Legform. The history results files must contain the acceleration for this node in order for μETA to calculate the Acceleration value and and the displacement results to create plots with Intrusion as Abscissa. In case Radioss format is used there is an extra option to use an accelerometer instead of node.
In Bending Angle – Element Id set the id of the element. The history results files must include for this element Spring – Rel._Rotation_R_(rr) results for PAMCRASH, SpringDamper – Relative_displacement/rotation_(dis) for DYNA, Spring – X_Rotation_(xr) for RADIOSS and Whole Element – CUR1 for ABAQUS.
BETA CAE Systems S.A. 28

Pedestrian Safety Application (ANSA & META)
In Shear Displacement select Spring if the displacement is output as element result (Spring – Rel._Displacement_R_(dr) for PAMCRASH, SpringDamper – Relative_displacement/rotation_(dis) for DYNA, Spring – X_elongation_(xl) for RADIOSS and Whole Element – CU1 for ABAQUS ) or Node if it shall be calculated as the x displacements difference of two nodes. Fill the element – node ids.
Go to Settings tab. Here are some optional settings that can be defined. Only PPTX Report type is available.The limits for the values can be changed. These values are used in the summary table in the created report, so that each result is colored according to the HIC value.
In Session for 2d plots Settings a session file can be defined. If the checkbox is activated, this session file will be executed after the 2d plots for each target point are created. So the user can apply some settings for the 2d plots by including the respective commands in this session file.
Activate the checkbox Session for Slide Settings and choose a session file. This session will be executed after the creation of the slide with the images of the 2d plots for each target point. So, the user can change the size of the images or move them in the slides by including the respective commands in this session file. An example of such a session file is /MetaPost/Settings_sessions/pedestrian_session_for_2d_slide_legform.ses
By default all the created windows with the 2d plots are deleted automatically after the creation of the report slides. There is the option to keep the windows by activating the flag Do not delete windows. However, this might result to the creation of a large number of windows, so it is advised not to be used unless there is a reason (e.g. to create the session for the 2d plots settings).
A report with a master slide to be used can be opened prior to the execution of the 2d /3d post process (see also Headform testing).
Go back to tab Process Target Points. Press the Process 2d.
The windows Define Target Point Name from the folders names and Choose the Target Points Results to Process appear as in Headform testing to set how the name of each hit point analysis is defined from the names of the folders and the name of the results file found and to choose the target points to process.
μETA loads automatically the respective history results for the specified hit points and creates report in PPTX format with the 2d plots of the results. The calculated HIC values are written into the target points file MetaList_Legform.txt.
BETA CAE Systems S.A. 29
Pedestrian Safety Application (ANSA & META)
3.3.2 3d Post Process of Target Points Results
The 3d post process is similar to Headform testing.
3.3.3 Custom Post Process of Target Points Results
The user can either use the standard process of μETA for the 2d and 3d post processing of the results or can set a custom μETA session file to be executed for each result. This means that the post process can be performed once manually, recorded, and then used for the automatic procedure. The user should only pay attention to the μETA variables used in order to pass the input data to and from the session file. A similar example file is provided for the headform testing.
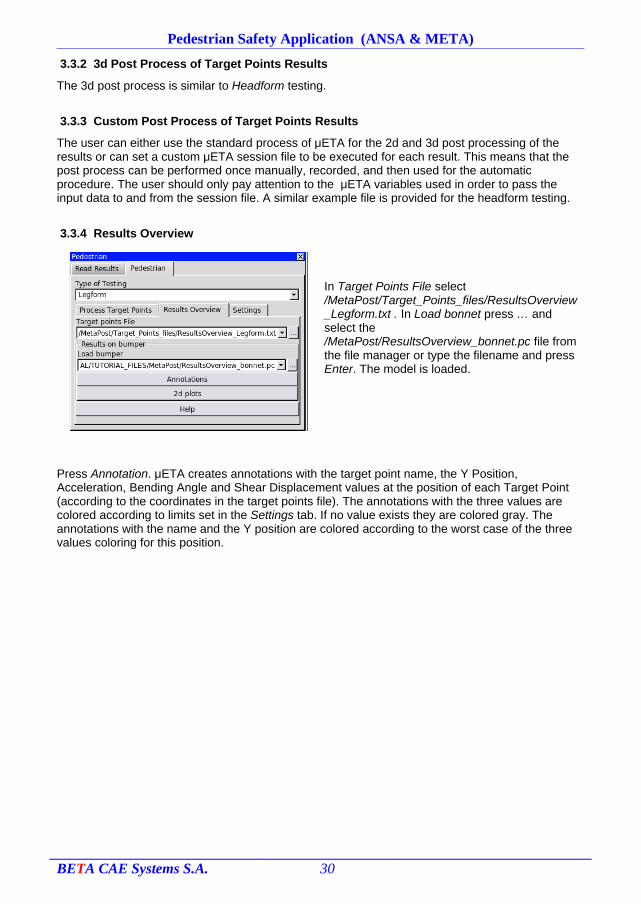
3.3.4 Results Overview
In Target Points File select /MetaPost/Target_Points_files/ResultsOverview_Legform.txt . In Load bonnet press … and select the /MetaPost/ResultsOverview_bonnet.pc file from the file manager or type the filename and press Enter. The model is loaded.
Press Annotation. μETA creates annotations with the target point name, the Y Position, Acceleration, Bending Angle and Shear Displacement values at the position of each Target Point (according to the coordinates in the target points file). The annotations with the three values are colored according to limits set in the Settings tab. If no value exists they are colored gray. The annotations with the name and the Y position are colored according to the worst case of the three values coloring for this position.
BETA CAE Systems S.A. 30

Pedestrian Safety Application (ANSA & META)
Press 2d Plots. ΜETA creates 2d plots for the Acceleration, Bending Angle and Shear Displacement values with the Y coordinate as abscissa.
BETA CAE Systems S.A. 31

Pedestrian Safety Application (ANSA & META)
3.4 Upperl leg Testing
3.4.1 2d Post Process of Target Points Results
Unfortunately, in order to keep the package of the tutorial small in size, there are no results files for Upperleg testing included. However, the process is described below and it is very similar to the one for Headform testing and there are files available for the Results Overview.
In Type of Testing select Upper leg.
Select the tab Process Target Points Results.
In File Format select the format of the resutls file.
In Unit System select the unit system of the results.
In Target Points file select the ASCII file with the data for each target point. This file is output by ANSA at the automatic positioning of the legform for all the target points (version v13.1.0 and after) and is the same as the one for Headform. An example file is /MetaPost/Target_Points_files/ResultsOverview_Legform.txt The most important columns in the file are- Name: The name of the target point.- X / Y / Z Coordinates: The coordinates of the hit position.- Value: The total force.- Value2: The upper force.- Value3: The lower force.- Value4: The upper momentt.- Value5: The middle moment.- Value6: The lower moment.
A blank file can also be selected. In this case the file will be output by μETA after the 2d post process of the hit points, but some data of the hit points will be missing, like the coordinates of the positions and other. The columns for the coordinates are needed for the creation of annotations on the bonnet and the overview 2d plots at Results Overview tab.
In Directory Containing Target Points Results Files select the folder that contains all the results files. μETA will search in this folder AND all the subfolders for results files of the specified deck.
In Directory for Images/Videos/Report select a folder where the pictures and the videos will be saved.
In Node Id on Leg set the id of a node on the Legform. If the history results files contain the displacement results μETA will create plots with Intrusion as Abscissa. In case Radioss format is used there is an extra option to use an accelerometer instead of node.
In Beam Id (Upper) / Beam Id Lower set the id of the beam elements used to measure the forces on the upper leg. The history results files must include results for these element s (Beams– Axial Force_(af) results for PAMCRASH, Beams – Axial_Force_Resultant_(afr) for DYNA, Beam – Normal_Force_in_direction_1_(f1) for RADIOSS and Whole Element – CTF1 for ABAQUS).
BETA CAE Systems S.A. 32

Pedestrian Safety Application (ANSA & META)In Moment Section Ids set the ids of the sections. The history results files must include results for these sections.
Go to Settings tab. Here are some optional settings that can be defined. Only PPTX Report type is available.The limits for the values can be changed. These values are used in the summary table in the created report, so that each result is colored according to the HIC value.
In Session for 2d plots Settings a session file can be defined. If the checkbox is activated, this session file will be executed after the 2d plots for each target point are created. So the user can apply some settings for the 2d plots by including the respective commands in this session file.
Activate the checkbox Session for Slide Settings and choose a session file. This session will be executed after the creation of the slide with the images of the 2d plots for each target point. So, the user can change the size of the images or move them in the slides by including the respective commands in this session file. An example of such a session file is /MetaPost/Settings_sessions/pedestrian_session_for_2d_slide_upperleg.ses
By default all the created windows with the 2d plots are deleted automatically after the creation of the report slides. There is the option to keep the windows by activating the flag Do not delete windows. However, this might result to the creation of a large number of windows, so it is advised not to be used unless there is a reason (e.g. to create the session for the 2d plots settings).
A report with a master slide to be used can be opened prior to the execution of the 2d /3d post process (see also Headform testing).
Go back to tab Process Target Points. Press the Process 2d.
The windows Define Target Point Name from the folders names and Choose the Target Points Results to Process appear as in Headform testing to set how the name of each hit point analysis is defined from the names of the folders and the name of the results file found and to choose the target points to process.
μETA loads automatically the respective history results for the specified hit points and creates report in PPTX format with the 2d plots of the results. The calculated HIC values are written into the target points file MetaList_Upperleg.txt.
BETA CAE Systems S.A. 33
Pedestrian Safety Application (ANSA & META)
3.4.2 3d Post Process of Target Points Results
The 3d post process is similar to Headform testing.
3.4.3 Custom Post Process of Target Points Results
The user can either use the standard process of μETA for the 2d and 3d post processing of the results or can set a custom μETA session file to be executed for each result. This means that the post process can be performed once manually, recorded, and then used for the automatic procedure. The user should only pay attention to the μETA variables used in order to pass the input data to and from the session file. A similar example file is provided for the headform testing.
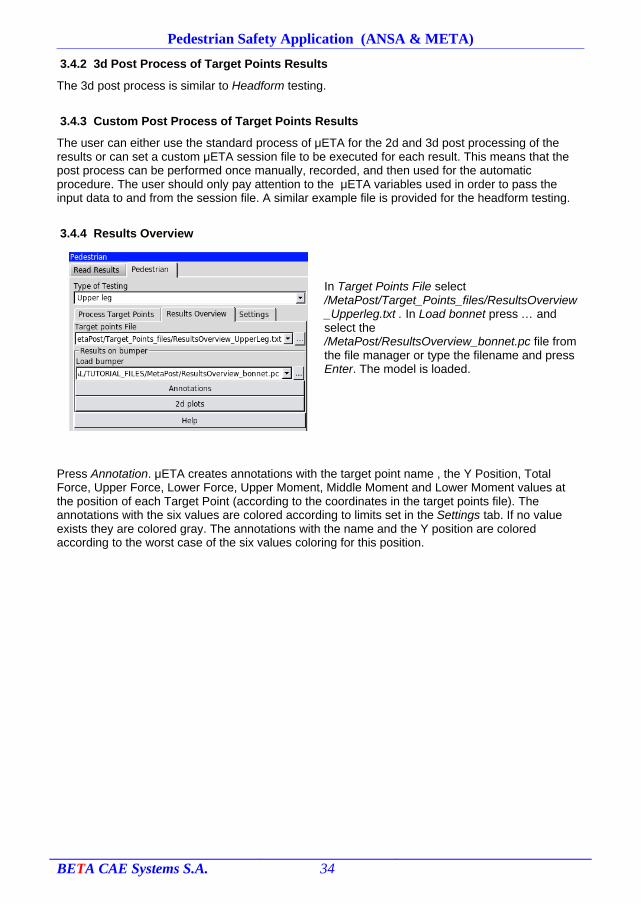
3.4.4 Results Overview
In Target Points File select /MetaPost/Target_Points_files/ResultsOverview_Upperleg.txt . In Load bonnet press … and select the /MetaPost/ResultsOverview_bonnet.pc file from the file manager or type the filename and press Enter. The model is loaded.
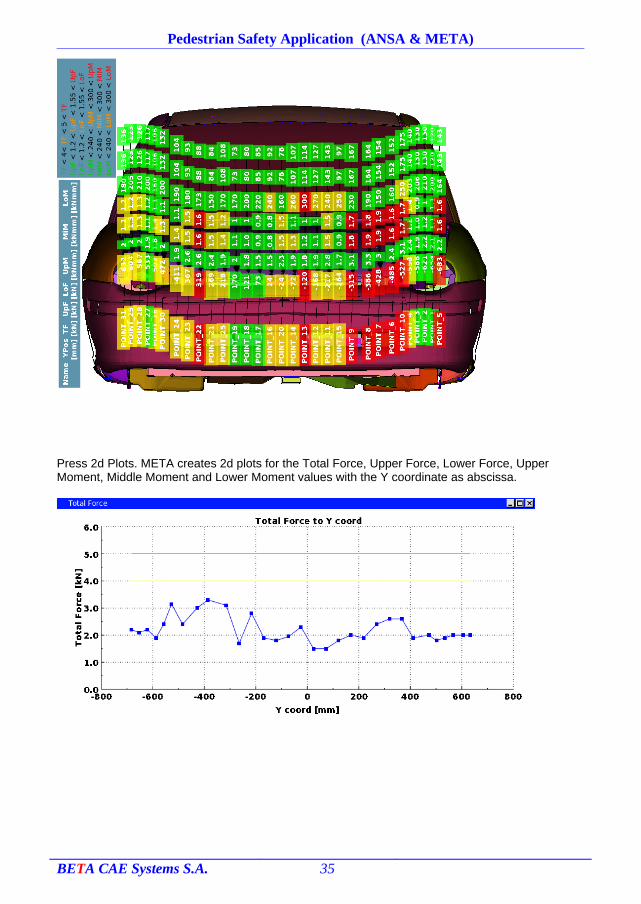
Press Annotation. μETA creates annotations with the target point name , the Y Position, Total Force, Upper Force, Lower Force, Upper Moment, Middle Moment and Lower Moment values at the position of each Target Point (according to the coordinates in the target points file). The annotations with the six values are colored according to limits set in the Settings tab. If no value exists they are colored gray. The annotations with the name and the Y position are colored according to the worst case of the six values coloring for this position.
BETA CAE Systems S.A. 34
Pedestrian Safety Application (ANSA & META)
Press 2d Plots. ΜETA creates 2d plots for the Total Force, Upper Force, Lower Force, Upper Moment, Middle Moment and Lower Moment values with the Y coordinate as abscissa.
BETA CAE Systems S.A. 35


