Modified Centroid for Estimating Sand, Silt, and Clay from Soil Texture Class
Pedology
Models that require inputs of soil texture are often limited by the availability of soil information. While texture class is easier to obtain than particle size, texture classes do not represent the continuum of soil size fractions. Soil tex-ture class and clay percentage are collected as a standard practice for many land management agencies (e.g., NRCS, BLM, FAO) and clay content is fre-quently estimated with acceptable accuracy (±5%). When clay and texture class is known, sand and silt can be constrained to a narrow range that may differ from the geometric centroid of a given texture class (gcent). I tested the concept of a modified centroid approach (mcent) using 75,736 soil samples from the National Cooperative Soil Survey pedon database that also had mea-sured hydraulic soil properties. Comparisons were made using the Rosetta pedotransfer function (PTF) to test modeled values from gcent, mcent, and measured data in comparison with measured values of water content at field capacity (q330) and wilting point (q15000). The mcent approach produced a continuous distribution of values for sand and silt whereas gcent produced a stair-step pattern for each of the 12 texture classes. Rosetta underestimat-ed water content. Error metrics were similar when all texture classes were combined, but differences between models emerged when individual texture classes were compared. Results support the practice of collecting field esti-mates of clay percentage along with texture class to expand the use of soil profile data for both spatial and non-spatial modeling of soil processes that will advance our understanding of soil contributions to ecosystem function.
Abbreviations: AWC, available water holding capacity; DSM, digital soil mapping; gcent, geometric centroid approach for estimating sand, silt and clay fractions; H3m, modified H3 model; mcent, modified centroid approach for estimating sand, silt and clay fractions; PTF, pedotransfer function.
Field estimates of soil texture class are collected as a standard practice for natural resource assessments across the globe where some variation of the texture-by-feel method (Thien, 1979) is used to obtain soil texture class
(FAO, 2006; Soil Survey Staff, 1993; Soil Survey Staff, 2012). Soil texture classes provide valuable information for many applications in soil science and other dis-ciplines (e.g., soil survey, ecosystem models, land surface models, climate models); however, for many applications, values of sand, silt, and clay are preferable due to limitations of soil texture class information resulting from wide ranges of sand, silt, and clay within each class. Many agencies also collect estimates of sand or clay to better quantify soil texture properties. For example, soil texture class and percent-age of clay is collected for all soil profile descriptions as part of the Bureau of Land Management Assessment, Inventory and Monitoring program (AIM) and the NRCS National Resources Inventory (Herrick et al., 2017) and is recommended by the FAO (FAO, 2006). The NRCS strongly encourages the estimation of both clay and sand for field descriptions (S. Wills and N. Starman, personal communica-tion, 2017). These field estimates are very important for conducting soil surveys,
Matthew R. Levi*USDA-ARS Jornada Experimental Range MSC 3JER Box 30003 New Mexico State University Las Cruces, NM 88003
Core Ideas
•Knowledge of texture class and clay enables continuous estimates of sand and silt.
•Rosetta under predicted water retention compared with measured values.
•Rosetta performance differed by soil texture class.
•Rosetta estimates were similar for modified centroid and measured particle size.
Published online June 30, 2017
www.soils.org/publications/sssaj 579
Pedology
especially in parts of the world where soil inventories are limited. Estimates of sand, silt, or clay from readily collected field mea-surement offer a practical solution for filling this much-needed knowledge gap and advancing efforts to parameterize process-based models that require soil information.
There is a long history of using ternary diagrams to organize and visualize soil texture classes for land management (Whitney, 1911). Sand, silt, and clay are the three elements comprising the triangle although definitions of these particles vary for different classification systems (Minasny and McBratney, 2001; Nemes et al., 1999). There have been efforts to convert from one system to another using particle-size distribution models (Minasny and McBratney, 2001; Shirazi et al., 2001; Wei et al., 2014); however, sand, silt, and clay are often the preferred variables for quantita-tive representation of soil texture for modeling (Sanchez et al., 2009; Schaap et al., 2004). For example, Gutmann and Small (2005) found that soil texture class (i.e., 12 USDA texture class-es) only explained 5 to 15% of the variance in latent and sensible heat flux modeled with the Noah land surface model whereas us-ing particle-size fractions explained up to 30% of the variance. Similar results from Gutmann and Small (2007) showed that particle-size fractions explained 20% of the variance in latent heat flux compared with only 5% explained with soil texture class for Noah models.
The accuracy of field-based estimates of soil texture is of-ten similar to laboratory measurements which can significantly reduce costs associated with laboratory measurements. Vos et al. (2016) suggested that field-based estimates of soil texture may be able to replace laboratory analyses; however, they assigned sam-ples to 37 predefined texture classes and compared the mean val-ues of sand, silt, and clay from each class to measured values. Clay can be estimated with greater accuracy than sand or silt with ab-solute differences between measured values and estimates often <5% (Post et al., 1986; Vos et al., 2016). Post et al. (1986) found strong correlations between measured and estimated values of sand, (r = 0.88), silt (r = 0.78), and clay (r = 0.86) for 25 Arizona soil samples by 36 soil scientists. Hodgson et al. (1976) reported 75 and 85% of the variation in laboratory measured values of silt and clay, respectively, were captured with field estimates for 184 soils in England. Interestingly, estimates of texture class have been less accurate with only 50% of 598 samples in Maryland being correctly assigned (Foss et al., 1975) and 46% for some Arizona soils (Post et al., 1986), which reflects the necessity for quantifying sand, silt, and clay. Experience is an important factor that contributes to the accuracy of hand estimates of soil texture, but accuracy and precision can be improved with practice and the help of quantitative assessments of performance (Franzmeier and Owens, 2008).
Soil particle-size distribution is influenced by several ce-menting agents including organic matter, iron oxides, carbon-ates, gypsum, silica, etc. ( Jackson, 2005). Field estimates gener-ally do not have any pretreatments to remove these components, whereas, laboratory measurements often remove some or all of these. Consequently, relationships between field texture and
particle-size distribution have been questioned (Marshall, 2003). Despite these potential limitations, reasonably accurate predic-tions of soil texture properties can be obtained from field esti-mates and the added information could greatly improve global soil inventories over simply reporting texture class.
One application of field-estimated soil texture is digital soil mapping (DSM). Digital soil mapping encompasses prediction models that use spatial modeling and environmental covariate data to predict a wide range of soil properties (McBratney et al., 2003; Scull et al., 2003). Continuous soil properties are often the goal of DSM efforts (Sanchez et al., 2009), but available data may not reflect measured or estimated values of sand, silt, or clay. Legacy soil survey data is frequently used for DSM projects (Bishop et al., 2015; Chaney et al., 2016; Odgers et al., 2015). If soil texture class and estimates of clay are available, then realis-tic estimates of sand and silt can be obtained which could sub-sequently be utilized to develop continuous soil property maps instead of categorical soil texture class maps.
A second area of soil research that can benefit from quantita-tive field estimates of sand, silt, and clay is the development and use of PTFs and more generally parameter estimation routines. This family of models is used to predict properties we need from prop-erties that we either already have or properties that are relatively easy to measure (Vereecken et al., 2010; Wösten et al., 2001). Soil hydraulic parameters such as water retention and hydraulic con-ductivity are commonly predicted using PTFs because they are difficult to measure (Schaap et al., 2001, 2004; Vereecken et al., 2010), but PTFs are also important for predicting a range of other chemical and physical soil properties (McBratney et al., 2002) and filling gaps in soil databases (Sequeira et al., 2014). Pedotransfer functions are an important tool for modeling ecosystem process-es influenced by land surface properties (Pachepsky et al., 2015; Vereecken et al., 2016). The availability of input parameters largely determines the type of PTF that can be applied. Common inputs for these models include soil texture class, sand, silt, clay, bulk den-sity, and organic matter (Nemes et al., 2006a; Schaap et al., 2001; Vereecken et al., 2010).
The objective of this study was to evaluate the performance of a mcent for estimating sand and silt when soil texture class and percentage of clay are known compared with using sand, silt, and clay for the gcent of a texture class. More specifically I wanted to compare estimated values of sand, silt, and clay from the two centroid approaches to laboratory measured values by (i) fitting linear models and (ii) applying the data to the Rosetta PTF to compare measured water retention to modeled values. I hypoth-esized that mcent would more closely approximate laboratory measured values of sand, silt, and clay compared with the gcent. Much like PTFs provide estimates of hard-to-measure hydrau-lic soil properties from those easier to obtain, the intent of this study was to obtain sand and silt estimates from soil texture class and clay estimates that are much easier and more frequently col-lected in the field.
580 Soil Science Society of America Journal
MATERIALS AND METHODSDataset
Laboratory data for 418,661 individual soil horizons representing over 21,000 pedons were obtained from the National Cooperative Soil Survey Characterization Database in the form of a Microsoft Access database (http://ncsslabdatamart.sc.egov.usda.gov/, accessed 7 Jul. 2016). Many of the soil horizons had less-than-complete characterization data because they were analyzed for a variety of different projects with differ-ent goals. Soils were processed and analyzed accord-ing to soil survey standards (Soil Survey Staff, 2014) and more information regarding the processing and use of these data can be found in Soil Survey Staff (2011). Reported gravimetric water content at 330 and 15,000 cm measured on undisturbed clods and air-dry sieved samples, respectively, using pressure plates were converted to volumetric water content by multiplying gravimetric values by bulk density at 330-cm pressure.
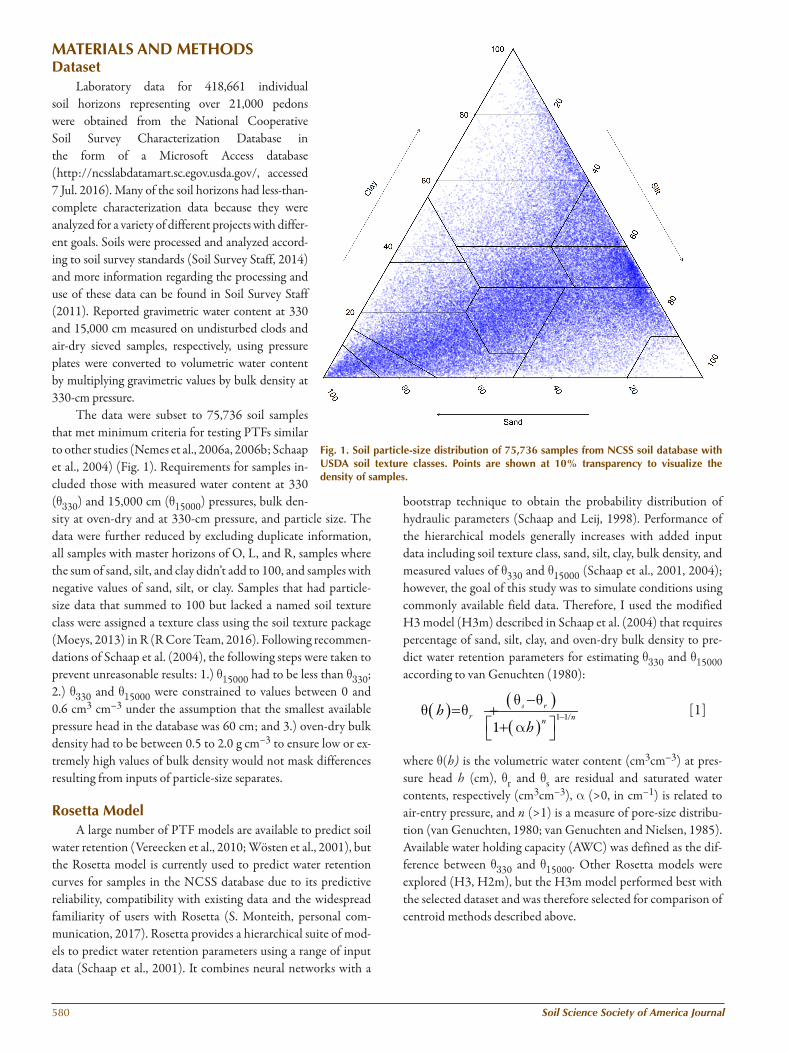
The data were subset to 75,736 soil samples that met minimum criteria for testing PTFs similar to other studies (Nemes et al., 2006a, 2006b; Schaap et al., 2004) (Fig. 1). Requirements for samples in-cluded those with measured water content at 330 (q330) and 15,000 cm (q15000) pressures, bulk den-sity at oven-dry and at 330-cm pressure, and particle size. The data were further reduced by excluding duplicate information, all samples with master horizons of O, L, and R, samples where the sum of sand, silt, and clay didn’t add to 100, and samples with negative values of sand, silt, or clay. Samples that had particle-size data that summed to 100 but lacked a named soil texture class were assigned a texture class using the soil texture package (Moeys, 2013) in R (R Core Team, 2016). Following recommen-dations of Schaap et al. (2004), the following steps were taken to prevent unreasonable results: 1.) q15000 had to be less than q330; 2.) q330 and q15000 were constrained to values between 0 and 0.6 cm3 cm–3 under the assumption that the smallest available pressure head in the database was 60 cm; and 3.) oven-dry bulk density had to be between 0.5 to 2.0 g cm–3 to ensure low or ex-tremely high values of bulk density would not mask differences resulting from inputs of particle-size separates.
Rosetta ModelA large number of PTF models are available to predict soil
water retention (Vereecken et al., 2010; Wösten et al., 2001), but the Rosetta model is currently used to predict water retention curves for samples in the NCSS database due to its predictive reliability, compatibility with existing data and the widespread familiarity of users with Rosetta (S. Monteith, personal com-munication, 2017). Rosetta provides a hierarchical suite of mod-els to predict water retention parameters using a range of input data (Schaap et al., 2001). It combines neural networks with a
bootstrap technique to obtain the probability distribution of hydraulic parameters (Schaap and Leij, 1998). Performance of the hierarchical models generally increases with added input data including soil texture class, sand, silt, clay, bulk density, and measured values of q330 and q15000 (Schaap et al., 2001, 2004); however, the goal of this study was to simulate conditions using commonly available field data. Therefore, I used the modified H3 model (H3m) described in Schaap et al. (2004) that requires percentage of sand, silt, clay, and oven-dry bulk density to pre-dict water retention parameters for estimating q330 and q15000 according to van Genuchten (1980):
( ) ( )( )
1 1/1
s rr nn
hh
q qq q
a−
−= +
+
[1]
where q(h) is the volumetric water content (cm3cm–3) at pres-sure head h (cm), qr and qs are residual and saturated water contents, respectively (cm3cm–3), a (>0, in cm–1) is related to air-entry pressure, and n (>1) is a measure of pore-size distribu-tion (van Genuchten, 1980; van Genuchten and Nielsen, 1985). Available water holding capacity (AWC) was defined as the dif-ference between q330 and q15000. Other Rosetta models were explored (H3, H2m), but the H3m model performed best with the selected dataset and was therefore selected for comparison of centroid methods described above.
Fig. 1. Soil particle-size distribution of 75,736 samples from NCSS soil database with USDA soil texture classes. Points are shown at 10% transparency to visualize the density of samples.
www.soils.org/publications/sssaj 581
Sand, Silt, and Clay EstimatesValues of sand, silt, and clay were generated in three different
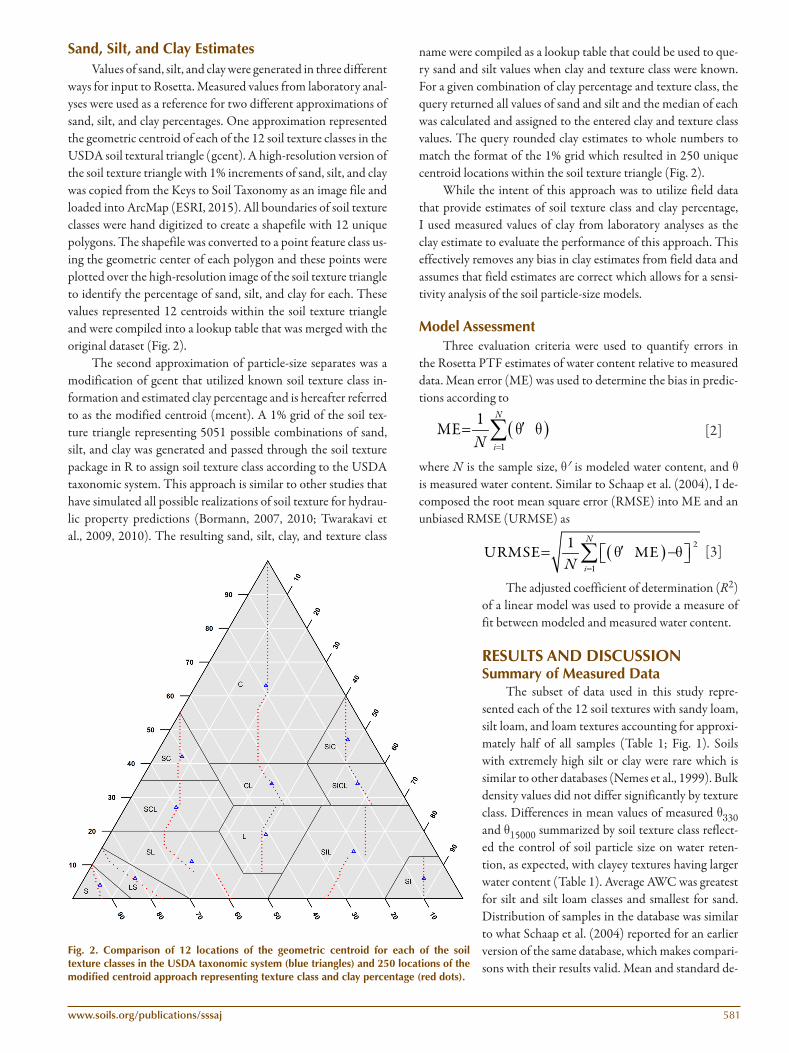
ways for input to Rosetta. Measured values from laboratory anal-yses were used as a reference for two different approximations of sand, silt, and clay percentages. One approximation represented the geometric centroid of each of the 12 soil texture classes in the USDA soil textural triangle (gcent). A high-resolution version of the soil texture triangle with 1% increments of sand, silt, and clay was copied from the Keys to Soil Taxonomy as an image file and loaded into ArcMap (ESRI, 2015). All boundaries of soil texture classes were hand digitized to create a shapefile with 12 unique polygons. The shapefile was converted to a point feature class us-ing the geometric center of each polygon and these points were plotted over the high-resolution image of the soil texture triangle to identify the percentage of sand, silt, and clay for each. These values represented 12 centroids within the soil texture triangle and were compiled into a lookup table that was merged with the original dataset (Fig. 2).
The second approximation of particle-size separates was a modification of gcent that utilized known soil texture class in-formation and estimated clay percentage and is hereafter referred to as the modified centroid (mcent). A 1% grid of the soil tex-ture triangle representing 5051 possible combinations of sand, silt, and clay was generated and passed through the soil texture package in R to assign soil texture class according to the USDA taxonomic system. This approach is similar to other studies that have simulated all possible realizations of soil texture for hydrau-lic property predictions (Bormann, 2007, 2010; Twarakavi et al., 2009, 2010). The resulting sand, silt, clay, and texture class
name were compiled as a lookup table that could be used to que-ry sand and silt values when clay and texture class were known. For a given combination of clay percentage and texture class, the query returned all values of sand and silt and the median of each was calculated and assigned to the entered clay and texture class values. The query rounded clay estimates to whole numbers to match the format of the 1% grid which resulted in 250 unique centroid locations within the soil texture triangle (Fig. 2).
While the intent of this approach was to utilize field data that provide estimates of soil texture class and clay percentage, I used measured values of clay from laboratory analyses as the clay estimate to evaluate the performance of this approach. This effectively removes any bias in clay estimates from field data and assumes that field estimates are correct which allows for a sensi-tivity analysis of the soil particle-size models.
Model AssessmentThree evaluation criteria were used to quantify errors in
the Rosetta PTF estimates of water content relative to measured data. Mean error (ME) was used to determine the bias in predic-tions according to
( )1
1ME
N
iNq q
=
′= −∑ [2]
where N is the sample size, q¢ is modeled water content, and q is measured water content. Similar to Schaap et al. (2004), I de-composed the root mean square error (RMSE) into ME and an unbiased RMSE (URMSE) as
( ) 2
1
1URMSE ME
N
iNq q
=
′= − − ∑ [3]
The adjusted coefficient of determination (R2) of a linear model was used to provide a measure of fit between modeled and measured water content.
RESULTS AND DISCUSSIONSummary of Measured Data
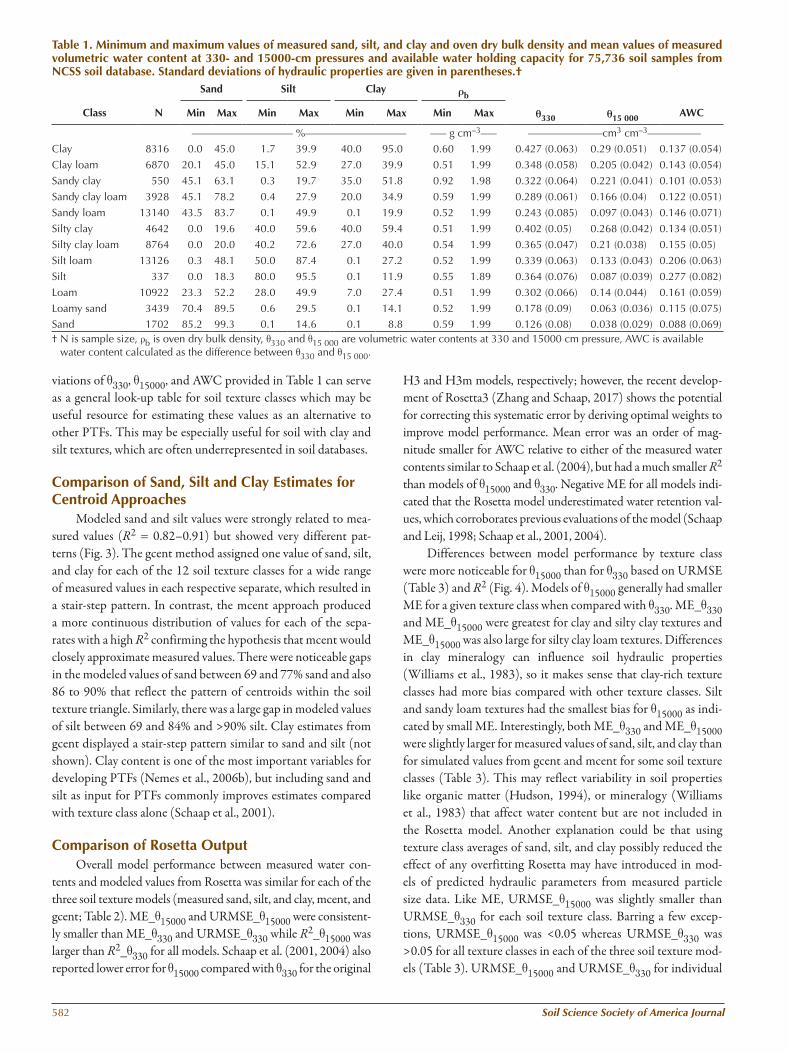
The subset of data used in this study repre-sented each of the 12 soil textures with sandy loam, silt loam, and loam textures accounting for approxi-mately half of all samples (Table 1; Fig. 1). Soils with extremely high silt or clay were rare which is similar to other databases (Nemes et al., 1999). Bulk density values did not differ significantly by texture class. Differences in mean values of measured q330 and q15000 summarized by soil texture class reflect-ed the control of soil particle size on water reten-tion, as expected, with clayey textures having larger water content (Table 1). Average AWC was greatest for silt and silt loam classes and smallest for sand. Distribution of samples in the database was similar to what Schaap et al. (2004) reported for an earlier version of the same database, which makes compari-sons with their results valid. Mean and standard de-
Fig. 2. Comparison of 12 locations of the geometric centroid for each of the soil texture classes in the USDA taxonomic system (blue triangles) and 250 locations of the modified centroid approach representing texture class and clay percentage (red dots).
582 Soil Science Society of America Journal
viations of q330, q15000, and AWC provided in Table 1 can serve as a general look-up table for soil texture classes which may be useful resource for estimating these values as an alternative to other PTFs. This may be especially useful for soil with clay and silt textures, which are often underrepresented in soil databases.
Comparison of Sand, Silt and Clay Estimates for Centroid Approaches
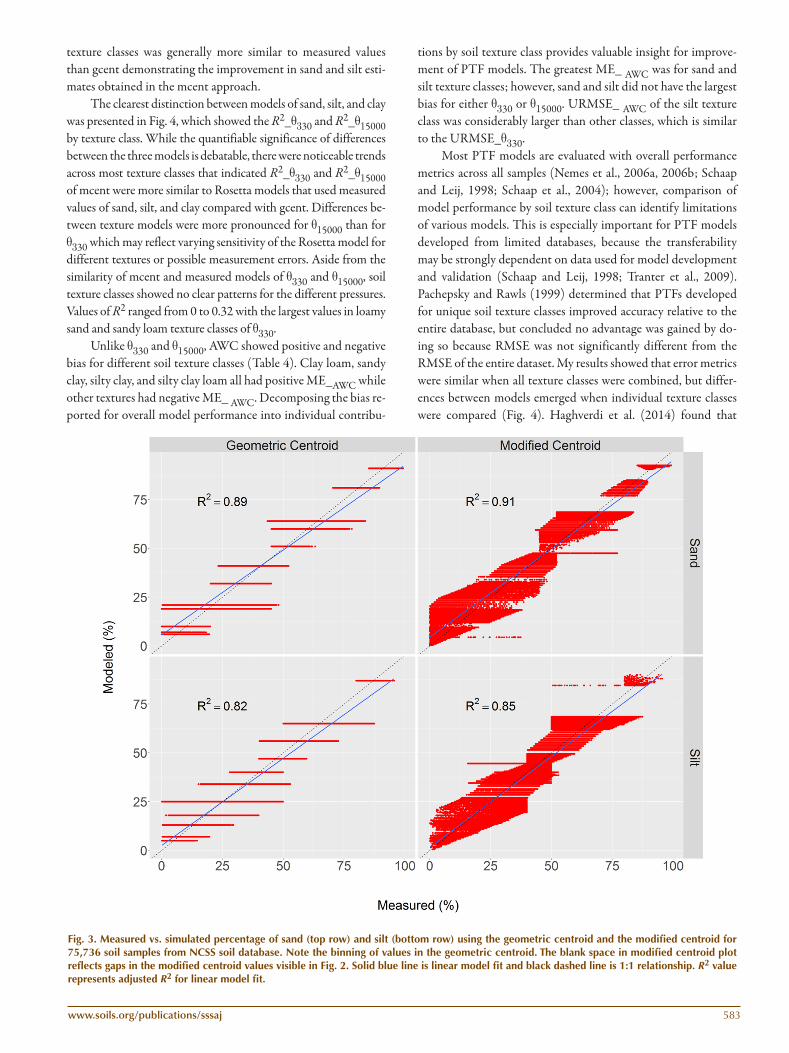
Modeled sand and silt values were strongly related to mea-sured values (R2 = 0.82–0.91) but showed very different pat-terns (Fig. 3). The gcent method assigned one value of sand, silt, and clay for each of the 12 soil texture classes for a wide range of measured values in each respective separate, which resulted in a stair-step pattern. In contrast, the mcent approach produced a more continuous distribution of values for each of the sepa-rates with a high R2 confirming the hypothesis that mcent would closely approximate measured values. There were noticeable gaps in the modeled values of sand between 69 and 77% sand and also 86 to 90% that reflect the pattern of centroids within the soil texture triangle. Similarly, there was a large gap in modeled values of silt between 69 and 84% and >90% silt. Clay estimates from gcent displayed a stair-step pattern similar to sand and silt (not shown). Clay content is one of the most important variables for developing PTFs (Nemes et al., 2006b), but including sand and silt as input for PTFs commonly improves estimates compared with texture class alone (Schaap et al., 2001).
Comparison of Rosetta OutputOverall model performance between measured water con-
tents and modeled values from Rosetta was similar for each of the three soil texture models (measured sand, silt, and clay, mcent, and gcent; Table 2). ME_q15000 and URMSE_q15000 were consistent-ly smaller than ME_q330 and URMSE_q330 while R2_q15000 was larger than R2_q330 for all models. Schaap et al. (2001, 2004) also reported lower error for q15000 compared with q330 for the original
H3 and H3m models, respectively; however, the recent develop-ment of Rosetta3 (Zhang and Schaap, 2017) shows the potential for correcting this systematic error by deriving optimal weights to improve model performance. Mean error was an order of mag-nitude smaller for AWC relative to either of the measured water contents similar to Schaap et al. (2004), but had a much smaller R2 than models of q15000 and q330. Negative ME for all models indi-cated that the Rosetta model underestimated water retention val-ues, which corroborates previous evaluations of the model (Schaap and Leij, 1998; Schaap et al., 2001, 2004).
Differences between model performance by texture class were more noticeable for q15000 than for q330 based on URMSE (Table 3) and R2 (Fig. 4). Models of q15000 generally had smaller ME for a given texture class when compared with q330. ME_q330 and ME_q15000 were greatest for clay and silty clay textures and ME_q15000 was also large for silty clay loam textures. Differences in clay mineralogy can influence soil hydraulic properties (Williams et al., 1983), so it makes sense that clay-rich texture classes had more bias compared with other texture classes. Silt and sandy loam textures had the smallest bias for q15000 as indi-cated by small ME. Interestingly, both ME_q330 and ME_q15000 were slightly larger for measured values of sand, silt, and clay than for simulated values from gcent and mcent for some soil texture classes (Table 3). This may reflect variability in soil properties like organic matter (Hudson, 1994), or mineralogy (Williams et al., 1983) that affect water content but are not included in the Rosetta model. Another explanation could be that using texture class averages of sand, silt, and clay possibly reduced the effect of any overfitting Rosetta may have introduced in mod-els of predicted hydraulic parameters from measured particle size data. Like ME, URMSE_q15000 was slightly smaller than URMSE_q330 for each soil texture class. Barring a few excep-tions, URMSE_q15000 was <0.05 whereas URMSE_q330 was >0.05 for all texture classes in each of the three soil texture mod-els (Table 3). URMSE_q15000 and URMSE_q330 for individual
Table 1. Minimum and maximum values of measured sand, silt, and clay and oven dry bulk density and mean values of measured volumetric water content at 330- and 15000-cm pressures and available water holding capacity for 75,736 soil samples from NCSS soil database. Standard deviations of hydraulic properties are given in parentheses.†
Sand Silt Clay rb
Class N Min Max Min Max Min Max Min Max q330 q15 000 AWC
Loamy sand 3439 70.4 89.5 0.6 29.5 0.1 14.1 0.52 1.99 0.178 (0.09) 0.063 (0.036) 0.115 (0.075)Sand 1702 85.2 99.3 0.1 14.6 0.1 8.8 0.59 1.99 0.126 (0.08) 0.038 (0.029) 0.088 (0.069)† N is sample size, rb is oven dry bulk density, q330 and q15 000 are volumetric water contents at 330 and 15000 cm pressure, AWC is available
water content calculated as the difference between q330 and q15 000.
www.soils.org/publications/sssaj 583
texture classes was generally more similar to measured values than gcent demonstrating the improvement in sand and silt esti-mates obtained in the mcent approach.
The clearest distinction between models of sand, silt, and clay was presented in Fig. 4, which showed the R2_q330 and R2_q15000 by texture class. While the quantifiable significance of differences between the three models is debatable, there were noticeable trends across most texture classes that indicated R2_q330 and R2_q15000 of mcent were more similar to Rosetta models that used measured values of sand, silt, and clay compared with gcent. Differences be-tween texture models were more pronounced for q15000 than for q330 which may reflect varying sensitivity of the Rosetta model for different textures or possible measurement errors. Aside from the similarity of mcent and measured models of q330 and q15000, soil texture classes showed no clear patterns for the different pressures. Values of R2 ranged from 0 to 0.32 with the largest values in loamy sand and sandy loam texture classes of q330.
Unlike q330 and q15000, AWC showed positive and negative bias for different soil texture classes (Table 4). Clay loam, sandy clay, silty clay, and silty clay loam all had positive ME_AWC while other textures had negative ME_ AWC. Decomposing the bias re-ported for overall model performance into individual contribu-
tions by soil texture class provides valuable insight for improve-ment of PTF models. The greatest ME_ AWC was for sand and silt texture classes; however, sand and silt did not have the largest bias for either q330 or q15000. URMSE_ AWC of the silt texture class was considerably larger than other classes, which is similar to the URMSE_q330.
Most PTF models are evaluated with overall performance metrics across all samples (Nemes et al., 2006a, 2006b; Schaap and Leij, 1998; Schaap et al., 2004); however, comparison of model performance by soil texture class can identify limitations of various models. This is especially important for PTF models developed from limited databases, because the transferability may be strongly dependent on data used for model development and validation (Schaap and Leij, 1998; Tranter et al., 2009). Pachepsky and Rawls (1999) determined that PTFs developed for unique soil texture classes improved accuracy relative to the entire database, but concluded no advantage was gained by do-ing so because RMSE was not significantly different from the RMSE of the entire dataset. My results showed that error metrics were similar when all texture classes were combined, but differ-ences between models emerged when individual texture classes were compared (Fig. 4). Haghverdi et al. (2014) found that
Fig. 3. Measured vs. simulated percentage of sand (top row) and silt (bottom row) using the geometric centroid and the modified centroid for 75,736 soil samples from NCSS soil database. Note the binning of values in the geometric centroid. The blank space in modified centroid plot reflects gaps in the modified centroid values visible in Fig. 2. Solid blue line is linear model fit and black dashed line is 1:1 relationship. R2 value represents adjusted R2 for linear model fit.
584 Soil Science Society of America Journal
model performance was inversely related to the sample size for a given soil texture; however, this trend was not discernable in the current dataset. For example, clay and silty clay texture classes in this study had the largest bias for both ME_q330 and ME_q15000 but did not have the smallest sample sizes. In another example, the loam texture had the smallest sample size and ME_q15000 for that texture class was smaller than the ME_q15000 of the entire dataset of all textures. The inverse relationship between sample size and model performance found by Haghverdi et al. (2014) likely differed from this study because the Rosetta model was developed using a different dataset from the NCSS dataset used in this study, whereas Haghverdi et al. (2014) developed a new PTF.
Differences in water retention by soil texture class support the concept that soil hydraulic properties may be a natural way to differentiate soils as suggested by recent studies. Twarakavi et al. (2010) developed new soil hydraulic classes for the soil texture triangle to reorganize estimates of hydraulic soil proper-ties. Groenendyk et al. (2015) suggested that defining soil types should be based on application-specific hydrologic responses and that the current structure of the USDA soil texture triangle limits interpretations of soil function at landscape scales. To that end, de Lannoy et al. (2014) categorized the soil texture triangle
into 84 smaller mineral classes up to 60% clay and intersected this with organic C categories for a total of 253 unique soil classes for input to PTFs for a global dataset. Soils with >60%
Table 2. Mean error (ME), unbiased root mean square error (URMSE), and coefficient of determination (R2) for water con-tent at 330 and 15000 cm pressure and available water holding capacity (AWC) for 75,736 soil samples from NCSS soil database. Comparisons are between measured values and modeled values from Rosetta using three representations of sand, silt and clay.
Water content Measured Geometric centroid Modified centroid
Table. 3. Mean error (ME) and unbiased root mean square error (URMSE) for water content at 330 and 15000 cm pressure for 75,736 soil samples from NCSS soil database by texture class. Comparisons are between measured values and modeled values from Rosetta using three representations of sand, silt, and clay.
clay were not considered because of the inability of some PTFs to accurately predict hydraulic parameters for high clay soils. The clay texture class had the largest ME_q330 and ME_q15000 of all classes, which supports the rationale of de Lannoy et al. (2014) and may reflect the large size of the clay texture class in the USDA texture triangle.
Potential Applications of a Modified Centroid Approach for Particle Size
I present a method of converting discrete soil texture infor-mation to continuous estimates of sand and silt from discrete soil texture class information combined with field estimates of clay. This conversion provides two major benefits for the soil model-ing community. The first and potentially most important advan-tage is conversion of the data type from discrete to continuous, which represents an information gain from data that already exist for many soil databases and can be easily obtained in fu-ture sampling efforts. Continuous data arguably have more util-ity than discrete data types (Royston et al., 2006). For example, continuous data generally provide more resolution than discrete data resulting in more quantitative information and continuous data can be applied to more modeling approaches than discrete
data. Continuous variables can be assigned as discrete, but the reverse is not true. At best, soil texture class can be ranked into an ordinal dataset (e.g., sandy to clayey). The gcent approach of converting texture class data to continuous variables of sand, silt, and clay has previously been one of the only options for this con-version which would result in a relatively small number of unique centroids for a given dataset (e.g., 12 centroids for the USDA texture classification). In contrast, the 250 unique centroid loca-tions in mcent effectively provided more potential resolution for sand and silt estimates than the 12 centroids used in gcent which linearized the measured versus modeled values.
The conversion of discrete soil texture class data to con-tinuous sand, silt, and clay values makes many soil samples available for more quantitative analyses. Increasing sample size of continuous variables can expand the utility of soil databases for many applications. For example, more complete databases will foster improved soil hydraulic property modeling and po-tential application of PTFs to larger areas PTFs, as continuous variables (e.g., sand, silt, clay) often outperform discrete vari-ables (e.g., texture class; Schaap et al., 2001, 2004). The spatial variability of soil properties requires adequate sample size to reduce errors in mapping and modeling. Point data are often a
Fig. 4. Coefficient of determination (R2) for linear models comparing measured values of water content at field capacity (330 cm) and permanent wilting point (15000 cm) to the same variables predicted with the Rosetta pedotransfer function by soil texture class. Rosetta predictions were made using measured sand, silt, clay, bulk density, geometric centroid estimates of sand, silt, and clay with measured bulk density and modified centroid estimates of sand, silt and clay with measured bulk density. Values represent 75,736 soil samples in the NCSS soil database.
586 Soil Science Society of America Journal
limiting factor for developing soil maps because the invento-ries are expensive and time-consuming to complete.
Soil texture class maps are commonly the focus of DSM projects (e.g., Ballabio et al., 2016); however, continuous soil property maps often have utility for a wider range of appli-cations. Modeling continuous properties in space can utilize spatial autocorrelation for prediction, which is the underly-ing foundation of most spatial interpolation techniques. Class variables cannot easily utilize spatial autocorrelation and are often modeled with techniques like logistic regression and classification trees that do not account for location (Brungard et al., 2015; Heung et al., 2016). The mcent approach or oth-er similar models should be employed in a spatial context to evaluate the utility for DSM.
The concept of estimating sand, silt, and clay when at least one of those fractions is estimated or known along with a texture class, is a flexible approach that can be applied to any soil classification system. This can overcome problems asso-ciated with transforming data from one classification system to another. We should better utilize information in current databases to achieve the greatest information output from previously collected soil data. Collecting estimates of at least one particle size separate along with soil texture class should be standard practice for land management agencies to provide additional point data for soil modeling efforts.
CONCLUSIONI present a new approach for predicting continuous es-
timates of sand and silt and from easily obtainable field es-timates of soil texture class and clay percentage. The mcent approach produced a continuous distribution of values for sand and silt whereas the gcent model resulted in a stair-step pattern for each of the 12 texture classes. Estimated values of sand, silt, and clay were input to the Rosetta PTF model to test the sensitivity of different inputs for predicting measured values of water content. Rosetta underestimated water con-tent for all values of q330 and q15000. Comparison of measured water content to output from Rosetta indicated that centroid approaches were similar to the measured sand, silt, and clay approach for the overall dataset; however, mcent was more similar to the measured texture model than gcent for most soil texture classes. Performance of the Rosetta model using measured sand, silt, and clay was moderate and differed by soil texture class, and highlighted clay and silt texture classes as having the greatest error. The example of a modified centroid approach in this study using the USDA texture classes can be applied to any other texture classifications if adequate data are available and illustrates the importance of collecting texture class and clay estimates in the field. Converting discrete soil texture information to continuous sand, silt and clay values will enhance our ability to inventory soil properties and quantify soil process-es for numerous applications.
ACKNOWLEDGMENTSThis research was supported by the USDA ARS Postdoctoral Research Associate Program. I recognize S. Salley, J. Van Zee, and J. Karl for contributing valuable suggestions that shaped the development of this manuscript. J. Moeys and one anonymous reviewer provided valuable comments on a previous version of this manuscript.
REFERENCESBallabio, C., P. Panagos, and L. Monatanarella. 2016. Mapping topsoil physical
properties at European scale using the LUCAS database. Geoderma 261:110–123. doi:10.1016/j.geoderma.2015.07.006
Bishop, T.F.A., A. Horta, and S.B. Karunaratne. 2015. Validation of digital soil
Table. 4. Mean error (ME), unbiased root mean square error (URMSE), and coefficient of determination (R2) for available water holding capacity of 75,736 soil samples from NCSS soil database by texture class. Comparisons are between measured values and modeled values from Rosetta using three representations of sand, silt and clay.
Class Measured Geometric centroid Modified centroid
ME———————— cm3 cm–3————————
Clay –0.010 –0.019 –0.017
Clay loam 0.003 0.000 0.001
Sandy clay 0.012 0.009 0.010
Sandy clay loam –0.003 –0.006 –0.007
Sandy loam –0.025 –0.025 –0.026
Silty clay 0.008 0.007 0.007
Silty clay loam 0.021 0.019 0.021
Silt loam –0.006 –0.004 –0.002
Silt –0.059 –0.061 –0.058
Loam –0.008 –0.007 –0.009
Loamy sand –0.034 –0.030 –0.032
Sand –0.059 –0.056 –0.061
URMSE
———————— cm3 cm–3————————
Clay 0.059 0.059 0.060
Clay loam 0.051 0.051 0.051
Sandy clay 0.055 0.055 0.055
Sandy clay loam 0.049 0.049 0.049
Sandy loam 0.064 0.063 0.064
Silty clay 0.049 0.049 0.050
Silty clay loam 0.045 0.045 0.045
Silt loam 0.063 0.063 0.064
Silt 0.085 0.085 0.085
Loam 0.059 0.058 0.059
Loamy sand 0.066 0.066 0.067
Sand 0.065 0.064 0.065
Adjusted R2
Clay 0.01 0.00 0.00
Clay loam 0.17 0.17 0.17
Sandy clay 0.04 0.03 0.03
Sandy clay loam 0.12 0.11 0.11
Sandy loam 0.20 0.23 0.20
Silty clay 0.11 0.10 0.10
Silty clay loam 0.22 0.19 0.21
Silt loam 0.12 0.13 0.10
Silt 0.02 0.02 0.02
Loam 0.13 0.14 0.12
Loamy sand 0.22 0.24 0.22Sand 0.12 0.17 0.11
www.soils.org/publications/sssaj 587
maps at different spatial supports. Geoderma 241:238–249. doi:10.1016/j.geoderma.2014.11.026
Bormann, H. 2007. Analysis of the suitability of the German soil texture classification for the regional scale application of physical based hydrological model. Adv. Geosci. 11:7–13. doi:10.5194/adgeo-11-7-2007
Bormann, H. 2010. Towards a hydrologically motivated soil texture classification. Geoderma 157:142–153. doi:10.1016/j.geoderma.2010.04.005
Brungard, C.W., J.L. Boettinger, M.C. Duniway, S.A. Wills, and T.C. Edwards, Jr. 2015. Machine learning for predicting soil classes in three semi-arid landscapes. Geoderma 239–240:68–83. doi:10.1016/j.geoderma.2014.09.019
Chaney, N.W., E.F. Wood, A.B. McBratney, J.W. Hempel, T.W. Nauman, C.W. Brungard, et al. 2016. POLARIS: A 30-meter probabilistic soil series map of the contiguous United States. Geoderma 274:54–67. doi:10.1016/j.geoderma.2016.03.025
de Lannoy, G.J.M., R.D. Koster, R.H. Reichle, S.P.P. Mahanama, and Q. Liu. 2014. An updated treatment of soil texture and associated hydraulic properties in a global land modeling system. J. Adv. Model. Earth Syst. 6:957–979. doi:10.1002/2014MS000330
ESRI. 2015. ArcGIS version 10.4. Environmental Systems Research Institute, Redlands, CA.
FAO. 2006. Guidelines for soil description. Food and Agriculture Organization of the United Nations, Rome.
Foss, J.E., W.R. Wright, and R.H. Coles. 1975. Testing accuracy of field textures. Soil Sci. Soc. Am. J. 39:800–802. doi:10.2136/sssaj1975.03615995003900040051x
Franzmeier, D.P., and P.R. Owens. 2008. Soil texture estimates: A tool to compare texture-by-feel and lab data. J. Nat. Resour. Life Sci. Educ. 37:111–116.
Groenendyk, D.G., T.P.A. Ferre, K.R. Thorp, and A.K. Rice. 2015. Hydrologic-Process-based soil texture classifications for improved visualization of landscape function. PLOS ONE 10:e0131299. doi:10.1371/journal.pone.0131299
Gutmann, E.D., and E.E. Small. 2005. The effect of soil hydraulic properties vs. soil texture in land surface models. Geophys. Res. Lett. 32. L02402 doi:10.1029/2004gl021843.
Gutmann, E.D., and E.E. Small. 2007. A comparison of land surface model soil hydraulic properties estimated by inverse modeling and pedotransfer functions. Water Resour. Res. 43.:W05418 doi:10.1029/2006WR005135.
Haghverdi, A., H.S. Ozturk, and W.M. Cornelis. 2014. Revisiting the pseudo continuous pedotransfer function concept: Impact of data quality and data mining method. Geoderma 226:31–38. doi:10.1016/j.geoderma.2014.02.026
Herrick, J.E., J.W. Van Zee, S.E. McCord, E.M. Courtright, J.W. Karl, and L.M. Burkett. 2017. Monitoring manual for grassland, shrubland and savanna ecosystems. Volume I: Core methods. 2nd Ed. Available online at: http://www.landscapetoolbox.org/manuals/monitoring-manual/ (verified 26 April 2017). USDA-ARS Jornada Experimental Range, Las Cruces, NM.
Heung, B., H.C. Ho, J. Zhang, A. Knudby, C.E. Bulmer, and M.G. Schmidt. 2016. An overview and comparison of machine-learning techniques for classification purposes in digital soil mapping. Geoderma 265:62–77. doi:10.1016/j.geoderma.2015.11.014
Hodgson, J.M., J.M. Hollis, R.J.A. Jones, and R.C. Palmer. 1976. Comparison of field estimates and laboratory analyses of silt and clay contents of some west midland soils. J. Soil Sci. 27:411–419. doi:10.1111/j.1365-2389.1976.tb02011.x
Hudson, B. 1994. Soil organic matter and available water capacity. J. Soil Water Conserv. 49:189–194.
Marshall, T.J. 2003. Particle-size distribution of soil and the perception of texture. Aust. J. Soil Res. 41:245–249. doi:10.1071/SR02070
McBratney, A.B., B. Minasny, S.R. Cattle, and R.W. Vervoort. 2002. From pedotransfer functions to soil inference systems. Geoderma 109:41–73. doi:10.1016/S0016-7061(02)00139-8
McBratney, A.B., M.L.M. Santos, and B. Minasny. 2003. On digital soil mapping. Geoderma 117:3–52. doi:10.1016/S0016-7061(03)00223-4
Minasny, B., and A.B. McBratney. 2001. The Australian soil texture boomerang: A comparison of the Australian and USDA/FAO soil particle-size classification systems. Aust. J. Soil Res. 39:1443–1451. doi:10.1071/SR00065
Moeys, J. 2013. soiltexture: Functions for soil texture plot, classification and
transformation. R package version 1.3.3. http://CRAN.R-project.org/package=soiltexture.
Nemes, A., W.J. Rawls, and Y.A. Pachepsky. 2006a. Use of the nonparametric nearest neighbor approach to estimate soil hydraulic properties. Soil Sci. Soc. Am. J. 70:327–336. doi:10.2136/sssaj2005.0128
Nemes, A., W.J. Rawls, Y.A. Pachepsky, and M.T. van Genuchten. 2006b. Sensitivity analysis of the nonparametric nearest neighbor technique to estimate soil water retention. Vadose Zone J. 5:1222–1235. doi:10.2136/vzj2006.0017
Nemes, A., J.H.M. Wösten, A. Lilly, and J.H.O. Voshaar. 1999. Evaluation of different procedures to interpolate particle-size distributions to achieve compatibility within soil databases. Geoderma 90:187–202. doi:10.1016/S0016-7061(99)00014-2
Odgers, N.P., K.W. Holmes, T. Griffin, and C. Liddicoat. 2015. Derivation of soil-attribute estimations from legacy soil maps. Soil Res. 53:881–894. doi:10.1071/sr14274
Pachepsky, Y.A., K. Rajkai, and B. Tóth. 2015. Pedotransfer in soil physics: Trends and outlook—A review. Agrokem. Talajtan 64:339–360. doi:10.1556/0088.2015.64.2.3
Pachepsky, Y.A., and W.J. Rawls. 1999. Accuracy and reliability of pedotransfer functions as affected by grouping soils. Soil Sci. Soc. Am. J. 63:1748–1757. doi:10.2136/sssaj1999.6361748x
Post, D.F., A.R. Huete, and D.S. Pease. 1986. A comparison of soil scientist estimations and laboratory determinations of some arizona soil properties. J. Soil Water Conserv. 41:421–424.
R Core Team. 2016. R: A language and environment for statistical computing. R Foundation for Statistical Computing, Vienna, Austria. URL http://www.R-project.org/.
Royston, P., D.G. Altman, and W. Sauerbrei. 2006. Dichotomizing continuous predictors in multiple regression: A bad idea. Stat. Med. 25:127–141. doi:10.1002/sim.2331
Sanchez, P.A., S. Ahamed, F. Carre, A.E. Hartemink, J. Hempel, J. Huising, et al. 2009. Digital soil map of the world. Science 325:680–681. doi:10.1126/science.1175084
Schaap, M.G., and F.J. Leij. 1998. Database-related accuracy and uncertainty of pedotransfer functions. Soil Sci. 163:765–779. doi:10.1097/00010694-199810000-00001
Schaap, M.G., F.J. Leij, and M.T. van Genuchten. 2001. ROSETTA: A computer program for estimating soil hydraulic parameters with hierarchical pedotransfer functions. J. Hydrol. 251:163–176. doi:10.1016/S0022-1694(01)00466-8
Schaap, M.G., A. Nemes, and M.T. van Genuchten. 2004. Comparison of models for indirect estimation of water retention and available water in surface soils. Vadose Zone J. 3:1455–1463. doi:10.2136/vzj2004.1455
Scull, P., J. Franklin, O.A. Chadwick, and D. McArthur. 2003. Predictive soil mapping: A review. Prog. Phys. Geogr. 27:171–197. doi:10.1191/0309133303pp366ra
Sequeira, C.H., S.A. Wills, C.A. Seybold, and L.T. West. 2014. Predicting soil bulk density for incomplete databases. Geoderma 213:64–73. doi:10.1016/j.geoderma.2013.07.013
Shirazi, M.A., L. Boersma, and C.B. Johnson. 2001. Particle-size distributions: Comparing texture systems, adding rock, and predicting soil properties. Soil Sci. Soc. Am. J. 65:300–310. doi:10.2136/sssaj2001.652300x
Soil Survey Staff. 2011. Soil survey laboratory information manual. In: R. Burt, editor, Soil survey investigations Rep. No. 45, Version 2.0. USDA, NRCS, Washington, DC.
Soil Survey Staff. 2014. Kellogg soil survey laboratory methods manual. In: R. Burt and Soil Survey Staff, editors, Soil survey investigations Rep. No. 42, Version 5.0. USDA, NRCS, Washington, DC.
Soil Survey Staff. 2012. Field book for describing and sampling soils. Version 3.0. NRCS, National Soil Survey Center, Lincoln, NE, Lincoln, NE.
Thien, S.J. 1979. A flow diagram for teaching texture-by-feel analysis. J. Agron. Educ. 8:54–55.
Tranter, G., A.B. McBratney, and B. Minasny. 2009. Using distance metrics to determine the appropriate domain of pedotransfer function predictions. Geoderma 149:421–425. doi:10.1016/j.geoderma.2009.01.006
Twarakavi, N.K.C., M. Sakai, and J. Simunek. 2009. An objective analysis of the dynamic nature of field capacity. Water Resour. Res. 45.
588 Soil Science Society of America Journal
doi:10.1029/2009WR007944Twarakavi, N.K.C., J. Simunek, and M.G. Schaap. 2010. Can texture-based
classification optimally classify soils with respect to soil hydraulics? Water Resour. Res. 46. doi:10.1029/2009WR007939
van Genuchten, M.T. 1980. A closed-form equation for predicting the hydraulic conductivity of unsaturated soils. Soil Sci. Soc. Am. J. 44:892–898. doi:10.2136/sssaj1980.03615995004400050002x
van Genuchten, M.T., and D.R. Nielsen. 1985. On describing and predicting the hydraulic properties of unsaturated soils. Ann. Geophys. 3:615–627.
Vereecken, H., A. Schnepf, J.W. Hopmans, M. Javaux, D. Or, T. Roose, et al. 2016. Modeling soil processes: Review, key challenges, and new perspectives. Vadose Zone J. 15. doi:10.2136/vzj2015.09.0131
Vereecken, H., M. Weynants, M. Javaux, Y. Pachepsky, M.G. Schaap, and M.T. van Genuchten. 2010. Using pedotransfer functions to estimate the van Genuchten-Mualem soil hydraulic properties: A review. Vadose Zone J. 9:795–820. doi:10.2136/vzj2010.0045
Vos, C., A. Don, R. Prietz, A. Heidkamp, and A. Freibauer. 2016. Field-based soil-texture estimates could replace laboratory analysis. Geoderma
267:215–219. doi:10.1016/j.geoderma.2015.12.022Wei, S.G., Y.J. Dai, C. Garcia-Gutierrez, and H. Yuan. 2014. Particle-size
distribution models for the conversion of Chinese data to FAO/USDA system. Sci. World J. 11. doi:10.1155/2014/109310
Whitney, M. 1911. The use of the soils east of the Great Plains Region. USDA Bureau of Soils Bull. No. 78, Washington, DC.
Williams, J., R.E. Prebble, W.T. Williams, and C.T. Hignett. 1983. The influence of texture, structure and clay mineralogy on the soil moisture characteristic. Aust. J. Soil Res. 21:15–32. doi:10.1071/SR9830015
Wösten, J.H.M., Y.A. Pachepsky, and W.J. Rawls. 2001. Pedotransfer functions: Bridging the gap between available basic soil data and missing soil hydraulic characteristics. J. Hydrol. 251:123–150. doi:10.1016/S0022-1694(01)00464-4
Zhang, Y., and M.G. Schaap. 2017. Weighted recalibration of the Rosetta pedotransfer model with improved estimates of hydraulic parameter distributions and summary statistics (Rosetta3). J. Hydrol. doi:10.1016/j.jhydrol.2017.01.004