1 Peer effects in employment: Results from Mexico’s poor rural communities Caridad Araujo † , Alain de Janvry ‡ , and Elisabeth Sadoulet ∞ August 2004 Abstract Empirical evidence has shown that off-farm non-agricultural (OFNA) employment offers a major pathway from poverty for rural populations. However, the pattern of participation in these activities is heterogeneous across categories of individuals and poorly understood. We explore the role of spillovers from peers on an individual’s participation in formal and informal OFNA employment using village census data for rural Mexico. We test and reject the possibility that peers’ decisions could be proxying for unobserved individual, village-level, or individual-type effects. We find that peers’ participation in OFNA employment has a large impact on an individual’s ability to engage in this type of employment, both formal and informal, even after controlling for individual attributes and village characteristics. Peer effects are structured by similarities in gender, ethnicity, educational level, and land endowment. We find that marginal peer effects tend to be stronger for categories of individuals that are already more engaged in OFNA employment, such as men, non-indigenous people, the more educated, and the landless, contributing to reinforcing inequalities in accessing these jobs. However, the role of peer effects relative to that of education in obtaining formal OFNA employment is more important for members of groups that are less engaged in these jobs, such as women, indigenous people, the less educated, and smallholders. † The World Bank and Georgetown University. [email protected]‡ University of California at Berkeley. [email protected]∞ University of California at Berkeley. [email protected]
Transcript
1
Peer effects in employment:
Results from Mexico’s poor rural communities
Caridad Araujo†, Alain de Janvry‡, and Elisabeth Sadoulet∞
August 2004
Abstract
Empirical evidence has shown that off-farm non-agricultural (OFNA) employmentoffers a major pathway from poverty for rural populations. However, the pattern ofparticipation in these activities is heterogeneous across categories of individuals andpoorly understood. We explore the role of spillovers from peers on an individual’sparticipation in formal and informal OFNA employment using village census data forrural Mexico. We test and reject the possibility that peers’ decisions could be proxyingfor unobserved individual, village-level, or individual-type effects. We find that peers’participation in OFNA employment has a large impact on an individual’s ability toengage in this type of employment, both formal and informal, even after controlling forindividual attributes and village characteristics. Peer effects are structured bysimilarities in gender, ethnicity, educational level, and land endowment. We find thatmarginal peer effects tend to be stronger for categories of individuals that are alreadymore engaged in OFNA employment, such as men, non-indigenous people, the moreeducated, and the landless, contributing to reinforcing inequalities in accessing thesejobs. However, the role of peer effects relative to that of education in obtaining formalOFNA employment is more important for members of groups that are less engaged inthese jobs, such as women, indigenous people, the less educated, and smallholders.
Rural poverty accounts for some 75% of world poverty. As a consequence, no global poverty
reduction objectives, such as stated in the Millennium Development Goals, can possibly be met without
addressing the specificity of rural poverty. Short of cash transfers, moving out of poverty for rural
households requires satisfying at least one of three necessary, but not sufficient, conditions: access to land,
access to employment in agriculture, or/and access to off-farm non-agricultural (OFNA) employment in
either the formal or informal sectors. The first has been addressed through programs of land reform or of
subsidies in acquiring land through the market (Deininger, 2003). It is constrained by the “limited good”
nature of land and by the difficulty of turning beneficiaries into competitive farm entrepreneurs. The
second has the advantage of easy entry if local agriculture is sufficiently dynamic and labor intensive.
However, it has proven not to be much of a strategy out of poverty due to typically low wages and seasonal
employment in agriculture. For this reason, considerable attention has been given to the potential offered
by the third option in providing an instrument for rural poverty reduction (see the compilation of country
studies in Reardon, Berdegué, and Escobar, 2001, and incorporation of this idea into a rural development
strategy in World Bank, 2002). Indeed, the high share of OFNA income for even landed rural households
has come as a surprise to rural development practitioners who traditionally looked at smallholder farming
as the solution to poverty. This has led to considerable efforts to identify the determinants of access to
OFNA employment across space and heterogeneous populations. Who has access to such employment and
what helps specific disadvantaged groups gain such opportunities depends, in particular, on individual
attributes and context. The magnitude of these effects has been extensively studied. We analyze here an
additional effect, namely the role of positive spillover effects across peers in securing OFNA employment.
If there are such effects, success in obtaining OFNA employment is influenced by the occupational
outcomes of members of one’s own peer group. These effects may help equalize chances of OFNA
employment or, to the contrary, reinforce inequalities of opportunities, depending on which peer groups an
individual belongs to and how effective these groups are in helping obtain OFNA employment. For
instance, relatively more effective peer groups for women, indigenous populations, and uneducated
individuals would promote equality of opportunities. Since exceptionally high levels of inequality have
3
been identified as one of the main roadblocks to Latin American development (World Bank, 2003),
identifying this role of local peer effects in helping reproduce or decrease inequality of opportunities is
highly relevant.
Important efforts have been made to identify the role of social interactions on individual behavior.
However, while ethnographic and qualitative research suggests a role for the behavior of others on
individual decisions and choices, serious difficulties arise when trying to measure this effect empirically.
Much of the recent work on social networks consists in proposing research designs where the identification
problem in measuring this effect can be overcome.
This paper provides a measurement of the importance of peer effects on participation by residents
of poor Mexican rural communities in formal and informal OFNA employment. Peers are defined as
individuals of the same type in the same village, and we explore different kinds of peer groups, partitioning
the village by gender, educational level, ethnicity, or land ownership status. The role of peers’ decisions on
individual participation in off-farm labor markets is consistent with anecdotal evidence collected in visits to
several of the villages studied. When asked to describe the mechanisms used to find off-farm jobs in the
formal sector, people recurrently talk about the importance of referrals from peers. When asked to explain
how self-employment in informal activities was started, they indicate the value of information garnered
from peers. Observations on the spatial clustering of particular types of activities suggest a role for peer
effects. However, other factors could explain a spatial distribution of this kind, such as correlation among
unobservable individual characteristics of members of the peer group, unobserved village characteristics,
and unobserved common factors to individuals of the same type. We devise tests to eliminate these
possibilities in identifying causality of peer effects on OFNA employment.
We find the following results:
1. Peer effects are important in explaining individual occupational outcomes.
2. Peer effects are unlikely to be due to unobservable individual, village, or individual-type
factors.
3. Marginal peer effects tend to be larger for the groups already more involved in OFNA activities,
namely men, non-indigenous people, the most educated in the community, and the landless, thus
contributing to reproduce and deepen village inequalities in accessing these jobs.
4
4. Peer effects are relatively more important than educational effects in achieving formal OFNA
employment for the weaker groups on that market.
The rest of this paper is organized as follows. Section 2 discusses related literature in search of an
identification strategy for peer effects. Section 3 introduces a model of individual occupational choice and
the empirical strategy. Section 4 presents the data. We then discuss in Section 5 the empirical findings on
the determinants of participation in OFNA jobs. Section 6 concludes.
2. Previous studies of the role of social interactions
There is abundant empirical evidence that members of social networks have similar behavior in a
range of activities, such as welfare participation, fertility, crime, labor market participation, education, etc.
Casual evidence often suggests that this similarity of behavior comes from the social influence that
members of a network have on each others. Topa (2001) cites different studies for the United States that
reveal that more than 50% of jobs are found through friends and family. It is difficult, however, to
empirically establish this causality, as (i) the observed correlation in the behavior of network members
could come from omitted individual characteristics that are correlated within networks (in certain cases,
networks themselves may be endogenous to the behavior that one seeks to analyze if individuals can
choose the network that best supports their decision), or from unobserved factors common to the network,
and (ii) the simultaneity in behavior (one individual both affects and is affected by the members of his
network) makes difficult to measure the causal impact (the “reflection” problem in Manski’s (1993)
terminology). However, if the first problem is properly controlled for, the second is of somewhat lesser
importance, in the sense that a measured correlation between peers’ behaviors in itself reveals social
interaction, even if one cannot establish the size of a direct causal effect.
Formally, the problem is to estimate the behavior li of individual i in network n, as function of
characteristics Xn or of average behavior ln of the network n. An identification problem arises if there are
omitted individual characteristics ui that are correlated within network and thus with ln , or if there is an
omitted common factor un to the network. Finally, if the network itself is endogenous, the characteristics
Xn of the network may be correlated with li , even without social interactions.
5
A few empirical studies have been able to circumvent the problem of correlation among individual
characteristics by relying on random assignment of individuals to networks, leaving the common network
factor and the reflection problems to be addressed. For example, studying the influence of randomly
assigned roommates on college students’ academic performances, Sacerdote (2001) controls for common
shocks with a dormitory fixed effect and finds that there is a positive correlation between achievements of
roommates li and l j . By contrast, Zimmerman (2003) finds that a student’s performance li is influenced
by his roommate’s academic ability X j , as measured by his SAT score. In a different approach, which also
relies on random intervention on the networks, Duflo and Saez (2003) randomly assign a treatment to a
certain number of individuals, thus exogenously affecting ln , and observe the existence of spillover effects
on the behavior of the non-treated members of their networks.
Other studies have to rely on spatial or time variation in the network that allows them to use fixed
effects to control for unobservables. An example of the use of spatial variation is found in Bertrand,
Luttmer, and Mullainathan (2000). In a study of welfare participation in the United States, they define
networks by the language spoken at home (each person’s network n = gv is composed of the population that
speaks the same language g in the same location v) and characterize the network effect on any individual’s
propensity to become welfare recipient by the product of a quantitative measure of the size of the network
N gv (the proportion of the local population that pertains to the same network) with the average propensity
that this language group uses welfare lg all over the U.S.. This measure is thus immune to unobserved
factors that would specifically affect the behavior lgv of network gv. They control for other potential
sources of bias by including language g and location v fixed effects. The study of fertility behavior in
Bangladesh by Munshi and Myaux (2002) gives an example of time variation in a network. They define
networks based on religion, and characterize the influence of the network on an individual woman’s
contraception decision over time lit by the average contraceptive prevalence in her network in her village
lnt . With panel observations on individual and group behavior, they can include individual i and time t
fixed effects to control for unobservables. They find that individuals respond strongly to the behavior of
their own religious group, but not to that of others’, supporting the claim that lnt does not proxy for any
unobserved location-time effect. Ichino and Maggi (2000) use panel data with individuals who move
6
across locations, and are consequently exposed to different groups and values, to identify the role that
group interaction has on employees differential shirking behavior in Northern and Southern branches of an
Italian bank. An individual’s network is composed of the other workers in the same branch. Each
individual shirking behavior lit is influenced by the average shirking behavior in the branch lnt ,
controlling for individual fixed effects ui , branch fixed effects un , and observable time variant individual
characteristics Xit . Identification of the network effect comes from the fact that individuals i change
location and thus network over time. Instrumental variables are sometimes used to deal with the remaining
endogeneity problem of network effects. For example, in a study of the role of networks in helping
Mexican migrants find a job in the U.S., Munshi (2003) defines a community’s network strength by the
proportion of its migrants that is in the location at any year. The probability that an individual migrant
finds work lit is then influenced by network strength N nt . As the size of the network is itself endogenous
and potentially correlated with unobserved employment factors unt in the U.S. location, it is instrumented
by rainfall in the community ( znt ).
Finally, when panel data are not available, the problem of endogeneity of the network’s average
behavior ln can be addressed with instrumental variable techniques, although it is particularly difficult to
find valid instruments for the average behavior of peers that do not directly influence individual behavior.
For example, in a study of the neighbors’ influence on individual housing expenditures, Ioannides and
Zabel (2003) instrument the neighbors’ average expenditure ln by their average characteristics Xn .
To deal with the reflection problem, previous studies have used either characteristics of the
network other than their average behavior (Bertrand, Luttmer, and Mullainathan (2000)), instruments for
the network average behavior, or lagged behavior. Hanushek et al. (2003) study peer effects in student
academic performance, where peers are defined as students from the same school, grade, and cohort. Using
panel data, they control for omitted variables with individual and school-grade-cohort fixed effects. In
addition, they circumvent the simultaneity problem of current achievements of network students by using
peers’ lagged achievements.
7
In this paper, peers are defined as individuals of the same type g (same gender, ethnicity,
education level, or land ownership status), living in the same village v, and we show that individuals’
participation in OFNA employment is associated with their peers’ average participation. We then verify:
- That peers’ behavior cannot be proxying for correlated individual unobserved factors by
estimating a reduced form model in which we substitute average peer characteristics Xgv for average peer
behavior lgv .
- That it cannot be proxying for unobserved village effect by substituting the average behavior of
the non-peer lg v¢ from the village (as in Munshi and Myaux) for lgv .
- That it cannot be proxying for a specific individual type g effect by substituting the average
behavior of people from the closest village lgv ¢ for lgv .
3. A model of occupational choice under peer effects and the empirical strategy
Consider an individual i, from village v, and his decision to work off-farm li Π{ }0 1, . To formally
explore the role of peer effects in influencing this choice, we specify the net return that an individual
obtains from working off-farm as a function of his peers’ own employment decisions. A peer group gv is
composed of all the individuals of type g in village v, where the type is defined by gender, ethnicity,
education, or land ownership status. We can think of the peers effect as reducing transactions cost,
whereby peers that are themselves working off-farm provide information or serve as referral. An
alternative interpretation is that individuals may gain utility from conforming to the behavior of their peers
(Akerlof, 1997). With either interpretation, the net utility Vi from working off-farm includes an increasing
function C lgv( ) of the average employment behavior lgv of the individual’s peer group gv. We assume this
term to be additive to the standard private net return, R X Zi v,( ) , function of individual characteristics Xi
and contextual village characteristics Zv , and an idiosyncratic heterogeneity term ei:
V R X Z C li i v gv i= ( ) + ( ) +, e .
Assuming linear functional forms for C(.) and R(.), the model is written:
V X Z li i v gv i= + + +b g d e , (model 1)
8
with the discrete choice of working off-farm defined by:
l V li i i= > =1 0 0 if otherwise.,
If we assume that the ei are i.i.d. normal with zero mean and unit variance, the model can simply be
estimated with a probit specification.
In this formulation, the empirical identification of the peer effect is due to the non-linearity of the
decision model.1 This non-linearity is a fundamental characteristic of a binary choice model, whereby a
change in a covariate only affects the decision if it pushes the latent variable beyond some threshold level
(i.e., induces the individual to switch from not-working to working or reciprocally), and has no effect if the
latent variable is beyond the threshold (i.e., has no influence if it increases the utility for working of an
individual that is already working). The specific numerical results obtained in this estimation, however,
may be influenced by the choice of distribution. We have thus checked that a logit model that assumes ei
to be i.i.d. with an extreme-value distribution gives similar qualitative results to the ones from the probit
estimation reported here.
Although the observed average behavior of the peer group is endogenous, we proceed with what
Brock and Durlauf (2001) have called the “naïve” estimator of the parameter of this model using the
observed values of peers’ decisions. We do this because we can eliminate four potential sources of bias in
this estimation as follows:
• First, the structure of the model implies that an individual’s unobserved characteristics that enter
the individual decision process also influence the decision of his peers, which, in turn, enter into the
individual decision through the peer effect. Hence, by the very structure of the model, ei is correlated with
lgv . This effect, however, is unlikely to be important in large groups of peers, such as those that we
consider here.
• Second, similar behavior between peers may simply be due to correlation among unobserved
individual characteristics ui , in a model specified as follows:
V X Z l ui i v gv i i= + + + +b g d e .
1 Manski (1993) discusses the difficulties that arise for the empirical identification of peer effects in alinear model.
9
Correlation between the different ui from individuals i pertaining to the same peer group gv
would indeed create a correlation between lgv and the error term in model 1. Following Case and Katz
(1991), we will verify that the measured effect of lgv on li in model 1 is unlikely to be solely due to
unobserved individual characteristics ui by testing whether the peers’ observed individual characteristics
Xgv influence i’s behavior in the following model:
V X Z Xi i v gv i= + + +b g a e . (model 2)
Finding parameters a significantly different from 0 will suggest that there are some genuine
interactions among individuals of the peer group.
• A third source of bias is the presence of an unobserved common factor uv in the village:
V X Z l ui i v gv v i= + + + +b g d e .
If this were the case, the common factor would similarly affect other members of the village. We
will therefore compare the basic model with a model where we substitute the average behavior lg v¢ of the
non-peers ¢g v in the village for lgv :
V X Z li i vv
g v i= + + +¢b g d e . (model 3)
As lg v¢ and lgv (e.g., average employment of men and women) may have different orders of
magnitude and variability across villages, the comparison of the two coefficient d and d v does not reveal
the relative importance of the two effects. There is no simple way to test these two non-nested models
against each other. We can, however, test each of them against a general model that encompasses both:
V X Z l li i v gv g v i= + + + ¢ +¢b g d d e . (model 4)
This may or may not allow us to choose one model over the other if, for example, the test leads to
rejection of both or of neither. An alternative method is to use the procedure of model selection based on
an information criterion. The two most popular criteria are the Akaike information criterion (AIC) and the
Bayesian information criterion (BIC):
AIC k
BIC kN
= -
= -
l
l 0 5.
where l is the log-likelihood of the model, k the number of estimated parameters, and N the number of
observations. As models 1 and 3 have the same number of parameters and observations, the comparison of
10
the information criteria reduces to the comparison of the log-likelihood functions. Selecting model 1 over
model 3 (either on the basis of the tests against model 4 or using the information criteria) will indicate that
the peer effect is not due to common unobserved village-level factors.
• Finally, bias in the estimation of the peer effect could be due to presence of an unobserved
common factor ug to the individual type g:
V X Z l ui i v gv g i= + + + +b g d e .
If this were the case, it is likely that the same type of people should similarly feel this factor in the
closest village. We thus estimate a model where we substitute the average employment of the same type of
individuals in the closest village (within a 4kms radius) lgv ¢ for lgv :
V X Z li i vg
gv i= + + +¢b g d e . (model 5)
Like for the case above, selection of the best of these two non-nested models is done by
imbedding them in a general model that includes both lgv ¢ and lgv , and by comparing the information
criteria, or equivalently the loglikelihood functions. The sizes of the parameters are, in addition,
comparable in this contrast, since they apply to similar variables (average employment of men, for
example) in two villages. Selecting model 1 over model 5 (either from tests against the general model or
using the information criteria) will indicate that the peer effect is not due to an unobserved common factor
for individuals of a particular type.
While none of these tests alone offers a proof of the validity of the estimated effect of peers’
behavior on individual employment decisions, the combination of all three should provide support for our
claim that estimation of significant peer effects in model 1 is not solely picking up unobserved variables.
11
4. The data
The data we use are unique in many aspects. Firstly, we have household surveys that include all
the individuals within each of the survey villages2. Unless otherwise specified, we refer to the villages
included in this data set as survey villages.3. Secondly, from the 2000 population census, we have village-
level data for all villages in Mexico. And third, through applications of geographic information systems
(GIS), we combine the data in units that describe the proximity of each village, independent of the
predetermined administrative organization of Mexican municipalities and states.
The sample consists in 57,644 adults from 20,160 households, located in 500 villages in 7 states.4
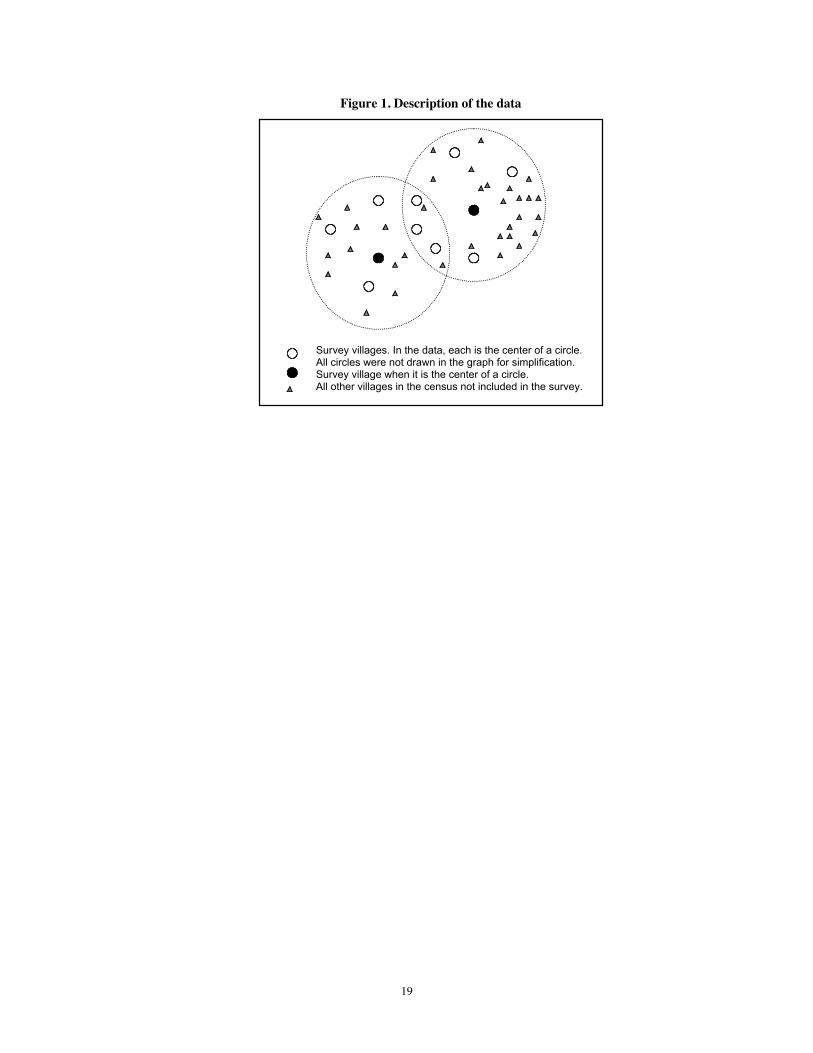
Figure 1 illustrates the different levels of aggregation for the variables we use in the empirical analysis to
characterize the context. The dots (white and black) represent the survey villages. Our survey includes all
the individuals within these villages, for whom we observe Xi . In addition, we calculated village-level
averages for the decisions and characteristics of neighbors ( lgv and Xgv ).
Our work uses GIS in the construction of explanatory variables that describe the local context for a
particular village ( Zv ). All the villages that are in the proximity of the survey villages and that were not
included in the survey are represented with triangles. We have population census data for these villages,
which we then aggregate to describe the context around the survey villages. Through applications of GIS,
we have constructed circles with 10 km and 20 km radiuses around each of the survey villages, like those
illustrated in Figure 1. The two villages in the center of the circles are represented with black dots. In order
to characterize the area around a survey village, we have aggregated the data for all the villages inside a
particular circle. The Zv variables (variability of altitude and average employment in the primary,
secondary, and tertiary sectors) were constructed in this way.
2 This is a census-like individual-level survey performed in November 1999 as part of the follow-up on theimplementation of the Oportunidades program (formerly Progresa) in 500 poor Mexican rural villages.Oportunidades is a program that makes conditional cash transfers for education, nutrition, and health topoor families in rural areas. The program started in 1997 and, as part of its internal impact evaluation, everysix months it ran an extensive survey on a sample of 25,000 households in 500 villages of seven differentstates.3 Because the format of the surveys changed over time, data on land ownership was not available in theNovember 1999 questionnaire and therefore it was matched with the October 1998 round of the survey.Similarly, data on education, literacy, and ethnicity of adults was matched with the 1997 Encaseh survey.4 We refer as adults to persons 15 years of age or older when the survey was performed. We excludedindividuals who were enrolled in school and not working, part or full time.
12
4.1. Choice of occupation
A key component of this study is the characterization of the different types of occupations from the
information available in the survey. Among the 57,644 adults in the survey, agricultural workers (31.5% of
This categorization into four groups includes 47,210 “working” adults, leaving a group of
10,434 non-working adults (or 18%) in the population of 57,644 persons. 88% of the non-working
adults are women, and 4% are men older than 65 years.
5 Ejidatarios are households with land received through the land reform program that followed the Mexicanrevolution of 1910. They tend to be older household heads with low education and low participation inOFNA. Most landed households in the survey belong to this category.6 We excluded the persons who appeared as not working and who neither use nor own land or earnedincome.
13
4.2. The explanatory variables
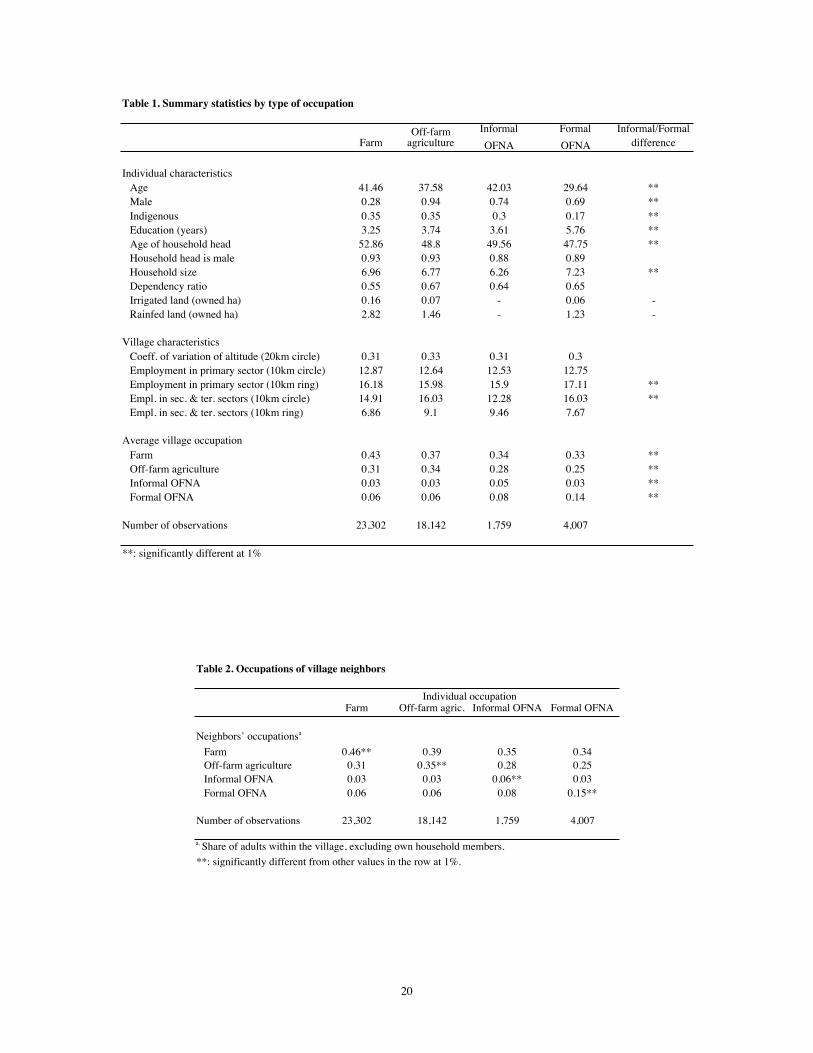
Table 1 presents summary statistics for the four groups of occupations: farm, off-farm agriculture,
informal OFNA, and formal OFNA activities. We report t-tests on differences between the last two groups.
Compared to workers in the formal OFNA, those in informal OFNA are more likely to be older, male,
indigenous, and to have less years of education. They come from smaller households with older heads.
They live in places with less employment in all sectors (primary, secondary, and tertiary) in the
surroundings. They have a higher proportion of village neighbors employed in farm, off-farm agriculture,
and informal OFNA. Interestingly, compared to those in the other occupations, people employed in formal
OFNA are younger, have the highest education levels, and come from larger households with young heads
and little land. It is also the sector that absorbs the least indigenous population and, among the off-farm
jobs, that with the highest participation of women.
Data in Table 2 describe the occupations of individuals’ village neighbors. They show that individuals
in all occupations have, on average, more neighbors in their same occupation than in any other, suggesting
that interactions are important in the determination of current occupations.
5. Empirical results
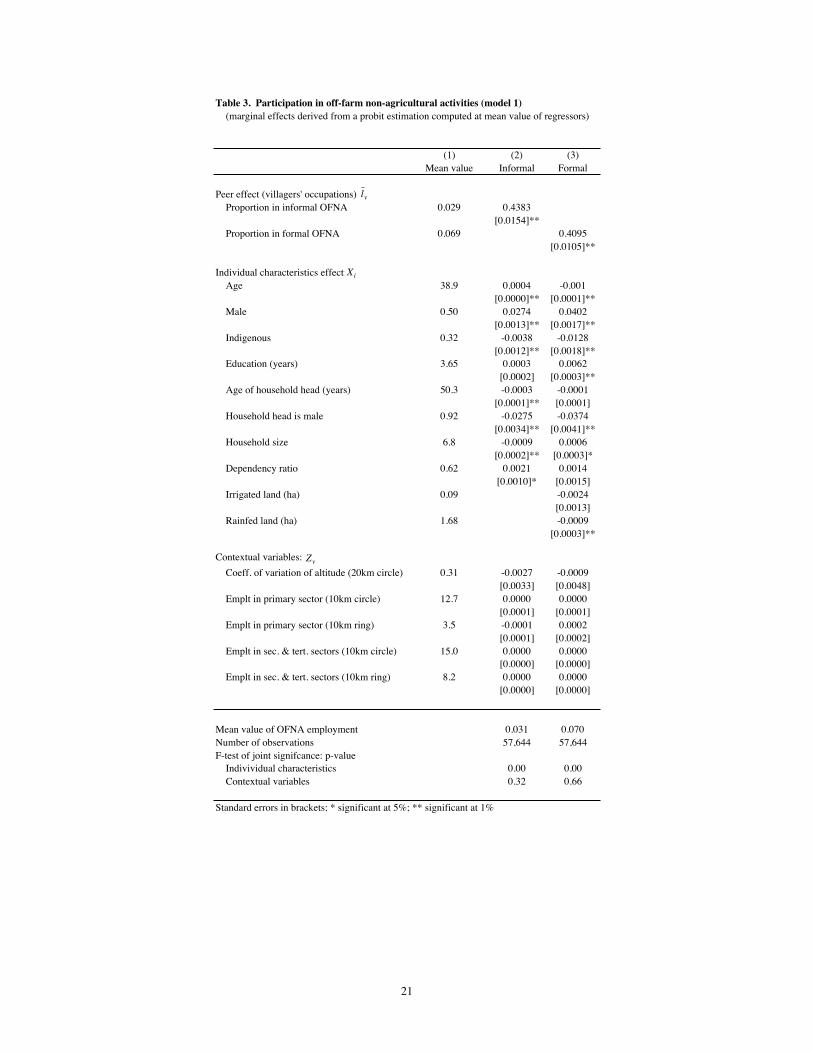
To identify the determinants of participation in OFNA jobs (model 1), we estimate separately
probit equations for participation in informal and formal OFNA activities. We also explore alternative
definitions of the peer group. In a first estimation, the peer group is composed of all the adults from the
same village (Table 3). We then explore a narrower definition of peer group by considering only adults of
the same gender, the same ethnicity, the same education level, or the same landownership status within the
village (Table 4 reports partial results on the peer effects).
For both types of employment, results in Table 3 show that the probability of participating in
OFNA is highly correlated with individual and household characteristics. It is higher for men, particularly
for formal OFNA, higher when the head of household is female, and somewhat lower for indigenous. The
two types of employment differ sharply in that formal OFNA absorbs young, educated individuals from
larger households, while informal OFNA captures older people from smaller households, and education is
14
not significantly associated with participation in this sector. None of the contextual variables have an
independent effect in these regressions, although they do in some other specifications. Finally, we see that
the peer effect is large and significant for both informal and formal OFNA. Living in a village with an
OFNA employment rate of, for example, 12% rather than 2% increases the probability of each individual to
be working in OFNA by 4%.
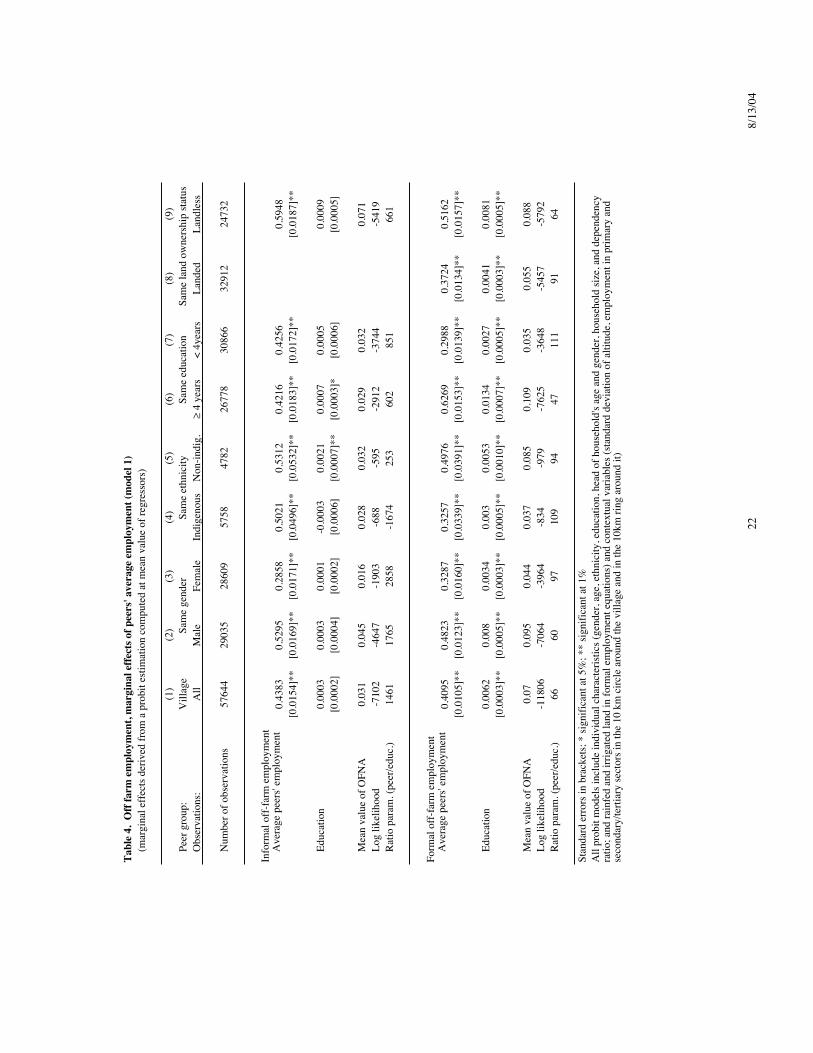
In Table 4, we report these peer effects for alternative definitions of peer groups. Column (1)
repeats the result of the previous estimation for comparison purposes. Estimations are performed
separately for the different types of individuals. These results reveal interesting heterogeneity in the
importance of peer effects. Overall peer effects are 10–50% larger for informal employment than for
formal employment, except for women, for whom peer effects matter more in formal jobs than in informal
ones. Peer effects in informal employment are very similar across groups, except for women where it is
half of what it is for men. By contrast, peer effects are very heterogeneous in the formal sector. Men, non-
indigenous, educated, and landless individuals benefit far more than women, indigenous, less educated, and
landed individuals from their peers’ occupational choices. Across partitions into peer groups, marginal
peer effects benefit most the more educated, followed by males. It is the groups that are already most
engaged in formal OFNA activities that have the highest marginal peer effects on participation. Peer
effects thus help reinforce local differences in participation.
As mentioned earlier, a potential bias in this estimation could come from unobserved individual
characteristics correlated at the village level. For example, by selective migration, some villages retain
their most dynamic men, who are more likely to get employed in OFNA activities; in some ethnic groups
largely regrouped in certain villages, women have a long tradition of handicrafts, while there is little such
tradition in other villages. With dynamism and ethnic tradition not observed, and yet important
determinants of participation to OFNA activities, the average behavior of peers (men or indigenous from
the village) could pick up their effects. To support the claim that there is not only correlation but also
genuine interaction among members of a peer group, we look for the influence of the characteristics of
peers corresponding to the observed characteristics of the individual. This interaction corresponds to what
Manski called the “exogenous” effect of peer. It can also be seen as a linearized reduced form of model 1.
If correlation among characteristics was the only source of the estimated influence of the peers in model 1,
15
then the peers’ characteristics should not appear to influence any individual once his own characteristics are
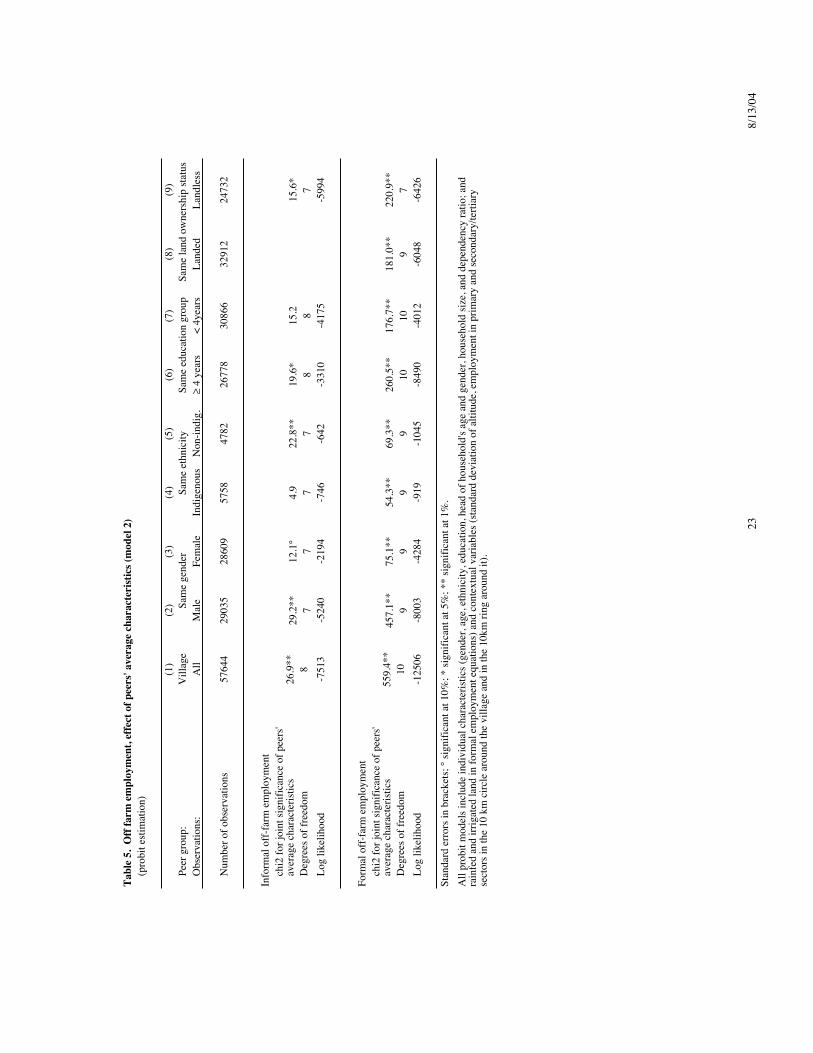
taken into consideration. Table 5 reports the estimation results of the corresponding model 2. It shows
very strong influence of peers’ characteristics, and therefore support for existence of genuine interactions
among peers, for all definitions of peer groups for formal OFNA activities. For informal OFNA activities,
evidence of interactions is more pronounced for men than women, for non-indigenous than indigenous, and
for educated than for non-educated. Thus, we conclude that peer effects are not exclusively proxying for
unobservable individual characteristics that are shared among villagers.
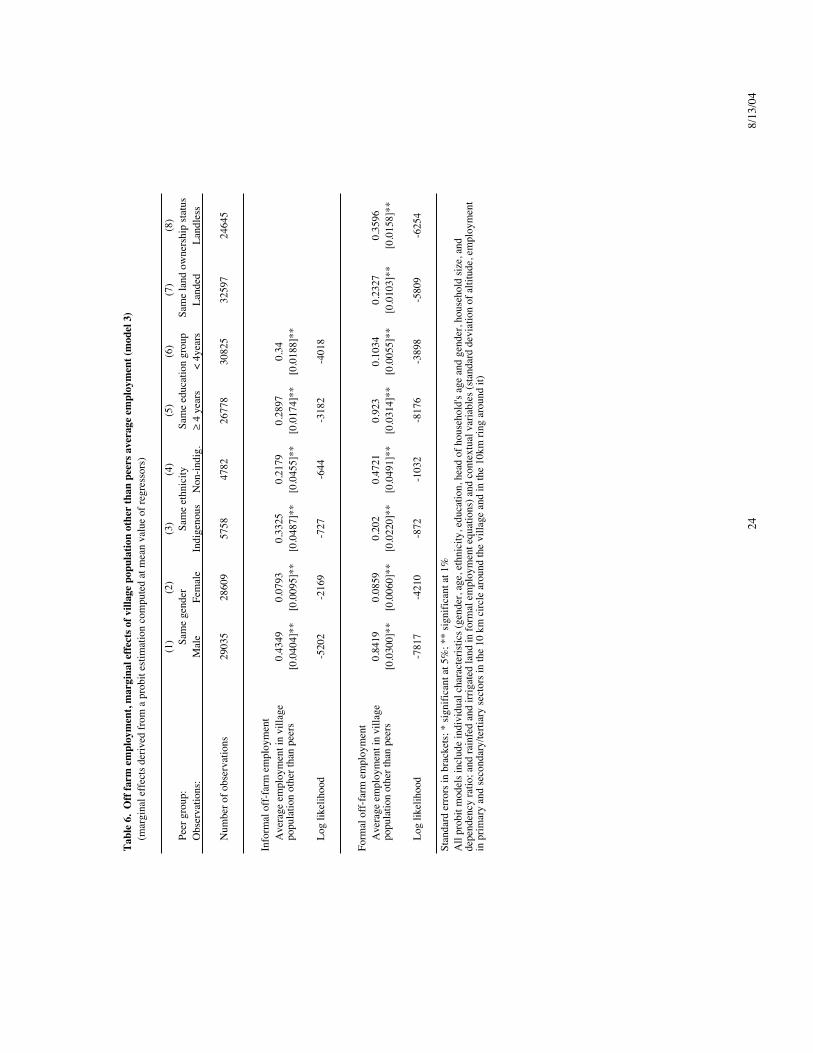
A second source of potential bias could come from unobserved village characteristics. There are
many obvious village attributes such as its distance to an urban center, its infrastructure, etc., that influence
OFNA opportunities. If these were the main source of correlation between peer behaviors, then other non-
peer villagers’ employment choices should also be correlated with this unobserved factor, and hence
“explain” individual behavior. To discard this argument, we estimate model 3, in which we substitute the
peers’ average behavior with the average employment behavior of all villagers other than the peers.
Results are reported in Table 6 for the different definitions of peers. The magnitude of the coefficients is
almost everywhere lower than in model 1, except for two groups (men and educated in formal OFNA
activities) that have much larger values for lg v' than for lgv . The meaningful comparison is, however, on
the partial correlation, and hence on the goodness-of-fit of the model, rather than on the value of the
coefficient. Estimating model 4 that encompasses both model 1 and 3 (results not reported), we find that
we cannot reject model 1 (i.e., ¢ =d 0) at the 5% confidence level, except for 2 of the 14 cases (informal
employment of females influencing male informal employment, and formal employment of the landed
influencing formal employment of the landless), and that ¢d is always a small fraction of d . In contrast,
model 3 is always rejected at the 1% confidence level. Applying the information based selection criteria,
model 1 is always preferred to model 3, as its loglikelihood is higher than that of model 3 in all 14 cases. In
conclusion, we rule out that unobservable village characteristics are all that is driving the significance of
peer effects on occupational choice.
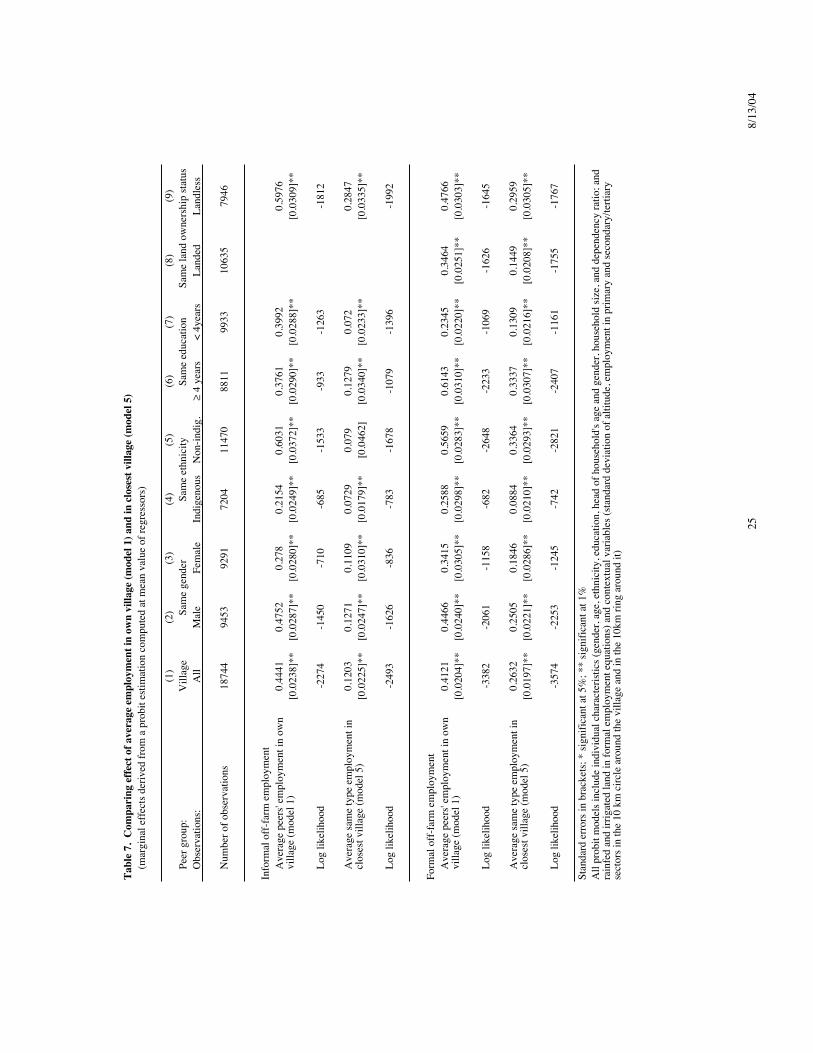
Finally, we test for the possibility that the unobserved factor, source of correlation among peers,
could be an individual type g specific factor. Such shocks would typically come from the labor demand
side, with variation in opportunities for types of jobs that cater to specific groups (such as a maquila
agricultural labor, etc.). Employment opportunities would, however, most likely affect two villages that are
close to each other in the same way. We thus associate to each village its closest neighboring village in the
sample, and only keep in our survey the villages that have a closest neighbor at less than 4kms. This
reduced sample includes 158 villages and 1844 observations. Model 1 is re-estimated on this sub-sample
and compared to model 5 in which we substitute the average behavior of the same type (same gender,
ethnicity, education, or land-ownership status) in the closest village to the average behavior of peers from
the village. Results are reported in Table 7. Comparison of parameters is here meaningful since we are
typically comparing the effect of average employment variables lgv and lgv ¢ that are of the same size.
Parameters are much lower in model 5 than in model 1 for all categories of individuals. Embedding the
two specifications in a model that includes both lgv and lgv ¢ , we reject both models in 4 cases at the 1%
confidence level, and in 5 cases at the 5% confidence level, out of the 17 cases considered (results not
reported). Applying, however, the information based selection criteria, model 1 is always preferred to
model 5, as it has a higher logliklelihood function.
The last exercise consists in measuring for which subgroup of the population is the peer effect
relatively more important than the role of education in gaining OFNA employment. Results are reported in
Table 4. Note that education is not a significant determinant of employment in informal OFNA. Education
is, however, important in determining participation to formal OFNA employment for all types of
individuals. Results show an interesting regularity. The role of education is weaker in helping access
OFNA employment in exactly the groups that are less engaged in OFNA employment and that also have
lower peer effects (female, indigenous, less educated, and smallholders). However, for them, the peer effect
is relatively more important than the role of education in gaining OFNA employment compared to these
relative roles for the more engaged groups (see Ratio parameters (peer/education) in Table 4). Peer effects
are thus relatively more important than educational effects in achieving formal OFNA employment for the
weaker groups on that market. Given the current employment value of education to them, reinforcing the
effectiveness of peer effects can thus be an important instrument to assist them gain greater access to
formal OFNA employment.
17
6. Conclusions
In this paper, we analyzed the role of peer effects in helping rural households access off-farm non-
agricultural employment, a proven effective instrument in reducing rural poverty. We used village census
data for Mexico, combined with village-level population census data and GIS constructed variables. We
established that peer effects are important, and rejected the possibility that they can be proxying for
unobserved individual (model 2), village-level (model 3), or individual type (model 4) effects. We found
the following results (model 1):
1) Inside one’s own village, an individual’s peer effects are structured by similarities in gender,
ethnicity, education, and land endowment. Individuals are strongly influenced in their participation to
OFNA employment by the degree of participation of their peers. These effects are larger for informal than
for formal employment. For informal employment, the magnitude of these effects is similar across peer
groups, except for women for whom they are lower.
2) Marginal peer effects are quantitatively more important for members of groups that already
participate more in formal OFNA employment, and for whom the marginal effect of education is also more
important. These groups are composed of individuals that are male, non-indigenous, more educated, and
landless. However, marginal peer effects are most important relative to the role of education for members
of groups participating less in formal OFNA employment and for whom education is less effective. These
under-privileged groups are composed of individuals that are female, less educated, and smallholders.
These results indicate that, if OFNA employment is to be a key component of rural poverty
reduction strategies, membership in peer groups and the strength of one’s peer group in accessing OFNA
employment are important policy considerations. However, if left to themselves, these social spillover
effects tend to enhance already deep-rooted village inequalities in accessing these jobs. For the weaker
groups, they can be relatively more important than what education buys them in gaining employment.
Hence, understanding better how peer effects work in helping individuals gain access to OFNA
employment, and how to use policy instruments to increase the inclusiveness and effectiveness of peer
groups, are important research subjects to pursue in order to design better performing rural development
strategies.
18
References
Akerlof, G. 1997. “Social Distance and Social Decisions”, Econometrica, 65:5, 1005-1027.
Bertrand, M., E. Luttmer, and S. Mullainathan. 2000. “Network Effects and Welfare Cultures”, Quarterly
Journal of Economics, 115(3), 1019-1055.
Brock, W., and S. Durlauf. 2001. “Interaction-Based Models”, In Handbook of Econometrics, Ed. by
Heckman, J. and Leamer, E., 3297-3380.
Case, A., and L. Katz. 1991. “The Company You Keep: The Effects of Family and Neighborhood on
Disadvantage Youths”, NBER Working Paper No. 3705
Deininger, K. 2003. Land Policies for Growth and Poverty Reduction. Washington D.C.: The World Bank.
Duflo, E., and Saez, E. 2003. “The Role of Information and Social Interactions in Retirement Plan
Decisions: Evidence from a Randomized Experiment”, Quarterly Journal of Economics, 118(3), 815-
842.
Hanushek, E., J. Kain, J. Markman, and S. Rivkin. 2003. “Does Peer Ability Affect Student Achievement”,
Journal of Applied Econometrics, 18(5), 527-544.
Ichino, A., and G. Maggi. 2000. “Work Environment and Individual Background: Explaining Regional
Shirking Differentials in a Large Italian Firm”, Quarterly Journal of Economics, 115(3), 1057-1090.
Ioannides, Y. and J. Zabel. 2003. “Neighborhood Effects and Housing Demand”, Journal of Applied
Econometrics, 18(5), 563-584.
Manski, C. 1993. “Identification of Endogenous Social Effects: The Reflection Problem” Review of
Economic Studies, 60, 531-542.
Munshi, K. 2003. “Networks in the Modern Economy: Mexican Migrants in the U.S. Labor Market”,
Quarterly Journal of Economics, 118(2), 549-599.
Munshi, K., and J. Myaux. 2002. “Development as a Process of Social Change: An Application to the
Fertility Transition”, Unpublished. Department of Economics, University of Pennsylvania.
Reardon, T., J. Berdegué, and G. Escobar. 2001. “Rural Nonfarm Employment and Incomes in Latin
America: Overview and Policy Implications”. World Development 29(3): 395-410.
Sacerdote, B. 2001. “Peer Effects with Random Assignment: Results from Darmouth Roommates”,
Quarterly Journal of Economics, 116(2), 681-704.
Topa, G. 2001. “Social Interactions, Local Spillovers and Unemployment”, Review of Economic Studies,
68(2), 261-295.
World Bank. 2002. Reaching the Rural Poor: An Updated Strategy for Rural Development. Washington
D.C.
World Bank. 2003. Inequality in Latin America & the Caribbean: Breaking with History? Washington
D.C.
Zimmerman, D. 2003. “Peer Effects in Academic Outcomes: Evidence from a Natural Experiment”, The
Review of Economics and Statistics, 85(1), 9-23.
19
Figure 1. Description of the data
Survey villages. In the data, each is the center of a circle.All circles were not drawn in the graph for simplification.Survey village when it is the center of a circle.All other villages in the census not included in the survey.
a. Share of adults within the village, excluding own household members.
**: significantly different from other values in the row at 1%.
Table 2. Occupations of village neighbors
Individual occupation
21
Table 3. Participation in off-farm non-agricultural activities (model 1)(marginal effects derived from a probit estimation computed at mean value of regressors)
(1) (2) (3)Mean value Informal Formal
Peer effect (villagers' occupations)Proportion in informal OFNA 0.029 0.4383
[0.0154]**Proportion in formal OFNA 0.069 0.4095
[0.0105]**
Individual characteristics effect: Age 38.9 0.0004 -0.001