137
PEER REVIEW REPORT Responses to Comments from External Peer Review (Letter) of the FDA/CFSAN iRISK Model and Associated Library of Commodity/Hazard Combinations November 2011

PEER REVIEW REPORT
Responses to Comments from
External Peer Review (Letter) of the FDA/CFSAN iRISK Model and Associated Library of Commodity/Hazard Combinations
November 2011
i
TABLE OF CONTENTS
I. INTRODUCTION…………………………………………………………………………1
II. CHARGE TO THE REVIEWERS……………………………………………………….2
III. SUMMARY OF PEER-REVIEW COMMENTS………………………………………..4
IV. FDA RESPONSES TO INDIVIDUAL REVIEWERS COMMENTS……………….…12
REVIEWER #1................................................................................................................. 13
REVIEWER #2................................................................................................................. 21
REVIEWER #3................................................................................................................. 47
REVIEWER #4................................................................................................................. 75
REVIEWER #5............................................................................................................... 113
V. REFERENCES…………………………………………………………………………….129

1
I. INTRODUCTION The Food and Drug Administration Center for Food Safety and Applied Nutrition (FDA/CFSAN) contracted with Versar, Inc. (Springfield, VA) to conduct an external letter review of the iRISK model and the associated library of commodity/hazard combinations. Included in the peer review was a report that describes the rationale for developing iRISK, the iRISK model structure and programming, data needs, and proof-of-concept testing. This document provides itemized responses to comments provided by five independent peer reviewers to the iRISK model and the associated library and document. Peer Reviewers: Michael B. Batz, M.Sc. University of Florida Gainesville, FL 32610 Robert L. Buchanan, Ph.D. University of Maryland College Park, MD 20742 Margaret E. Coleman, M.S. Coleman Scientific Consulting Cicero, NY 13039 Maarten Nauta, Ph.D. Technical University of Denmark Søborg, Denmark Rebecca T. Parkin, MPH, Ph.D. The George Washington University Medical Center Washington, DC 20037

2
II. CHARGE TO THE REVIEWERS Please provide written responses to the following questions: 1. Is the report clearly written and follow a logical structure and layout? If not, the reviewer
should provide suggestions for how to better document the risk assessment. 2. The iRISK model generates ranking of commodity-hazard pairs through a framework
with two modules – a predictive multistage farm-to-fork process risk module and a hazard characterization module. Is the overall modeling approach fundamentally sound for the risk ranking purpose and scope? If not, what problems exist and how should they be addressed? If other approaches would be more suitable, the reviewer should provide a description and an explanation.
3. The iRISK BETA model structure consists of a number of components in the process risk
module that describes changes in the prevalence and level of a hazard at various process stages. The components include nine choices: no change, increase (growth; for microbial hazards only), increase (addition), decrease, pooling, partitioning, evaporation/dilution, cross-contamination (partial), and cross-contamination (total). 3.1. Are the components in the model adequate to describe major relationships or
outcomes at various process stages for the commodity-hazard pairs? 3.2. Are there additional components that should be incorporated into the model? Is
there any component or function currently in the model that is not necessary and should be omitted? If so, the reviewer should explain how to address such changes in the model.
4. The report describes the functions or equations (Equations 1 through 11) that underlie
exposure assessment and risk characterization in the iRISK model.
4.1. Is there any of the assumptions underlying these functions or equations in the iRISK BETA model unreasonable, according to current modeling and peer-review practices? If so, please explain.
4.2. Are these functions or equations scientifically justified and biologically sound for
the purpose they are used in the model?
4.3. Considering the model provided for the two commodity-hazard pair examples, are the equations or functions accurately implemented in the model? If not, please explain.

3
5. A key feature of iRISK BETA is the ability to compare both chemical and microbial risks. The model reporting allows users to compare risks with different metrics. In addition to a mean risk of illness, the annual DALY is used. With this in mind,
5.1. Comment on the appropriateness of using the annual DALY and the strengths and
limitations of the implementation of this metric in the model. 5.2. Comment on the appropriateness of available options for microbial and chemical
dose response functions in the model and how they are used.
5.3. Overall, are the results generated appropriate for comparing chemical and microbial risks and risk ranking purpose? If not, the reviewer should explain other results and/or analyses that are needed.
6. Given that the primary purpose of iRISK BETA is ranking risk among a number of commodity-hazard pairs, are variability and uncertainty adequately characterized in the model? If not, please explain what changes might be considered to improve characterization of variability and uncertainty.
7. Given the practical constraints of the model and data, a sensitivity analysis option is provided by which the user can specify 5 alternate values for a single parameter in the Process Model, Dose Response Model, or Consumption model, and obtain the ranked results as compared to the original scenario. If this approach is not sufficient, please provide additional or alternative approach(es) and explain what changes might be considered and how they would improve the model.
8. Comment on the iRISK BETA user interface. Is the interface user friendly? Are there any
features that should be modified or added to facilitate ease of use? For example, is there sufficient description in the user interface to understand each component of the model?
9. Comment on the adequacy of the model documentation features within iRISK. Can the
user accurately document data sources and confidence in the model?

4
III. SUMMARY OF PEERREVIEW COMMENTS iRISK is a comparative risk assessment tool that FDA is making available to the public. FDA needs to have a well conceived risk-based strategic approach to accurately compare the public health impact of different foodborne hazards and to identify the intervention and control strategies that will be the most efficacious in reducing those impacts. The purpose of the iRISK tool is to: assess public health impacts for microbial pathogens and chemical hazards; compare food risks at any stage throughout the food supply system; allow on-line sharing of data and models; allow comparisons across many dimensions such as hazards, foods, processing/handling scenarios, and populations; and use a common health metric (e.g., DALY - Disability Adjusted Life Year) to facilitate comparisons between different types of risks or diverse scenarios. iRISK is a highly flexible Web-based tool that allows risk assessors to construct, evaluate and compare food safety-related scenarios that may involve multiple hazards, foods, populations, and exposure pathways. iRISK uses a common public-health metric that takes into account both the number of illnesses and the severity of illness to facilitate broad risk comparisons such as between different microbial pathogens or between a microbial hazard and a chemical hazard. iRISK will be used to assist in the allocation of resources for risk assessments, research, or other food safety-related activities. The peer review of iRISK evaluated the conceptual framework for the model, assessed the usability of its interactive interface, and reviewed example case scenarios. The reviewers provided a number of positive comments on the strengths and merits of iRISK, while also making a number of suggestions for improvements to help ensure robust assessments and sound iRISK results. The reviewers made recommendations for further efforts to expand the iRISK capacity and enhance the user interface, as well as indicating needs for the articulation of risk management questions and systematic data collection. This section provides a summary of comments from all five reviewers, followed by FDA’s response to comments from the individual reviewers. Comments from individual reviewers were itemized and numbered to facilitate specific responses. In some cases where appropriate, responses to some comments were explanations for why changes are not necessary. The majority of the responses focused on activities taken or steps planned to address the reviewers' suggestions for improving and expanding iRISK. I. GENERAL IMPRESSIONS The reviewers were generally in agreement in their overall impressions of the iRISK Model and report. The reviewers commended FDA on their development of a flexible and useful model with excellent potential as a risk assessment tool. One reviewer even noted that iRISK can be used for much more than risk ranking, e.g. teaching purposes and/or simple risk assessments. Another reviewer stated that iRISK represents a major improvement in the development of more structured, transparent, and efficient methodology for microbial risk assessment, as well as an

5
extension of methodology available to FDA for comparing hazards and foods. However, various concerns and shortcomings of the model and document were noted by the reviewers. One reviewer found the routines to build and run scenarios well designed and rapidly implemented, and the outputs (reports) of the two modules (exposure assessment and hazard characterization) excellent with details of scenarios and sensitivity analysis. This reviewer commented, however, that the level of effort in developing and populating iRISK was higher for the exposure module than the hazard characterization module and recommended further development of the hazard characterization module and supporting scientific rationale to minimize incomplete characterization of dose-response assessment. In addition, this same reviewer indicated that, without additional documentation and testing, the current version of iRISK may not generate reliable results, which may affect the allocation of resources to improve food safety and the identification of high risks that merit a more in-depth quantitative risk assessment. While noting the benefits of using a web interface, one reviewer found iRISK to be complicated enough to require training, which could negate the benefit of using a web interface. This same reviewer found the user interface very difficult to navigate because of the use of both panes and pop-ups in addition to folders that do not nest as expected. This is in contrast to another reviewer who found the website to be user-friendly, clearly structured, and easy to navigate. Recommendations for the website included the use of visual cues, improved nesting of folders, more complete citations with hyperlinks, and the development of a “help” section. In regard to the documentation, one reviewer commented that the report was clearly organized and well-written, with only minor editing needed. Another reviewer noted that Chapter 4 appeared to be written independently from the rest of the report and that better integration of Chapters 2 and 4 was needed. This reviewer also stated that an explanation of why iRISK is specifically suited for risk ranking needs to be added to the report and noted several references which should be added. One reviewer commented that the accuracy and clarity of the documentation are greater for the exposure module than the hazard characterization module. The documentation about dose-assessment and the libraries of published dose-response models are incomplete. One reviewer raised the issue of whether iRISK was a powerful tool for risk ranking. The issue is the question: “How large should a difference in risks (DALYs) be to conclude that one ranks higher than another?” Another reviewer also questioned the model’s role in decision making since FDA does not appear to have a good understanding, at this time, of how iRISK is to be used. One reviewer was concerned with the authors’ acknowledgement that technical expertise and resource requirements needed to use iRISK are substantial, both for populating libraries and training analysts to use them. Several of the reviewers noted that their reviews were limited since the model is currently focused on microbial hazards.

6
II. COMMENTS IN RESPONSE TO CHARGE QUESTIONS 1. Is the report clearly written and follow a logical structure and layout? If not, the reviewer should provide suggestions for how to better document the risk assessment. The majority of the reviewers agreed that the report was clearly written and logically organized (although one reviewer felt this applied to experienced risk assessment modelers only), but they did have suggestions on how to strengthen the document. For example, one reviewer suggested drawing more attention to the assumptions and including citations to support the major assumptions and choices, and to support the “classic microbial risk assessment paradigm.” Another reviewer recommended adding more background information on the components of the model structure, adding an incidence number, and providing a bar chart with the assessed DALYs that are the basis for the risk ranking. One reviewer recommended either significantly expanding the introduction or creating a new chapter to provide details on addressing the risk management questions and using the model results in the decision making process. More critical was the reviewer who felt that the structure of the report was incomplete and imbalanced with regard to hazard characterization and suggested adding additional documentation to the body of the report as well as the appendices. 2. The iRISK model generates ranking of commodity-hazard pairs through a framework with two modules – a predictive multistage farm-to-fork process risk module and a hazard characterization module. Is the overall modeling approach fundamentally sound for the risk ranking purpose and scope? If not, what problems exist and how should they be addressed? If other approaches would be more suitable, the reviewer should provide a description and an explanation. Two of the reviewers found the overall approach fundamentally sound for the risk ranking purpose and scope. One of these reviewers, however, did note that other approaches may be feasible as well, such as a source attribution method that can be applied to identify the most important source of a pathogen. The other reviewers had concerns with the approach. One reviewer commented that the overall approach for the two modules merits further analysis to determine if the results are fundamentally sound. This reviewer felt that the exposure assessment module was generally well-designed and sound; however, the assumption that hazards are uniformly distributed in foods is unlikely to be true, particularly for microbial pathogens. More problematic to this reviewer was assessing the soundness of the hazard characterization module. Another reviewer had three concerns with the modeling approach that may require additional features in the model and further explanation in the user manual. The first was the Monte Carlo capabilities of the software, in regard to the number of iterations that should be run. The ability to estimate the number of iterations needed based on the values inputted would be of great benefit to the user. The second concern was that iRISK limits the user to a commodity-hazard pair which may lead to an underestimation of the relative risk associated with a commodity. Lastly, this reviewer was concerned with the risk associated with chronic exposure to chemical hazards or naturally occurring toxins and was not sure if a probabilistic approach is warranted if exposure over a 70 year lifetime had to be constructed.

7
Another reviewer noted that the lack of clarity regarding the risk ranking purpose and scope made it difficult to evaluate whether iRISK answered all of the questions for which it was designed. The reviewer further stated that the overall multi-module approach was fundamentally sound as a preliminary risk assessment tool and should allow for more rapid risk assessments. However, the interface between science and policy was a great weakness. An alternative approach to the one used in iRISK is an approach that works “backwards” from illness incidence data to estimate proportional burden due to specific hazard-commodity pairs. Despite the limitations of the alternative approach (e.g. suitable only for pathogens), the reviewer felt that the alternative approach may offer important information to FDA in prioritization decisions. 3. The iRISK BETA model structure consists of a number of components in the process risk module that describes changes in the prevalence and level of a hazard at various process stages. The components include nine choices: no change, increase (growth; for microbial hazards only), increase (addition), decrease, pooling, partitioning, evaporation/dilution, cross-contamination (partial), and cross-contamination (total). 3.1. Are the components in the model adequate to describe major relationships or outcomes at various process stages for the commodity-hazard pairs? For the most part, the reviewers found the components of the model to be adequate for describing the major relationships and outcomes at various stages. One reviewer stated that “generally, the components are well designed, run rapidly, and generate excellent reports documenting details of scenarios as well as predicted results.” Several suggestions were made including: addition of processes dealing with non-homogenous distributions of microorganisms; revision of how the model deals with concentrations < 1 cfu/unit; development of more comprehensive health case studies; consideration of biofilms and the interactions between pathogens and indigenous microflora of non-sterile foods; addition of example models to address concerns regarding on-farm contamination and food handling/preparation problems; addition of specific examples of each of the cross-contamination options; and discussion on how iRISK could be used to determine failure mode risks. 3.2. Are there additional components that should be incorporated into the model? Is there any component or function currently in the model that is not necessary and should be omitted? If so, the reviewer should explain how to address such changes in the model. All but one of the reviewers made suggestions regarding the incorporation of additional components into the model. One reviewer suggested adding the capability of modeling complete removal by making it a separate process called “prevalence decrease.” This same reviewer also suggested adding “selective removal,” where positive food products are removed from the process, and “transfer,” a type of cross-contamination. Other components and/or functions suggested as additions to the model include the following: on-farm production processes; food preparation and handling; stochastic impacts to prevalence and levels; spatial distribution of hazard within product; and failure mode determinations. 4. The report describes the functions or equations (Equations 1 through 11) that

8
underlie exposure assessment and risk characterization in the iRISK model. 4.1. Is there any of the assumptions underlying these functions or equations in the iRISK BETA model unreasonable, according to current modeling and peer-review practices? If so, please explain. In general, the majority of the reviewers found the assumptions underlying the functions or equations in the iRISK model to be reasonable. However, several concerns were raised. One reviewer stated that while the assumptions are the best options for statistical modeling purposes, they do not necessarily reflect real-world conditions. Another reviewer questioned how realistic the assumption of homogeneously distributed particles and independence of food units within and between stages was, while noting that in many situations it would be a reasonable simplification. This same reviewer also questioned the use of the Central Limit Theorem for pooling and commented on the need for examples to clarify the type of process described by the cross-contamination equations. One reviewer took issue with the rationale provided in the report for Equation 1. This same reviewer also found the discussion of dose-response models lacking insight into the design of the software and supporting scientific rationale. Specific concerns noted include the lack of discussion on the dose-dependent severity and the limitations of predicting illness or death from surrogates of infection from existing datasets, as well as the lack of clarity on how cancer and non-cancer endpoints will be compared with acute effects for microbial hazards. Also noted was the observation that model uncertainty was not acknowledged in the report or the iRISK user interface. The reviewer suggested that FDA consider linking additional analytical tools or adding a diverse array of empirical model forms to the drop down menus to increase transparency and consistency of the current approach.
4.2. Are these functions or equations scientifically justified and biologically sound for the purpose they are used in the model? Again, the majority of the reviewers found the functions or equations scientifically justified and biologically sound for use in the model. Suggestions provided by these reviewers include improved clarity and additional citations. One reviewer, as noted previously, took issue with the lack of evidence in supporting a sound biological basis for the hazard characterization module and Equation 1. 4.3. Considering the model provided for the two commodity-hazard pair examples, are the equations or functions accurately implemented in the model? If not, please explain. While several reviewers agreed that the equations/functions were accurately implemented, some reviewers had concerns regarding their implementation. One reviewer created a hypothetical Risk Scenario to test the tool and simulated the same model in @Risk to verify iRISK. A potential problem arose in the cross-contamination modeling, where the reviewer was unable to reconstruct some of the values. Another reviewer noted that the accuracy is unknown for the hazard characterization module and Equation 1.

9
5. A key feature of iRISK BETA is the ability to compare both chemical and microbial risks. The model reporting allows users to compare risks with different metrics. In addition to a mean risk of illness, the annual DALY is used. With this in mind, 5.1. Comment on the appropriateness of using the annual DALY and the strengths and limitations of the implementation of this metric in the model. All of the reviewers commented on the strength and limitations of using the annual DALY in the model. One reviewer had no issues with using the DALY as a comparative tool in the risk assessment, but noted that the DALY is only as good a metric as the data and assumptions on which it is based. This same reviewer recommended evaluating the relevance of the Kemmeren et al. 2006 data to the U.S. context and suggested including a discussion of the strengths and limitations of using this and other data as sources for the DALY estimates. Another reviewer commented that the DALY is a metric that is increasingly being used and one that appears to be useful for the comparison of very different hazards and risks. However, this reviewer recommended that other metrics (e.g., human incidence of illnesses, costs) be included (optional) in the model, as well as some guidance on what to do if the information needed to estimate the DALY is unavailable. One reviewer stated that they could not answer this question due to the lack of an example chemical calculation at this time. Multiple hazards cannot be examined meaningfully and foods cannot be ranked for “total hazards” to determine which commodities are the riskiest. Overall, observed strengths of using the DALY included the clarity and transparency of the definitions and the soundness of the mathematics behind it, as well as the rapidity of analysis for those agents with DALY templates. Likewise, noted limitations included the following: the subjectivity of a metric that depends on assumptions; the difficulty in comparing long-term and short-term risks and risk for different subpopulations; the lack of characterization of the dose-dependencies of disease severity; the uncertainty of representativeness of DALYs for U.S. populations; and the lack of transparency for use in regulatory decisions.
5.2. Comment on the appropriateness of available options for microbial and chemical dose response functions in the model and how they are used. The reviewers’ responses to this question were limited to the microbial dose-response functions. In general, the reviewers found the available options for the microbial dose-response functions in the model to be appropriate. One reviewer suggested including a threshold model as an option. Another reviewer stated that the documentation for assessing dose-response relationships was incomplete, and that the dose-response options needed expansion and integration across microbial and chemical hazards. Better guidance to users on selecting the most appropriate model, especially for non-risk assessors, was also suggested by one reviewer. 5.3. Overall, are the results generated appropriate for comparing chemical and microbial risks and risk ranking purpose? If not, the reviewer should explain other results and/or analyses that are needed.

10
The reviewers’ comments were limited to microbial risks, although several reviewers did comment that, conceptually, the modeling approach should allow for ranking of chemical risks. One reviewer found the results comparing microbial risks reasonable and likely accurate enough for risk comparison purposes. Another reviewer stated that it had not been shown that iRISK could be used for risk ranking, although this may be due to a difference in defining “risk ranking.” The inclusion of more extensive case studies was recommended by a third reviewer to determine the impact on risk ranking for multiple datasets. Additional recommendations on the model output reports were suggested such as outputting the results into an editable file, adding the capability of saving model results and data, and connecting a report to an existing model. 6. Given that the primary purpose of iRISK BETA is ranking risk among a number of commodity-hazard pairs, are variability and uncertainty adequately characterized in the model? If not, please explain what changes might be considered to improve characterization of variability and uncertainty. All of the reviewers took issue with the characterization of variability and uncertainty in the model, particularly uncertainty, which the majority of the reviewers felt was not characterized in the model. Several reviewers suggested doing a sensitivity analysis to allow for simplified explorations of probabilistic uncertainties for certain parameters. One reviewer suggested clarifying to the user that the distributions in the process model and the Monte Carlo simulation all deal with variability only and suggested not allowing the user to define the initial concentration as a fixed value. Another reviewer stated that the limited ability to model uncertainty and variability in two dimensions might impact the utility of iRISK for regulatory impact assessments or “large-scale” risk assessments, but that for preliminary risk assessments and prioritization, the ability to conduct limited sensitivity analyses should be sufficient. Another reviewer found that while variability and uncertainty are not fully characterized in the current version of iRISK, the tool has great utility. Depending on the future use of iRISK, this reviewer suggested that additional programming for characterizing variability and uncertainty may not be needed. 7. Given the practical constraints of the model and data, a sensitivity analysis option is provided by which the user can specify 5 alternate values for a single parameter in the Process Model, Dose Response Model, or Consumption model, and obtain the ranked results as compared to the original scenario. If this approach is not sufficient, please provide additional or alternative approach(es) and explain what changes might be considered and how they would improve the model. The majority of the reviewers found the sensitivity analysis option, which allows the user to specify 5 alternate values for a single parameter, to be sufficient. In fact, one reviewer found it more than sufficient since a user can relatively easily run another risk scenario or export the design of the model to a more advanced program. A reviewer found the choice of 5 alternate values highly arbitrary. A number of improvements were suggested by the reviewers and include: the addition of a qualitative/semi quantitative scoring method to address the perceived confidence in the results of the different models and assumptions; the development of additional

11
case studies to evaluate the sufficiency of the current approach for decision support on risk ranking; the addition of the ability to vary two parameters at a time to avoid the user having to create numerous duplicate models to evaluate interactions between variables; and the addition of the ability to input into the model a set parameters from a separate file. 8. Comment on the iRISK BETA user interface. Is the interface user friendly? Are there any features that should be modified or added to facilitate ease of use? For example, is there sufficient description in the user interface to understand each component of the model? While some of the reviewers found the interface to be generally well-designed and user friendly, other reviewers found the interface to be somewhat challenging for the average user and suggested developing a user-friendly training manual for non-risk assessors. One reviewer was critical of the user interface and found it very difficult to navigate due to the use of both panes and pop-ups, as well as the nesting of the folders. A number of additions and/or modifications were suggested by the reviewers including: the use of visual representations (e.g. graphs); the linkage of other analytical tools or procedures to import data and models; the addition of a searchable glossary and bibliography; the addition of a section on tips or FAQ; the inclusion of more structured detail on supporting studies; the addition of guidance or menu options for assessing the impact of model uncertainty, correlation of parameters, and dose-dependent severity; the addition of background information on the model components and mathematical equations; and a revised scheme of organization for the folders. 9. Comment on the adequacy of the model documentation features within iRISK. Can the user accurately document data sources and confidence in the model? Overall, the reviewers found the model documentation features to be sufficient. This was especially true in regard to the accurate documenting of data sources. One reviewer found the model documentation in the scenario summary reports to be excellent for the exposure module, but found documentation in the hazard characterization module lacking. Another reviewer suggested the addition of a global reference list that would link directly to external websites (e.g. PubMed), as well as the addition of broader documentation features that would allow, for example, a user to group and track risk scenarios. The reviewers had larger issues with documenting confidence in the model. Two reviewers noted that “confidence” was not addressed in the user guide. Suggestions included adding “best practice” and “validation” to the user guide.
12
IV. FDA RESPONSES TO INDIVIDUAL REVIEWERS COMMENTS

13
REVIEWER #1 I. GENERAL IMPRESSIONS [COMMENT 1-1] The report titled “Public Health Risk Assessment for FDA-Regulated Commodity/Hazard Combinations Using Risk Ranking Methodology and Tools” is clearly organized and well-written. This reviewer particularly appreciated the authors’ explicitly noting assumptions; e.g., in the format presented on page 35 in Section 2.4.4 and following sections. In fact, this reviewer preferred this style of drawing attention to assumptions over the use of bolded “assumption” in some sentences (e.g., on page 33). In many cases, however, assumptions were not bolded or otherwise highlighted. This reviewer recommends consistent practice in drawing the reader’s attention to assumptions, particularly those most likely to affect the quantitative modeling results. This reviewer did not find any obvious technical errors. Although some rationales could be more fully explained and supported, the conclusions appear sound and consistent with the documentation provided. Some minor editing is needed, as noted below in III. RESPONSE: We agree with the reviewer that it is desirable to draw attention to assumptions. The iRISK report has been revised to highlight the assumptions consistently throughout the chapter on model structure and programming. [COMMENT 1-2] Generally, the website is user-friendly; it is clearly structured and easy to navigate. The options are reasonable, although they were limited at the time of this review. More complete citations are needed for some references and links should be provided whenever available. The links provided opened to the documents cited, which was helpful to this user. One option to consider is setting up a webpage listing all citations with their hyperlinks. RESPONSE: A list of all citations has been compiled. We plan to upload the list as a webpage of the iRISK online tool and plan to expand the list while more references are being added to iRISK in the future. II. RESPONSE TO CHARGE QUESTIONS 1. Is the report clearly written and follow a logical structure and layout? If not, the reviewer should provide suggestions for how to better document the risk assessment. [COMMENT 1-3] The report is clearly written and logically organized. One suggestion this reviewer would make is to draw more attention to the assumptions; e.g., as in Section 2.4.4. Another recommendation
14
is to support “the classic microbial risk assessment paradigm” on page 26 with a citation; there are several microbial pathogen risk assessment frameworks in the literature so it is not obvious which one the authors view as the “the classic” one. RESPONSE. We have revised the phrase to "the Codex risk assessment paradigm" and provided two citations (CAC, 1999 and 2007). [COMMENT 1-4] Finally, citations supporting at least the major choices and assumptions would strengthen the document. RESPONSE. We have provided references for selected equations and assumptions (e.g., ILSI, 2010; Nauta, 2008). 2. The iRISK model generates ranking of commodity-hazard pairs through a framework with two modules – a predictive multistage farm-to-fork process risk module and a hazard characterization module. Is the overall modeling approach fundamentally sound for the risk ranking purpose and scope? If not, what problems exist and how should they be addressed? If other approaches would be more suitable, the reviewer should provide a description and an explanation. Yes, the model approach appears to be sound for the risk ranking purpose and scope intended. This reviewer did not find any fundamental problems with the approach, but refers the reader to comments under 5.1 for consideration. RESPONSE. We appreciate the comment. See additional response under 5.1. 3. The iRISK BETA model structure consists of a number of components in the process risk module that describes changes in the prevalence and level of a hazard at various process stages. The components include nine choices: no change, increase (growth; for microbial hazards only), increase (addition), decrease, pooling, partitioning, evaporation/dilution, cross-contamination (partial), and cross-contamination (total). [COMMENT 1-5] Yes, they are adequate for describing major relationships and outcomes at various stages. This reviewer did not find any problems with the components, but the word “partial” is not used in the drop-down options. Clarifying that “cross-contamination” is “partial” would be helpful to the user. This reviewer did not identify any other components that should be included or deleted for the processes currently included in the model.

15
RESPONSE. We agree. Clarification for partial versus total cross-contamination is currently provided in the user manual. We plan to add the word "partial" to the drop-down menu s suggested. 4. The report describes the functions or equations (Equations 1 through 11) that underlie exposure assessment and risk characterization in the iRISK model. [COMMENT 1-6] The assumptions are not unreasonable, although they do not necessarily reflect the range of real-world conditions. They are the best options, however, for statistical modeling purposes.
The functions and equations appear to be scientifically justified and biologically sound for use in the model. Although they are not supported explicitly with citations, they fit with widely accepted knowledge. Section 2 of the report could be strengthened by adding citations for the bases of these equations. RESPONSE. The equations were developed through an expert panel process (Newsome, 2009) as well as by using knowledge in published literature (e.g., ILSI, 2010; Nauta, 2008). We have added citations for the basis of the equations as suggested. [COMMENT 1-7] This reviewer is not deeply familiar with the two examples, but the modeling seems to be reasonable. It is not clear, however, which subtype/s of aflatoxin was/were modeled. Page 81 of the report suggests that B1 data may have been used, but Table D-2 should clearly indicate for which subtypes data were available for use here. Is the reader looking at all B1 data or a mixture of subtype data? RESPONSE. The data in Table D-2 represent a mixture of aflatoxins, not a particular type such as aflatoxin B1. Additional information has been added to the report and the related scenario in the iRISK library. 5. A key feature of iRISK BETA is the ability to compare both chemical and microbial risks. The model reporting allows users to compare risks with different metrics. In addition to a mean risk of illness, the annual DALY is used. With this in mind, 5.1. Comment on the appropriateness of using the annual DALY and the strengths and limitations of the implementation of this metric in the model. 5.2. Comment on the appropriateness of available options for microbial and chemical dose response functions in the model and how they are used. 5.3. Overall, are the results generated appropriate for comparing chemical and microbial risks and risk ranking purpose? If not, the reviewer should explain other results and/or analyses that are needed.

16
[COMMENT 1-8] Although the metric still has its detractors, this reviewer is not opposed to its use as a comparative tool here. That said, the DALY is only as a good a metric as the data and assumptions on which it is based and their relevance to the context in which the DALY will be used. The website indicates that Kemmeren et al., 2006 (a RIVM report) was the source for all DALY estimates. There are many assumptions stated in that thorough report on Dutch infectious disease cases, treatment and outcomes. What is not evaluated by the iRISK authors is the relevance of these data to the USA context. For example, there is wide variation in health care access in the USA that may be less of an issue in The Netherlands. If visiting a General Practitioner (GP) is a key component determining severity and costs, then a discussion is warranted to help the reader understand how accessing GPs in The Netherlands is or is not comparable to accessing health care providers in the USA. How relevant are the Dutch data to the USA context? Are the DALY estimates likely to result in appropriate risk rankings for USA purposes? The report would be strengthened by including a discussion of the merits and limitations of the Kemmeren et al. (2006) source for the DALY data. If other sources of DALY data were considered, mention of their limitations compared to Kemmeren et al. would help the user. RESPONSE. We concur with the reviewer that the relevance of the DALY as a public health metric depends on the data and assumptions upon which it is based. We are aware that DALY developed based on data and assumptions in one country may not be relevant to another country. The DALY template in iRISK is provided as a reference; additional description has been provided in the iRISK report to clarify the purpose and to acknowledge that there are other metrics that may be used, such as Quality Adjusted Life Year (QALY) and cost-of-illness (Batz et al., 2011; ERS, 2010). We plan to revise or develop DALY templates using data specific to the U.S. where available. In addition, we plan to add or provide linkage to other options such as QALY and cost-of illness in a future version of iRISK. [COMMENT 1-9] The beta Poisson and exponential models are well-accepted and thus are reasonable choices for the pathogens listed. This reviewer did not find the functions for chemicals. RESPONSE. We appreciate the comment. [COMMENT 1-10] This reviewer did not run chemical risks; these appear to be absent from the test model. The results comparing microbial risks appeared to be reasonable and are likely accurate enough for risk comparison purposes. This conclusion was made with greater confidence after reading the details provided in the summary reports. RESPONSE. We appreciate the comment. We recognize that there was a limitation in the peer review in that a risk scenario for a chemical hazard was not provided for review. However,

17
mathematical functions and equations underlying exposure assessment and risk characterization for both chemical and microbial hazards were provided for review. While the initial focus of the iRISK development was on microbial hazards, we plan to continue developing the iRISK tool with more efforts on chemical hazards in the future. 6. Given that the primary purpose of iRISK BETA is ranking risk among a number of commodity-hazard pairs, are variability and uncertainty adequately characterized in the model? If not, please explain what changes might be considered to improve characterization of variability and uncertainty. [COMMENT 1-11] This reviewer found discussion of uncertainty and variability acceptable in the report, but not in the pdf summary reports. Both aspects of the modeling could be better captured on the printout, either in graphic or textual form. Neither uncertainty nor variability is obvious to the reader of the summary reports; these are important characteristics to present clearly for informing decision processes. RESPONSE. We plan to provide a description in the iRISK user manual to indicate that the range of values (or a distribution of values) for inputs in a risk scenario represents variability, and that the summary report (e.g., the pdf summary report) shows variability only. Furthermore, we plan to indicate in the user manual that, although there is no explicit simulation of uncertainty within iRISK, uncertainty can be explored by using the Sensitivity Analysis option in the tool. A recommendation will be made in the user manual to remind users to note the difference in variability and uncertainty in communicating iRISK results. We also plan to provide graphic presentation of the variability of selected input and output parameters in the next phase of iRISK development. 7. Given the practical constraints of the model and data, a sensitivity analysis option is provided by which the user can specify 5 alternate values for a single parameter in the Process Model, Dose Response Model, or Consumption model, and obtain the ranked results as compared to the original scenario. If this approach is not sufficient, please provide additional or alternative approach(es) and explain what changes might be considered and how they would improve the model. [COMMENT 1-12] Note that the current website says that 6, not 5, alternate values can be specified. This approach will generally be sufficient. However, this reviewer found that the iRISK user manual (v 3.0 beta) examples did not match with the website. This discontinuity may delay or confuse users when they want to implement a sensitivity analysis. RESPONSE. In the sensitivity analysis option in the iRISK version presented for peer review, the total number of values is 6. Peer-review question 7 was intended to indicate that 5 values can be

18
specified as alternatives to the current input (i.e., a total of 6). The website says "Enter up to 6 values. The current value is added by default...," which is consistent with the description in the user manual (v.3.0 beta) that says up to 6 values, in total, can be specified. 8. Comment on the iRISK BETA user interface. Is the interface user friendly? Are there any features that should be modified or added to facilitate ease of use? For example, is there sufficient description in the user interface to understand each component of the model? [COMMENT 1-13] The interface is user friendly. However, this reviewer was not able to define a new consumption model and therefore could not fully test a new example. RESPONSE. This problem has been fixed and a user can now define a new consumption model. [COMMENT 1-14] Generally there is enough description, but working with the interface is necessary to see how it functions. The training manual is an important support tool, providing context and guidance not available on the iRISK website. Table 1 in the report is a bit misleading; it lists hazards that are not yet in the iRISK site. RESPONSE. Table 1 in the report is intended to show how hazards are categorized in iRISK, not to be a list of hazards for which risk scenario development has been completed on the iRISK website. We have added a sentence in the report to further clarify this point. 9. Comment on the adequacy of the model documentation features within iRISK. Can the user accurately document data sources and confidence in the model? [COMMENT 1-15] This reviewer found the documentation capabilities of iRISK to be sufficient for the user to accurately document data sources. Documenting confidence is much more complex; an example of what the authors feel would be “best practice” for this aspect would be a good addition to the user manual. Currently, there is no mention of “confidence” in the guide. RESPONSE. We concur with the reviewer that documenting confidence is complex. In the next phase of iRISK development, we plan to identify guidance or publications in the literature on "best practice" and provide a link to the reference(s) to users. [COMMENT 1-16] III. SPECIFIC OBSERVATIONS ON THE DOCUMENT

19
Page Line Comment
P. 11 Section 1.2.1, 2nd paragraph, 2nd line
“is be” needs correction.
P. 25 Section 1.7
The bullets are not grammatically consistent.
P. 31 Figure 10 Color is not necessary. The shapes are sufficient to distinguish user input from model output.
P. 75 2nd to last full line
“weeks” is used twice; eliminate one.
P. 83 Table B-4 “Tbale” needs correction. Also, I suggest adding “subtypes” after “Aflatoxin” in the column heading.
P. 84 Health Effects
This section repeats the “Symptoms” section above it. Some revision here would be helpful.
P. 91 2nd line of “Notes”
“present the milk” needs editing.
RESPONSE. We have revised the text on the related pages according to the reviewer's suggestion. [COMMENT 1-17] IV. SPECIFIC OBSERVATIONS ON THE iRISK MODEL
URL/Steps to get to URL Comments http://www.explorerisk.com/iRISK/MyRepository/Default.aspx?RepositoryID=facf56bb-8fea-449c-981e-086463d0de66
This reviewer was unable to input a new consumption model. “New model” button said to select from the existing list. RESPONSE. This issue has been resolved and the user can now define a consumption model, which requires that the user first choose a pre-defined food or define a food.
http://www.explorerisk.com/iRISK/MyRepository/EditDALYTemplate.aspx?DALYTemplateID=6ea88350-4973-4af4-88f5-e2794fa8afce&RepositoryID=dfbfc1f0-5a70-4ea6-a927-6c75eef4dfbd&RefreshParent=r_dt_
In the description of the Health Endpoints for the elderly affected by Listeriosis, there is no citation for the data. RESPONSE. Two references were in fact provided. These references are provided in the "Reference/Rationale" field of the "Health Endpoints" folder.
20
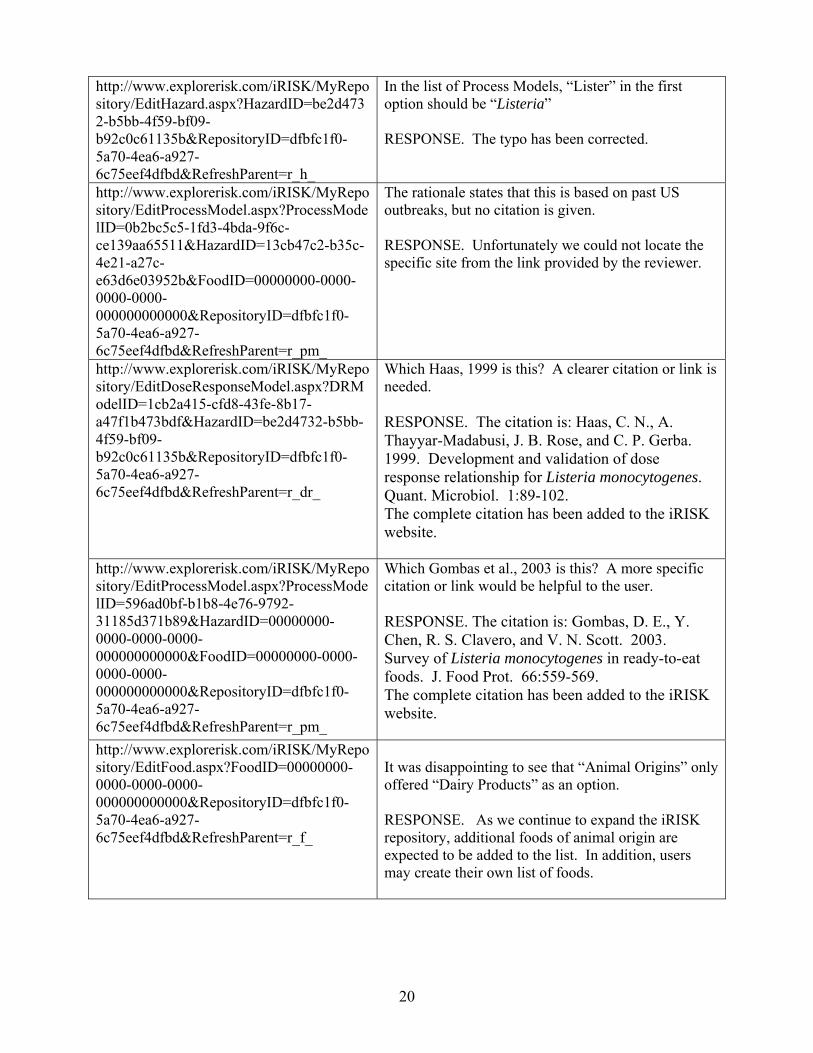
http://www.explorerisk.com/iRISK/MyRepository/EditHazard.aspx?HazardID=be2d4732-b5bb-4f59-bf09-b92c0c61135b&RepositoryID=dfbfc1f0-5a70-4ea6-a927-6c75eef4dfbd&RefreshParent=r_h_
In the list of Process Models, “Lister” in the first option should be “Listeria” RESPONSE. The typo has been corrected.
http://www.explorerisk.com/iRISK/MyRepository/EditProcessModel.aspx?ProcessModelID=0b2bc5c5-1fd3-4bda-9f6c-ce139aa65511&HazardID=13cb47c2-b35c-4e21-a27c-e63d6e03952b&FoodID=00000000-0000-0000-0000-000000000000&RepositoryID=dfbfc1f0-5a70-4ea6-a927-6c75eef4dfbd&RefreshParent=r_pm_
The rationale states that this is based on past US outbreaks, but no citation is given. RESPONSE. Unfortunately we could not locate the specific site from the link provided by the reviewer.
http://www.explorerisk.com/iRISK/MyRepository/EditDoseResponseModel.aspx?DRModelID=1cb2a415-cfd8-43fe-8b17-a47f1b473bdf&HazardID=be2d4732-b5bb-4f59-bf09-b92c0c61135b&RepositoryID=dfbfc1f0-5a70-4ea6-a927-6c75eef4dfbd&RefreshParent=r_dr_
Which Haas, 1999 is this? A clearer citation or link is needed. RESPONSE. The citation is: Haas, C. N., A. Thayyar-Madabusi, J. B. Rose, and C. P. Gerba. 1999. Development and validation of dose response relationship for Listeria monocytogenes. Quant. Microbiol. 1:89-102. The complete citation has been added to the iRISK website.
http://www.explorerisk.com/iRISK/MyRepository/EditProcessModel.aspx?ProcessModelID=596ad0bf-b1b8-4e76-9792-31185d371b89&HazardID=00000000-0000-0000-0000-000000000000&FoodID=00000000-0000-0000-0000-000000000000&RepositoryID=dfbfc1f0-5a70-4ea6-a927-6c75eef4dfbd&RefreshParent=r_pm_
Which Gombas et al., 2003 is this? A more specific citation or link would be helpful to the user. RESPONSE. The citation is: Gombas, D. E., Y. Chen, R. S. Clavero, and V. N. Scott. 2003. Survey of Listeria monocytogenes in ready-to-eat foods. J. Food Prot. 66:559-569. The complete citation has been added to the iRISK website.
http://www.explorerisk.com/iRISK/MyRepository/EditFood.aspx?FoodID=00000000-0000-0000-0000-000000000000&RepositoryID=dfbfc1f0-5a70-4ea6-a927-6c75eef4dfbd&RefreshParent=r_f_
It was disappointing to see that “Animal Origins” only offered “Dairy Products” as an option. RESPONSE. As we continue to expand the iRISK repository, additional foods of animal origin are expected to be added to the list. In addition, users may create their own list of foods.

21
REVIEWER #2 I. GENERAL IMPRESSIONS [COMMENT 2-1] My general impression is that iRISK is a very useful and well developed tool. It has a logical structure and builds on the basic elements of risk assessment. For a user with experience in risk assessment, it is easy to use. For a user without such experience, it may be difficult, but it should be like that just because you shouldn’t do risk assessment without proper training/experience. The documentation is clear; I experienced little problems when exploring the model. I actually hope it will be released soon, because I think it has some merits that do not directly follow from its primary purpose, a tool for risk ranking. It can be useful for teaching purposes, d can be very useful to explore risks associated with certain foods/pathogens when a fast risk assessment is required, and can serve as a basis for a more elaborate risk assessment. I would encourage you to focus not too much on using the tool for risk ranking only; the tool is much better than that. As for the document, Chapter 4 seems to be written independently from the remainder of the document. It describes the process of data collection and the problems encountered when doing so, but to me it seems that this data collection was not guided by the needs of the iRISK model. RESPONSE. We appreciate the comment. The data collection described in Chapter 4 was guided by data needs for the proof-of-concept testing of iRISK and by data needs for commodity-hazard pairs of initial interest to FDA. This information has been added to the introduction of Chapter 4 for clarification. [COMMENT 2-2] I recognize this as a recurrent problem in risk assessment, but, nonetheless, the document would benefit from a better integration of Chapters 2 and 4. RESPONSE. Chapters 2 and 4 served different purposes: Chapter 2 described the iRISK model structure and programming, while Chapter 4 described an example of how data input can be obtained to populate iRISK. We have added additional description to Chapter 4 to better link the two Chapters. [COMMENT 2-3] What I specifically miss in the document are the following: 1) An explanation why the tool is considered to be specifically suited for risk ranking and not for other purposes; and

22
RESPONSE. Although FDA's initial objective was primarily to develop a robust risk ranking tool, through beta-testing and the peer review process it has become apparent that iRISK can also become a valuable tool to enable rapid risk assessments. [COMMENT 2-4] 2) References to previous work on which the concepts applied in iRISK seem to be built. Here I refer to my own work (Nauta, 2001; Nauta, 2002; Nauta, 2005; Nauta, 2008) and the recently published ILSI report on microbial distributions (ILSI, 2010). It is not just that I would like to be quoted, I think it will strengthen the basis of the modeling approach and offer background information for the users. RESPONSE. We have added references (e.g., ILSI 2010, Nauta 2005&2008) to Chapter 2 with regard to concepts and mathematical equations where appropriate. [COMMENT 2-5] As a non-US reviewer, I note that iRISK is specifically directed at the USA. This is OK because this is a US project. However, other countries can benefit from this tool as well, and there is no need at all to restrict (e.g. population groups to US citizens). RESPONSE. We concur with the reviewer that users from other countries can benefit from using iRISK. Indeed, iRISK is not restricted to the U.S. Since the mathematical framework is universal and data and information for a risk scenario (e.g., contamination, consumption, disease outcomes) is entirely user-input, iRISK is not directed at the U.S., even though the examples provided for peer review use data from the U.S. In fact, we plan to make iRISK available to the public at www.FoodRisk.org, which is accessible anywhere around the world. [COMMENT 2-6] As for the conclusions, I am unsure that you showed that iRISK is a powerful tool for risk ranking. You show it can assess DALYs for various combinations of food and pathogen, and for all kind of production processes, but you don’t show how it performs in risk ranking. A crucial question is: how large should a difference in risks (DALYs) be to conclude that one ranks significantly higher than another? This question is not discussed in the document, let alone that it is answered. Yet, it is crucial if the risk ranking results are to be used for decision making. RESPONSE. The ranking in iRISK (peer review version) is based on the mean risk estimate on the basis of numerical DALYs. The mean risk estimate is a summation of viabilities in the inputs, e.g., variability in concentration distribution, serving size distribution. Therefore, the mean risk estimate is a single value, and ranking does not take into account the degree to which the DALY numerical values differ. Users can use the Sensitivity Analysis option in iRISK to evaluate uncertainty around the mean risk estimate, and provide the results for consideration in decision making.

23
II. RESPONSE TO CHARGE QUESTIONS 1. Is the report clearly written and follow a logical structure and layout? If not, the reviewer should provide suggestions for how to better document the risk assessment. [COMMENT 2-7] I am not sure whether you mean the document for peer review or the summary report that iRISK produces. If the first: the report doesn’t describe a risk assessment, so I don’t understand the last remark. In general, the report is clearly written. The illustrations are useful and the layout is good. As identified above, I miss a clear link between Chapters 4 and 2. RESPONSE. We have revised the title of the report to "Overview and Methodology of iRISK - A Public Health Risk Assessment Tool for Evaluating and Ranking FDA-Regulated Commodity/ Hazard Combinations" to more accurately reflect the nature of the report. [COMMENT 2-8] It would be worthwhile to add more background information on the components of the model structure as discussed in Charge Question 3. RESPONSE. We are developing a manuscript on iRISK methodology, which will include more background information on the components of the model structure. [COMMENT 2-9] The summary report is very useful as it includes the relevant details in a logical way. But see my remarks regarding the reported final concentrations (Charge Questions 3.1 and 4.3). Also, you might consider adding an incidence estimate (number of cases in the defined population per year and/or the number of cases per 100000 persons per year). RESPONSE. We plan to add the number of cases per year as an output in the risk scenario report in the next phase of iRISK development. [COMMENT 2-10] I realize this may be complicated for comparison with chemical risks, but still it may be of interest. Providing a bar chart with the assessed DALYs that are the basis for the risk ranking might be convenient for the user. RESPONSE. We plan to add a bar chart for iRISK model outputs such as DALYs in the next phase of iRISK development.

24
2. The iRISK model generates ranking of commodity-hazard pairs through a framework with two modules – a predictive multistage farm-to-fork process risk module and a hazard characterization module. Is the overall modeling approach fundamentally sound for the risk ranking purpose and scope? If not, what problems exist and how should they be addressed? If other approaches would be more suitable, the reviewer should provide a description and an explanation. [COMMENT 2-11] Yes, in general, this seems to be a sound approach. Other approaches may however be feasible as well, depending on the data availability, the objective behind the risk ranking (prioritizing commodity-hazard pairs; the urgency of a result for fast decision making), and the specific hazard/commodity concerns. For example, a source attribution method can be applied to identify the most important source of a pathogen if the pathogen is defined beforehand (Hoffmann et al., 2007; Pires et al., 2009). This typically requires a different type of data then in the iRISK approach data and can be used both as an alternative approach (e.g. if the data availability is better) and for comparison of approaches. It is typically relevant if decision makers want to prioritize a source (animal, food type) that should be targeted for control measures. RESPONSE. We concur with the reviewer that there are other approaches for risk ranking depending on the data available and the objectives. As described in the reply to a comment from reviewer #4 below (e.g. the response to comment 4-35), an alternative approach such as one that utilizes data on the incidence of diseases (e.g., Batz et al., 2011) may focus on the attribution of illness to a broad category of commodities (e.g., dairy products instead of milk). Results from an alternative approach can be complementary to iRISK, which is designed to include a predictive exposure component that provides a means to evaluate interventions by including a multi-stage process module. 3. The iRISK BETA model structure consists of a number of components in the process risk module that describes changes in the prevalence and level of a hazard at various process stages. The components include nine choices: no change, increase (growth; for microbial hazards only), increase (addition), decrease, pooling, partitioning, evaporation/dilution, cross-contamination (partial), and cross-contamination (total).
[COMMENT 2-12] The list of components is probably adequate for most applications (but see Charge Question 3.2). In ILSI (2010), dealing with non-homogeneous distributions of micro-organisms, some specific processes are identified that you might find of interest as well.

25
RESPONSE. We have reviewed the report from ILSI titled “Impact of microbial distributions on food safety” (ILSI, 2010). In the next phase of iRISK development, we plan to evaluate and as appropriate provide a means to describe clustering of microbial pathogens (i.e., non-homogeneous spatial distribution). [COMMENT 2-13] I don’t always understand how these relationships are derived, and I am not sure they cover all possible processes. The detail in the process descriptions is rather restricted, but I assume that is a deliberate choice that can be justified by the purpose of iRISK. I realize this purpose is to establish risk ranking, not to do a full scale stochastic risk assessment. RESPONSE. We agree with the reviewer that the level of details in the process descriptions is a choice we made given the purpose of iRISK. iRISK is intended to enable risk ranking and (relatively) rapid risk assessment, rather than to conduct an in-depth full-blown risk assessment. Thus, the process components and relationships are intended to cover commonly used processes but not necessarily all possible processes. We plan to develop a manuscript on iRISK methodology and provide additional references for a more detailed description of how the relationships for the process stages are derived. [COMMENT 2-14] Some of the work seems to be derived from my previous work on Modular Process Risk Models (Nauta, 2001; Nauta, 2008). RESPONSE. The process types, components and mathematical equations in iRISK are based on previous work from an expert panel process (Newsome et al., 2009) as well as from the published literature (ILSI, 2010; Nauta, 2005&2008), which includes published papers by the reviewer. We have added references in the revised report. [COMMENT 2-15] One particular question is how the models deal with concentrations below < 1 cfu/unit, and, in connection to that, how the prevalence is defined. This is relevant because bacteria are discrete units, and half bacteria do not exist. It could be that the prevalence is strictly the percentage of all units with more than 0 cfu per unit. Alternatively, it can be defined as in zero inflated distributions, where it is a percentage of units that holds 0 cfu/unit, while the concentration in the remainder of units is described by a probability distribution that may contain zero values as well. RESPONSE. The process model in iRISK deals with concentrations below 1 cfu/unit by assigning 0 cfu for the unit, i.e., the unit is negative for a pathogen. The fraction of units that is negative at a process stage is calculated based on the prevalence and concentration in the previous stage and the appropriate mathematical equations specific to the process type with consideration of a change in unit mass (if this is the case). In the process model, prevalence is defined as the fraction of units that have 1 or more cfu/unit (i.e., positive units) among all the

26
units (i.e., positive and negative units combined). iRISK first calculates the fraction of units that is negative, and the concentration distribution is sampled in simulations for positive units. [COMMENT 2-16] Both options may be plausible, but it should be clearly communicated which choice you make. (And you can also report both prevalences, although this will/may demand too much understanding from the user and, therefore, be confusing). The impact of this definition on the risk estimate may not be that large because the risk will probably mainly depend on the right hand tail of the distribution of concentrations. But for intermediate results as given in the summary report, it does make a difference, and I think it is the basis for some errors identified in the reaction to Charge Question 4. RESPONSE. It is conceivable that some small differences may occur depending on how prevalence is defined (i.e., whether strictly as the percentage of units that have 1 or more cfu/unit or alternatively as a part of a zero-inflated distribution). We concur with the reviewer that both options are plausible. We plan to add more description on how prevalence and concentration is defined in the process model in a manuscript on iRISK methodology that is being developed. [COMMENT 2-17] Some specific reactions: Decrease: I understand the log reductions in concentrations, but it is not particularly clear how the decrease in prevalence is obtained. I discovered that the mathematics are identical as the method used in Nauta, 2001, but I doubt whether that is obvious for the reader. It is not clear to me how you deal with concentrations that imply < 1 cfu/unit. It seems you somehow correct for those (with both prevalence and distribution of concentrations), but when I independently simulate the process that I want the iRISK model to run in another software, I cannot reconstruct the results reported by iRISK (see Charge Question 4.3 for an example). RESPONSE. The decrease in prevalence is calculated by using one of the mathematical equations specific to the relevant process type. Prevalence is defined in iRISK as the percentage of units that have 1 or more cfu/unit among all the units. See more information in the responses to the last two comments. [COMMENT 2-18] Cross contamination: If the concentrations drop below 1 cfu/ unit because you divide by the ω factor, the change in prevalence is not corrected. Maybe you did that because the user will be confused if (s)he doubles the prevalence and then finds that the prevalence is not doubled in the end. But, I am afraid it is not mathematically consistent to do it this way, and it has an impact on the concentrations as well (see Charge Question 4.3 for an example).
27
RESPONSE. According to the equation for cross contamination, )1(10
log 110
1
i
C
i PCi
,
concentration is described in terms of log cfu/g (e.g., for a bacterial pathogen). The number of cells in a unit is determined by multiplying concentration and unit mass. If the concentrations drop below 1 because of the division by the ω factor, there is a concurrent increase in the prevalence that is determined by the equation )1( 11 iii PPP that would “compensate” for
the “positive units” that contain less than 1 cfu/g. As the reviewer alluded to, the effective prevalence iP would not simply be 1iP
because some of the “positive units” would contain less
than 1 cell. The iRISK programing takes into account this aspect during the simulation. We plan to investigate this issue further in the next phase of iRISK development. [COMMENT 2-19] Another issue is how you deal with pooling. First note that this is the same process that I previously identified as mixing (Nauta, 2001; Nauta, 2005; Nauta, 2008) and is referred to by ILSI as joining (ILSI, 2010). My terminology is probably not so good (see ILSI, 2010); it would be beneficial for the scientific community if we could agree on the terminology, but that is not the issue right now. RESPONSE. The “pooling” in iRISK is similar to the “mixing” described previously by the reviewer (Nauta, 2005; Nauta, 2008) and it is similar to the “joining” described previously by ILSI (ILSI, 2010). Since the scientific community has yet to agree on the terminology, we plan to continue to use "pooling" in iRISK and define the term in the user manual and/or related iRISK report and manuscript. [COMMENT 2-20] You use the Central Limit Theorem, but I have shown in Nauta, 2001 (illustrated in Figures 2-5 and 2-6) and discussed in Nauta, 2005 that this may not be appropriate for lognormally distributed concentrations, particularly if the number of pooled units is low. In some software (like @Risk and ModelRisk) there are now functions available that easily allow you to model the summing process that you want to simulate when pooling, but I don’t know the mathematics behind these functions. By using the CLT you may overestimate the standard deviation and, if this results in a longer right hand tail of the exposure distribution, it may lead to an overestimation of the risk. RESPONSE. We plan to investigate this issue in the next phase of iRISK development. [COMMENT 2-21] As for partitioning, again I can refer to my previous work (Nauta, 2001; Nauta, 2005; Nauta 2008). The approach used here ignores the dependence between the units that originate from the larger unit in the previous stage (which may disturb the “mass balance” related to the number of cfus) and the heterogeneous distribution of cells. As particularly the latter may have an impact on

28
the risk (and may be very realistic in foods; see ILSI 2010), you might consider to include that. You can do it by a single clustering parameter (see the references mentioned). However, I realize this may complicate the model too much for its current purpose. You might want to explore the relevance of this phenomenon before deciding to include it or not. RESPONSE. We chose not to include clustering and dependency between process stages at the initial phase of iRISK development because such inclusion may make the process model too complicated for the purpose of iRISK, as the reviewer alluded to. iRISK is intended to serve as an intermediate between qualitative hazard analysis and in-depth full-blown risk assessment. Nonetheless, we plan to further explore and evaluate the effect of clustering and dependency between process stages and as appropriate incorporate them in the next phase of iRISK development.
[COMMENT 2-22] Decrease: I think the model should be capable of modeling complete removal, for example, for a fraction of the food items so that just the prevalence is reduced by a fixed percentage, and the concentration distribution remains constant. You could consider making this a separate process that you call “prevalence decrease.” This will be very simple both for the user to understand and for the modelers to put into the model. It can, for example, be applied when a food product is processed in two different ways, where one of the routes guarantees total elimination of the pathogen. Selective removal: You might also consider including something like “selective removal” where food products (units) that are “dirty,” “ugly,” or found positive by some quick online test are removed from the process. This will lower the prevalence and change the distribution of concentrations by (1) cutting the high value tail, or (2) removing higher concentrations with a higher probability then lower concentrations. This may be a very efficient approach for risk reduction and is probably applied quite often already. The challenge is to find some math to describe it, but I am sure you can think of something here. RESPONSE. We agree with the reviewer’s suggestions. We plan to evaluate and provide, as appropriate, a new process type for “prevalence decrease” and “selective removal” in the next phase of iRISK development. [COMMENT 2-23] Cross contamination: A lot of different processes can be referred to as cross contamination and recontamination. The “adding” process, for example, can also be regarded as a recontamination step. Another type of “cross contamination” is the consequence of bad food hygiene where bacteria are transferred from the food item via hands or equipment to the same food, another food, or directly into the mouth. In some situations this is considered the main route of exposure (e.g. Campylobacter on chicken meat).
29
RESPONSE. We concur with the reviewer that the “adding” process can be used to describe a recontamination step. As described in the report for peer review, the process type “Increase (addition)” in iRISK can be used to represent cross-contamination from the processing environment. We plan to add a new process type “consumer cross contamination” with associated function in the next phase of iRISK development. [COMMENT 2-24] It should be possible to add this type of process, maybe not by calling it cross contamination but something like “transfer”. You can characterize it by a single probability of transfer that has a distribution (see Nauta and Christensen, 2010) and includes all transfers as well as the aspects of human food handling practices like frequency of “bad hygienic practice.” Although it may be very difficult to get data on this, it may be crucial for the risk assessment, and the iRISK model could benefit from including this. RESPONSE. We plan to evaluate and provide, as appropriate, a process type for “cross contamination from food handling” to enable using bacterial transfer rate data. We are aware that modeling cross-contamination in a food preparation setting such as in the deli or at the home can be complex, and the modeling would require data on transfer rates and the levels of microorganisms on the contaminating surface such as contaminated hands or utensils. In future iRISK development, we plan to enhance iRISK capacity to model cross contamination, drawing upon published studies including references suggested by the reviewer (e.g., Chen et al., 2001; Montville et al., 2001; Nauta and Christensen, 2011). [COMMENT 2-25] I realize a complicating factor is that you get away from the food product that you are modeling by contaminating a side dish or go directly to human exposure. You may be able to solve this by (1) only allowing this process directly before exposure or (2) assuming the transfer goes to the food item itself again. I am not sure the latter will always work, but you could consider it. This process is essentially different from the cross contamination in iRISK because there is a “mass balance” in the partial cross contamination and there is not in the “transfer” situation. RESPONSE. We appreciate the reviewer providing specific suggestions on modeling cross-contamination at the consumption stage or a stage close to consumption. As described in the reply to comment 2-24 above, we plan to evaluate and enhance, as appropriate, the iRISK capacity to model cross contamination in the future. 4. The report describes the functions or equations (Equations 1 through 11) that underlie exposure assessment and risk characterization in the iRISK model.

30
[COMMENT 2-26] Some aspects of these equations have been discussed with Charge Question 3. I don’t think any of the assumptions are unreasonable but please note the following: - In general, the equations assume homogeneously distributed particles and independence of food units within and between stages. This is not realistic, but in many situations it will be a reasonable simplification. RESPONSE. We concur with the reviewer that, in developing the equations for the process module, two assumptions were made: homogeneous distribution of a pathogen (within a contaminated unit but not among all units) and independency of units within and between stages. These are reasonable simplification for the intended purpose of iRISK. [COMMENT 2-27] - The use of the Central Limit Theorem for pooling need not be appropriate (see Charge Question 3.1.). RESPONSE. We plan to examine this issue in the next phase of iRISK development. [COMMENT 2-28] - Cross contamination is a special kind of cross contamination. It is not particularly clear to me which type of process is described by these equations and it would help if you could give one or two examples here. These functions do describe what they intend to describe. I am, however, not sure whether they will be particularly clear for all users/readers. RESPONSE. See reply to comment 2-23 above. In addition, FDA is developing a manuscript for iRISK methodology and plans to include examples for the three types of cross-contamination, i.e., increase (addition), cross-contamination (partial) and cross-contamination (total) to further clarify how the these process types may be applied. [COMMENT 2-29] One thing that could be clarified better is when you take samples in a MC simulation and when you just do a calculation, or take a mean. You could, for example, use different types of symbols (bold, italic, etc.) for distributions (vectors), fixed values, means etc. This is especially relevant for the difference between prevalence and concentration. Each single unit has a concentration, but it does not have its own prevalence. The whole set of units has a prevalence and a distribution of concentrations. Therefore, the concentration should always be represented by a distribution describing the variability between units for each stage of the process, whereas the prevalence is a (fixed) value for each stage and not a distribution. With the functions or equations given, the calculation of the prevalence is written down just like that of the concentration, but, in practice, I guess you take the mean value for that (or so?). I doubt

31
whether you deal with this correctly (or I don’t understand how you deal with it) in Equations 8 and 9. I cannot reconstruct these. RESPONSE. In the iRISK report presented for peer review, the equations are shown in an italic font. We believe that, although visual differentiation between fixed values vs. distribution could be helpful for some readers, attempting to put another font on top of the italic font could make the equations appear confusing. Since most users may not review the functions in-depth, our approach is to have a set of scientifically justified equations that are peer-reviewed and have the equations built-in iRISK for users. [COMMENT 2-30] This issue should be explained and written down more clearly. It now seems as if you have a distribution of prevalences like you have of concentrations, but that doesn’t make sense to me. RESPONSE. In iRISK, when the user provides input for prevalence at a given stage, the prevalence is always a fixed value, not a distribution. [COMMENT 2-31] 1) For Listeria in Soft Ripened Cheese in Adults 60+, using consumer storage only, the mean final concentration for all packages considered in the simulation (i.e. the 1.04% contaminated) is -1 log cfu/g. The mean of the packages contaminated at exposure is 2.8 log cfu/g, but in that case the prevalence is decreased to 7.6E-03. The Scenario Summary Report does not provide these (combination of) values. The reason is the treatment of prevalence and concentration distributions as explained for the decrease process in 3.1. The risk estimate is correct, so I guess this is a matter of reporting, not a modeling error. RESPONSE. It is unclear how the reviewer obtained the prevalence value of 7.6E-03 or the mean final concentration of -1 log cfu/g. In the iRISK-beta presented for peer review, the initial concentration was represented by a triangular distribution (minimum -1.39, mode -1.1., maximum 0.699; all have the unit log cfu/g), the final mean concentration was 2.8 log cfu/g and the final prevalence of the packages (i.e., units) was 1.04E-2 (1.04%). These were the values in the Scenario Summary Report and on the Process Model screen when the “Save and Compute” button was clicked. In this scenario, the process model consisted of one stage with a process type of “Increase (growth)” and, therefore, the prevalence was not changed before and after the consumer storage stage. As the reviewer pointed out at the end of this comment, the risk estimate is correct. [COMMENT 2-32] 2) I created my own hypothetical Risk Scenario to test the tool and simulated the same model in @Risk to check my understanding and verify iRISK. I found there is something wrong with either my understanding or iRISK, (and I think it is iRISK). The problem lies, I think, in the cross contamination modeling.

32
I have attached the Scenario Summary Report of the example “Campy in chicken.” In @Risk, I simulated the scenario 700.000 times for initially contaminated units and cross contaminated units. I define my distribution of concentrations for contaminated units only; the prevalence is one minus the fraction of not contaminated units. My final concentration mean of logs is -3.22 instead of -4.73. (Note that log (1/2500) = -3.4), with 2500 the unit mass. Hence, the reported mean concentration is less than 1 per unit, so the distribution of concentrations must include units that are not contaminated). My final prevalence (food units with 1 or more cfu per unit, i.e. 2500 g) is 7.26E-3 instead of 1.12E-2. The reason for this is that the cross contamination prevalence in iRISK does not correct for concentrations of 0 cfu/unit. My final risk of illness is 8.4 E-6 instead of 5.8 E-6. The difference is not only explained by the definition of prevalence because I calculate the risk based on the distribution of doses including the zeros. I don’t understand what happens here. My total DALYs is 1.47 instead of 1.01, a considerable difference that shows this deserves some attention. The final concentration given on page 4 of the scenario summary report is -7.3; I get the same result. It is not the same number as that on page 1 as it does not correct for the fact that some concentrations will be < 1 cfu/unit (it only corrects for the initial 20% prevalence). I am not able to reconstruct the value -4.73 for the final concentration given on page 1. RESPONSE. We appreciate that the reviewer provided a specific example to illustrate a potential issue. In the next phase of iRISK development, we plan to evaluate the Campylobacter scenario provided by the reviewer, and attempt to recreate this scenario using both iRISK and the @Risk software, to better understand why the differences were observed. Learnings from the comparison will be used together with information from the replies to similar comments above to help further clarify and as appropriate improve how iRISK defines prevalence and concentration, as well as modeling cross contamination. 5. A key feature of iRISK BETA is the ability to compare both chemical and microbial risks. The model reporting allows users to compare risks with different metrics. In addition to a mean risk of illness, the annual DALY is used. With this in mind, [COMMENT 2-33] Risks (and especially the severity component) have many dimensions, and it is very difficult to “objectively” compare them. Any metric you use has an ethical dimension.

33
The DALY is a metric that is increasingly used, and seems to be practically useful for the comparison of very different hazards and risks. Its basis is strong in that the definitions are clear and transparent, and the mathematics behind it is sound. However, it is a subjective metric that depends on assumptions that anyone using them should be well aware of. RESPONSE. We concur with the reviewer. [COMMENT 2-34] For example, severity weights are subjective and depend on perception. Also, it is very difficult to compare long term and short term risks, risks for elderly people and babies, etc. Chronic diseases obtained when you are young have a high impact on the DALY score. The impact of disease and disability on society and specifically those closely related to the affected person are ignored. Therefore, in a comparison of risks, one should never restrict oneself to the DALY, but always consider the context. One could consider to include (optional) other metrics as well, like the human incidence of certain diseases, the mortality, or the costs. The latter would of course demand additional information but will be of interest for many decision makers. RESPONSE. We concur with the reviewer that iRISK users should be made aware of the subjective nature and assumptions underlying the DALY metric. We plan to provide other metrics (such as the total number of illnesses) in the scenario summary report. Furthermore, in future iRISK development, we plan to include an option in iRISK to select other risk metrics beside the DALY for risk ranking, e.g., cost of illness and Quality Adjusted Life Year (QALY). [COMMENT 2-35] It would be convenient to have some guideline on what to do if the information to estimate the DALY is not available. (Where would you be without RIVM?) It can be quite some work to get these estimates, and severity weights may be culture dependent. RESPONSE. We plan to provide reference(s) from the literature both in an example DALY template and in a global reference list of publication(s) for DALY in the next phase of iRISK development. This may include publications on the DALY metric (including information on its assumptions and limitations) and how to estimate DALY using data from different countries for disease outcomes, health trees, and endpoints that are relevant to the risk scenario being developed. [COMMENT 2-36] Could you alternatively just do the risk ranking by using incidence estimates or so? RESPONSE. We plan to evaluate and, as appropriate, add an option in iRISK for users to choose illness estimates for risk ranking.

34
[COMMENT 2-37] As my expertise is on microbiology and not on chemistry, I restrict myself to the microbial dose response. Here I think the exponential en Beta Poisson dose response (DR) relation covers the most widely used DR models. I would not easily be tempted to use the non-threshold linear myself, but it is fine to have it included. One might even consider to include a threshold model as an option for the user. Although such a model doesn’t make much biological sense, data to use anything else may be absent, and, in that case, one might want to explore the risks with such a threshold model. RESPONSE. We included the nonthreshold linear as an option for the user to explore risk with such a model. We decided not to add a threshold model for microbial pathogens because of the lack of sufficient scientific justification to do so. [COMMENT 2-38] As I stated in the general impression, I don’t think you actually showed that you can use iRISK for risk ranking. Actually, I found no definition of risk ranking in the document. With risk ranking it would mean that you can literally rank risks, stating that risk A > risk B > risk C etc. On the one hand, you do more because each risk gets a weight (the DALY) on a numerical scale, so you can, for example, say that the difference between risk A and B is much larger then that between B and C. On the other hand, you cannot say that risk A is significantly larger then B because the uncertainty in the DALY estimate is not characterized in a way that you can do that. What iRISK does is to provide quantitative “risk weights” without indicating the significance of the differences. RESPONSE. We concur with the reviewer that iRISK in the current state of development provides quantitative “risk weights” without indicating the significance of the differences. The ranking in iRISK (peer review version) was based on the mean risk estimate on the basis of numerical DALYs. Users can enter data describing variability (e.g., concentration distribution for a food-hazard scenario and the variability is taken into account in risk ranking. However, users need to use the sensitivity analysis option for uncertainty analysis to examine the impact of alternative input on the risk estimate. In the next phase of iRISK development, we plan to further enhance iRISK capacity to model variability and uncertainty where appropriate, and to develop case studies to illustrate how iRISK represents variability and uncertainty. [COMMENT 2-39] You might interpret this as an argument to define risk ranking a little different. I would say you can use iRISK to provide a very instructive sorted list of risks attending different commodity-hazard combinations, where you do not so much look at the ranking but at the differences between the DALY estimates. An accompanying explanatory text will be necessary. RESPONSE. We concur with the reviewer’s comment. We plan to add an explanation in the user manual to indicate that the risk ranking from iRISK provides a sorted list of risks associated
35
with different commodity-hazard combinations, based upon the numerical differences between the risk estimates without necessarily assessing the significance of the differences. [COMMENT 2-40] I am not sure how well you can compare chemical and microbial risks with DALYs. I have no experience in doing that, and the current version of the model does not provide opportunities to explore that. The acute, often short term, risk associated with microbes will be difficult to compare with the accumulating, long term risks of chemicals. DALY can deal with those, but the way DALY does that is an implicit choice you make, choice that should be made explicit for the user. RESPONSE. We concur with the reviewer. It is challenging to compare hazards associated with acute effects vs. those with chronic effects. We plan to focus on microbial hazards and acute chemical hazards in the near term. For chronic chemical hazards, we will focus on those that have a defined nonthreshold dose-response relationship (e.g., causing cancer). We believe that focusing on microbial hazards and acute chemical hazards in the near term and improving risk estimates for chronic chemicals in the future enables better comparison of the risks among these hazards. We concur with the reviewer that the user should be made aware of the associated limitations underlying the choice of DALY. Furthermore, DALYs developed based on data and assumptions in one country may not be relevant to another country. The DALY templates in iRISK are for reference. We plan to add information in the user manual to indicate some of the limitations associated with DALY and provide relevant references for the user. 6. Given that the primary purpose of iRISK BETA is ranking risk among a number of commodity-hazard pairs, are variability and uncertainty adequately characterized in the model? If not, please explain what changes might be considered to improve characterization of variability and uncertainty. [COMMENT 2-41] This is an important issue. In general, variability must be included in a (microbiological) risk assessment because it determines the risk. Uncertainty is to be included to assess the uncertainty of the risk estimate. If I understand it correctly, the distributions in the process model and the Monte Carlo simulation all deal with variability only. This seems to be correct and relevant. It is a major challenge to define these distributions adequately, but that is the way it is when you do risk assessment. It may be wise to clarify this point a little better to the user. RESPONSE. We concur with the reviewer that the distributions and simulation in a risk scenario deal with variability only. Although there is no explicit simulation of uncertainty within iRISK, a user can explore uncertainty by using the Sensitivity Analysis option in the tool. We plan to further clarify this point in the user manual in the sections related to consumption,

36
process model and sensitivity analysis, as well as making this point clear in a manuscript on iRISK methodology under development. [COMMENT 2-42] - If you use data to derive your distribution of initial concentrations and effects of processes, the variance in the data is interpreted as variability only. However, the variability is usually smaller than what the variance in the data tells you, because this variance includes both variability and uncertainty. RESPONSE. We concur with the reviewer that in iRISK, the variance in concentration distribution is interpreted as variability only. Although the variance for data such as initial concentrations for a microbial hazard might represent both variability and uncertainty, data reported in the literature usually may not differentiate the two. Furthermore, efforts to differentiate them would be more feasible in an in-depth risk assessment. [COMMENT 2-43] - I would propose to not allow the user to define the initial concentration as a fixed value. Initial concentrations will always be variable, and the user should not be tempted to think fixed values are realistic here. (If you really want to use a fixed value, for example to explore your model, you can always define a distribution with an extremely low variance. If a user is not clever enough to do that, I think (s)he should not do a risk assessment.) - If you use the model to rank risks, it would be a mistake if you use a fixed value for concentrations (or effects on those) for some of the evaluated risk scenarios and a distribution of concentrations for others. It is likely that those where you apply a distribution yield (relatively) higher risks, just because you use a distribution, if the risk is in the high value tail of the distribution (as it very often is). RESPONSE. We concur with the reviewer that initial concentrations, especially for microorganisms, will always be variable. We have revised the iRISK user interface so that the default input for concentration is a distribution, not a fixed value. However, choosing a fixed value is kept as an option for the user as a highly simplified option to explore iRISK. Should the user purposely choose a fixed value, the risk ranking report will include this data input as part of the basis for the ranking results. [COMMENT 2-44] Uncertainty is not characterized in the model. That is unfortunate but realistic. If at all possible, it would be an immense task to do this. The option of doing a sensitivity analysis to explore the uncertainty is good; I have no feasible alternative. RESPONSE. We appreciate the reviewer’s comment. No reply is necessary.

37
7. Given the practical constraints of the model and data, a sensitivity analysis option is provided by which the user can specify 5 alternate values for a single parameter in the Process Model, Dose Response Model, or Consumption model, and obtain the ranked results as compared to the original scenario. If this approach is not sufficient, please provide additional or alternative approach(es) and explain what changes might be considered and how they would improve the model. [COMMENT 2-45] See above. I think this is sufficient. If you would like to determine the significance between ranked risks, you will need some uncertainty assessment, but this will be very difficult, certainly if you want to do that in a quantitative way. Some qualitative/semi quantitative scoring method, addressing the perceived confidence in the results of the different models and assumptions, may be a way forward, but it will be quite some work to develop that. I don’t know of any example where this is done, but it is not my specific expertise either. RESPONSE. As described above, within iRISK, a user can explore uncertainty by using the Sensitivity Analysis option in the tool. The option allows users to evaluate uncertainty in a quantitative way by providing alternative values for parameters in the process model, consumption model and the dose response model. 8. Comment on the iRISK BETA user interface. Is the interface user friendly? Are there any features that should be modified or added to facilitate ease of use? For example, is there sufficient description in the user interface to understand each component of the model? [COMMENT 2-46] Whether an interface is user-friendly largely depends on the user. For me it is very clear; I don’t experience any problems. But I am possibly not representative for the average user. Also, we had this training session which was very instructive. I don’t know how I would have experienced the user interface without that. What I would like is an option to see graphs of the distributions of the Concentrations (and P) over the different stages process. RESPONSE. We plan to upgrade the user interface to include an option to generate graphs of concentration distributions and prevalence over different process stages as appropriate in the next phase of iRISK development.

38
[COMMENT 2-47] It is not obvious to me whether a user should actually understand each component of the model. To be a little philosophical, I don’t really know what you mean by understanding either. The mathematical description of the components of the model is the ultimate transparency, but it may be difficult to read for some of the users. If I remember the quote correctly, Niels Bohr once said that clarity and truth are complementary, and I guess we have to live with that. As indicated before, I think it would be beneficial to add background information on the model components and explain how the mathematical equations are derived. RESPONSE. We plan to develop a manuscript on iRISK methodology, which will include more background information on the model components and an explanation of the mathematical equations. 9. Comment on the adequacy of the model documentation features within iRISK. Can the user accurately document data sources and confidence in the model? [COMMENT 2-48] The comment boxes give the user sufficient room to document data sources and confidence. It might be useful to have the opportunity to add links to other files with data, explanatory texts, references or models, but I don’t know how easy it is to realize that. It would not be a top priority to me; it should predominantly be the responsibility of the user to document the data and assumptions. RESPONSE. We plan to expand iRISK capacity to upload an input data file from an external source to iRISK models in the next phase of iRISK development. In addition, we will evaluate the feasibility to link text, publicly available references (e.g., titles and abstracts) and models, to develop the linkage capacity as appropriate. References [cited by Reviewer#2] ILSI 2010. Impact of microbial distributions of food safety. J. Bassett (ed.), ILSI Europe Report
Series, Brussels, May 2010. Hoffmann, S., Fischbeck, P., Krupnick, A., McWilliams, M., 2007. Using expert elicitation to
link foodborne illnesses in the United States to foods. J. Food Prot. 70, 1220-1229. Nauta, M.J. 2001 A modular process risk model structure for quantitative microbiological risk
assessment and its application in an exposure assessment of Bacillus cereus in a REPFED. (in cooperation with F. Carlin) RIVM report 149106 007, RIVM Bilthoven

39
Nauta M.J. 2002 Modelling bacterial growth in quantitative risk assessment: Is it possible? International Journal of Food Microbiology 73:297-304.
Nauta M.J. 2005 Risk assessment modelling of the food handling processes mixing and
partitioning. International Journal of Food Microbiology, 100,311-322. Nauta, M.J., 2008. The Modular Process Risk Model (MPRM): a Structured Approach for Food
Chain Exposure Assessment. In: Schaffner, D. W (ed.) Microbial Risk Analysis of Foods. pp. 99-136 ASM Press, Washington, D.C.
Nauta, M. and Christensen, B. 2010 The impact of consumer phase models in microbial risk
analysis. Risk Analysis, in press, DOI: 10.1111/j.1539-6924.2010.01481.x Pires, S.M., Evers, E.G., van Pelt. W., Ayers, T., Scallan, E., Angulo, F.J., Havelaar, A., Hald,
T., 2009. Attributing the human disease burden of foodborne infections to specific sources. Foodborne Pathog. Dis. 6, 417-424.
III. SPECIFIC OBSERVATIONS ON THE DOCUMENT [COMMENT 2-49]
Page Line Comment 4 1 spelling: public health
RESPONSE. The typo has been corrected.
4 general make clear the risk and harm relate to humans RESPONSE. Change “food and animal feed agents that may be harmful” to “human food and animal feed…”
5 6 as input into a computer model with a clear, logical structure RESPONSE. Added the bolded words as suggested.
8 half way I am not sure you can use the terminology “behavior” for a hazard, it sounds strange to me. RESPONSE. “Behavior” is kept as is because it is used in the literature.
13-14 I do like the logic behind this; this is very well structured RESPONSE. We appreciate the reviewer’s comment.

40
17 Duration days (D) and years (Y). It took me a while to figure out what D and Y meant in the iRISK tool. RESPONSE. Definitions and abbreviations were added in the report. We plan to provide the same definitions/abbreviations in the Health Endpoint section of the user manual.
25 last paragraph
The iRISK model does NOT characterize the uncertainty. RESPONSE. We concur with the reviewer. This is correctly described in the report. “Consider/Characterize uncertainty” is a desirable feature for FDA; however, as described in Table 4 on p. 27, evaluation of the iRISK model indicated that the model does not characterize uncertainty.
25-29 This section doesn’t add much information for me. I don’t know the history of FDA’s risk ranking activities, and I don’t know with which other tools iRISK is compared here. As a reviewer, I don’t want to be told how excellent the iRISK model is. Who has done this evaluation? Why is it here in the document? RESPONSE. The purpose of this section is to show how well iRISK meets the six criteria outlined on p. 25 for desirable features of a risk ranking tool. The evaluation was conducted by the RTI international (RTI). FDA awarded a contract to RTI to develop an inventory of risk ranking tools and evaluate the tools for their scope and objectives, model platform, uncertainty characterization, model attributes and model limitations. The section is intended to provide some history of iRISK development and evolution.
27 Characterization of uncertainty: Not done. Why not all minus signs? RESPONSE. “0” is used in this case to indicate “not done.” The comments field indicates that little uncertainty analysis is available.
28 Ease of use: For whom? Who is the foreseen user? You should not let a donkey drive a car, and you should not let just anybody do risk assessment. If the model could be used without training, I don’t think it could be a good tool. RESPONSE. We are aware that certain amount of training may be necessary to use iRISK. We concur with the reviewer that the need for some training may not necessarily be a drawback for a risk assessment tool because it helps promote application of the tool as intended.
33 1 [COMMENT 2-50] What is the unit of Ci=n ?

41
RESPONSE. The unit for chemical concentration, g/g, has been added.
33 2.3 I don’t understand the second distribution, isn’t that just a boolean expression [yes, no] for contamination? Please clarify. RESPONSE. It is a [yes, no] outcome, i.e., 0 or a non-zero value for prevalence from the simulation process. The likelihood of returning a 0 or non-zero value is based on the array of weight factors used to represent the prevalence input.
33 2.4.1 The unit of Ci is log cfu/g. This is important and should be added. RESPONSE. We have added the text “The unit for bacterial concentration is log cfu/g, for viral concentration is log pfu/g, and for chemical concentration is g/g” to the section.
33 last [COMMENT 2-51] You mean they are homogeneously distributed? This is a truly simplifying assumption and need not always make sense. You can deal with it as well (see Nauta, 2005; ILSI 2010). RESPONSE. The term used, “uniformly” distributed, does mean homogeneously distributed. We are aware that this is a simplifying assumption. In the next phase of iRISK development, we plan to evaluate the references suggested by the reviewer and other relevant papers and address the issue as appropriate.
34 2.4.3. [COMMENT 2-52] There are four possibilities; with four probabilities that can each be spelled out more clearly then you did here. RESPONSE. We plan to provide further elaboration on the four possible outcomes of the process type “increase-addition” and provide an example as appropriate, in a manuscript on iRISK methodology under development.
35 2.4.4. [COMMENT 2-53] It is strange that the decrease process cannot remove the hazard from the system. That is why pasteurization/sterilization is invented. Why not add this possibility? RESPONSE. The way a decrease process is treated in iRISK is such that a large decrease, such as a 12-log reduction sterilization or retort process, will result in “essentially” complete removal, i.e., the resulting concentration will approach zero, even though it is not zero (not complete removal).

42
37 ρ [COMMENT 2-54]
This should be Pi/Pi-1 if it is what you state it is. RESPONSE. We concur with the review that ρ as stated should be Pi/Pi-1. Furthermore, the symbol ρ is used for a special situation when Pi is 1 (i.e., when 11 iP ). We have provided additional clarification of this point in
the report.
39 Not initially anticipated by whom? Why should I know that? RESPONSE. This information was intended to provide background and history of iRISK development.
41 Foods/ Consumption
[COMMENT 2-55] Due to cross contamination during preparation of the meal, the pathogen may be ingested via another route than the food considered in the assessment. It seems that the model cannot deal with that. It is of course a complicating factor, but it would be interesting to find out how this can be considered. (see Charge Question 3.2) RESPONSE. We concur with the reviewer that cross contamination during meal preparation can result in the pathogen being transferred to another food. This aspect if not yet modeled in iRISK. As indicated above, cross contamination is a complex process to model. We plan to investigate ways to enhance the capacity in iRISK to model cross contamination in future development efforts.
43 14 Table 7 RESPONSE. Change made as suggested.
51 1 spelling:, the RTI team RESPONSE. Change made as suggested.
51 [COMMENT 2-56] dose response relationship: what do you do if it is NOT available? RESPONSE. For the purpose of developing the hazard sheets, if dose response relationship is not available for a hazard, this would be noted in the hazard sheet, which would suggest that sufficient data is not available to develop a risk scenario for the hazard.
52 4.3 [COMMENT 2-57] If you use typical industry practices only, you may lose some of the
43
variability that is essential to assess the risk. It is important to be aware of this. RESPONSE. Typical industry practices were used to develop a baseline risk scenario for proof-of-concept testing in iRISK development. We concur with the reviewer that variability from typical industry practices should be considered in developing a risk scenario, and a note has been added to the report to indicate the importance of considering variations in industry practices, as well as considering the probability of process failure, as also suggested in a comment by reviewer #5 below. The user can also evaluate the effect of process variability and process failure by using the Scenario Analysis option in iRISK.
52-53 4.3 [COMMENT 2-58] I miss a clear link with the iRISK process types and the parameter estimates they need. The efforts described in this section should have led to the identification of the appropriate consecutive process types (components) in the process flow, and the estimation of the parameters. It is a pity that this is not done. See Nauta, 2008. RESPONSE. We concur with the reviewer that a description of the process should include the identification of process types in the process flow. In the current report, the parameter estimates needed for each process type is outlined in section 1.4.8 "Process Models" and in section 2.4 "Mathematical Description of the Processes." We have added references (e.g., ILSI 2010, Nauta 2005, Nauta 2008) to section 2.4 with regard to concepts and mathematical equations, where appropriate. For the two examples of process flow diagram that were provided for peer review, the process types and parameter estimates were provided in Table D-1 and Table D-2 in Appendix D. Information has been added to the report to provide the linkage for these two examples. In the next phase of iRISK development, we plan to expand iRISK capacity to provide an option for user to develop a process flow diagram with process type indicated.
59 [COMMENT 2-59] Please provide FDA’s definition of cross contamination. RESPONSE. We are aware of definition reported in the literature (Chen et al. 200; Montville et al., 2001; Mylius et al. 2007), where cross-contamination is defined as or used to describe the spread of microorganisms from a contaminated food item (and/or food contact surface) to another food item (and/or food contact surface) that is not contaminated beforehand. However, we do not believe iRISK is the best place to define the term "cross contamination" because FDA has used it in guidance documents such as guidance for pathogen control in refrigerated ready-to-eat foods (DHHS/FDA, 2008a) and fresh-cut

44
produce (DHHS/FDA, 2008b), but has not specifically defined the term.
59 [COMMENT 2-60] System-wide perspective: I don’t understand what you mean here. Outliners = outliers? Are the experts supported in doing this? How? In general: did the experts do what I think they should do (see comment page 52-53) or did they do something else? RESPONSE. During the expert elicitation conducted to obtain data for proof-of-concept testing, the experts were asked to provide estimates for the hazard at each step as weighted averages across all types of operations, taking into consideration operations that do not adhere to good manufacturing practices or good agricultural practices, i.e., taking into consideration outliers (it is not "outliners" and the typo has been fixed). A system-wide perspective means taking into consideration outliers in deriving estimate for the process steps in the flow diagrams.
59 last [COMMENT 2-61] A most likely estimate for the concentration is not enough, as the variability in concentration probably has a large impact on the risk. This approach does not fit with the idea behind the iRISK model, does it? See my comments on charge question 6. RESPONSE. The experts were asked to provide a most likely as well as a range of estimates. For the two examples of process flow diagram that were provided for peer review, the process types and parameter estimates were provided in Table D-1 and Table D-2 in Appendix D in the report provided for peer review.
60 1 [COMMENT 2-62] What do you do with these minimum and maximum values? If they express variability in concentrations or the effects on those, you can include them in the iRISK model. If they express uncertainty, you cannot use them in the iRISK model, because that does not include modeling of the uncertainty. If they express both, it is not clear how they can (not) be used. Again, the link between this activity and the provision of inputs for the iRISK model is unclear to me. It would be very helpful if this was specified in the terminology used in Chapter 2. RESPONSE. The minimum and maximum values as well as the most likely value are used as inputs for concentration, in the form of a triangular distribution. The distribution is used to represent variability only. We have added a short paragraph at the beginning of Chapter 4 of the report to better describe the linkage between the expert elicitation activity (as a means for obtaining data) and Chapter 2. We are also developing a manuscript on iRISK methodology, in which we plan to

45
provide a risk scenario example with input distributions for the terminology and equations in Chapter 2.
60 last [COMMENT 2-63] It is indeed a major task to provide this documentation; there is no way around that. Did anyone tell you this would be easy? Once this information is provided and integrated in iRISK, it will be a very important source of information for all sorts of risk assessment activities and food safety risk management support. In my view, it is crucial that this information is provided in a way that fits seamlessly into the iRISK model structure. RESPONSE. We concur with the reviewer that data and information obtained should be placed in a way that fits into iRISK structure and will continue to use this format moving forward.
61 4.5.1 [COMMENT 2-64] I realize that it is difficult to classify antibiotics and microbial toxins as either microbial or chemical. If this classification is dictated by the DR relation, it may be impossible to incorporate, for example, the effect of microbial growth of the microbe that produces the toxin because chemicals do not grow. How do you deal with that? RESPONSE. We agree that antibiotics and microbial toxins have both microbial and chemical component in the farm-to-table continuum. This is a complex issue that is also raised in several comments by reviewer #5 below. There may be different considerations for microbial toxins produced by commonly known microbial pathogens such as Clostridium botulinum and Staphylococcus aureus and those produced by molds (e.g., mycotoxins). We plan to evaluate and as appropriate expand iRISK capacity to estimate risk from a hazard that has both a microbial and chemical component, in the next phase of iRISK development.
62 4.5.4. [COMMENT 2-65] For microbial risk assessment you may need to have information on consumer practices related to storage, cooking and cross contamination. This is generally not available in such databases. How do you deal with that? RESPONSE. We are aware that no databases are readily available for consumer practices related to storage, cooking and cross-contamination. We plan to deal with the issue by using data and information from published literature or risk assessment related website, such as the references cited in the reply to comment 2-58 above, cooking temperatures from the Audits/FDA Temperature Database (available at http://foodrisk.org/exclusives/audits/index.cfm), the EcoSure 2007 Cold Temperature Database (available at
46
http://foodrisk.org/exclusives/EcoSure/), and the Consumer Storage Practices for Refrigerated Ready-to-Eat Foods information (available at http://www.foodrisk.org/exclusives/CSPRRTEF/index.cfm).
App B [COMMENT 2-66] These appendices should, in a structured way, describe the hazard related inputs that are used in the iRISK model. For example: which growth/inactivation model can you use, should you use, or is used for Listeria? RESPONSE. We agree that the hazard sheets shown in Appendix B were developed in part to provide general information about selected hazards, and that the hazard sheets may not contain enough details on growth/inactivation modeling. We have used additional information from the literature in developing the risk scenarios provided for peer review.
App C [COMMENT 2-67] The process flow diagrams should be represented as a flow of process types (components) used in iRISK. In the end, that is what you need. RESPONSE. We plan to include process type information on the flow diagram in future development of iRISK.
IV. SPECIFIC OBSERVATIONS ON THE iRISK MODEL [COMMENT 2-68] I have no specific observations that would fit here. The model works very well, it is just that I cannot follow all calculations (see Charge Question 4.3). I never got stuck or got lost when using iRISK; I really like it! RESPONSE. We appreciate the reviewer’s comment.

47
REVIEWER #3 I. GENERAL IMPRESSIONS [Comment 3-1] The iRISK model represents a major improvement in the development of more structured, transparent, and efficient methodology for microbial risk assessment, and an extension of methodology available to FDA for comparing hazards (microbial and chemical) and foods. The iRISK model includes two ‘domains’ of data inputs representing an exposure assessment module and a hazard characterization module. The iRISK model is an excellent tool for developing and testing scenarios for robust exposure assessment. Even for a non-programmer, routines to build and run scenarios are well designed and rapidly implemented. Outputs of these modules are combined to generate relative risk estimates across hazards and excellent reports with details of scenarios and sensitivity analysis. The authors noted that the level of effort needed to populate iRISK in a scientifically sound and transparent manner was not initially anticipated. As often seems true for microbial risk assessments, the level of effort applied to developing and populating iRISK was higher for the exposure assessment module than the hazard characterization module. Similarly, the accuracy and clarity of the documentation are higher for the exposure module than for the hazard characterization module. The documentation about dose-response assessment and the libraries of published dose-response models are incomplete, as evidenced by inadvertent exclusion of multiple datasets and dose-response models cited in the hazard sheet for listeriosis in Appendix B from the current version of iRISK. RESPONSE. We concur with the reviewer that hazard characterization needs to be scientifically sound and transparent, as does exposure assessment. In the iRISK version presented for peer review, the user has an option of developing a process module (with multiple stages) and has an option of inputting a dose-response model (with one step). The process module is structured in a way to facilitate the evaluation of potential interventions at any points from farm to table. On the other hand, the dose-response input requires that the user chooses an appropriate dose-response that has been developed outside of iRISK. In the current state, iRISK does not yet have the capacity as a dose-response modeling tool; rather, iRISK provides options for different dose-response model forms so that the user can choose the appropriate model and provide the parameter(s) for the model. The design of iRISK reflects the need for the evaluation of process interventions on exposure and, as the reviewer pointed out, also reflects the state of risk assessment knowledge. The hazard sheet for listeriosis (Appendix B) was developed to provide background information for an expert elicitation conducted during the proof-of-concept testing of iRISK. The hazard sheet for listeriosis cited several datasets from animal studies (Williams et al., 2007; Smith et al., 2008), but these data were not included in the example risk scenario for peer review because the animal models are not directly applicable to predict human listeriosis (see more details in the response to individual comments below). In the next phase of iRISK
48
development, FDA plans to find ways to enhance the iRISK hazard characterization module, and further evaluate the literature and as appropriate expand the library dose-response models. [Comment 3-2] Further development of the hazard characterization module and supporting scientific rationale is suggested to minimize problems related to incomplete characterization of dose-response assessment. Otherwise, overconfidence in estimates from the current version of iRISK may misguide programmatic decisions. RESPONSE. We concur with the reviewer that efforts should be made to minimize problems related to incomplete characterization of dose-response assessment. Uncertainties associated with hazard characterization often exist because of the complex nature of dose-response relationships. In developing the iRISK tool, we have tried to balance complexity and applicability, taking into consideration the state of risk assessment knowledge, data available and outputs desired. In the version of iRISK presented for peer review, a simplified approach is taken for hazard characterization. The user is required to choose a dose-response model based on an evaluation of available scientific literature, data and information. iRISK provides a means for the user to fully document the strengths and weaknesses of the dose-response model, the rationale for selecting the model, and any limitations/uncertainties associated with the model. This information together with all the data inputs are included in the risk scenario summary report for consideration in decision-making. We concur with the reviewer that it is important to provide scientific rationale to support the choice of a dose-response model. The user manual provides an overview of dose-response model and suggests that the choice of model must be based primarily on the biological basis of the response. We plan to develop a global reference list, which will include a reference to existing guidelines for hazard characterization (FAO/WHO, 2003). [Comment 3-3] The underlying biological complexities of infectious disease may not be well predicted by the simplifications of iRISK. The software and manual provide little transparency for users and reviewers to interpret or verify results of the hazard characterization module. RESPONSE. We agree with the reviewer that the underlying biology of infectious disease may be complex. It is well recognized that developing dose-response model for infectious disease is challenging for microbial risk assessment in general, not just for a tool like iRISK. iRISK addresses the transparency issue by providing a means for the user to document the source of dose-response model and rationale for selection. As a starting point, the user may draw upon dose-response models that have been evaluated by expert groups such as the Joint FAO/WHO Expert Meetings on Microbiological Risk Assessment (JEMRA). For example, the user may cite evaluation on L. monocytogenes and Salmonella infections conducted by JEMRA, and choose the dose-response model for L. monocytogenes (FAO/WHO, 2004) and the model for Salmonella (FAO/WHO, 2002), with additional consideration of more recent published data as appropriate, for use to develop a relevant risk scenario in iRISK. In future iRISK development, we plan to

49
further enhance the risk characterization module to capture new scientific knowledge and new dose-response models for infectious microbial hazards as they become available. [Comment 3-4] The hazard characterization module includes few of the available published dose-response models. The few models included are applied as black boxes, without acknowledging the strengths and weaknesses of the data and models, particularly underlying assumptions, judgments, and opinions. The iRISK hazard characterization module does not reflect or acknowledge the ambiguities of the available data and the subjectivities and biases of the assumptions and judgments driving the models. RESPONSE. The hazard characterization module presented for peer review included three dose-response model forms for microbial hazards and 10 model forms for chemical hazards. We plan to provide references for the dose-response models in a global reference list for iRISK. In the next phase of iRISK development, we plan to add more model forms as appropriate based on evaluation of the dose-response analysis literature. We agree with the reviewer’s suggestion. We plan to provide a description in the user manual to encourage users the document rationale and reference(s) for the selected model, which should include acknowledging the strengths and weaknesses of the data and models, underlying assumptions as well as judgment made in deriving dose-response models. [Comment 3-5] Oversimplification of the hazard characterization module also limits the utility of iRISK for identification of influential data gaps for dose-dependencies of existing pathogens and prioritization of model-directed research targeting risk reduction. Without additional documentation and testing, the current version of iRISK may not generate reliable results to appropriately guide allocation of resources to improve food safety and identify high risks that merit fuller quantitative risk assessment. RESPONSE. Simplification of hazard characterization is necessary in iRISK, which is designed to be a tool for developing risk scenarios for many food-hazard combinations and to compare risks. However, we concur with the reviewer that it is important to carefully document data gaps when choosing a dose-response model for building a risk scenario in iRISK. The Sensitivity Analysis option in iRISK can be used to test the impact of uncertainty in the dose-response model on risk estimates for commodity-hazard pairs of interest, e.g., the pairs rank higher in risk. In the next phase of iRISK development, we plan to expand the capacity in iRISK and find ways to improve the utility of iRISK for identification of influential data gaps, in particular those related to hazard characterization. [Comment 3-6] The need for more balanced emphasis on modeling dose-response relationships for foodborne microbial pathogens was noted by another food safety agency representative at a 2008 EPA/CDC

50
workshop (EPA, 2010). The iRISK hazard characterization module in its present incomplete state is potentially misleading for risk assessors and risk managers, as well as other stakeholders. RESPONSE. Summaries from the 2009 EPA/CDC workshop (US EPA, 2010a) suggest that dose-response models are a simplification of the complex interactions between microbial pathogens and susceptible individuals and that "the best dose-response models all have flaws"; therefore, models selected should be useful to inform decision. iRISK is designed as a mathematical framework to enable risk assessment and risk comparison, where all the inputs and interpretation for exposure assessment and dose-response analysis are to be provided by the user. Since iRISK is not designed as a dose response modeling tool per se, users need to select a model that has been developed outside of iRISK and use it as input in iRISK. It is important to choose the most scientifically sound dose-response model available that is "fit-for-purpose" with appropriate documentation. We plan to add a description in the user manual to emphasize the importance of documenting the scientific rationale to support the choice of a dose-response model. [Comment 3-7] It appears that FDA plans to continue to build the iRISK libraries, though the need for expansion of dose-response knowledge does not seem to be mentioned in the report. One statement of concern in the conclusions is the acknowledgment that technical expertise and resource requirements needed to use iRISK are substantial, both for populating libraries and training analysts to use them. This weakness in the tool may be less important for users that have broad expertise in disciplines crucial to both modules. However, microbial risk assessment teams may not have strong representation of the disciplines associated with hazard characterization (e.g., medical microbiology, microbial ecology, dose-response modeling for likelihood and severity of disease, quantitative assessment of pathways of pathogenesis (including adaptive and adverse endpoints) and progression to severe disease). This review focuses primarily on improvements to the hazard characterization module necessary to enhance capabilities to conduct robust hazard characterization for microbial and chemical hazards and demonstrate the soundness of conclusions from iRISK. RESPONSE. We agree with the reviewer that there is a need for further expanding the iRISK dose-response models library. In the next phase of iRISK development, we plan to continue to build the iRISK libraries, which include expanding dose-response knowledge in the library. We also plan to provide additional references where appropriate for dose-response models in the iRISK library, and expand the dose-response model forms available in iRISK as appropriate. II. RESPONSE TO CHARGE QUESTIONS 1. Is the report clearly written and follow a logical structure and layout? If not, the reviewer should provide suggestions for how to better document the risk assessment.

51
[Comment 3-8] Few editorial corrections to the report were identified in Section III of this review. The report identified multiple contributors, and improvements are needed to more tightly link sections compiled from different authors. RESPONSE. We have revised the report taking into consideration the reviewer's suggestions described in Section III below. [Comment 3-9] The logical structure of the report seems incomplete or imbalanced regarding hazard characterization. Additional effort is required to provide balanced documentation for the hazard characterization module, perhaps addressed in the body of the text and by including additional appendices. RESPONSE. We plan to provide additional information on hazard characterization in the user manual and provide users a list of references on hazard characterization, such as the hazard characterization guidelines from FAO/WHO (FAO/WHO, 2003). As described above, we also plan to the expand dose-response knowledge and the library in the next phase of iRISK development. [Comment 3-10] The report is unclear regarding the following points:
The authors introduce the need for establishing continuous evaluation of FDA-regulated products causing the greatest burden of foodborne disease, but conclusions about additional work needed are vague. The current report presents no cohesive plan or process for internal and external activities supporting such a continuous effort.
RESPONSE. The report presented for peer review was intended to provide an overview of iRISK development, the iRISK methodology, data needs, and an example of how data was collected to populate iRISK in proof-of-concept testing. We appreciate the reviewer's suggestion and will consider developing a plan or process for activities to support using iRISK to continuously evaluate risks associated with FDA-regulated products. [Comment 3-11]
Though the iRISK tool can be useful to support decisions, its utility may be limited without additional resources to systematically update data, assumptions, and judgments, particularly as new paradigms develop in the US and abroad that focus on pathways rather than empirical endpoints loosely linked with exposure (NRC, 2007, 2010).
RESPONSE. We concur with the reviewer's comment and will consider seeking additional resources to systematically update data and information to support iRISK.

52
[Comment 3-12]
The authors appear to use the terms DALY and pDALY interchangeably, though the terms were distinguished in Newsome et al. (2009) and by iRISK developers in their presentation at the 2010 SRA meeting. Clarification is needed for uses of pDALY in Figures 1 and 11.
RESPONSE. The iRISK version presented for peer review uses DALY, while pDALY was used in the risk ranking prototype reported by Newsome et al. (2009). We have clarified Figures 1 and 11 to indicate that pDALY has been replaced by DALY in the current version of iRISK. [Comment 3-13]
The design of the tool for assessing dose-response relationships across hazards described briefly in Table 2 is not transparent. For example, it is puzzling why 10 functions available for chemicals are not also available for microbes when many of these functions also fit microbial datasets (e.g., Holcomb et al., 1999).
RESPONSE. The main purpose of Table 2 in the report is to show dose-response model forms that have been included in the iRISK library. Currently iRISK includes three model forms for microbial pathogens (i.e., beta-Poisson, exponential and nonthreshold linear). We agree with the reviewer that there are other functions that may fit microbial datasets, such as log-logistic, log-normal, and Webull-Gamma (Farber et al., 1996; Holcomb et al., 1999; Williams et al., 2007; Smith et al., 2008; Van Stelten et al. 2011). We plan to evaluate additional dose-response models for microbial hazards and, as appropriate, include more choices of dose-response functions in the iRISK library in the next phase of iRISK development. [Comment 3-14]
For the one common model form for chemical and microbial hazards (nonthreshold linear estimating risk at reference dose or RfD), no scientific rationale is provided to guide assessors using the tool. Reference dose does not seem to be defined for chemical or microbial hazards in the report.
RESPONSE. We have focused efforts on developing the iRISK model structure and programming. We plan to develop case studies in the next phase of iRISK development to further illustrate how to use the iRISK tool to integrate data for the various components of a quantitative risk assessment, including dose-response data. We plan to provide references to published guidance, such as hazard characterization guidelines from FAO/WHO (FAO/WHO, 2003), to help guide the users to resources that help users select dose-response models and define reference doses.

53
[Comment 3-15] The report does not acknowledge dose-dependencies for disease severity and duration for
either chemical or microbial agents. For example, Figures 1, 4, 5, and 10 imply an unlikely assumption that dose-response and severity of health outcomes (DALY) are independent.
RESPONSE. We agree with the reviewer that disease severity and illness duration may be dose-dependent. We have revised to report to indicate that the duration and severity of illnesses from a chemical or microbial hazard may be dose-dependent and that this aspect should be taken into consideration when data is available to develop such a model and when choosing dose-response models available in the literature. The dose-dependencies for severity and duration are not yet specifically considered in dose-response models iRISK because of the lack of such models in the published literature. In iRISK, the dose-dependency effects on public health burden is indirectly accounted for, to a certain degree, by using a metric such as DALY, where disease severity and duration are taken into account in developing a DALY template for a case of illness.
[Comment 3-16] Confidence in outputs of sensitivity analysis seems overstated by the authors for models
in the ‘proof of concept’ stage of development, particularly due to weaknesses in the hazard characterization module. For example, it is unclear if NOAELs/LOAELS or points of departure predicted from the Benchmark Dose Model software or point estimates from selected dose-response curves are appropriate for comparing across chemical and microbial hazards and hosts.
RESPONSE. Confidence in the outputs of sensitivity analysis is influenced by the data input and assumptions made, including those for dose-response model parameters. It is well known that there are uncertainties associated with currently available dose-response models, as pointed out by the reviewer above. The iRISK user manual encourages the user to fully document data sources and assumptions made in the iRISK model. This was the approach taken in the proof-of-concept testing, where dose-response model parameters were primarily obtained from the literature and published risk assessments. iRISK has built upon a risk ranking framework prototype that was designed for the comparison of microbial and chemical hazards. The prototype was developed by an expert panel (with expertise in food safety, risk assessment and management, microbiology, toxicology) convened by the Institute of Food Technologists (Newsome et al., 2009). NOAELs/LOAELs have traditionally been used to assess chemical risks. Points of departure predicted from the Benchmark Dose (BMD) Model (http://www.epa.gov/ncea/bmds/documentation/BMDS-users-manual-v2.pdf) have been used for hazardous pollutant risk assessments. These parameters are not yet used in risk scenarios developed in iRISK. In the next phase of iRISK development, FDA plan to further expand the dose-response model library and a list of references and links to resources for the user.

54
[Comment 3-17] FDA assessors and managers may be unaware of the impacts of model uncertainty, a key
component in EPA’s BMD software (version 2.1.2) that contains thirty different models that are appropriate for the analysis of dichotomous or quantal data, continuous data, nested data, and concentration-time data.
RESPONSE. We agree with the reviewer that there are uncertainties associated with currently available dose-response models. For example, FDA systematically evaluated dose-response model uncertainties and quantified its impacts in the 2003 FDA/FSIS risk assessment on L. monocytogenes in ready-to-eat foods (DHHS-FDA/USDA-FSIS, 2003). We plan to add the functional forms of the dose-response models reported in the BMD software into iRISK, which will provide more choices for the users to describe dose-response relationships for chemical hazards. The availability of the different models from the BMD software will assist the users in using the Sensitivity Analysis option in iRISK to evaluate the impacts of model uncertainty. We plan to provide the web link to the BMD software and the user manual (EPA, 2010b) in the iRISK reference list as a potential resource for iRISK users. [Comment 3-18]
The iRISK report does not address the complexities of hazard characterization transparently and systematically, as presented in BMD guidance (http://www.epa.gov/ncea/bmds/documentation/BMDS-users-manual-v2.pdf).
RESPONSE. We have added a description for the complexities associated with hazard characterization, citing several references that acknowledge the complexities associated with hazard characterization (FAO/WHO, 2003; US EPA, 2010b). We also indicated that in an in-depth risk assessment, such as the 2003 FDA/FSIS risk assessment on L. monocytogenes in ready-to-eat foods (DHHS-FDA/USDA-FSIS, 2003), uncertainties associated with dose-response models can be systematically evaluated to quantify the impacts on risk estimates. In iRISK, the impact of uncertainties associated with dose-response models can be evaluated in a simplified way by using the Sensitivity Analysis option. [Comment 3-19]
While users can manually input new data, assumptions, and relationships other than the few included dose-response models, expansion of the libraries for hazard characterization would support more transparent and robust cycles of analysis and deliberation with diverse stakeholders of risk analysis for foodborne hazards.
RESPONSE. We agree with the reviewer. In the next phase of iRISK development, we plan to expand the libraries for hazard characterization. As indicated above, we plan to add more model forms for microbial hazards that are reported in the literature, and add more functional forms of the dose-response models for chemical hazards such as those reported in the BMD software (US EPA, 2010b). In addition, we plan to provide additional references for hazard characterization to support more transparent and robust risk scenario development.

55
[Comment 3-20]
The authors rightly conclude that though iRISK is a powerful tool to advance comparative risk assessment, utility may be limited until additional resources are invested for populating iRISK libraries and pull-down menus and training users.
RESPONSE. We agree with the reviewer's comment. [Comment 3-21]
In addition, further development of case studies may be necessary to illuminate influential knowledge gaps for dose-response relationships that merit testing in model-directed research initiatives.
RESPONSE. We agree with the reviewer. In the next phase of iRISK development, we plan to develop additional case studies, which will include examination of the impact of knowledge gaps for dose-response relationships. 2. The iRISK model generates ranking of commodity-hazard pairs through a framework with two modules – a predictive multistage farm-to-fork process risk module and a hazard characterization module. Is the overall modeling approach fundamentally sound for the risk ranking purpose and scope? If not, what problems exist and how should they be addressed? If other approaches would be more suitable, the reviewer should provide a description and an explanation. [Comment 3-22] The overall approach for the two modules merits further analysis to determine whether or not this version of the iRISK model generates results that are fundamentally sound for supporting risk ranking decisions for allocation of resources for research and more definitive assessments. The exposure assessment module is generally well-designed and sound. However, the assumption that hazards are uniformly distributed in foods (page 33) is unlikely to be true, particularly for microbial pathogens that are known to grow in clusters, microcolonies, or colonies in the food matrix. RESPONSE. We agree with the reviewer that it is unlikely that the distribution of hazards (in particular microbial pathogens) in foods is uniform or homogeneous. This issue was also raised by reviewer #2 above and reviewers #4 and 5 below. In iRISK, the assumption of homogeneous distribution is for within a contaminated unit, but not across all contaminated units. We believe that this is a reasonable simplification in iRISK; this assumption is often made in published microbial risk assessments. A recently published paper (ILSI, 2010) describes approaches to model clustering of microbial hazards in foods. We plan to evaluate and, as appropriate, provide

56
a means to describe clustering of microbial pathogens (i.e., non-homogeneous spatial distribution) in future iRISK development. [Comment 3-23] It seems difficult to assess and communicate the impacts of homogeneity and alternative assumptions to other assessors and risk managers using the current version of iRISK. RESPONSE. We agree with the reviewer that in the iRISK version presented for peer review, it was difficult to use the sensitivity analysis option to evaluate the impacts of homogeneity. We plan to evaluate the recent literature and expand iRISK capacity in this aspect as appropriate in the future. [Comment 3-24] Assessing the soundness of the hazard characterization module is problematic. The three model forms included in the hazard characterization module for microbial hazards (exponential, beta-Poisson, nonthreshold linear) are insufficient to address model uncertainty or fit for key microbial datasets, including the recent high quality datasets generated by Smith et al. (2008) that is cited in Appendix 4. RESPONSE. A log-logistic model was selected to fit animal data obtained from experiments using pregnant rhesus monkeys (Smith et al., 2008). Although the recent datasets reported by Smith et al. (2008) are of high quality to predict dose-response for stillbirth in rhesus monkeys for a clinical strain, in order to appropriately use the animal data and model to predict human illnesses among different subpopulations with different susceptibility (DHHS-FDA/USDA-FSIS, 2003), it is essential to address factors important for extrapolation, such as differences in host susceptibility and variations in virulence of different L. monocytogenes strains in ready-to-eat foods (Gombas et al., 2003; Nightingale et al., 2008; Ward et al., 2010; Chen et al., 2011; Van Stelten et al., 2011). In the next phase of iRISK development, we plan to expand the library of dose-response functions, e.g., including a log-logistic model form for microbial pathogens, for users to choose when appropriate. [Comment 3-25] Parameters only are provided for FAO/WHO models referenced from projects begun nearly a decade ago for listeriosis (FAO/WHO, 2004) and salmonellosis (FAO/WHO, 2002) without reference to descriptions of the data sources and study designs, host species, raw data, data quality, rationale for extrapolations, and information on model performance. RESPONSE. We agree with the reviewer that assumptions and extrapolations were made in the models developed by FAO/WHO for listeriosis (FAO/WHO, 2004) and for salmonellosis (FAO/WHO, 2002). We plan to provide users references where in-depth review of these models was made. For example, an in-depth review of the raw data, host species, model performance and other information for the FAO/WHO Salmonella dose-response model was reported in the

57
FAO/WHO risk assessment on Salmonella in eggs and broilers (FAO/WHO, 2002) and in the FSIS risk assessment on Salmonella in eggs and egg products (USDA/FSIS, 2005). The dose-response models developed by FAO/WHO for listeriosis (FAO/WHO, 2004) and for salmonellosis (FAO/WHO, 2002) are among the latest models available to predict illnesses in humans. These models are being used in recent risk assessments, such as a risk assessment for Salmonella in low-moisture foods (Schaffner, 2010). We plan to add a short description in the user manual to indicate that assumptions and extrapolations are often made in developing dose-response models, which the user should be aware of and should document when selecting a model. In addition, when new dose-response models are developed incorporating the new data to predict listeriosis and salmonellosis in humans, we plan to evaluate and as appropriate include the new models into the iRISK dose-response model library. [Comment 3-26] No dose-response model is listed for the chemical hazard intended for consideration in this peer review. RESPONSE. Because of the broad scope of iRISK, we made a decision to focus the peer review on model structure and programming for both chemical and microbial hazards. We provided two risk scenarios for microbial hazards as examples for peer-review. We agree with the reviewer that it was a drawback not including a chemical risk scenario, although mathematical functions and an example of a process model and data for aflatoxin in nut paste were provided for review. We plan to further expand iRISK capacity to model chemical hazards in the next phase of iRISK development. [Comment 3-27] As a result of weaknesses in the hazard characterization module, the soundness of iRISK predictions is questionable. Unintended consequences may arise in predicted risk rankings as a result of convenient assumptions and simplifications in the hazard characterization module that are not based on the best available science or a cohesive knowledge of recently published and historical studies for the two pathogens of concern for this peer review. RESPONSE. As described above in the reply to comment 25 above, the latest models relevant to humans for foodborne Salmonella and L. monocytogenes infections were used in the two risk scenarios provided for peer review. Developing a dose-response model to predict human illness requires a great deal of expertise and resources. Published dose-response models are often used in subsequent quantitative risk assessments. We agree with the reviewer that there is more recent data available and we plan to take the new data into consideration in the future. [Comment 3-28] Although burden of disease approaches like DALY have developed over the past decade in multiple countries, hazard characterization in iRISK is applied as a black box with little objective

58
evidence provided for users to evaluate the impacts of the underlying assumptions and opinions for dose-response and dose-severity relationships. RESPONSE. We agree with the reviewer that there is a need to further strengthen the hazard characterization module in iRISK. As describe above, in the next phase of iRISK development, we plan to add more functional forms for dose-response models for both chemical and microbial hazards, evaluate the literature and, as appropriate, incorporate new data into existing dose-response models (or make use of revised models for pathogens such as L. monocytogenes and Salmonella when they are available). We plan to include references for risk characterization to facilitate user evaluation of the underlying assumptions and uncertainties associated with dose-response models. [Comment 3-29] Considerable expansions are needed to populate the library with recent studies, describe the data and assumptions behind the functions in the hazard characterization module, and prepare case studies using recent datasets. RESPONSE. We agree with the reviewer on the need to expand the hazard characterization module. As indicated above, in the next phase of iRISK development, we plan to further evaluate recent literature and datasets, populate the library with models from recent studies and enhance descriptions of data and assumptions behind the functions in the hazard characterization module (and/or provide references) as appropriate, and consider developing case studies for hazard characterization. [Comment 3-30] For example, Figures 1, 4, 5, and 10 in the report imply that dose-response and severity of health outcomes (DALY) are independent when this is unlikely to be true. RESPONSE. We have added information in the report to indicate that disease severity and illness duration may be dose-dependent. As described in the reply to a similar comment above (comment 3-15), dose-severity effect is not yet specifically considered in dose-response models in iRISK because of the lack of such models in the published literature. When such models become available, we plan to evaluate and incorporate them as appropriate in the future. In iRISK, the influence of dose-dependencies on public health burden is taken into account indirectly by using a metric such as DALY, where disease severity (including duration) is considered in developing a DALY template. [Comment 3-31] No rationale is provided in the report for uses of the terms DALY and pDALY (cited in Figures 1, 10, and 11 and referenced in Newsome et al., 2009), though this point was addressed by iRISK developers in their presentation at the 2010 SRA meeting.

59
RESPONSE. The iRISK version presented for peer review used the term DALY, while pDALY had been used in the risk ranking prototype (Newsome et al., 2009). In the prototype, the general use of DALY was modified slightly to pseudo-DALY (pDALY) to facilitate risk ranking for chemical substances that may have poorly characterized outcomes (Newsome et al., 2009). We recognize that DALY is one of several Health-Related Quality of Life measures available, and there are limitations in using these measures as a public health metric. In the next phase of iRISK development, we plan to provide an option in iRISK to select different metrics for risk ranking, e.g., cost of illness and Quality Adjusted Life Year (QALY). [Comment 3-32] Confidence in the predictions for hazard characterization is low from my perspective, based on the current report and limited documentation in the current version of iRISK for this module. RESPONSE. In the two risk scenarios presented for peer review, the dose-response models developed by FAO/WHO for listeriosis (FAO/WHO, 2004) and salmonellosis (FAO/WHO, 2002) were used because they were the latest dose-response models available (and in a model form built-in iRISK) to predict illnesses in humans. These models have been used in other recent risk assessments, e.g., a risk assessment on Salmonella in eggs and egg products (FSIS, 2005) and a risk assessment for Salmonella in low-moisture foods (Schaffner, 2010). Although these dose-response models may represent the best available models for humans, more recent data (e.g., animal data, molecular subtyping data) have been published in the literature. As described above, when new dose-response models are developed incorporating new data to predict listeriosis and salmonellosis in humans, we plan to evaluate and as appropriate include the new models into the iRISK library as appropriate. [Comment 3-33] Development of an additional appendix that introduces the basic principles of the disease triangle (variability in host, strain, and environment, as well as interactions, influencing likelihood and severity of disease) and dose-response assessment (increasing likelihood, severity, and duration of illness with increasing dose; decreasing incubation period with increasing dose) would be helpful. This appendix could introduce iRISK users to the literature on variability and uncertainty in dose-dependencies of disease progression, as well as comparisons of empirical and mechanistic dose-response approaches in the published literature. Scientific rationale could be presented for the simplifications implicit in the current hazard characterization module. RESPONSE. In the next phase of iRISK development, we plan to expand the iRISK dose-response library and provide more references for hazard characterization, which may include a list of references to existing review of the basic principles of the disease triangle, guidelines, a tutorial, case studies, scientific rationale for simplifications in hazard characterization, and other formats as appropriate.

60
[Comment 3-34] Expansion of the analytic options for modeling dose-response relationships and linkages through the user interface to iRISK may be needed. Existing tools for fitting a diverse array of empirical models include software developed by CFSAN for iterative, least-squares curve-fitting under Food Safety Initiative funds, the EPA Benchmark Dose (BMD) software (http://www.epa.gov/ncea/bmds/), and the analysis in commercial software conducted by Holcomb et al. (1999). Existing tools and guidance may be useful for linking to iRISK, particularly as options for additional programming are considered. RESPONSE. In the next phase of iRISK development, we plan to evaluate and as appropriate provide linkage to relevant papers and guidance (e.g., Holcomb et al., 1999; FAO/WHO 2003), and provide a reference or linkage to existing tools for dose-response modeling, such as the dose-frequency curve-fitting software (using least residual squares for the predicted percentiles as an optimization criterion) developed by FDA for the 2003 L. monocytogenes risk assessment, appendix 6 (DHHS FDA/USDA FSIS, 2003) and the BMD software (http://www.epa.gov/ncea/bmds/) as suggested by the reviewer. [Comment 3-35] For long term planning, more mechanistic tools could be considered that are consistent with recent National Academies reports (NRC 2007, 2009, 2010a, 2010b) and can incorporate data for pathways of toxicity and pathogenicity from high throughput methodologies predictive of adverse endpoints. Such mechanistic models for microbial hazards are being developed from theoretical principles and pathways of disease progression (Buchanan et al., 2000; Coleman and Marks, 2000; Buchanan et al., 2009). Introduction of such tools in both risk ranking and more definitive risk assessment has merit, increasing transparency and rigor for extrapolations that are problematic for many pathogens, particularly for the complexities of listeriosis and salmonellosis datasets that are the subject of this peer review. RESPONSE. We appreciate the reviewer’s suggestion for long term planning. Development of mechanistic models is an active area of dose-response research, as described in several papers cited by the reviewer on microbial hazards (Coleman and Marks, 2000; Buchanan et al., 2009) and for chemical hazards (NRC 2007 & 2010). When adequate consensus is generated and new mechanistic models are reported for foodborne pathogens such as L. monocytogenes and Salmonella and for foodborne chemical hazards, we plan to evaluate the new models as they become available, and provide linkage to the references and models as appropriate. [Comment 3-36] Expansion of the scientific rationale for hazard characterization is also needed in addition to additional analytic capabilities. Some key references that merit inclusion in future reports and libraries include studies on Listeria monocytogenes dose-response relationships for pathogenicity and virulence: (Lecuit and Cossart, 2002; Smith et al., 2003; Francois et al., 2006; Lecuit et al., 2007; Williams et al., 2007; Smith et al., 2008; Disson et al., 2009; Williams et al., 2009).


63
[Comment 3-39] Some key references that merit inclusion in future reports and libraries include citations for studies quantifying variability for all three elements of the disease triangle for salmonellosis (McCullough and Eisele, 1951a-d; Bohnhoff et al., 1954; Coleman and Marks, 1998; Coleman and Marks, 2000; Latimer et al., 2001; FAO/WHO, 2002; Oscar, 2004; Vijay-Kumar et al., 2006; Bollaerts et al., 2008; Sekirov et al., 2008; Woo et al., 2008; Lawley et al., 2009; Teunis et al., 2010). RESPONSE. We plan to evaluate the references suggested by the reviewer on variability of the disease triangle for salmonellosis (i.e., the pathogen, the host, and the food vehicle or environment) and, as appropriate, include them in the list of references for the dose-response module library. A reference that is of immediate application would be the risk assessment of Salmonella in eggs and broiler chicken (FAO/WHO, 2002), which reported a dose-response model for Salmonella based on efforts by an expert panel (the Joint FAO/WHO Expert Meetings on Microbiological Risk Assessment). Although some of the papers suggested by the reviewers may be more applicable to dose-response research conducted outside of iRISK, advanced iRISK users may benefit from reviewing the papers (e.g., Coleman and Marks, 1998 & 2000; Latimer et al. 2001; Bollaerts et al., 2008; Teunis et al., 2010) and use alternative dose-response models for Salmonella in developing risk scenarios or sensitivity analysis. 3. The iRISK BETA model structure consists of a number of components in the process risk module that describes changes in the prevalence and level of a hazard at various process stages. The components include nine choices: no change, increase (growth; for microbial hazards only), increase (addition), decrease, pooling, partitioning, evaporation/dilution, cross-contamination (partial), and cross-contamination (total).
3.1. Are the components in the model adequate to describe major relationships or outcomes at various process stages for the commodity-hazard pairs?
[Comment 3-40] Generally, the components are well designed, run rapidly, and generate excellent reports documenting details of scenarios as well as predicted results. Two major relationships that might merit further consideration are the assumption of uniform distribution of pathogens in foods and the magnitude of positive and negative interactions with the indigenous microbiota of non-sterile foods and biofilms (Jaykus et al., 2009). RESPONSE. In the iRISK version presented for peer review, uniform distribution of pathogens within a unit of foods (but not among all units in a batch) was assumed. Although this is a simplifying assumption, as commented by reviewer #4 below, few complete microbial risk assessments address this issue. In the next phase of iRISK development, we plan to further evaluate relevant papers (ILSI, 2010; Nauta, 2005) and, as appropriate, provide a means to describe clustering of microbial pathogens in foods. Similarly, it is complex to describe the

64
effect on pathogen growth and inactivation by indigenous microflora (e.g., Burnett et al., 2005; Scott et al., 2005; NACMCF 2005 and 2010) and biofilms (e.g., Chmielewski and Frank, 2003, 2004 & 2006; Berrang et al., 2008 & 2010; Frank, 2009). We plan to further evaluate relevant papers on the influence of indigenous microflora and biofilms and, as appropriate, provide references and linkage for iRISK users to consider when they model growth and inactivation of pathogens in the process module. [Comment 3-41] In my opinion, model-directed research may be needed to address the impacts of expert opinions and data generated from predictive microbiology experiments, often conducted in sterile culture media rather than in typical food matrices. Development of more comprehensive case studies (with model-directed research) would be helpful to test adequacy of the process risk module and identify areas for future improvement. RESPONSE. There is guidance available in the literature on factors that should be considered when using predictive microbiology data and models (Scott et al., 2005; NACMCF 2005 and 2010). Data and predictive models generated using sterile culture media and food matrices with background microflora have been reported (e.g., Burnett et al., 2005; Hwang and Sheen, 2009; Mejlholm et al., 2010). In the next phase of iRISK development, we plan to evaluate and, as appropriate, provide references to available guidance and predictive modeling tools for iRISK users to consider, e.g., ComBase Predictor (http://www.combase.cc/toolbox.html); Seafood Spoilage and Safety Predictor (http://sssp.dtuaqua.dk/download.aspx); Pathogen Modeling Program (http://pmp.arserrc.gov). We plan to evaluate and develop case studies for iRISK-directed research to fill data and knowledge gaps.
3.2. Are there additional components that should be incorporated into the model? Is there any component or function currently in the model that is not necessary and should be omitted? If so, the reviewer should explain how to address such changes in the model. [Comment 3-42] As noted above, I am unsure if effects associated with biofilms and non-sterile food matrices are easily modeled in the present version of the module. The authors may wish to include additional text in the report or training materials to acknowledge the ‘state of the science’ supporting the current iRISK modules. RESPONSE. This comment is similar to comment 4-40; see reply above. We plan to consider including information in relevant risk scenario reports and training materials as appropriate. 4. The report describes the functions or equations (Equations 1 through 11) that underlie exposure assessment and risk characterization in the iRISK model.

65
4.1. Is there any of the assumptions underlying these functions or equations in the iRISK BETA model unreasonable, according to current modeling and peer-review practices? If so, please explain. [Comment 3-43] The rationale provided in the report for Equation 1 (page 32) is insufficient to support peer review at present. Neither does the discussion of dose-response models (page 16) provide insights into the design of the software and its supporting scientific rationale. It is unclear how robust the estimates of probability of an adverse health effect (R f,h) are for Equation 1 estimating the DALY. RESPONSE. There is explanation of the rationale for Equation 1 provided on p. 32-33 following the equation. For example, for a microbial hazard, the probability of an adverse health effect (R f,h) is estimated from input of a dose-response model, the prevalence of contaminated units and the concentration of the pathogen in contaminated units obtained from the process model. It is unclear whether the reviewer's comment is on the robustness of the data input or the equation itself. The robustness of the R f,h estimate would depend on the validity of the data input (prevalence, concentration, dose-response model). The robustness of the DALY estimate would depend on the robustness of R f,h, DALY h (the DALY per case), and E f (the number of eating occasions per year). Equation 1 is relatively straightforward in that it is the multiplication of the three terms (R f,h, DALY h, and E f) to obtain the disease burden estimate (e.g., annual DALY estimate). The iRISK software is designed to enable users to input the relevant data and carry out the calculation using Equation 1 (built-in behind the scene). A response to the comment on scientific rationale for dose-response models is provided in the reply to comment 3-2 above. [Comment 3-44] Dose-dependent severity is not addressed, nor are limitations of predicting illness or death from surrogates of infection for existing datasets. RESPONSE. Dose-dependent severity and predicting illness or death from existing dataset (including the use of pathogens or surrogates in animal models) are complex issues as commented by the reviewer above. We provided responses on these issues above, e.g., in the responses to comments 3-3, 3-15, 3-28 and 3-30 above. [Comment 3-45] It is unclear how cancer and non-cancer endpoints will be compared with acute effects for microbial hazards. RESPONSE. We recognize that it is challenging to compare hazards associated with acute effects vs. those with chronic effects. We plan to focus on microbial hazards and acute chemical hazards initially. For chronic chemical hazards, we plan to focus on those that have a defined

66
nonthreshold dose-response relationship (e.g., causing cancer) and could consider non-cancer endpoints in the future. We believe that focusing on microbial hazards and chemical hazards with acute effects in the near term and improving risk estimates for chemical hazards with chronic effects in the future will enable better comparison of the risks among these hazards. [Comment 3-46] The report mentions reference doses that could be predicted as points of departure from the EPA Benchmark Dose (BMD) software but does not define reference doses for microbial or chemical hazards. Model uncertainty, significant for many dose-response datasets, is not addressed or acknowledged in the report or the iRISK user interface. In contrast, 30 model forms and guidance for their application are documented for the more mature EPA BMD software (http://www.epa.gov/ncea/bmds/documentation/BMDS-users-manual-v2.pdf). FDA could consider linking additional analytical tools or adding a diverse array of empirical model forms to the drop down menus to increase transparency and consistency of the current approach. RESPONSE. In the next phase of iRISK development, we plan to provide the 30 model forms in the EPA BMD software in iRISK as choices for users. We will also consider adding more empirical dose-response model forms to the drop down menus based on available models in the published literature, and provide linkage to dose-response guidance and modeling tools such as the EPA BMD software in a global reference list for iRISK. [Comment 3-47] This point is relevant to previously cited literature for hazard characterization of listeriosis (Lecuit and Cossart, 2002; Smith et al., 2003; FAO/WHO, 2004; Francois et al., 2006; Lecuit et al., 2007; Williams et al., 2007; Smith et al., 2008; Disson et al., 2009; Williams et al., 2009) and salmonellosis (McCullough and Eisele, 1951a-d; Bohnhoff et al., 1954; Coleman and Marks, 1998; Coleman and Marks, 2000; Latimer et al., 2001; FAO/WHO, 2002; Oscar, 2004; Vijay-Kumar et al., 2006; Bollaerts et al., 2008; Sekirov et al., 2008; Woo et al., 2008; Lawley et al., 2009; Teunis et al., 2010). RESPONSE. This comment is similar to comments 3-36 to 3-39. See replies to comments 3-36 to 3-39 above.
4.2. Are these functions or equations scientifically justified and biologically sound for the purpose they are used in the model? [Comment 3-48] Evidence to support a sound biological basis for the hazard characterization module and Equation 1 is not provided. RESPONSE. This comment is similar to comments 3-43. See reply to comment 3-43 above.

67
4.3. Considering the model provided for the two commodity-hazard pair examples, are the equations or functions accurately implemented in the model? If not, please explain. [Comment 3-49] The accuracy is unknown for the hazard characterization module and Equation 1. RESPONSE. This comment is similar to comments 3-2 and 3-43. See responses to these comments above. 5. A key feature of iRISK BETA is the ability to compare both chemical and microbial risks. The model reporting allows users to compare risks with different metrics. In addition to a mean risk of illness, the annual DALY is used. With this in mind, 5.1. Comment on the appropriateness of using the annual DALY and the strengths and limitations of the implementation of this metric in the model. [Comment 3-50] The strength of the DALY approach is the rapidity of analysis for those agents for which DALY templates have been completed in expert elicitations conducted abroad. The limitations include potential subjectivities and biases of experts and lack of characterization of the dose-dependencies of disease severity observed for both chemical and microbial hazards. An additional limitation is uncertainty about representativeness of existing DALYs for US populations and health care systems. RESPONSE. We agree with the reviewer’s comment on the strengths and limitations of the DALY approach. We have added information to the iRISK report to reflect this comment. We plan to provide similar information in the user manual. In the next phase of iRISK development, we plan to develop a DALY template using health trees that are relevant to the U.S. drawn from U.S. information source such as CDC data (Scallan et al., 2011) and Economic Research Service data (ERS, 2010), as well as providing another metric such as QALY. 5.2. Comment on the appropriateness of available options for microbial and chemical dose response functions in the model and how they are used. [Comment 3-51] The documentation for assessing dose-response relationships is incomplete. For microbes, neither the user interface nor the report provides a synthesis of the available knowledge for dose-response assessment, even though the report states that ‘specific data sources and assumptions are fully documented in the iRISK model’ (page 62). For example, the description for the LM

68
exponential models cites the comprehensive and extensively documented FAO/WHO report, but do not specify strain, host, endpoint, data source(s), or extrapolations for estimated parameters. RESPONSE. On the dose-response page of iRISK, there is a "Rationale/References" text box for the user to document the source and the evaluation of the dose-response model selected. In some cases, the user may cite a comprehensive and extensively documented report, such as the FAO/WHO L. monocytogenes risk assessment report (FAO/WHO, 2004 ), as an expert source of a dose-response model and provide appropriate reference(s) for further information. This was the approach used in the "Listeria in Soft Ripened Cheese in Adult 60+" risk scenario presented for peer review. The report (p.62) presented for peer review describes an approach we took to populate iRISK in the proof-of-concept testing of the tool, but those risk scenarios were not shared with the peer reviewers. We plan to add a description to the user manual to provide guidance for users to document rationale and references for the dose-response model, which should include a synthesis of the available knowledge and, where appropriate, include information on the strain, host, endpoint, data sources and extrapolation. [Comment 3-52] References cited in the example hazard sheet for listeriosis in Appendix B are not included or cited in the user interface, nor are data or models included in pull-down menus for the hazard characterization module. RESPONSE. The hazard sheet for listeriosis in Appendix B in the report presented for peer review was intended to show the type of background information made available to a panel of experts from whom data was obtained via an expert elicitation for iRISK proof-of-concept testing. A few references (NZFSA, 2001; DHHS FDA/USDA FSIS, 2003; Williams et al., 2007; Smith et al., 2008) were cited in the hazard sheet on L. monocytogenes dose-response relationship, which discussed the differences in dose-response among the animal models (Williams et al., 2007; Smith et al., 2008), outbreak data (NZFSA, 2001) and a model obtained through a comprehensive analysis that considered animal data, outbreak data, and variation in human subpopulations and L. monocytogenes strains (DHHS FDA/USDA FSIS, 2003). As described in responses to several comments above, the animal models developed using pregnant rhesus monkeys (Smith et al., 2008) and pregnant guinea pigs (Williams et al., 2007) were not chosen because these are not directly applicable to predict human listeriosis without addressing factors essential for the extrapolation, such as differences in host susceptibility and variation in virulence among L. monocytogenes strains in RTE foods. Dose-response models developed in the FDA/FSIS risk assessment (DHHS FDA/USDA FSIS, 2003) are for human subpopulations, but the models have a complex form and could not be readily replicated using the available dose-response model forms available in iRISK. In the example risk scenario "Listeria in Soft Ripened Cheese in Adult 60+" presented for peer review, the dose-response model developed by FAO/WHO (FAO/WHO, 2004) was chosen because of its relevance to humans and its simplicity.
69
[Comment 3-53] For mycotoxins, the iRISK description lists ‘example’, but no dose-response or reference dose is provided in the user interface. The report includes an example for mycotoxins (aflatoxin hazard sheet in Appendix B) that suggests that acute poisoning and chronic carcinogenic endpoints are of concern. RESPONSE. We recognize that there was a limitation in the peer review because we provided an example of a process model and data (aflatoxin in nut paste) but did not provide a completed risk scenario online for a chemical hazard. In the next phase of iRISK development, we plan to develop an example risk scenario for aflatoxin, first considering a chronic carcinogenic endpoint because of low potential exposures overtime. However, we recognize that acute effects could be relevant in certain regions of the world if the potential exposure is high enough to produce an acute effect. Relevant risk scenarios could be developed in the future. [Comment 3-54] The scientific rational for comparing cancer and non-cancer effects, even with adjustment to annual risk, and acute microbial risks is not developed in the report or referenced in the user interface or training materials. RESPONSE. In the next phase of iRISK development, we plan to identify references and guidance in the published literature on dose-response analysis for hazards that have acute vs. chronic effects, provide the references in the global iRISK reference list for users, and incorporate relevant information in iRISK training materials as appropriate. [Comment 3-55] As previously stated, the dose-response options need expansion and integration across microbial and chemical hazards. Further, development of scientific rationale is needed to provide context for the predictions. RESPONSE. We agree with the reviewer on the need for expanding dose-response options. As described in the responses to several similar comments made by the reviewer above, we plan to address these issues in the next phase of iRISK development. 5.3. Overall, are the results generated appropriate for comparing chemical and microbial risks and risk ranking purpose? If not, the reviewer should explain other results and/or analyses that are needed. [Comment 3-56] More extensive case studies may be needed to determine the impact on risk rankings for multiple datasets and empirical models depicting dose-dependent likelihood and severity across hazards.

70
RESPONSE. In future iRISK development, we plan to develop more case studies to evaluate the impact of multiple dose-response datasets and empirical models, review the literature for models that describe dose-dependent likelihood and severity and use those models as appropriate. 6. Given that the primary purpose of iRISK BETA is ranking risk among a number of commodity-hazard pairs, are variability and uncertainty adequately characterized in the model? If not, please explain what changes might be considered to improve characterization of variability and uncertainty. [Comment 3-57] While variability and uncertainty are not fully characterized in the current version of iRISK, the tool has great utility. The exposure assessment module is particularly well designed to rapidly test alternatives and generate reports for ranking and sensitivity analysis. When the hazard characterization module is further populated, characterization of variability and uncertainty for dose-dependencies will likely improve. Expansion of treatment of variability and uncertainty in the report and supporting training materials is needed. RESPONSE. We appreciate the reviewer’s comment. In the next phase of iRISK development, we plan to expand the treatment and reporting of variability and uncertainty, e.g., providing more probability distributions to describe variability in exposure assessment, graphic presentation of the variability in process model and risk ranking outputs, and scenario analysis results. Relevant information may also be incorporated into supporting training materials. [Comment 3-58] Depending on future use of iRISK, additional programming for characterizing variability and uncertainty may not be needed. For a 2-tiered process, the first tier, iterative (annual?) risk ranking for commodity-hazard pairs, may be conducted without programming improvements to iRISK. The second tier analysis for high risk pairs, detailed quantitative risk assessment, may require supplemental tools or expansion of iRISK capabilities to more fully characterize variability and uncertainty. RESPONSE. We agree with the reviewer's comment. 7. Given the practical constraints of the model and data, a sensitivity analysis option is provided by which the user can specify 5 alternate values for a single parameter in the Process Model, Dose Response Model, or Consumption model, and obtain the ranked results as compared to the original scenario. If this approach is not sufficient, please provide additional or alternative approach(es) and explain what changes might be considered and how they would improve the model.
71
[Comment 3-59] The sensitivity analysis option provided runs rapidly and provides helpful insights to model behavior for a single parameter. Parameters that are not independent will require more complex analysis. Expectedly influential parameters (e.g., dose-dependent severity) may not be identified given the current model structure. Development of additional case studies may be helpful to evaluate sufficiency of the current approach for decision support on risk ranking. RESPONSE. We agree with the reviewer that parameters that are not independent (such as dose-dependent severity) will require more complex analysis. In future iRISK development, we plan to consider developing case studies to help evaluate dose-dependent severity when data are available to model dose-dependent severity or when such models become available, and to help evaluate its impact on risk ranking. 8. Comment on the iRISK BETA user interface. Is the interface user friendly? Are there any features that should be modified or added to facilitate ease of use? For example, is there sufficient description in the user interface to understand each component of the model? [Comment 3-60] The user interface is generally well designed and user friendly. The capability for collaborative development of shared scenarios is an advantage of iRISK for risk assessment teams that may operate from multiple work sites. Expanding some of the following options may be necessary if iRISK is envisioned for use by both risk ranking and risk assessment teams.
Linkage of other analytical tools (e.g., curve fitting routines, distribution fitting routines, statistical procedures) or procedures to import data and models from Excel through the user interface.
RESPONSE. In future iRISK development, we plan to evaluate and, as appropriate, provide linkage to analytical tools such as those suggested by the reviewer. We also plan to expand iRISK capacity to import data from an external source (such as Excel) through the user interface, and evaluate the feasibility of importing external models. [Comment 3-61]
A glossary and a bibliography searchable by keywords might be helpful, with URLs (or pdfs) for reports, studies, and model code.
RESPONSE. We plan to develop a searchable bibliography (a global reference list with URLs to the abstracts or pdf reports where publicly available). We also plan to develop a glossary in the near future and continue to expand the list of global references in the next phase of iRISK development.

72
[Comment 3-62] A section on tips or frequently asked questions.
RESPONSE. In the next phase of iRISK development, we plan to develop a set of frequently asked questions and tips, which will take into consideration from user feedback during the first public release of iRISK. [Comment 3-63]
More structured detail in the user interface on the studies supporting various dose-response models (e.g., raw data sets, strains and serotype, identity and status of hosts (species, numbers, fasting or non-fasting, immunocompromised status, vaccination status), matrix and route of administration, study type (epidemiological investigation or clinical study), and other factors potentially influencing study quality and disease progression.
RESPONSE. In the next phase of iRISK development, we plan to evaluate and, if appropriate and feasible, add more features in the user interface to assist users to document in more structured detail the evaluation of studies supporting dose-response models and the rationale for selecting a dose-response model.
[Comment 3-64]
Additional guidance or menu options for assessing the impact of model uncertainty, correlation of parameters within and across modules, dose-dependent severity for the hazard characterization module.
RESPONSE. We will consider these suggestions in future iRISK development. 9. Comment on the adequacy of the model documentation features within iRISK. Can the user accurately document data sources and confidence in the model? [Comment 3-65] The model documentation in scenario summary reports is excellent for the exposure module. As noted previously, some improvements in model documentation are suggested for the hazard characterization module. RESPONSE. We appreciate the reviewer’s comment. See reply to comment 3-63 for next step planned to improve documentation of hazard characterization.

73
[Comment 3-66] For some study types, general fields input by the user such as ‘description’ could be replaced by menu-driven input types to promote more transparent and consistent documentation. FDA might benefit from lessons learned by EPA in development of BMD software, guidance, and training to assist new and continuing users in gaining proficiency and contributing to future improvements. RESPONSE. FDA will consider these suggestions in future iRISK development. III. SPECIFIC OBSERVATIONS ON THE DOCUMENT [Comment 3-67]
Page Section Corrections 11 1.2.1 Delete ‘be’ in paragraph 2, line 2 34 2.4.3 Replace ‘but’ on 3rd line below Equation 2 with ‘by’ 43 4.1 Table on 4th line of 1st paragraph not specified; Table 7 includes 21
hazards, not 20 48; 61 4.1; 4.5.1 Insert space between text and number for ‘Table8’ at bottom of first
paragraphs 75 Incubation
period Delete ‘weeks’ between ’30 days)’ and ‘;’
RESPONSE. We have made the changes in the indicated sections of the report, as suggested by the reviewer. IV. SPECIFIC OBSERVATIONS ON THE iRISK MODEL
URL/Steps to get to URL Comments Listeria monocytogenes as hazard, DR models from FAO/WHO project undertaken in 2002
[Comment 3-68] More recent log-logistic DR models for stillbirths in NHPs and guinea pigs (Smith et al., 2008; Williams et al., 2009) could not be imported into the current iRISK hazard characterization module; work around was to create a new exponential model and vary r to match lower bound of LD50. RESPONSE. We concur with the reviewer that a work-around can be done to create a new exponential model and vary the r-value of the model to match LD50 from the log-logistic models reported. As described in the replies to several comments above (comments 3-37, 3-38 and 3-51), the log-logistic dose-response models for stillbirths developed using pregnant rhesus monkeys (Smith et al., 2008) and

74
pregnant guinea pigs (Williams et al., 2007) are not readily applicable to predicting human listeriosis without addressing factors essential for the extrapolation, such as differences in host susceptibility and variation in virulence among L. monocytogenes strains in RTE foods. The new animal data, along with other data and information, could nevertheless be included in an update of L. monocytogenes dose-response models developed in the FDA/FSIS risk assessment (DHHS FDA/USDA FSIS, 2003). In the next phase of iRISK development, we plan to include additional dose-response model forms, such as a log-logistic model, as a choice for users to explore the impact of choosing a model different from the FAO/WHO dose-response model (FAO/WHO, 2004) on risk estimates.

75
REVIEWER #4 I. GENERAL IMPRESSIONS [COMMENT 4-1] My overall impressions of iRISK and the report are quite positive, though there are some things that should be improved. This is a flexible and powerful new modeling framework, and it has great potential as a risk assessment tool. The basic idea of easily-expandable pathogen-food process modeling might provide a middle ground between qualitative judgment about risk and resource-intensive “full-blown” risk assessments. As a browser-based tool, it might introduce risk assessment to new people, while the collaborative tools such as repository sharing hold great potential for FDA to create a vibrant modeling ecosystem that overcomes stove-piping. One of the main benefits of using a web interface is that non-modelers can create and run models. This is an important form of accessibility, but in practice, iRISK is complicated enough that only those already familiar with QMRA will be able to use it. Analysts will need to be trained, which seems to remove much of the benefit of using a web interface. RESPONSE. We appreciate the reviewer’s comment. We concur that training is necessary to help users to navigate the web interface and use the iRISK tool appropriately. However, the degree of training would be less intensive than what is required to do a quantitative risk assessment without the use of the iRISK tool. We believe that a web interface provides several benefits, including a tool for novice risk assessors and a means for users from locations around the world to access iRISK. [COMMENT 4-2] Furthermore, the UI (user interface) is very difficult to navigate – it is unconventional because it uses both panes and pop-ups, uses folders that don’t nest like one would expect, and has a very flat, text-heavy feel overall that makes it incredibly difficult to “place” yourself in the model. This feeling of being disoriented in the modeling space (the mental space, really) is the greatest challenge, but it might be overcome through the use of visual cues and better nesting of folders. RESPONSE. We agree with the reviewer that improvements for the user interface are desirable to make it more straightforward to navigate the user interface. Currently, the iRISK user interface allows the user to build a food-hazard risk scenario, after a food and a hazard have been defined, from any point in any sequence among the following model elements: process model, consumption model, dose response model, and health outcomes. We have initiated efforts to develop a step-by-step user interface that will allow the user to build a risk scenario in a “linear” fashion.

76
[COMMENT 4-3] While I am impressed with the technical details of the model and its data sharing tools, I am less enthusiastic about its role in decision making because I do not feel that FDA has a very good understanding at this date how it is to be used. RESPONSE. In developing iRISK, our goal has been to develop a tool that allows continuous evaluation of which FDA-regulated products cause the greatest burden of foodborne disease. Although the intended use of iRISK is necessarily broad, iRISK is flexible and allows risk comparison across many dimensions such as different hazards (both microbial and chemical hazards), different foods, different food processing and handling practices, and different populations. It also has a built-in Sensitivity Analysis option to facilitate the evaluation of intervention effectiveness. We recognize the need for articulating more specific risk management questions. Given the capacity and flexibility of the tool, iRISK can be used to address more specific risk management questions as they arise. [COMMENT 4-4] The risk management questions the model was designed to address are not really provided and seem to have shifted over time, without any explicit acknowledgment. RESPONSE. Although iRISK originated from a risk ranking prototype (Newsome et al., 2009) and has evolved and improved over the last few years, the overarching risk management need that has guided its development was the need to address the relative risk to public health from a large number of food-hazard pairs. We expect that iRISK can be used to address more specific risk management questions in the future. [COMMENT 4-5] It seems to be a foundational principle that iRISK handle both chemical and microbial risks for side-by-side risk ranking, but we were not provided any prioritization decision contexts that would require this, nor enough data or example modules to test out chemical risk assessments. RESPONSE. There is a need to compare and rank chemical and microbial risks because potential hazards in FDA-regulated products include both microbial and chemical hazards. For example, depending on the FDA-regulated product and process, chemical hazards (such as aflatoxins and histamine) and microbial hazards (such as Salmonella and L. monocytogenes) may occur and cause foodborne illness when not properly controlled. As described in the response to a similar comment from Reviewer #1 above, we recognize that there was a limitation in the peer review process, in that a risk scenario for a chemical hazard was not provided for review. However, the mathematical functions and equations underlying exposure assessment and risk characterization for both chemical and microbial hazards were provided for review. While the initial focus of the iRISK development was on microbial hazards, we plan to continue developing the iRISK tool with more emphasis on chemical hazards in the future. [COMMENT 4-6]

77
Furthermore, it is not specified how the results of the model might be incorporated into decision making. RESPONSE. iRISK can be used as part of a risk-based process to continuously evaluate which products cause the greatest burden of foodborne disease. For example, the iRISK model results can be used as input for risk prioritization, a process that takes into consideration non-public health factors such as economic consequences, capacity to intervene and policy imperative. [COMMENT 4-7] The reports are still quite technical and do not suggest how they could be used to inform non-technical decision makers. RESPONSE. We concur with the reviewer that the summary report generated by iRISK is technical and additional explanation may be necessary when the results are presented to inform decision makers. We plan to add "annual number of illnesses" as an output in the report to facilitate communication, as well as making other enhancements such as graphic presentation of risk ranking results and the results from sensitivity analysis of different what-if scenarios or different interventions. [COMMENT 4-8] With all of these things uncertain, the model seems like a potentially valuable and powerful tool, but currently adrift and unsettled in how it might be used. RESPONSE. We anticipate addressing these issues further in the next phase of iRISK development. II. RESPONSE TO CHARGE QUESTIONS 1. Is the report clearly written and follow a logical structure and layout? If not, the reviewer should provide suggestions for how to better document the risk assessment. [COMMENT 4-9] The report follows a logical structure and layout, but lacks crucial details on the risk management questions that the model was designed to address as well as how the model or its results would be incorporated into the decision making process. I recommend either significantly expanding the introduction chapter or creating a new chapter to address these concerns. RESPONSE. We anticipate addressing these concerns in the next phase of iRISK development. 2. The iRISK model generates ranking of commodity-hazard pairs through a framework with two modules – a predictive multistage farm-to-fork process risk module and a hazard

78
characterization module. Is the overall modeling approach fundamentally sound for the risk ranking purpose and scope? If not, what problems exist and how should they be addressed? If other approaches would be more suitable, the reviewer should provide a description and an explanation. [COMMENT 4-10] This was the toughest question to address. While I find the modeling approach to be technically sound and the web-based interface to have great potential as a risk assessment and data management tool, there is a lack of clarity about the risk ranking purpose and scope, which makes it difficult if not impossible to evaluate iRISK on the most fundamental point: does the model answer the questions it was designed to answer? RESPONSE. The purpose of risk ranking is to evaluate and rank the relative risks from specific food safety hazards in FDA-regulated products. We believe that iRISK is a flexible tool that can be used to meet this purpose. [COMMENT 4-11] The overall multi-module approach is fundamentally sound as a preliminary risk assessment tool. It is well-based in QMRA methods and process modeling approaches that are used the world over. The simplified approach to modeling is a strength, not a weakness, as it should allow for more rapid risk assessments done in a more exploratory, experimental way than is currently done in published FDA risk assessments. (FDA likely conducts many qualitative and semi-quantitative rapid risk assessments already, but I am not familiar with them). The simplified process model should allow for the rapid iteration and development of models that can be used to explore and assess a wide variety of food production, and should be very useful for quickly identifying leverage points within systems to which FDA may focus attention. I greatly appreciate that the model incorporates an integrated measure of public health burden rather than just counting illnesses, and I like that it allows for the modeling of sensitive subpopulations. Ranking results from this model should be useful for informing certain types of prioritization decisions. RESPONSE. We appreciate the reviewer’s comment. [COMMENT 4-12] However, the interface between science and policy is the great weakness here. The document states on page 6 that it is “envisioned” that FDA will use the iRISK tool in a “risk prioritization effort.” The vagueness and lack of confidence expressed in how it is to be used are unsettling. What are the specific risk management questions being asked of this model, and how is it to be used in various decision making contexts? To be clear, this is not an issue for the modelers or model developers, but a question for risk managers for whom the model is presumably designed. Even if such scenarios are not certain, the presentation of some potential scenarios would be quite useful.

79
RESPONSE. We agree with the reviewer that there is a need to further strengthen the interface between science and policy, and we plan to continue to work on strengthening the connection. We plan to develop several case studies to help illustrate iRISK applications. We have developed a case study where iRISK is used to generate risk ranking results that complement and enhance risk ranking from other tools such as the Foodborne Illness Risk Ranking Model (FIRRM). For example, the FIRRM model provides an estimate of the number of illness cases for Listeria monocytogenes in the dairy product category (Batz et al., 2011); we used iRISK to generate risk estimates for L. monocytogenes in more specific dairy products within the dairy product category, such as pasteurized milk, unpasteurized milk, high-fat dairy products, and cheeses that support L. monocytogenes growth. We believe the capacity in iRISK that allows assessing risk for a specific food and the inclusion of an exposure module (e.g., a process model) where users can evaluate the impact on risk reduction by applying interventions at specific processing steps can be very useful to inform risk management decisions. [COMMENT 4-13] One concern relates to the intent of the original model as it was designed and the state of the current model. iRISK is a far superior implementation of the basic ranking methodology that was introduced a number of years ago, but the purposes of that model seem to be quite different than the current stated purposes. Has the purpose changed? If so, FDA needs to be clear how. For example, page 6 cites an article by Newsome et al. that is titled “Development of a Risk Ranking Framework to Evaluate Potential High Threat Microorganisms, Toxins, and Chemicals in Food.” This sounds like model development was originally driven by bioterrorism concerns, yet the current model is framed as relating to prioritization of resources. RESPONSE. We agree with the reviewer that the original risk ranking prototype reported by Newsome et al. (2009) was a framework developed to evaluate potential high threat hazards but despite the title of the journal article, the tool development was driven by food safety concerns, not bioterrorism concerns. We have funded additional research to further develop the original prototype into iRISK. Although the prototype served as a basis for iRISK development, iRISK includes a number of new features and enhancements that are designed to enable risk assessment and risk ranking of a broad variety of risk scenarios for a wide range of microbial and chemical hazards. [COMMENT 4-14] The implications of this change in context/purpose should not be discounted. In bioterrorism, the driving question might be “what agents in what foods should we be most worried about?” which naturally leads to the type of tool, with the implicit assumptions, that must wrestle with the issue of how to model and compare the very different outcomes (acute vs. latent vs. chronic, cancer vs. gastroenteritis vs. other conditions) resulting from biological and chemical contamination. It’s also true that a terrorist might introduce a certain type of hazard into a food in which it is not naturally associated, or dose some product at a much higher level that might occur naturally or even due to an unintentional mistake along the farm-to-fork continuum, and therefore the tool must be flexible enough to model situations that fall outside the “norm” of what one normally

80
sees. A terrorist might also introduce the hazard at multiple points along the farm-to-fork continuum, so it is important to model the implications. The driving question behind resource prioritization seems quite different though. It might be more like “which hazards in which commodities have been causing the greatest public health impact,” but since FDA regulates microbial safety quite different than chemical safety, one must wonder when one would need to compare impacts from both microbial and chemical hazards? RESPONSE. iRISK is indeed designed to address the question of "which hazards in which commodities have been causing the greatest public health" burden. Furthermore, iRISK provides a framework to evaluate the potential impact of control measures on risk reduction. Although FDA may have regulated microbial safety differently than chemical safety, a tool that enables comparison of microbial and chemical risks will provide new information to inform risk management decisions in the future. [COMMENT 4-15] What is the specific prioritization or resource allocation decision that requires comparing chemical and microbial hazards? If there isn’t one, why does the model do both? Likewise, how does the use of multiple stages of predictive modeling relate to the specific needs of resource allocation decisions? RESPONSE. We recognize that specific risk management questions regarding prioritization decision need to be defined. iRISK has been designed to generate risk estimates for both microbial and chemical hazards so as to better inform risk management decisions in the future. The use of multiple stages of predictive modeling in iRISK enables the evaluation of the effectiveness of potential control measures at various steps in the farm-to-form supply chain. Information on the public health impact of potential control measures is critical for decisions on resource allocation that may take into consideration both public health and non-public health factors. [COMMENT 4-16] And more importantly, were sacrifices made in the development of the model so that chemical and microbial hazards could be compared that reduce the utility of the model for solely focusing on one type of hazard over the other? RESPONSE. We have tried to seek a balance between complexity and applicability, taking into account data available and outputs desired. iRISK is intended to be broad (enabling comparison of a large number of commodity-hazard pairs) instead of in-depth. Specific sacrifices were not necessarily made with regard to the utility of model; but rather, the scope of iRISK has been broadened to include structure and programming for both microbial and chemical hazards instead of focusing on one type. [COMMENT 4-17]

81
Risk assessments should be designed around specific risk management questions, and the fact that these questions seem to have changed without a clear acknowledgment leads one to wonder whether the current approach is the “right” approach or whether it was simply the approach in which FDA had already invested considerable resources. It is understandable that management priorities change, and that a consequence, programs and projects must also change. But FDA needs to be transparent and honest about how priorities or purposes have changed, and how the current model addresses, and does not address, the principal questions it is now hoped to address. I do not mean to be presumptuous, but my suspicion is that as FDA developed this model, they were pleased with the promise it showed from a technical standpoint, and continued to fund its improvement, but along the way the risk management questions it was designed to address slowly changed. Now, FDA is trying to determine late in the game exactly how they’ll use this admittedly powerful tool. I would like FDA to specify not only specific risk management questions, but how the model is envisioned to be used in practice. For example, is iRISK intended to replace, enhance, or work with the CFSAN Relative Risk Ranking Model described on page 6? How are the outputs from the model going to inform decision makers? RESPONSE. We concur with the reviewer on the importance of designing risk assessments to address specific risk management questions. We appreciate the reviewer’s comment on the technical strength of iRISK. iRISK has improved capacities beyond CFSAN’s current risk models, e.g., the L. monocytogenes in ready-to-eat foods risk assessment and the Vibrio in raw oyster risk assessment. Although each risk scenario developed using iRISK is a risk assessment, iRISK itself is designed as a risk assessment tool that is flexible enough to enable the development of a broad variety of risk scenarios (i.e., a large number of simplified but complete risk assessments). In addition, iRISK is designed to include a capacity for the online sharing of data and models by a community of users and to serve a knowledge management function, e.g., with a library of risk scenarios. Risk management questions that have been formulated for the iRISK tool are, by necessity, broad and flexible, e.g., “what risk does a hazard/food pair pose to a population?”, “which hazards in which commodities cause the greatest burden of foodborne disease?”, and “what are the public health impact of an intervention at a specific step of production/manufacturing/handling process from farm to table?”. We believe that iRISK can be used to address more risk management questions, which are yet to be defined. iRISK is intended to enhance FDA’s risk capacity and provide risk ranking tools to other interested parties. We believe that both qualitative and quantitative methods of risk ranking can be useful depending on the problem to be addressed and the availability of data. iRISK can be used to inform decision-making in several ways. For example, the outputs from iRISK may be used to validate the relative ranking from other risk ranking tools or provide an alternative ranking of the commodity-hazard pairs to inform decisions in areas such as targeted inspections and preventive controls. Outputs from iRISK (e.g., risk ranking results and results of the impact of control measures on risk reduction) can also be used as inputs in a risk prioritization model to support risk management decisions. [COMMENT 4-18] How do the results of this model get presented to decision makers?

82
RESPONSE. Results from iRISK are presented to decision makers in a way similar to the presentation of any risk assessment, which include inputs and outputs of the models and further explanation from the risk assessors where necessary. The summary report generated by iRISK is useful in presenting results to decision makers because it contains all the data and information inputs associated with the hazard-food pair(s). We have added a new feature in the output of sensitivity analysis to present the results (the annual DALYs) for the baseline and alternative what-if scenarios in a figure, which will be useful as a visual presentation of the results to decision makers. [COMMENT 4-19] How will they inform development of more advanced multi-dimensional QMRA? RESPONSE. It is envisioned that results from iRISK will be considered among other factors under the FDA CFSAN framework “Initiation and Conduct of All ‘Major’ Risk Assessments within a Risk Analysis Framework” (DHHS/FDA, 2002), which include decisions on Agency priorities. [COMMENT 4-20] Will risk assessors use the model to identify potential intervention points within the farm-to-fork pathway? RESPONSE. Yes, we anticipate that this feature will be used by risk assessors. iRISK is designed to enable risk assessors to identify and evaluate the effectiveness of potential control measures at various intervention points within the form-to-fork pathway. [COMMENT 4-21] Will the model be used to conduct quick on-the-fly risk assessments that might help outbreak investigations identify potential locations of contamination (or eliminate possibilities that investigators postulate)? RESPONSE. Yes, as the reviewer suggested, we believe that iRISK has the capacity as a relatively rapid risk assessment tool for assisting outbreak investigations. We have developed a case study for using iRISK to assist outbreak investigation. [COMMENT 4-22] To this end, I am similarly confused by Section 1.7 on the “Rationale for Selecting iRISK.” This section lays out a set of six functional features, but never specifies reasons why these were defined. These features should be driven by risk management questions, which are never specified. How were these features chosen and why?

83
RESPONSE. The functional features were selected to evaluate and compare a few candidate risk ranking tools reported in the literature. The underlying question was to determine which tool among the candidates was the most suitable to fulfill the functional features and thus warranted further development. FDA commissioned a study for an inventory of available risk ranking methods and tools and a review of the applicability of these tools to meet FDA’s needs. Based on the outcome of the evaluation, iRISK was selected for further development. We have added a short paragraph in Section 1.7 for further clarification. [COMMENT 4-23] Why did FDA decide from the get-go that it wanted a predictive model with two modules, for example? RESPONSE. The rationale for selecting a predictive model with two modules, i.e., a multi-stage farm-to-fork process module and a hazard characterization module, is to ensure that the tool not only has the capacity to quantify risk to the consumer, but also has the mathematical structure to describe a process pathway, which is essential for the evaluation of control measures at potential intervention points. [COMMENT 4-24] Other modeling approaches, such as the prioritization approach used by the Netherlands, do not incorporate a multi-stage predictive model, but are instead built on surveillance of disease. For prioritization purposes, why is it preferable to have a predictive model over one that utilizes data on the measured incidence of various diseases? RESPONSE. We agree with the reviewer that other approaches, such as an approach built on surveillance data on the incidence of diseases, can be used for prioritization purposes. In developing iRISK, we chose to have a predictive model because to it is important for risk management to quantify the effectiveness of potential interventions. Without a multistage process module, iRISK would be very limited in its capacity to evaluate interventions. In addition, other approaches such as the FIRRM model (Batz et al., 2011) that utilizes data on incidence of diseases may generate outputs on the attribution of illness to a broad category of food. iRISK has the capacity to generate results for a breakdown of products within a food category. For example, rather than, and in addition to, determining the population health burden associated with L. monocytogenes in dairy products as a whole, iRISK has the capacity to determine the burden (annual DALYs) associated with milk, ice cream, cheese, or high-fat dairy products. [COMMENT 4-25] This seems to be a very important consideration in terms of overall approach, but the reasoning is not provided. Is this driven quite simply by the need to compare chemicals and pathogens, and the known lack of adequate surveillance data on the types of latent and chronic diseases caused by chronic chemical exposure? Or because it was decided that it was imperative to understand the importance of varying process controls and thus have a predictive model? What is the

84
“Domestic Priorities List” in particular and how can I as a reviewer address whether this approach satisfies that requirement? RESPONSE. One of the driving factors for selecting a predictive model was that it was imperative for FDA to understand the effectiveness of various process controls. The need to compare chemical and microbial hazards and the lack of adequate surveillance data were also taken into consideration. The "Domestic Priorities List" is an internal FDA document that is used to inform inspection priority and other risk management decisions. The list was generated using the CFSAN Relative Risk Ranking Model that is based on a two-dimensional matrix which results in rankings designated as “lower”, “medium” and “High”, which does not include a multi-stage process module. [COMMENT 4-26] Thus, as the specific purposes of the model have not been defined, I find that I cannot simply answer the fundamental question of whether the modeling approach is suitable. In general, individual risk assessments are well-suited to combining for comparative risk assessments or risk rankings. The rankings within Lm conducted as part of the suite of risk assessments by FDA and FSIS are one such example. However, things become more complicated when modeling multiple pathogens, as is the case with iRISK. The usefulness of rankings of different hazard-commodity combinations depends heavily on two factors: dose-response modeling, the uncertainties and accuracies of which differ across pathogens, and food preparation/handling modeling, which is complex and difficult to model (see question 3.1). RESPONSE. We concur with the reviewer comment. [COMMENT 4-27] The utility of ranking results depends on the quality of information on these two factors across the hazard-commodity pairs, for example comparing a well-understood pathogen in product not associated with cross-contamination vs. less-understood pathogen in product heavily associated with cross-contamination. This is particularly true given modeling limitations in uncertainty. That is, one wants to rank items built on the same methodology and quality of data, otherwise, the ranking results become a function of methodological and data quality differences, rather than actual differences in the measured metric. RESPONSE. The iRISK overall model framework is the same for all commodity-hazard combinations, i.e., there are six elements for each risk scenario: hazard, food, process model, consumption model, dose-response model, and DALY template. There are approximately a dozen mathematical equations built-in to describe the risk estimate based on data inputs for these elements, which include the impact of various process types on the prevalence and concentration of a hazard and the consideration of differences in the impact on chemical vs. microbial hazards. We agree with the reviewer that risk ranking results could be affected by methodological and data quality differences. Methodological and data quality issue is a challenge for any risk assessment including the risk scenarios developed using iRISK. An approach to minimize this issue is through the careful selection of data such as using data from the published literature and

85
expert elicitation, and the communication of any potential issue by documenting the source of the data and information with appropriate evaluation. [COMMENT 4-28] The question asks whether other approaches are more suitable. As noted previously, one alternative approach to the predictive approach used in iRISK is one that works “backwards” from incidence data to estimate proportional burden due to specific hazard-commodity pairs. This alternate approach, as used by the Netherlands and some other countries, is really only suitable for pathogens, and has other limitations and weaknesses, but may offer important information to FDA in prioritization decisions, as it relies on an entirely different set of empirical data. The utility of disease surveillance based approaches may be greater in cases where little is known about the prevalence or contamination level of a given pathogen in a certain product along the farm to fork spectrum. Our best systematic information about trends in foodborne illness year to year is arguably provided by surveillance data through FoodNet and other systems managed by CDC, though retail sampling and other regulatory data collected by FDA are quite useful as well. To address questions of attribution, one can use regularly updated data and one could easily conduct annual expert elicitations on proportions. Estimating the necessary parameters for a predictive model to similarly capture trends (such as changes in levels of pathogens on a particular product year to year) may be more challenging. This approach is not applicable for chemical hazards, so it may very well be a nonstarter. RESPONSE. We agree with the reviewer's comment. [COMMENT 4-29] But given the changing purposes for the model, I think it’s fair to ask if the ability to rank chemicals and pathogens is still part of the necessary purview, and if not, whether this approach is the best one for pathogens alone. RESPONSE. The ability for iRISK to rank chemical hazards as well as microbial pathogens is still a necessary feature of iRISK. [COMMENT 4-30] It very well may be, particularly as surveillance data and attribution models based on outbreaks or expert elicitation are limited when it comes to allocating disease burden to narrow product categories that would align with FDA’s domestic priorities list. FDA should nonetheless consider these other data in decisions. RESPONSE. We agree with the reviewer that iRISK can indeed be used to allocate disease burden to narrow product categories, which can be more specific than commodity categories obtained through an attribution model based on foodborne illness surveillance data. We agree that results from iRISK as well as data from surveillance can both be used to inform risk management decisions.

86
[COMMENT 4-31] I think the combination of rankings based on working “backwards” from surveillance data and “forwards” using iRISK predictive approaches might be very powerful. I could easily imagine a process in which these types of approaches were either combined or in which surveillance-based rankings provided some guidance for more targeted iRISK rankings. RESPONSE. We concur with the reviewer's comment. Indeed, risk ranking in iRISK using a "bottom up" approach (i.e., working "forwards" from exposure and consumption data) may complement results from attribution using a "top down" approach (i.e., working "backwards" from illness incidence data). Results from the two approaches combined can provide powerful insights. We have developed a case study to explore how illness data from an attribution model can be linked with iRISK to provide additional results useful for regulatory decision making. For example, using rankings from a top-down approach (Batz et al., 2011), we selected a commodity category that ranks relatively high, e.g., L. monocytogenes in dairy products, and used iRISK to develop risk scenarios for specific dairy products, e.g., milk (pasteurized or not) milk, cheeses (support L. monocytogenes growth or not), high fat dairy products, cultured dairy products, and ice cream. In future iRISK development, we plan to further investigate developing risk ranking that combines both the top-down and bottom-up approaches. [COMMENT 4-32] A prioritization tool should be able to be updated as new data become available, and iRISK certainly allows for new data to be inserted into the model. The question, though, is how often such data are updated in practice, which relates to how often they are collected, how quickly they are compiled, how well they are shared, and many questions external to iRISK itself. RESPONSE. We concur with the reviewer's comment. We plan to update the risk ranking of commodity-hazard pairs periodically as new data becomes available, as well as initiating targeted data collection efforts for iRISK. [COMMENT 4-33] The extensive expert elicitation process used to populate the model with preliminary data does not seem like the sort of exercise that FDA would incorporate into a regular process of updating the model, nor particularly amenable to “rapid” risk assessment. Or would it? If such data are not easily updated within the model on a regular basis, such as annually, the utility of the model to make prioritization adjustments year to year will be limited. RESPONSE. We agree with the reviewer's comment. In order to maximize the utility of the iRISK model, we plan to put in place a mechanism to collect and update data, using expert elicitation and other means as appropriate, and update risk ranking results periodically (such as annually where necessary).
87
3. The iRISK BETA model structure consists of a number of components in the process risk module that describes changes in the prevalence and level of a hazard at various process stages. The components include nine choices: no change, increase (growth; for microbial hazards only), increase (addition), decrease, pooling, partitioning, evaporation/dilution, cross-contamination (partial), and cross-contamination (total).
[COMMENT 4-34] These options for changes to prevalence and level of hazard are well thought through and seem to capture the realm of important potential changes. The equations used (as described in Section 2.4) seem correct after cursory investigation. I did have some concerns that the simplifications in the processing model would lead to problems modeling more complex interactions. For example, a heated liquid might lead to growth of both prevalence (cross-contamination) and growth (temperature), or a chilled liquid might lead to decreased levels but increased prevalence. But in exploring the mathematics, and in using the model, I find that modeling these concurrent impacts as consecutive stages is sufficient. There may be some second order effects, but I would expect these to be negligible. RESPONSE. We appreciate the reviewer’s comment. In the case where a process step leads to multiple impacts on the prevalence and level of a hazard, the user can describe the multiple impacts using different built-in process types (which have different underlying mathematical equations). [COMMENT 4-35] The modeling components seem geared towards process stages rather than production or preparation stages. The two examples – peanut butter and soft ripened cheese – are areas in which the problem occurs during processing. But contamination of leafy greens with E. coli O157:H7 in the field is a different sort of problem, and many of the concerns about eggs, for example, are related to what happens inside the professional or home kitchen. RESPONSE. We agree with the reviewer that contamination during processing and outside of a processing facility, such as on the farm or in the consumer's home, may occur through different mechanisms. The differences can be addressed by selecting different process types in iRISK. The iRISK version presented for peer review has nine built-in process types, including the process type “increase (addition)” that may be used to describe the contamination of food by a hazard that is in the environment, e.g., processing environment, farm environment and kitchen surfaces. In the next phase of iRISK development, we plan to evaluate and, as appropriate, add new process types (e.g., a “consumer cross contamination” process type) to expand iRISK capacity to model cross contamination. [COMMENT 4-36] For modeling on-farm contamination of produce, the “increase (addition)” type of stage may be adequate, but may not be sufficient to model the relative risks associated with different means of

88
introduction. For example, pathogens may be introduced to produce from contaminated irrigation water, rainfall associated runoff, seasonal flooding, contact with wild or domesticated animals, airborne transmission from nearby composting operations, dirty machinery, infected farm-workers, and so on. It would be interesting and perhaps useful to rank these different pathways. In “playing” around with developing an on-farm contamination model, it seems that iRISK has the capacity to handle these pathways in simplified fashion, but more complicated aspects of these models (e.g. deposition rates from airborne transmission) may not be able to be modeled due to structural limitations and available probabilistic distributions. It is not clear whether iRISK is sufficient for addressing such on-farm situations, but it is likely amenable with offline supporting models that could be simplified into “black box” models that could fit in with iRISK’s embedded functions. RESPONSE. We agree with the reviewer’s comment. iRISK has the capacity to model on-farm pathways in a simplified fashion. More complex modeling of the contamination pathway that includes aspects such as irrigation water, rainfall runoff, flooding, wild animals and airborne transmission would be better modeled in an offline in-depth quantitative risk assessment. We agree that a complex model can serve as a supporting model to generate inputs for iRISK. [COMMENT 4-37] Likewise, modeling cross-contamination and handling problems in the home is a very difficult challenge to model mathematically. There is a lot of cross-contamination potential moving back and forth between, say, knife, sink, cutting board, counters, and hands; this is not a linear process but a system with feedback effects that can’t be easily modeled with linear MC methods. Unlike processing lines, which follow the same protocol for product after product after product, every kitchen is different, and every cook is different, even day to day. Transfer coefficients may differ between pathogens. RESPONSE. We agree with the reviewer's comment. Modeling cross-contamination from food preparation and handling in the home is challenging and complex mathematically. In-depth modeling of cross-contamination in the home is an active area of risk assessment research. A complex model is better developed outside of iRISK. However, as is the case for modeling contamination on farm, food preparation steps in the kitchen can be modeled in a simplified fashion using iRISK with built-in functions. In the next phase of iRISK development, we plan to add a new process type (e.g., “consumer cross-contamination”) and to provide a means for users to input transfer coefficients. The same process type may accommodate different transfer coefficients associated with different pathogens, in the same way that the currently available process type “growth (increase)” can be used to describe growth for different pathogens that may have different growth rates. [COMMENT 4-38] I do not know whether iRISK can be used to replicate the existing cross-contamination models, but my suspicion is that they would need to be simplified considerably due to the feedback effects of pathogen transfer going back and forth between kitchen objects and foods. This is

89
going to be more important for some commodity-hazard combinations than others, and presents a challenge when comparing results between such differing pairs. RESPONSE. We agree with the reviewer that cross-contamination will be a process type more important for some food-hazard pairs than others. Although the need for modeling cross-contamination makes it challenging to compare results among food-hazard pairs, comparison between differing pairs can be made as long as the relevant cross-contamination steps are considered in the process model. In the next phase of iRISK development, we plan to add new process type(s) to iRISK so that the tool has the capacity to replicate published cross-contamination in a simplified fashion. [COMMENT 4-39] I suggest that FDA pursue example models that address these concerns about on-farm contamination and food handling/preparation problems to further assess the utility and limitations of the current process stage definitions. There may be additional components or functions that may be necessary for on-farm production processes and late-stage food preparation and handling (as described in 3.1), but I’m not familiar with the equations offhand. RESPONSE. In the next phase of iRISK development, we plan to evaluate and, as appropriate, add new process type(s) with associated equations to expand iRISK capacity to describe contamination on farm and in the kitchen. We also plan to develop case studies that include on farm production steps and/or food preparation/handling steps in the home. [COMMENT 4-40] I do not think it is possible, given limitations to modeling uncertainty, but I do wonder how to handle stochastic impacts to prevalence and levels. Processes are rarely constant in how they impact pathogens, whether due to variation over time (as wash water gets re-used for example, pH may go down or up), or because of brief changes. It is not hard for me to imagine a process that would decrease levels most of the time, but would sometimes increase prevalence or levels. I don’t see how one would model such issues in the current framework, though branching and sensitivity analyses may be sufficient for first order impacts. I do not consider this limitation to be critical, however. RESPONSE. We agree with the reviewer that the iRISK version presented for peer review does not include the capacity for modeling stochastic impacts of processes. In iRISK, the user has the choice of describing the impact of a process on contamination levels, in a simplified fashion, using a probability distribution. In-depth modeling of dynamic impacts on prevalence and levels, such as the impact over time, would require offline modeling in a different software platform. [COMMENT 4-41]
90
Related to the issue of stochasticity may be the spatial distribution of hazard within product. That is, due to particle-association or other factors, hazards may clump, aggregate, or cluster in ways that mean that risk across individual portions of product are not distributed uniformly, but are highly variable. This could result in a bi-modal or other complex distribution of concentration of hazard within a commodity, rather than a single peak with declining likelihoods above and below. This is not just a theoretical concern (see: Schmidt and Emelko, 2011. QMRA and decision-making: Are we handling measurement errors associated with pathogen concentration data correctly? Water Research 45(2): 427-438), but at the same time, few full-blown QMRA even deal with this issue. It may be something to consider down the line, but is probably not immediately important. RESPONSE. We agree with the reviewer that clustering of hazard (in particular microbial pathogens) is not just a theoretical concern; it may occur in food matrices (ILSI, 2010) and water (Schmidt and Emelko, 2011). Clustering has been reported for Cronobacter spp. in powdered infant formula (Jongenburger et al., 2011). This is a complex and difficult issue to address, even in a full-blown QMRA. In the future development of iRISK, we plan to evaluate new methodologies as they become available and as, appropriate, provide mathematical description for the clustering of microbial pathogens. [COMMENT 4-42] FDA might attempt to define situations in which the current suite of options is insufficient, and perhaps develop informal guidelines for work around solutions. The agency could use offline Analytica or @RISK modeling approaches to test such situations in a Monte Carlo simulation setting for comparison to the simplified iRISK module performance. Otherwise, I think the defined components are sufficient. RESPONSE. We concur with the reviewer that offline software such as Analytica or @Risk can be used to test situations involving some of the issues raised above, e.g., clustering, stochastic impacts of a process, on-farm contamination pathways, cross-contamination in the kitchen. Results from an offline in-depth model may be used for comparison to the simplified iRISK process module performance. Results from an offline complex model may also be used as input to iRISK. 4. The report describes the functions or equations (Equations 1 through 11) that underlie exposure assessment and risk characterization in the iRISK model. 4.1. Is there any of the assumptions underlying these functions or equations in the iRISK BETA model unreasonable, according to current modeling and peer-review practices? If so, please explain. [COMMENT 4-43] I cannot speak to those relating to chemical hazards, but those used for microbial hazards seem reasonable. These seem to reflect the most common functions.

91
RESPONSE. We plan to conduct another peer review on selected risk scenarios for chemical hazards in the next phase of iRISK development.
4.2. Are these functions or equations scientifically justified and biologically sound for the purpose they are used in the model? [COMMENT 4-44] Yes, to the best of my understanding. RESPONSE. We appreciate the reviewer’s comment..
4.3. Considering the model provided for the two commodity-hazard pair examples, are the equations or functions accurately implemented in the model? If not, please explain. [COMMENT 4-45] Yes, they appear to be correct. The math checks out. RESPONSE. We appreciate the reviewer’s comment. . 5. A key feature of iRISK BETA is the ability to compare both chemical and microbial risks. The model reporting allows users to compare risks with different metrics. In addition to a mean risk of illness, the annual DALY is used. With this in mind, 5.1. Comment on the appropriateness of using the annual DALY and the strengths and limitations of the implementation of this metric in the model. [COMMENT 4-46] There are some important implications and limitations of using HRQL measures alone, and some specific limitations and downsides to DALYs to which the authors should be aware. Health-Related Quality of Life (HRQL) measures are a perfectly acceptable approach for creating comprehensive, integrated measures of disease burden that allow for the comparison of hazards associated with different arrays of symptoms, severities, and outcomes. I strongly applaud FDA for going down the path of using HRQL measures, and for abandoning the pseudo-DALY measures that were previously a part of earlier versions of the model. DALYs are one measure among many, and are increasingly used in the public health community for global burden of disease estimates.

92
The structural limitation of HRQL is due to the fundamental concept that impacts can be measured as a linear function of time. That is, two days of some symptom is twice as bad as one day with that symptom. This is debatable. A hypothetical: let’s say you did a survey where you offered people money to eat contaminated food, and to one group you said, I’ll give you x dollars to eat this and you have a 50% chance of getting diarrhea, and to another group you offered y dollars for the same likelihood of getting diarrhea for two days. If you varied x and y across subsets and did all the right survey control things, would you expect to find y to be equal to 2x? I would not. The value of y would be higher than x, but most people will react to the likelihood and the symptom, and the duration will be a second order. RESPONSE. We agree with the reviewer that there are limitations to DALYs and other Health Related Quality of Life (HRQL) measures. We have added a short paragraph to the iRISK report to describe the limitations. In addition, we plan to provide an option in iRISK to select different risk metrics for risk ranking (e.g., another HRQL measure such as QALY, cost-of-illness, risk of illness per eating occasion) in the next phase of iRISK development. [COMMENT 4-47] This time impact is particularly true with respect to mortality and long-term chronic sequelae because it makes HRQL incredibly sensitive to age. In short, deaths of elderly people are heavily discounted compared to children, and this value judgment is hidden and rarely made explicit. A child at the age of 5 would lose something like 75 YLL, while an elderly person aged 75 would lose only 5 YLL. Is a 5 year old’s death worth the same as 15 75 year old deaths? This would be equivalent to using a VSL of $1 million for elderly people and $15 million for children – when EPA attempted to adjust VSLs by age, the public revolted. And their adjustments were relatively minor, and did not come close to 2:1. It is true that using YLL will not create mass hysteria in the populace like VSLs seem to do, but there is an implicit value judgment in these estimations that I find problematic on some level. It is not standard practice (there is no standard practice with these), but one option would be to use a universal YLL for all deaths regardless of age distribution. In the model currently, infant mortality is valued at 79.9 YLL and 60-year old plus deaths are valued at 14 YLL. What would happen if 80 YLL were used for all deaths? RESPONSE. We appreciate the reviewer comment showing another example of the limitation and value judgment associated with a HRQL measure. In the next phase of iRISK development, we plan to evaluate and, as appropriate, develop a case study using a DALY template (or another HRQL template) that has a universal YLL for deaths as a component. [COMMENT 4-48] Discounting of HRQL is still an area of study. When valuing future impacts in dollar terms, we generally discount to obtain a net present value. This may be something on the order of 3% per year. This is standard and uncontroversial practice in health economics. The discount rate is based on the simple principle that people value time: the rate reflects the fact that on average people would accept as equal a future payment of some amount or a current payment of some smaller amount (e.g. $100 in a year or $97 today). The implications for discounting to quality of

93
life are not as easy to estimate: would you rather have a really painful injury a year from now or a slightly less painful injury today? What about a really painful injury when you’re 70 or a much less painful injury today? FDA should explore discounting DALYs to see how these impact results. This is relevant because some pathogens cause acute illness, while others cause chronic conditions that will be felt for years. RESPONSE. In the next phase of iRISK development, we plan to periodically review the literature for publication(s) on discounting DALYs, and will evaluate and as appropriate use the information in a DALY template to explore the impact of discounting DALYs on risk ranking in a case study. [COMMENT 4-49] DALYs present some philosophical issues of their own. It is often said that DALYs and QALYs are simply inversions of each other, but this is not quite true. DALYs are specified and determined in a very specific way that is different than all QALYs. DALYs were developed by WHO because they needed a metric to compare disease burden across very different countries, but when you ask populations to measure their quality of life, you see dramatic differences country to country. The population of a country with endemic diarrhea, for example, may rate quality of life with that condition higher than those in a developed country with low rates of that disease. This “relativity” presents a problem for cross-country comparisons, so DALYs were developed to measure not “quality” of life but “disability” on an objective scale. DALY scores are determined by a panel of experts who make judgments about what is worse than what, and how to value on a numeric scale of disability a suite of conditions. They are expressly NOT population-based. RESPONSE. We appreciate the reviewer's comment on the methodology used to develop DALYs. [COMMENT 4-50] QALYs, on the other hand, are population-based (though sometimes QALY scores from one country are used in another). There are multiple QALY methods (HUI, EQ-5D, SF36, etc.) but all of them convert some number of domain scores (mobility, self-care, anxiety, etc. – the domains differ across tools) to health quality scores (the 0 to 1 scale) through very large population surveys. Thus, estimates of QALYs are population-based, and reflect the preferences of the citizens for whom decisions are being made, rather than the preferences and judgments of a small panel of European experts. It is for this reason that the recent NAS panel tasked with making recommendations for how federal agencies should value health for regulatory cost-effectiveness analysis (http://www.nap.edu/catalog.php?record_id=11534) recommended using QALYs based on the EuroQol EQ-5D tool. RESPONSE. We plan to incorporate QALY as an alternative HRQL measure, in the next phase of iRISK development.

94
[COMMENT 4-51] The third reason why DALYs warrant some concern is that likelihoods of health conditions and outcomes associated with individual hazards vary country to country. Populations have different genetic make-ups, different immunities due to different geographies and climates and habits that may impact background exposure, and so on. Within Europe, huge differences are seen in foodborne illness rates of different pathogens country to country. These differences impact the odds of getting sick, but can also impact severity of health impacts. Durations of symptoms may differ, and certainly any likelihoods relating to hospitalization, physician visits, and (probably) mortality are likely to be heavily influenced by the health care systems. Thus, there are some real questions about applying Dutch data on likelihoods of outcomes, regardless of whether using DALY condition scores. The DALYs used in the model, therefore, are (a) designed and primarily used for international comparisons (one of the reasons they are used for internal Dutch reports is that they can be compared within the EU), (b) do not reflect the societal preferences of the United States population, and (c) are built on health trees that may not be appropriate for use in the US. This last point could be relatively easily adjusted for US likelihoods, drawn from FoodNet and other data sources, such as ERS cost of illness estimates. RESPONSE. We appreciate the reviewer's further comments on limitations associated with DALYs. We agree that DALYs developed using data and information in one country may not be applicable in another country. In the next phase of iRISK development, we plan to develop DALY templates using health trees relevant to the U.S. drawn from U.S. information source such as CDC data and ERS data. As indicated above, we plan to provide an alternative HRQL measure such as QALY in the next phase of iRISK development. [COMMENT 4-52] I expect that the differences between DALYs and QALYs based on EQ5D in a relative risk ranking setting would be negligible, as these estimates are principally driven by mortality. Nonetheless, it would be relatively straightforward, though some work, to conduct a study in which you used Dutch trees and some judgment (perhaps a panel) to assign EQ5D domain scores to the same health states and then used US population weights to convert to QALY scores. Doing such an exercise might go a long way to justify using DALYs if it showed negligible differences between DALYs and QALYs. RESPONSE. We appreciate the reviewer’s comment. We plan to evaluate the feasibility of conducting a comparison between DALYs and QALYs in the next phase of iRISK development. The research need suggested by the reviewer (i.e., a study involving Dutch tress, EQ5D domain scores, U.S. population weights and QALY score conversion) might be better conducted as a research project outside of iRISK. We plan to periodically review the HRQL literature and incorporate new information as appropriate.
5.2. Comment on the appropriateness of available options for microbial and chemical dose response functions in the model and how they are used.

95
[COMMENT 4-53] I cannot comment on chemical dose-response functions. The microbial dose-response functions seem adequate to me for these purposes, though they are notable for not including a threshold function to capture “minimal infectious dose.” I would align with those who suggest that non-threshold models are preferable and more realistic, but traditional risk assessors may quibble. In practice, the model allows for dose-response functions with near-zero values for infection with a single organism, which is sufficient, and aligns with current FAO guidance. RESPONSE. There is insufficient information from the microbial dose-response literature to support the inclusion of a threshold dose-response function for microbial pathogens. We agree with the reviewer that, based on published papers in the literature (DHHS FDA/USDA FSIS, 2003; FAO/WHO, 2002; Teunis et al., 2008) and FAO/WHO guidance (FAO/WHO, 2003), nonthreshold models are appropriate and realistic. 5.3. Overall, are the results generated appropriate for comparing chemical and microbial risks and risk ranking purpose? If not, the reviewer should explain other results and/or analyses that are needed. [COMMENT 4-54] Our stated purpose was to evaluate the model on microbial terms, and we were given very little information with which we could evaluate chemical hazards. I did not spend a lot of time evaluating the ability to model chemical exposure, but it seems as though the basic modeling approach is amenable to such rankings. The use of DALYs to aggregate health impacts allows for comparing very different health outcomes and exposures using a consistent methodology and metric, so there are no issues on the health endpoint side of things. The questions come in terms of exposure – acute vs. chronic, and what it means to compare them. The model handles these differences in a consistent manner, and this ensures some comparability between microbial and chemical hazards. Still, I’m not sure I fully understand the philosophical and risk management implications of comparing one hazard associated with acute impacts (in which illness is based on the likelihood of consuming a single serving of a food contaminated with a high concentration of hazard, over many servings) to another hazard associated with chronic impacts (in which illness is associated with aggregate exposure to a hazard). Aside from the bioterrorism example, in which we’re talking about principally single event acute exposure (not annual), the risk management impetus for making these sorts of comparisons is not obvious to me. Ranking microbial toxins or chemical hazards that cause illness due to acute exposure alongside pathogens that cause acute illness seems to me to be more useful. In terms of comparing microbial hazards alone, the results are appropriate for ranking. RESPONSE. It is challenging to compare hazards associated with acute effects vs. those with chronic effects. Our initial focus in iRISK is on microbial hazards and acute chemical hazards. For chronic chemical hazards, we plan to focus on those that have a defined nonthreshold dose-

96
response relationship (e.g., causing cancer). In iRISK, the variability input for chronic chemical represents variability in the average contamination levels over time (instead of individual concentration levels). We plan to develop a consumption template for multiple life stages to improve exposure assessment for chronic chemicals, in the next phase of iRISK development. We believe that by focusing on microbial hazards and acute chemical hazards in the short term, and by improving exposure assessment and risk estimate for chronic chemicals in the future, we will have a better iRISK tool that compares the risks among these hazards. [COMMENT 4-55] There were no questions posed to reviewers pertaining to model output reports, but I do have some comments on this topic. I think the reports and other potential model outputs relate importantly to how the results of the model can or will be used. First, a PDF may not be the easiest format to use if analysts need to create other reports from these results. The possibility should be there to output in .rtf or some other editable file, if possible. RESPONSE. We plan to include iRISK report in an editable format, such as .rtf or Excel, in the next phase of iRISK development. [COMMENT 4-56] Second, I find it problematic that there is no capability for saving model results and data following a ranking or sensitivity analysis. A pdf record is insufficient, even though repeated run of the model will produce the same results. This is for two reasons: (1) for further analysis – the analyst may want to export the data into SAS or some other environment to explore relationships within the model to understand it when unanticipated results occur (whether because of a bug or because these things can be complicated), and (2) for posterity/documentation – I feel that fully specified models and data should be kept when such results do influence decisions. Thus, it may not be necessary to save the data for each run, but capacity should be built in. RESPONSE. We plan to add the capacity to save model results and data following ranking and sensitivity analysis in other format(s) beyond a pdf file in the next phase of iRISK development. [COMMENT 4-57] When saving data for a given run, the model should save (a) the values for all input parameters in a structured format, and (b) the values for all output values in a structured format. The input file would specify, precisely, all of the values for the model that fits the resulting data. (It may or may not include the documentation fields, but certainly the numeric values and specified probability distributions). The output file would specify all outputs for key intermediary and final results data, which could then be imported into a data-analysis program, such as SAS or Excel, which could be used to further analyze the data and create bar charts and so forth.

97
RESPONSE. We plan to use a structured format when building the capacity to save input parameters and output values in the next phase of iRISK development. [COMMENT 4-58] Furthermore, the input data file could actually be used as a modeling input – it is common in modeling/programming to be able to read in data parameters from an input file. Thus, rather than go through the effort of editing all the pop-up windows, an analyst could populate an input file, upload it, and a fully formed risk scenario would be there to work with. Therefore, an analyst could take an existing risk scenario, save the specified parameters into an input file, edit the input file (changing wording and values here or there) to create a new/similar risk scenario, and upload it without going through the model to copy and paste entire repositories. While the interface is pretty straightforward once you get to using it, I would find working with pop-up boxes quite tedious after a while, and would prefer to have a single-text-file option for editing (often, this is how I edit Analytica models). RESPONSE. We plan to evaluate and as appropriate develop the capacity for uploading an input data file from an external source to iRISK models, in the next phase of iRISK development. [COMMENT 4-59] Third, it is not easy to connect a report to an existing model after the fact. For example, if you have a risk scenario you are changing parameters in and then running numerous times, without changing the risk scenario name, it’s impossible to easily figure out what is different between very similar results reports without going through parameters one by one. RESPONSE. We plan to address this issue in the next phase of iRISK development. [COMMENT 4-60] I think analysts would find themselves adding things about particular runs to the risk scenario description field in order to keep track of these differences, but this is a bit of a hack. (Suggestion: Add additional field for run-specific description so it doesn’t get dumped into the Description field.) I would like to see each scenario as run to be associated with a hashkey or code that was printed on the report. This hashkey would be associated with all of the numerical and distribution information for model parameters (similar to the aforementioned input file). It would work similar to how URL-shorteners change http://www.thebiglongnameofthewebsite.com/folder/pageofinterest-date-time-garble.htm to http://bit.ly/7ytu5q. Hash functions are often used to convert a large variable set of data into a simplified shorthand, and this kind of shorthand could be printed on the reports from the model (e.g. Runcode ID: SD445-LMSRC22344-PY123-ZXY987-ETC1111), possibly where different pieces of the code refer to different things (user, pathogen, food, process model name, etc) that are specific the run. The iRISK framework would need to maintain a hashtable to convert hashkeys to model input parameters (each line in the hash table would correspond to an input parameter file, described previously), but this does not strike me as overly burdensome. Each user could have their own hashtable, for example.

98
These steps would help make iRISK runs and resulting reports seem less ephemeral. RESPONSE. We appreciate the reviewer providing specific suggestions on how to track different runs of scenario analysis. We plan to consider these as potential options for new features to add to iRISK in the next phase of iRISK development. 6. Given that the primary purpose of iRISK BETA is ranking risk among a number of commodity-hazard pairs, are variability and uncertainty adequately characterized in the model? If not, please explain what changes might be considered to improve characterization of variability and uncertainty. [COMMENT 4-61] The limited ability to model uncertainty does warrant some concern, particularly because foodborne illnesses and outbreaks are “driven by the tails” and the implications and interactions of probabilistic inputs is not always predictable without explicit modeling. That said, the ability to conduct sensitivity analysis does provide the ability to bound estimates to a reasonable degree. RESPONSE. Currently, iRISK provides several distribution options (e.g., triangular distribution, normal distribution) for describing variability. We plan to add more distribution options (e.g., a lognormal distribution) to increase iRISK’s capacity to better represent “the tails” where appropriate. Uncertainty analysis is provided through the Sensitivity Analysis option and we believe that, as the reviewer noted, this option provides a means for the user to bound risk estimates to a reasonable degree given the intended purpose of iRISK. [COMMENT 4-62] The limited ability to model uncertainty and variability in two dimensions might impact the utility of iRISK for regulatory impact assessments or other such “large-scale” risk assessments that are necessary to support regulatory decisions. But for preliminary risk assessments and those done to inform prioritization decisions, the ability to conduct limited sensitivity analyses should be sufficient. Of course, unbound by the limitations of Analytica and the other software platforms upon which the model is built, I could recommend a two dimensional approach to modeling uncertainty and variability. My understanding, however, given conversations at the introductory peer review meeting at FDA, is that these limitations are structural and not easily changed. RESPONSE. We concur with the reviewer's comment. [COMMENT 4-63] The model does allow sensitivity analysis, however, and I wonder whether this feature might be expanded to allow for simplified explorations of probabilistic uncertainties for certain parameters. Could the model be expanded to allow, rather than the arbitrary limit of 5 alternate

99
values, some key values from a distribution (such as the edges and point of a triangular distribution), and then weight the results by this same distribution. Ordinarily, one doesn’t do this because you may have multiple probabilistic inputs and the interaction between them often results in distributions that cannot be estimated probabilistically. But allowing for a type of sensitivity analysis where the analyst suggests a probabilistic distribution for a key parameter, and then iRISK selects a subset of key values from that distribution automatically (whether centiles or some other option) might allow for more useful results that satisfy some of the concerns about uncertainty. RESPONSE. Using the Sensitivity Analysis option, users can define alternative values for parameters that have a distribution as an input (e.g., concentration, serving size) as a range of values (i.e., a distribution). We plan to expand the sensitivity analysis to include other options, such as the ability to vary multiple parameters simultaneously in the next phase of iRISK development. 7. Given the practical constraints of the model and data, a sensitivity analysis option is provided by which the user can specify 5 alternate values for a single parameter in the Process Model, Dose Response Model, or Consumption model, and obtain the ranked results as compared to the original scenario. If this approach is not sufficient, please provide additional or alternative approach(es) and explain what changes might be considered and how they would improve the model. [COMMENT 4-64] It is difficult to say what is or what is not sufficient, but certainly this could be greatly improved. In my view, if the model is not going to allow for probabilistic uncertainty of key parameters, it needs to have a powerful capacity for sensitivity analysis. I found it very constraining in gauging the importance of various values, but when one is used to a straight MC environment, this is not surprising. The choice of 5 alternative values seems highly arbitrary. Is it driven by how long it takes the model to run? RESPONSE. The choice of 5 alternatives (a total of 6 including the "baseline") is not necessarily driven by run time. Rather, it is a reasonable number of alternative scenarios expected. Upon reviewing additional user feedback from the beta testing of the tool, we may consider providing more than 5 alternatives in the future. [COMMENT 4-65] I would like to see the ability to vary two parameters at a time, to avoid the situation where I have to create numerous duplicate models in order to evaluate interactions between variables. This is very frustrating and seems to me a considerable limitation for developing exploratory models, where the interactions between, say, cross-contamination and growth, are really what are driving spikes in potential health risks.

100
RESPONSE. We plan to expand the Sensitivity Analysis option to include the capacity to vary multiple parameters simultaneously in the next phase of iRISK development. [COMMENT 4-66] Actually, I would prefer something more: the ability to feed into the model a set of input parameters, perhaps input from a separate file. For example, if one were to specify, say, 5 values for 10 parameters, the model could run all 50 possibilities and the analyst could evaluate the suite of results. I do not see why this could not be implemented in a scripting manner, even if it took a half hour or overnight to run. But for the analyst to create all of these runs as risk scenarios is kind of an absurd use of his or her time. RESPONSE. We plan to examine the feasibility and, as appropriate, develop the capacity for uploading an input data file from an external source to iRISK models in the next phase of iRISK development. 8. Comment on the iRISK BETA user interface. Is the interface user friendly? Are there any features that should be modified or added to facilitate ease of use? For example, is there sufficient description in the user interface to understand each component of the model? [COMMENT 4-67] The user interface is challenging to say the least, though through some diligent repeated use, it does start to feel straightforward. What is missing, really, is anything visual to indicate how various fields or modules relate to one another. It is clear that this is an off-the-shelf interface that was adapted for this model, and while it provides a great deal of adaptability and flexibility, it features an awful lot of text fields and very little ease for navigation. RESPONSE. In the next phase of iRISK development, we plan to develop a step-by-step user interface and find other ways to improve the ease of navigation. In addition, we plan to develop more graphing options, as is currently done in the field for the dose-response model for users to visualize other parameters such as concentration of a hazard and process flow chart. [COMMENT 4-68] I found navigating the model quite awkward. It is VERY difficult to quickly scan through a scenario in the way one might in a spreadsheet. You have to open a pop up window that opens another pop up window and then pull a drop-down menu and then go back to the original screen and open up a folder and then a sub folder and so on. Compare this to a spreadsheet, in which you easily move left-to-right and up-to-down within a worksheet, which are then easily tabbed along the bottom. It is easy to know exactly where you are at all times. Likewise, Analytica, Goldsim, and other similar tools use diagrams so you have a map to guide you and show you

101
how nodes interact with one another. Even a straight text file has a top and a bottom, and you can easily and quickly scroll to other parts of the model. RESPONSE. The risk scenario summary page serves the purpose of presenting all six elements of the risk scenario in one page, from which the user can open a pop up window for each of the elements. We recognize that the current user interface is relatively heavy with side bars, menu bars and too many pop-up windows. We agree that finding ways to enhance navigation would make the tool more user-friendly. We plan to develop a step-by-step user interface in the next phase of iRISK development, and to identify other ways to improve the user interface navigation as appropriate. [COMMENT 4-69] It is also confusing that iRISK uses two different visual analogs for organization – both the folder and the pop-up. So I click on a folder to see what’s in it, but if I want to do sensitivity analysis or examine specific process control stages, I click on the specific item, which brings up a pop up, which has its own set of folder. Then via those folders in the pop up, you can open more pop ups, with more folders, and more pop ups, and you’re moving sideways and up and down and it is very difficult to have any idea “where” you are in the space of the model. RESPONSE. We agree that using two different visual analogs could make it counterintuitive for users to navigate the model. However, this issue can be minimized through experience using the iRISK tool. We plan to identify ways to simplify the visual analogs where appropriate. For example, we plan to revise the interface to be more streamlined, with fewer side bars and pop-up windows to guide the user through the interface in a more step-by-step fashion. [COMMENT 4-70] A bit of a side note, but relevant for later discussion: in some screens, you click on “edit” to change parameters, whereas in other screens you click on the item directly. For example, in the risk scenario screen, clicking on “edit” or the name of the scenario (e.g. Listeria in Soft Ripened Cheese in Adults 60+) brings the same pop-up. Similarly, in the risk scenario screen, you click directly on “Soft Ripened Cheeses” to open a pop-up for that specific food, and you can see all of the associated consumption and process models relating to that food. You can get that same pop-up if you go to Foods sidebar folder and hit “Edit” for the row in which “Soft Ripened Cheeses” is the name in the third column. This is confusing because not only are these two seemingly parallel ways to get to the same place, but you get there different ways. Thus, there is both duplication and inconsistency between screens. To solve this problem, first, drop the Edit column from all pages and simply make the first column the thing that is edited (e.g. in the Food pop-up, “Milk Chocolate”), and make it bold and link to the pop-up editor. Second, create a bit of space between the first column and the other columns, which are not editable to make it clear that the first column is specifying the values in the other columns. (Font choice, bolding, italics, color, borders, etc.)

102
RESPONSE. We appreciate the reviewer providing specific suggestions for how to improve the user interface. We plan to take the suggestions into consideration in our efforts to further streamline and enhance the user interface in the next phase of iRISK development. [COMMENT 4-71] I don’t like how folders are used in the interface. Folders are an analog that has meaning to anyone using Windows Explorer or any other computer interface, where you can expand a folder to see what’s in it. But you can’t do that in iRISK. You have only parallel folders side by side. This is a problem in two ways. First, when you click on something in the left panel (such as Hazards folder), it doesn’t open or even become bold, so instead you have to look to the header to see where you are, and the header feels more like a table heading than a navigational header. Second, all folders in iRISK are parallel, though in reality folders should be nested to show that some models are sub-models or specific to others. Consumption and dose-response are shown as parallel to food and hazard, but in reality are sub-modules that are specific to those. Health endpoints are an input to DALY templates but are presented as parallel, independent models. These same issues affect the folders that appear when you are editing a specific model. For example, if you click edit for a specific hazard model, a pop-up appears, and there again are folders on the left hand side for dose-response models, process models, and risk scenarios. The D-R model is specific to this pathogen and does not relate to food so could be considered a sub-module of hazard (as it is in the diagrams in the reports). The process models are the combination of hazard and food, and in risk scenarios, the hazard is but one piece of the risk scenario. Showing them as parallel folders actually confuses one’s mental model of where one is because there’s nothing to distinguish between parents and children nodes. Furthermore, all of these are essentially sub-components of a risk scenario. RESPONSE. We appreciate the reviewer's suggestions. We plan to consider these suggestions in our efforts to improve the user interface in the next phase of the iRISK development. [COMMENT 4-72] Thus, I think FDA should rethink how some of these things are termed and grouped. I don’t particularly like the term “risk scenario” and would rather simply call them “risk assessments.” RESPONSE. We plan to consider adding another term, such as “risk models”, to describe the risk assessment models. [COMMENT 4-73] Second, I would separate categories from models: hazard, food, and population are categorical definitions, while the process model, consumption model, dose response model, and DALY model are computational modules. Furthermore, I would call a “process model” a “contamination model” because it is (a) not only related to processing but also other stages in farm to fork, and this is misleading and confusing, and because (b) really what this model is doing is predicting the bug or hazard from wherever in this spectrum up to the point of

103
consumption. In reality, each risk scenario or risk assessment is fully specified by four “models”: the contamination model (specific to hazard and food), the consumption model (specific to food and population group), the dose response model (specific to hazard and population), and the DALY model (specific to hazard and population). Put another way, hazards, foods, and population groups are the connecting pieces that must be consistent across models within a risk assessment. RESPONSE. We appreciate the reviewer's suggestions on ways to reorganize the six elements of a risk scenarios into two broad categories (i.e., Definition and Models), and will consider these suggestions in the next phase of the iRISK development. [COMMENT 4-74] Following this, I would make some changes to the Risk Scenario screen. In the first column, as described previously, a hyperlinked Scenario name. This should be followed by columns for food, hazard, and population, but these should not be hyperlinked (they are not models to change, but definitional, and editing them makes no sense from this screen). The next four columns should be the four component models and labeled/grouped as such, in order: contamination, consumption, dose response, DALY. RESPONSE. We appreciate the reviewer's suggestion for a potential approach to modify the Risk Scenario screen, and will consider the suggestion in the next phase of iRISK development. [COMMENT 4-75] Following these definitions, I propose a different scheme of organization for the side-bar folders, using nesting. At the top level, four folders: definitions, models, risk assessments, and risk assessment groups. The definitions would be where you could create new foods, hazards, or population groups. The model folder would include the four aforementioned models that are combined in the risk assessment, and the risk assessment folder would be the “scenarios” that are defined by specified models. This approach serves to group like items while also showing how they build together. The left hand side column might look something like (without the added letters and numbers used to create non-alphabetical ordering in Windows Explorer):

104
RESPONSE. We appreciate the reviewer providing the specific suggestions for side bar organization and nesting, and will consider these suggestions in the next phase of the iRISK development. [COMMENT 4-76] One area that is very difficult to keep track of is branching, whether the branching is in population (Lm in perinatal, Lm in 60+, etc) or in process modeling (multiple process models if you want any variation within), particularly when it comes to pulling the nodes together again through risk scenario groups. RESPONSE. The "branching" issue is unique to how the user defines a subpopulation, which may depend on the population of interest and other factors such as availability of a dose-response model. For example, L. monocytogenes dose response models available are specific to the perinatal, the elderly or the intermediate-aged group. In this case, the user will need to document the information in the "Rationale/Reference" field. [COMMENT 4-77] Related to the branching issue is that each risk scenario is independently defined and specified. You can’t say, for example, that 20% of the consumers fall into one group and the rest fall into another. You can’t create dependencies or relationships between variables that are not predefined. When you are dealing with something like Lm in three populations, it really is (in your head) one problem, with three sub-populations, not three separate problems to three

105
independent populations. Some of this could be incorporated into how risk scenarios are grouped and presented. RESPONSE. We concur with the reviewer that to obtain the risk estimate for the total population, where risk scenarios have been created for different subpopulations, the user would need to add risk estimates from the relevant risk scenarios for the subpopulations. The issue can be addressed by using the Risk Scenario Group option with appropriate documentation. How the user defines a scenario, e.g., whether to select a subpopulation of the whole population, may depend on the characteristics of the hazard and available data. For example, for L. monocytogenes, dose response models are available for the individual subpopulations but not for the total population. Therefore, sometimes multiple risk scenarios may need to be developed for separate subpopulations, and grouping is necessary to obtain risk estimate for the total population. [COMMENT 4-78] Color coding might help: For example, if food nodes were somehow coded red and hazard nodes were coded blue, and process model coded purple, it would provide a signal that the process model was at the interface. Consumption models would be red, associated with foods, while D-R would be blue, associated with hazards. Health endpoints could be yellow, and DALYs could be green – the interface of generic health states with a hazard. This color coding is powerful within Analytica for distinguishing types of modules and variables, and it’s a shame that this information is lost in the current interface. I don’t see exactly how the current approach could be changed without the thing becoming quite garish, but there may be ways. (This might conflict with the incomplete/complete coloring, which I found quite helpful). RESPONSE. While using color-coding would be a means to differentiate different elements (e.g., process model, consumption model, etc.), we believe that color-coding for nodes would conflict with the current use of color to denote complete/incomplete status of the elements. Furthermore, in using a color scheme in the future, FDA would need to consider how this might impact compliance with the Americans with Disabilities Act of 1990, as amended ( Public Law 110-325; available at http://www.ada.gov/pubs/adastatute08.htm) in order to accommodate the needs of color blind individuals. 9. Comment on the adequacy of the model documentation features within iRISK. Can the user accurately document data sources and confidence in the model? [COMMENT 4-79] The inter-model documentation is quite strong, though a global reference list would be helpful, particularly if it would link directly to external websites. RESPONSE. We plan to develop a global reference list that is accessible from the user interface, in the next phase of iRISK development.
106
[COMMENT 4-80] The interface (based on Analytica?) doesn’t seem to incorporate HTML links, which seems quite odd for a web-based tool. What I would like to see is that a citation for a particular node is hyperlinked to a global reference list, which might then link to external websites (such as PubMed). RESPONSE. We plan to provide hyperlinked references, where appropriate, in the next phase of iRISK development. [COMMENT 4-81] The user does have a lot of power for documenting modules, and variables within those modules, but some broader documentation features would be helpful, such as a place to pull in notes or descriptions of how the various risk scenarios relate to one another. Although risk scenario groups can be documented, once you do a bunch of scenarios, it’s very easy to lose track of how they interrelate and what sorts of rankings you have done or want to do. RESPONSE. We plan to evaluate and, as appropriate, provide a documentation field in the sensitivity analysis window, as well as providing an option for user to save the sensitivity analysis, in the next phase of iRISK development. [COMMENT 4-82] Being able to group risk scenarios in the main risk scenario screen might be helpful in this regard. RESPONSE. We believe that it is straightforward for the user to perform grouping in the “Risk Scenario Group” screen (as is currently done). Since the user already has a number of activities/options in the main risk screen, it could be confusing to add another option to the main screen. III. SPECIFIC OBSERVATIONS ON THE DOCUMENT Page Line Comment 0 0 [COMMENT 4-83]
The title of the document is misleading – this is not a risk assessment, but a risk assessment tool or framework. Suggested alternate title would be something like “Overview and Methodology iRISK, a Risk Assessment Modeling Framework for Evaluating and Ranking Commodity/Hazard Combinations by Public Health Impacts.” RESPONSE. The title of the report has been revised to "Overview and Methodology of iRISK - A Public Health Risk Assessment Tool for Evaluating and Ranking FDA-Regulated Commodity/ Hazard Combinations".

107
6 4 [COMMENT 4-84]
The overview of the history of iRISK development is insufficient. FDA should provide a better timeline, including years, of how this model evolved, as it is quite different in its current state from what has been presented in the past. For example, when an earlier version of this model was first presented, one of the explicit goals was to compare microbial and chemical risks. Yet, we are being asked to evaluate iRISK only on microbial grounds. RESPONSE. The timeline for a risk ranking prototype that evolved into iRISK started in 2006 when FDA awarded a cooperative agreement to the Institute of Food Technologists (IFT). Subsequent development includes the followings:
In 2007, FDA awarded a contract to Risk Sciences International (RSI) to operationalize the risk ranking framework prototype in a web-based format.
In 2008, FDA awarded a contract to RTI International (RTI) for the development of an inventory of available risk ranking methods and tools and a review of their applicability to meet FDA needs. Based on the outcome of the inventory evaluation, FDA selected the iRISK model to serve as the basis for further development.
In 2009, FDA awarded a new task order under an existing contract to RTI for a comprehensive and systematic critique and trial run of the candidate public health risk ranking method (i.e., iRISK) and proof-of-concept testing for selected risk scenarios based on the consideration of 50 commodities and 20 hazards.
Since 2010, FDA has contracted with RSI to continue beta-testing and improvement of the iRISK structure and programming, as well as the user interface, based on user feedback including feedback from the external peer review.
For the peer review, we chose to focus on iRISK methodology and provided only microbial examples for the reviewers. However, our goal is to use iRISK for evaluating risk from both chemical and microbial hazards. We plan to find an opportunity to conduct a peer review of risk scenarios for chemical hazards in the future.
10 [COMMENT 4-85] Figure 1 says that this is an overview of the “earlier iRISK model,” which poses a few questions: 1) to what extent is this relevant? Is the structure of the current model different? The current model apparently uses a .NET implementation to interact with an underlying Analytica model, so why not present the current structure? It may help to retitle this figure “Analytica interface for …” instead of “Overview of”, 2) There is a lack of clarity about what “earlier iRISK” means, considering that on p.

108
6 the report states that this earlier model was “operationalized” by RSI. RESPONSE. Figure 1 was included in the report to show a milestone in the development of the risk ranking tool that eventually evolved into the web-based iRISK. The current web-based .NET iRISK model is based on the earlier prototype described by Figure 1 with improvements of the model structure and programming. An overview of the current model structure is presented in the report on p. 31, Figure 10. The title of Figure 1 has been changed to "Analytica Interface for an Earlier iRISK Model Structure".
14 Fig 5 [COMMENT 4-86] I do not understand why DALY template is not a sub-module of hazard. Although health endpoints are not hazard-specific, the specification of DALYs are. RESPONSE. The DALY template could be a “sub-module” of hazard for the reason described by the reviewer. In the next phase of iRISK development, we plan to link health metrics (e.g., DALY template) to hazard so as to eliminate the possibility of selecting incorrect metrics for risk scenarios. In Figure 5, the template is placed outside of the hazard box because of how the template is used in risk calculation. The risk estimate (total DALYs) is calculated by multiplying the DALY per case (i.e., using the DALY template) with the number of annual cases that are determined by the hazard and its associated dose-response as well as the food, its associated consumption data, and process model.
25 [COMMENT 4-87] Section 1.7 is confusing because it combines initial model selection in terms of methodology and final model evaluation in terms of functionality and performance without being clear what is what. RESPONSE. The initial model selection was based on six functional features as outlined on p. 25 of the report for peer review (the introduction of section 1.7). The final model evaluation was based on both functionality and performance of the web-based iRISK model. The report has been revised to provide additional clarification. [COMMENT 4-88] The feature selection and comparison against other models was presumably done very early on, and should not be at the end of the chapter, but at the beginning, prior to descriptions of model structure and design. (The issues of how these features relate to risk management would be natural following descriptions of those risk management questions). It would also be helpful to specify what models were

109
examined. RESPONSE. The comparison of the iRISK predecessor prototype and other risk ranking models and tools was indeed done early on. We have added information on the timeline of comparison and five candidate risk ranking tools to section 1.7 of the report for clarification. The five food safety risk ranking models evaluated include the Food/Hazard Risk Registry (FHRR) developed by IFT (the predecessor for iRISK), Risk Ranger, the Food Sector Risk Ranking and Prioritization Model, the Foodborne Illness Risk Ranking Model (FIRRM), and the Food Safety Universe Database (FSUDB). [COMMENT 4-89] Then the evaluation of the final model (namely Table 4) at the end of the chapter would make more sense following all of the prior sections that describe implementation details. The section says that the model was evaluated and compared to other candidate risk ranking models, and that the iRISK model outperformed them on these attributes. This section is confusing because it’s unclear whether this is referring to selection of the methodology, or selection of the completed model. That is, when were these models scored? Since it wasn’t known as iRISK until fairly recently, it reads as if these assessments were made recently, but it wouldn’t make sense for FDA to compare the completed model against other existing models this late in the game (since it was specifically designed for FDA). RESPONSE. The study on the inventory of risk ranking tools and the evaluation of the tools started in 2008. Therefore, the iRISK model predecessor (the Food/Hazard Risk Registry developed by IFT) was evaluated and scored in comparison to other published risk ranking tools in 2008-2009. We have added information to section 1.7 of the report to clarify the timeline. [COMMENT 4-90] What is the difference between “Initial Assessment” and “Further Assessment” in Table 4? Does the initial assessment refer to the design approach during funding decisions prior to development, and the further assessment refer to how well the final model in its current state meets those same criteria? The conflation of decisions and assessments made years ago and those made today are confusing. RESPONSE. The initial assessment was indeed referring to the design approach, specifically related to the iRISK predecessor, and the initial

110
assessment results were used in funding decision. The further assessment was indeed referring to the web-based model. We have revised section 1.7 of the report to further clarify the difference between initial assessment and further assessment.
43 [COMMENT 4-91] 3rd sentence in Section 4.1 does not specify a table number (7). RESPONSE. The table number has been added to the report.
IV. SPECIFIC OBSERVATIONS ON THE iRISK MODEL Most of my comments were general, and were discussed in detail in the above sections URL/Steps to get to URL
Comments
From main screen
[COMMENT 4-92] One thing I found confusing in creating new scenarios was the order in which modules had to be created, and where you create them. For example, if you want to add new consumption data, you can’t dive into the consumption folder and create a new module. No, you have to go back to the food module, and create a food, and then you can create a consumption model. Because all of the left hand folders are on the same “level” (e.g. not nested), it isn’t clear that consumption is a sub-model of food. Same goes for dose-response as a sub-model of hazard. This would be much clearer if the folders for consumption and dose-response were nested within food and hazard. RESPONSE. The reason why a food must be created prior to creating a consumption model is because it is a prerequisite. We agree with the reviewer that further improvements of the user interface are desirable. As described in responses to detail comments from the reviewer above, we plan to address folder-nesting and other issues by developing a more streamlined step-by-step user interface with fewer side bars and pop-up windows in the next phase of iRISK development.
Main screen [COMMENT 4-93] Similar to the above, you can create a risk scenario but you can’t save it until you have created all of the necessary six models. The natural thing to do when creating models is to start with the framework and then fill in the details as you go. But the way the model is designed you have to create all the pieces before you can save a risk scenario. I found this to be quite counter-intuitive, and found that it works against the normal “mental-model” one uses to develop a model.

111
RESPONSE. We agree with the reviewer that it is natural to create a model by starting with the framework and then filling in the details. We believe that by design the framework of a risk scenario already exists in iRISK. Therefore, users start with creating the elements and then can save each of the six elements as they work. In the iRISK version presented for peer review, a risk scenario can be created only after all six elements have been defined, i.e., by simply selecting the pre-defined elements from a drop-down menu. In the next phase of iRISK development, we plan to evaluate the feasibility of providing a means for users to save a risk scenario before all of the necessary six elements are created, to help make using iRISK more intuitive. In the meantime, this potential counter-intuitive issue can be addressed by training.
Terminology [COMMENT 4-94] I think it might be helpful to develop a glossary to guide users through what different things are, such as a “repository” or “risk scenario.” RESPONSE. We plan to develop a glossary in the next phase of iRISK development.
Role of population groups
[COMMENT 4-95] Confusing. It explicitly links to consumption, but seeing as the DALY templates also relate directly to population, one would think this would link automatically. That is, the DALY durations for mortality, etc., should be keyed off the defined population group associated with the consumption patterns. It appears that these are not linked explicitly in the modeling framework, which seems like it could result in mismatches between populations modeled in consumption and valued/assessed in DALYs. RESPONSE. We agree with the reviewer that having a built-in mechanism to automatically link DALYs to the population defined for consumption would be helpful to minimize or eliminate potential mismatches. We plan to evaluate feasibility and, as appropriate, consider developing this feature in the next phase of iRISK development.
Terminology of “process model”
[COMMENT 4-96] The model and documentation should be consistent when referring to a “process model” and a “process type” and “process stage” – A process model is a string of modeled process stages, and process types may be better termed process stage types, as they refer to what happens in an individual stage vs. what happens in the model as a whole. The looseness of language around “process” leads to confusion. RESPONSE. We appreciate the reviewer providing language to help further clarify the three terms: process model, process stage and process type. We plan to include these terms in a glossary and to refer to the terms in a consistent manner in the model and documentation.

112
Risk Scenario screen – “Sum selected”
[COMMENT 4-97] It seems redundant and confusing to allow for the summing of results in two places – in the main risk scenario screen, and by creating risk scenario groups. RESPONSE. We have revised the iRISK user interface so that the "Sum Selected" option is available only in one place, the main risk scenario screen.

113
REVIEWER #5 I. GENERAL IMPRESSIONS [COMMENT 5-1] The report and the bodies of work that it represents is a very ambiguous risk analysis project on the part of FDA and its contractors. The work products are quite impressive. While I have several suggestions for potential improvements and a few potential concerns, the work is conceptual excellent and will provide a highly useful tool. The primary question is for whom is the tool intended. RESPONSE. We believe the tool can be used by risk assessors, decision-makers and food safety professionals to create and review risk scenarios in a relatively rapid and easy fashion, and to share data and models online. [COMMENT 5-2] The tool and the accompanying documentation are clearly written by risk assessors for risk assessors. The tool effectively simplifies the use of Analytica for doing microbial food safety product pathway assessments and makes it easy to compare and contrast risks through the use of DALYs. However, if this is going to be used by an array of individuals who are not trained risk assessors, the developers may need to simplify the development of the model further by developing process modules that can be “dragged” into the scenario that is being developed and modified easily to meet the needs of the individual user. RESPONSE. The iRISK tool is indeed intended to be used by an array of individuals who are interested in creating and using risk assessments. A user manual has been developed and the users are expected to be trained in order to use the tool appropriately and effectively to create risk scenarios. Currently, the process module consists of built-in process types that users can select to represent any processing steps in the product pathway. The user needs to first describe the steps of a process of interest and then select one of the nine "process type" choices to represent the step. We plan to develop a hypothetical process model (e.g., Listeria during production of soft cheese) which will include the various process steps (i.e., process stages) and hypothetical values will be entered for six of the "process type" choices for demonstration purposes. Users can use this process model as an example to build a process model of interest, step-by-step. We also plan to evaluate the feasibility of developing a "dragged in" process module in the next phase of iRISK development. [COMMENT 5-3] It would also be beneficial to provide guidance on how the user can relate risk for their specific produce or facility when most data available are of a very general nature.
114
RESPONSE. We plan to evaluate this suggestion in the next phase of iRISK development. Providing the guidance suggested by the review is beyond the scope of the iRISK tool itself, because such guidance is relevant to any risk assessment, not just iRISK. [COMMENT 5-4] It appears from the manual that some of these needs were anticipated, and may be addressed in the future with the merging of the RTI databases into iRISK, however, the beta-version that I had a chance to explore did not have the resources that were indicated in the user guide. Development of a “help” section must be given a high priority if the tool is going to be used by a wider audience. RESPONSE. We plan to include the development of a "help" section as a high priority for the next phase of the iRISK development. [COMMENT 5-5] I would also speculate that a substantial portion of the future use of iRISK will be the development of simple individual risk assessments instead of as a risk ranking tool. I know that that is what I intend to use it for once it becomes available. RESPONSE. We agree with the reviewer. [COMMENT 5-6] I do want to note that my review of the document was limited by the fact that the materials available were limited to microbiological concerns. It was difficult to do a head-to-head comparison of the utility of the tool for different classes of hazards when only one has been implemented in the program. RESPONSE: For the peer review, we chose to focus on iRISK methodology and provided only microbial risk scenarios for the reviewers. However, our goal is to use iRISK for evaluating risk from both chemical and microbial hazards. We plan to find an opportunity to conduct a peer review of risk scenarios for chemical hazards in the future. II. RESPONSE TO CHARGE QUESTIONS 1. Is the report clearly written and follow a logical structure and layout? If not, the reviewer should provide suggestions for how to better document the risk assessment. [COMMENT 5-7] It is a little unclear to what report this question is referring. If it refers to the user manual, as noted in the general comments, the adequacy of that document is dependent on the audience that FDA is trying to reach with iRISK.

115
It is clear and appropriate for individuals with some experience with the development of risk assessment models, but not for novices. If the report means the actual reporting of the results of the risk scenario, there is very little discussion of any options or even an example of a summary table in user manual that this reviewer could find in the manual. Since the results of iRISK will need to be shared and communicated to others, some additional thought should be given into how the output of the risk assessment scenario should be presented. RESPONSE. The question refers to the document for peer review titled "Public Health Risk Assessment for FDA-Regulated Commodity/Hazard Combinations Using Risk Ranking Methodology and Tools." We concur with the reviewer that careful consideration should be given to how the output of the risk assessment (i.e., the risk scenario for a commodity/hazard combination) is presented to enhance communication. Currently, the output includes all the inputs the user makes including any description and references. We plan to improve iRISK model output presentation, such as by adding the number of cases as an output in the summary report, and adding graphic presentation for ranking and scenarios analysis results, in the next phase of iRISK development. 2. The iRISK model generates ranking of commodity-hazard pairs through a framework with two modules – a predictive multistage farm-to-fork process risk module and a hazard characterization module. Is the overall modeling approach fundamentally sound for the risk ranking purpose and scope? If not, what problems exist and how should they be addressed? If other approaches would be more suitable, the reviewer should provide a description and an explanation. [COMMENT 5-8] The overall approach used for commodity-hazard pairs is appropriate and consistent with the way that food safety risk assessments are conducted. I do have three concerns about the modeling approach that may need further explanation in the user manual and additional features in the program. The first is the Monte Carlo capabilities of the software. There is little guidance in regard to the number of iterations that should be run. Particularly if the user is dealing with low probability events, insufficient iterations can give inaccurate estimates of risk. Something that estimates the number of iterations needed based on the values inputted would be ideal. RESPONSE. In the iRISK version presented for peer review, the number of iterations is set as a default without user input. In the next phase of iRISK development, we plan to add a new feature on stability analysis. With the new feature, the user is required to run a stability analysis of the risk scenario before including it in ranking or performing sensitivity analysis using the risk scenario. We plan to provide guidance to the user with respect to common reasons that a model fails to converge (i.e., stability analysis fails) to assist the user to evaluate inputs for the various elements (especially the process model) and to modify model inputs where necessary to resolve the stability issue.

116
[COMMENT 5-9] The second is that one is limited to a commodity-hazard pair which may lead to an under estimation of the relative risk associated with a commodity. For example, fresh leafy greens are a potential vehicle for enterohemorrhagic Escherichia coli and iRISK would be suitable to developing a risk ranking for that pair. However, if you wanted to rank the overall risk of microbiological disease associated with this commodity group, you would have to also look at Salmonella, Noroviruses, Shigella, etc. As currently configured, it would be very difficult to do with iRISK. RESPONSE. We agree with the reviewer that there are multiple pathogens reasonably likely to occur in some commodities. Since data inputs such as prevalence, concentration distribution and growth characteristics are usually pathogen-specific, iRISK is designed to model one commodity-hazard pair at a time. To obtain a full picture of the risks associated with all the pathogens reasonably likely to occur in a commodity, the user needs to develop more than one risk scenario for the commodity and sum the risks from the risk scenarios. This summing can be done in iRISK by creating a scenario group for the multiple relevant scenarios, or by using the “Sum Selected” option on the main screen. [COMMENT 5-10] The third area is the risk associated with chronic exposure to chemical hazards or naturally occurring toxicants. I am not sure that a probabilistic approach is warranted if exposure over a 70 year life time has to be constructed. In addition to the overall uncertainty associated with low dose extrapolations, the potential changes in consumption patterns over 70 years could be huge. For example, if one looked at milk consumption vs. dioxin contamination, in addition to the uncertainty with dioxin levels in milk, one would need to consider the changing consumption pattern starting at childhood and generally declining dramatically in adulthood. This is in part the reason why many of the risk assessments for chronic chemical exposures are deterministic in approach. RESPONSE. We agree with the reviewer that there are potentially huge changes in consumption patterns over a 70-year life span. We plan to develop a consumption demographic template to describe a life span as a combination of several population groups for different life stages. Users can use the template to compute a weighted daily average lifetime dose based on the span in years in each population group and the serving size and body weight for each group. The new template will help improve the representation of chronic exposure to a chemical hazard over a life time in a risk scenario. We agree with the reviewer on the reason why a deterministic approach is used in many of the risk assessments for chronic chemical exposures. iRISK incorporates probabilistic elements because there is variability in the inputs for one or more of the six elements for a risk scenario, e.g., serving size, concentration of the chemical hazards. Thus, using a probabilistic approach helps to account for variability in the model inputs. We agree with the reviewer that there is uncertainty associated with low dose extrapolation. Our current thinking is to focus on chronic chemicals that have a defined nonthreshold dose-response relationship, such as life time cancer

117
risk from a commodity contaminated with aflatoxins. We plan to use the latest dose-response model available to develop risk scenarios, document uncertainty associated with the model, and update the dose-response relationship when new model become available. 3. The iRISK BETA model structure consists of a number of components in the process risk module that describes changes in the prevalence and level of a hazard at various process stages. The components include nine choices: no change, increase (growth; for microbial hazards only), increase (addition), decrease, pooling, partitioning, evaporation/dilution, cross-contamination (partial), and cross-contamination (total).
3.1. Are the components in the model adequate to describe major relationships or outcomes at various process stages for the commodity-hazard pairs?
[COMMENT 5-11] Two potential issues arose as I evaluated this section. The first was mostly a communication issue that involved cross contamination. In addition to the two specific cross-contamination options, one could also effectively do a cross-contamination scenario under pooling. Am I misinterpreting this possibility? Specific examples of each of the options may be helpful. RESPONSE. The reviewer interpreted the pooling correctly in that, when units of food are combined into larger units (i.e., pooling), there is opportunity for some contaminated units to be mixed with some uncontaminated units. This pooling results in an increase in prevalence and a decrease in the concentration of the hazard in each contaminated unit. We plan to develop a hypothetical process model "Listeria during Production of Soft Cheese" in which an example of cross-contamination due to pooling is provided at the process step "Combining Milk in Tanker". We plan to evaluate and, as appropriate, develop specific examples of partial cross-contamination and total cross-contamination in the next phase of the iRISK development. [COMMENT 5-12] Also, since many processing plants have multiple lines and multiple products on those lines, some users may want to consider those types of scenarios. My feeling is that most non-government users would be focused on their products in their facilities. RESPONSE. We agree with the reviewer on the focus of non-government users. To model multiple lines in a facility, users can first define the process steps for the individual lines, and decide to develop one or more product-hazard risk scenarios, depending on the degree of similarity among the process steps for the lines (i.e., a determination of whether or not multiple products can be represented by one process model). [COMMENT 5-13] The second issue was the fact that the entire approach is set to determine the baseline risk of a system when it is under control. What the instructions do not adequately discuss is how iRISK

118
could be used to determine failure mode risks. It is not that I don’t think iRISK could be used; it is not discussed. One of the key determinants of relative risk is not only the baseline risk but also the likelihood that one or more of the steps within the system is likely to fail. Also, this is particularly important if the user would like to look at risks associated with process deviations. RESPONSE. We agree with the reviewer that iRISK can be used to determine the baseline risk of a system as well as the risk of the system when failure occurs. We have added a short paragraph in the iRISK report (section 1.4.8 Process Model) to indicate the availability of this feature in iRISK. The user can determine both baseline risk and “failure-mode” risk of a system by using the Scenario Analysis option in iRISK. Alternatively, the user can create multiple scenarios for the commodity-hazard pair with a process model in which the data inputs are changed at one or more steps, and a consumption model in which data inputs are changed based on the fraction of the total number of servings associated with either the baseline-mode or the failure-mode (e.g., based on the assumption for the likelihood that one or more of the steps within the system will fail).
3.2. Are there additional components that should be incorporated into the model? Is there any component or function currently in the model that is not necessary and should be omitted? If so, the reviewer should explain how to address such changes in the model. [COMMENT 5-14] See comment about failure mode determinations. This would be most effectively handled by including a “what-if” scenario routine that allowed for a calculation of a failure mode condition for a specified amount of time during a production year. RESPONSE. We agree with the reviewer. Currently, users can use the Sensitivity Analysis option to specify the amount of time during a year that a process failure may occur. We plan to evaluate and as appropriate develop a “what-if” scenario routine that provides an option for the user to enter the amount of time that the system is in failure-mode and link this time to the fraction of servings affected in the next phase of iRISK development. 4. The report describes the functions or equations (Equations 1 through 11) that underlie exposure assessment and risk characterization in the iRISK model. 4.1. Is there any of the assumptions underlying these functions or equations in the iRISK BETA model unreasonable, according to current modeling and peer-review practices? If so, please explain. [COMMENT 5-15] In general, this reviewer is in complete agreement with the assumptions underlying the model. The question about being in accordance with current peer-review practices is somewhat moot since the risk evaluations are for individual users. If they were then going to present the results

119
of their iRISK evaluations to a third party (e.g., FDA, client), they would likely need to do a complete presentation of their scenario and models. Just saying that one used iRISK to do an evaluation would not be sufficient since there are way too many places where one could “do it wrong.” RESPONSE. We agree with the reviewer’s comment.
4.2. Are these functions or equations scientifically justified and biologically sound for the purpose they are used in the model? [COMMENT 5-16] Yes, for their stated use. RESPONSE. We appreciate the reviewer’s comment.
4.3. Considering the model provided for the two commodity-hazard pair examples, are the equations or functions accurately implemented in the model? If not, please explain. [COMMENT 5-17] Yes, based on the limited reconstruction of the examples that I did. RESPONSE. We appreciate the reviewer’s comment. 5. A key feature of iRISK BETA is the ability to compare both chemical and microbial risks. The model reporting allows users to compare risks with different metrics. In addition to a mean risk of illness, the annual DALY is used. With this in mind, [COMMENT 5-18] Since I did not see an example of a chemical calculation, I cannot render an answer to this question in general. This went out too soon to allow a meaningful examination of the ability of this package to handle multiple hazards. It also does not allow one to rank foods for “total hazards” to compare which commodities are the riskiest. RESPONSE: We recognize that there was a limitation in the peer review in which no risk scenarios for chemical hazards were provided. Because of the broad scope of iRISK, we chose to focus on iRISK methodology (mathematical equations) for both microbial and chemical hazards, but provided only microbial risk scenarios for the reviewers. Our goal is to use iRISK for evaluating risk from both chemical and microbial hazards. We plan to find an opportunity to conduct a peer review of risk scenarios for chemical hazards in the future.
120
5.1. Comment on the appropriateness of using the annual DALY and the strengths and limitations of the implementation of this metric in the model. [COMMENT 5-19] The primary limitation is the lack of agreed upon DALYs, and the fact that DALYs vary from region to region. Getting agreement for DALY values could be a challenge for international food safety risk issues. Additionally, I personally do not think that the currently available DALYs were derived in a transparent enough manner such that they could withstand a challenge if they were used as part of a regulatory decision. RESPONSE. We agree with the reviewer that there are limitations associated with DALYs. We have revised the iRISK report to indicate that the DALY approach is one of several commonly used public health metrics. iRISK is flexible in that, besides the DALY, other health impact metrics such as Quality Adjusted Life Year (QALY) and cost-of-illness (Batz et al., 2011; ERA, 2010) may be added to the tool in the future. We plan to add other public health metrics such as cost of illness and QALY in the next phase of iRISK development.
5.2. Comment on the appropriateness of available options for microbial and chemical dose response functions in the model and how they are used. [COMMENT 5-20] Again, this is an area where more guidance is needed to help the user select the most appropriate model. The system is good in including the various options, but offers little to the user on which to pick. Better guidance is needed if this is going to be used by non-risk assessors. RESPONSE. We agree with the reviewer that more guidance would be helpful to assist users, in particular novice risk assessors, to select appropriate dose-response models. We plan to provide references in the user manual, such as a reference to published hazard characterization guidelines from FAO/WHO (FAO/WHO, 2003), to help guide the user to helpful resources for selecting dose-response models. In addition, we plan to develop a tutorial based on the user manual for key definitions and concepts in iRISK, including those related to dose-response, and provide an example of how a dose-response model can be selected from the published literature, e.g., for well-known pathogens such as L. monocytogenes and Salmonella based on published guidelines (e.g., FAO/WHO, 2003) and risk assessment models (e.g., DHHS FDA/USDA FSIS, 2003; FAO/WHO, 2004; FAO/WHO, 2002). 5.3. Overall, are the results generated appropriate for comparing chemical and microbial risks and risk ranking purpose? If not, the reviewer should explain other results and/or analyses that are needed.

121
[COMMENT 5-21] Since no chemical materials were available, it is impossible to adequately evaluate, though conceptually I do not see why not. RESPONSE. We appreciate the reviewer’s comment. As indicated in the response above to a similar comment from the reviewer, a limitation in the peer review process was that no risk scenarios for chemical hazards were provided. We plan to find an opportunity to conduct a peer review of risk scenarios for chemical hazards in the future. 6. Given that the primary purpose of iRISK BETA is ranking risk among a number of commodity-hazard pairs, are variability and uncertainty adequately characterized in the model? If not, please explain what changes might be considered to improve characterization of variability and uncertainty. [COMMENT 5-22] The tool does not directly deal with uncertainty in its subroutines as far as I can tell (and as stated in the manual). At least in theory, one could do the simulations a number of times to get some degree of model uncertainty but not fully satisfactory, and it would be not the best framework for doing that task. I guess that one could include some estimate for uncertainty in their variation distributions but would have to keep track of it. They could then look at whether there was a significant difference in the DALY values calculated. RESPONSE. We agree with the reviewer that iRISK does not directly deal with uncertainty, as stated in the user manual. The user can use the Sensitivity Analysis option in iRISK to explore the influence of alternative estimates (i.e., representing uncertainty) in various distributions (i.e., representing variability) on risk estimates (e.g., the DALY value for a hazard/pathogen pair). The results from the exploratory uncertainty analysis in iRISK can inform the user’s decision on whether to conduct a more in-depth uncertainty analysis in a full-blown risk assessment outside of iRISK. 7. Given the practical constraints of the model and data, a sensitivity analysis option is provided by which the user can specify 5 alternate values for a single parameter in the Process Model, Dose Response Model, or Consumption model, and obtain the ranked results as compared to the original scenario. If this approach is not sufficient, please provide additional or alternative approach(es) and explain what changes might be considered and how they would improve the model. [COMMENT 5-23] Personally I think that is more than sufficient. Considering the design of the model tool, if one needs to look at other parameters or more values, they can relatively easily run another risk scenario. Alternatively, they can export the design of the model to another program that is

122
capable of doing the more advanced analyses. This tool cannot do everything because it will then do nothing well. RESPONSE. We agree with the reviewer’s comment. 8. Comment on the iRISK BETA user interface. Is the interface user friendly? Are there any features that should be modified or added to facilitate ease of use? For example, is there sufficient description in the user interface to understand each component of the model? [COMMENT 5-24] It is not bad once you get used to it, but there is a substantial learning curve. There is a strong need for a “user-friendly training manual” if you expect non-risk assessors to use the program or if you expect the user to then use it to explain risk options to risk managers who are not familiar with the program. RESPONSE. We agree with the reviewer’s comment. In the next phase of iRISK development, we plan to develop a tutorial (i.e., a “user-friendly training manual”) oriented toward novice risk assessors. This tutorial will be based on the current manual and will include additional information where necessary, e.g. key definitions/concepts/elements for iRISK, such as process types, dose-response models for acute or chronic hazards, and public health metrics based on published guidelines and risk assessment models. In addition, as described above in the responses to several comments from reviewer #4, we also plan to develop a step-by-step user interface in the next phase of iRISK development, which would complement the tutorial in helping users to better navigate the iRISK interface and communicate results from iRISK to risk managers. [COMMENT 5-25] There is a lot of “up and back” with the interface, and file/risk scenario management is likely to be issue as one increases ones library. RESPONSE. We agree that there is a need to further improve the iRISK interface. We plan to revise the user interface to assist users to build a risk scenario in a more “linear” fashion, e.g., a step-by-step fashion, which progresses as follows: define/select a process model (this will automatically select food and hazard); select exposure type (acute microbial/chemical hazard or chronic chemical hazard); define/select a consumption model; define/assign a dose response model and a health metric; perform stability analysis (and revise model as needed); calculate risk estimate/perform risk ranking. [COMMENT 5-26] What is the practical limit of storage since the files are stored online. Will FDA be able to support this?

123
RESPONSE. We plan to evaluate and address online file storage needs in the next phase of iRISK development. [COMMENT 5-27] While I may have missed it, while I was writing this review I realized that I was not sure if the program had the ability for the user to externally archive backup copies of his/her files. RESPONSE. The user can save a copy of the PDF file for a commodity-hazard scenario that includes all the inputs and results. However, the model underlying the risk scenario itself is stored in an online repository, and the user currently does not have an option to backup an archive copy of the model outside of iRISK. 9. Comment on the adequacy of the model documentation features within iRISK. Can the user accurately document data sources and confidence in the model? [COMMENT 5-28] The documentation system seems adequate though I did not intellectually push it to the limit. The issue of confidence in the model is one that was not really discussed. Confidence usually implies that one has the means for validating a model, the user guide does not really address this issue. RESPONSE. We appreciate the reviewer’s comment. The user can use the documentation features in iRISK (i.e., the reference/rationale text box) to document the source of the data inputs and the user’s confidence in the data. In the next phase of iRISK development, we plan to provide more space for the reference/rationale text box and provide a means for users to add multiple notes to scenario elements (e.g., hazard, dose response model, consumption model). We agree with the reviewer that the user guide does not address the issue of validating a model itself (i.e., a risk scenario). To address the model validation issue, we plan to develop case studies using iRISK to reproduce results from published risk assessments. [COMMENT 5-29] Generally this is done by examining a separate set of data and determining if the original model is able to adequately predict the behavior. RESPONSE. We agree with the reviewer that one of the approaches to validate a model is to examine a separate set of data and determine if the model can adequately predict the behavior. This is an approach often used to validate predictive models for microbial growth and inactivation. For the iRISK model, "validation" can be carried out by using a data set that was used in a full-blown risk assessment, and determining whether iRISK reproduces the expected results. We plan to develop case studies where iRISK is used to reproduce, in a simplified manner, results from published risk assessments, e.g., developing risk scenarios for milk and ice cream using data from the FAO/WHO L. monocytogenes risk assessment (FAO/WHO, 2004),

124
risk scenarios for smoked seafood and hard cheeses using data from the FDA/FSIS L. monocytogenes risk assessment (DHHS FDA/USDA FSIS, 2003), and a risk scenario using data from the FDA Vibrio in raw oysters risk assessment (FDA, 2005). [COMMENT 5-30] The lack of validation would be a major issue if the user was ultimately going to present their risk ranking to the FDA and expect the FDA to act on it. RESPONSE. We agree with the reviewer that validation would be essential for risk ranking results to be credible when users present their results to decision makers. In iRISK, users provide inputs for all six elements of a risk scenario. iRISK provides the mathematical equations and the underlying model structure, which have been subject to review in the proof-of-concept phase of iRISK development in 2009, and are again the focus of this peer review. Users are expected to document the validity of the data/model input for the risk scenario they develop. III. SPECIFIC OBSERVATIONS ON THE DOCUMENT
[COMMENT 5-31] Page 9. You are encouraging individuals to do a risk assessment in the absence of the
framework that is generally been agreed upon. For example, the functional separation of risk management and risk assessment is not clearly defined, the identification of risk management questions, etc. Some guidance on best practices should be included.
RESPONSE. We agree with the reviewer that there should be a functional separation of risk assessment and risk management and that a risk assessment should begin with risk management questions, which are consistent with guidelines in the FDA framework document “Initiation and Conduct of All ‘Major’ Risk Assessments within a Risk Analysis Framework” (DHHS/FDA, 2002). As indicated in the responses to a comment from reviewer #4 above, iRISK has improved capacities beyond CFSAN’s current risk models, e.g., the L. monocytogenes in ready-to-eat foods risk assessment and the Vibrio in raw oyster risk assessment. iRISK is designed as a risk assessment tool that is flexible enough to enable the development of a broad variety of risk scenarios, and includes a capacity for online sharing of data and models. Risk management questions that have been formulated for the iRISK tool are, by necessity, broad and flexible, e.g., “what risk does a hazard/food pair pose to a population?”, “which hazards in which commodities cause the greatest burden of foodborne disease?”, and “what are the public health impact of an intervention at a specific step of production/manufacturing/handling process from farm to table?”. We believe that iRISK can be used to address the current risk management questions, and those which are yet to be defined.

125
[COMMENT 5-32] Page 12. There is a need to provide guidance on the number of iterations that are needed
to get an appropriate estimate of risk and to stabilize the model’s outputs. Some kind of simple calculator of iteration needs would be ideal.
RESPONSE. As described in the response to a similar comment by the reviewer above, in the iRISK version presented for peer review, the number of iterations is set as a default without user input. In the next phase of iRISK development, we plan to add a new feature on stability analysis. With the new feature, the user is required to run a stability analysis that will be used by iRISK to determine whether the model’s outputs are stabilized. If the stability analysis fails, the user would be required to, with guidance from iRISK on common reasons that models fail to converge, evaluate inputs for the various elements and to modify model inputs where necessary to attempt to resolve the stability issue. Resolving the issue is required before the user can proceed to the next step, e.g., generate risk estimate for the risk scenario and include it in risk ranking.
[COMMENT 5-33] Page 15, Table 1. Both mycotoxins and antibiotics have a “microbiological” component
if you are considering them from farm to fork that is not adequately considered in the table. RESPONSE. We agree with the reviewer that both mycotoxins and antibiotics have a microbial component as well as a chemical component if the process model covers them from farm to fork. We have added a foot note to Table 1 on p.15 for these two hazards to indicate that the microbial component of the risk scenario starts at a stage where the microbial component is relevant.
[COMMENT 5-34]
In particular, the primary hazard associated with antibiotics is fostering the selection of antibiotic resistant strains in the food and not the classic toxicology responses used for chemicals. This hazard class may need to be reconsidered. RESPONSE. We agree with the reviewer that, in addition to antibiotics themselves being a potential chemical hazard, another potential hazard associated with antibiotics is fostering the selection of antibiotic resistant strains in primary food production. Antibiotic resistant microbial pathogens are a complex issue as illustrated in a report by an IFT expert panel (IFT, 2006). We plan to reconsider this hazard class in the next phase of iRISK development. In the meantime, we have added a foot note to Table 1 to indicate that antibiotic resistant microbial pathogens are a potential hazard.
[COMMENT 5-35] I disagree with the statement that “This value is 100% when the output of the dose-
response is illness.”[p. 16]. For a number of diseases, you have to consider the

126
susceptibility of the population. For example, only about 50% of the population is inherently susceptible to noroviruses.
RESPONSE. We agree with the reviewer in regard to the need for entering a value less than 100% for certain pathogens, e.g., noroviruses. We have revised the iRISK report to indicate the following:
In the case where only a proportion of the population is inherently susceptible to a pathogen, the value associated with the probability of illness given response should be less than 100%. For example, a proportion of the population (e.g., ~20%) is inherently not susceptible to noroviruses (Rydell et al., 2011), which were referred to as Norwalk virus in studies by Gary et al. (1987) and Johnson et al. (1990); in this case, the probability of illness should be less than 100%.
[COMMENT 5-36] Page 16, Table 2. It is not clear how the “nonthreshold linear by slope” and the “non-
threshold linear” differ. No effective guidance on which model should be used with which hazards and foods. RESPONSE. We plan to develop examples to illustrate the difference between the “nonthreshold linear by slope” model and the “non-threshold linear” model in the next phase of iRISK development.
[COMMENT 5-37] Page 17. Not much mentioned in the manual about how to use multiple end points and
their dose-response relations to get an overall estimate of the severity of a hazard. This is critical if going to compare risks based on DALYs since the calculations will be largely overwhelm by serious outcomes or sequellae. RESPONSE. In iRISK, the influence of dose-dependencies on public health burden is taken into account indirectly by using a metric such as DALY, where disease severity (including duration) is considered in developing a DALY template. For example, a DALY template for Salmonella infection is developed based on multiple outcomes, i.e., complicated (i.e. hospitalized) and uncomplicated gastroenteritis, and mortality (Scallan et al., 2011). The issue of the correlation between illness severity and doses is still a topic of research, and available dose-response models for common known pathogens such as L. monocytogenes and Salmonella do not explicitly model severity as a function of dose. As more advanced dose-response models are developed, we will consider incorporating new dose response models in iRISK when they become available.
[COMMENT 5-38] Page 19, Table 3. Pasta is a bad example of a complex food. Ravioli would be a
complex food but most dried pasta would not be. Also, the category of Low Water Activity Processed Foods is much too broad.

127
RESPONSE. We agree with the reviewer. We have removed “dried pasta” and “fresh refrigerated pasta” from the complex food category. We also concur that the “Low water activity processed foods” category is too broad, and plan to divide this into several categories in the next phase of the iRISK development.
[COMMENT 5-39] Page 19. What is to stop one from simply assuming a consumption value if data are not
available.
RESPONSE. We agree with the reviewer. The user can indeed make any assumptions for consumption value, which should be documented.
[COMMENT 5-40] Page 32-38. A simple example that is followed through the presentation of the equations
would be very helpful for most of us that don’t inherently think in mathematical expressions.
RESPONSE. We plan to develop a simple example that follows through the presentation of the equations in the future.
[COMMENT 5-41] Page 39. Guidance on how to make and record assumptions would be beneficial. This is
likely how a lot of the users will get in trouble.
RESPONSE. We agree with the reviewer on the importance of making and documenting assumptions. We plan to further emphasize this importance in the user manual and a future tutorial in the next phase of iRISK development.
[COMMENT 5-42] Page 39-98. This section is the key to making the system work for most users but was
unavailable to the reviewers. In fact, we got two different responses in the documentation, i.e. this section was provided, but the tool indicates that only the users’ data will be employed. RESPONSE. The sections from p. 39-98 (i.e., data needs, and proof-of-concept testing, and appendices) describe FDA's efforts to collect data from an expert elicitation and develop risk scenarios in iRISK for proof-of-concept testing. The reviewer is correct in that the tool itself requires that users enter data and develop risk scenarios using the iRISK model structure and built-in templates. We plan to make iRISK available to the public through the Foodrisk.org website, which will include the tool (iRISK model

128
structure and built-in templates) along with several example risk scenarios and their associated elements.
IV. SPECIFIC OBSERVATIONS ON THE iRISK MODEL [COMMENT 5-43] My comments of a general nature are provided above. To actually test the system by attempting to do several risk assessments and then using them to perform a risk ranking was well beyond the time frame and time availability of this reviewer. RESPONSE. No reply is needed.

129
V. REFERENCES Batz, M. B., S. Hoffmann, and J. G. Morris Jr. 2011. Ranking the risks: The 10 pathogen-food combinations with the greatest burden on public health. Emerging Pathogens Institute, University of Florida. Available at http://www.epi.ufl.edu/sites/www.epi.ufl.edu/files/RankingTheRisksREPORT.pdf. Accessed May 27, 2011. Berrang, M. E., J. F. Frank, and R. J. Meinersmann. 2008. Effect of chemical sanitizers with and without ultrasonication on Listeria monocytogenes as a biofilm on PVC drain pipes. J. Food Prot. 71:66-69. Berrang, M. E., J. F. Frank, and R. J. Meinersmann. 2010. Listeria monocytogenes biofilm formation on silver ion impregnated cutting boards. Food Prot. Trends 30:168-171. Bollaerts, K., M. Aerts, C. Faes, K. Grijspeerdt, J. Dewulf, and K. Mintiens. 2008. Human salmonellosis: Estimation of dose-illness from outbreak data. Risk Anal. 28:427-440. Buchanan, R. L., A. H. Havelaar, M. A. Smith, R. C. Whiting, and E. Julien. 2009. The key events dose-response framework: Its potential for application to foodborne pathogenic microorganisms. Crit. Rev. Food Sci. Nutr. 49: 718-728. Burnett, S. L., E. L. Mertz, B. Bennie, T. Ford, and A. Starobin. 2005. Growth or survival of Listeria monocytogenes in ready-to-eat meat products and combination deli salads during refrigerated storage. J. Food Sci. 70: M301-M304. Chen, Y., K. M. Jackson, F. P. Chea, and D. W. Schaffner. 2001. Quantification and variability analysis of bacterial cross-contamination rates in common foodservice tasks. J. Food Prot. 64:72-80. Chen, Y., W. H. Ross, R. C. Whiting, A. Van Stelten, K. K. Nightingale, M. Wiedmann, and V. N. Scott. 2011. Variation in Listeria monocytogenes dose responses in relation to subtypes encoding a full-length or truncated internalin A. Appl. Environ. Microbiol. 77:1171-1180. Chmielewski, R. A. N., and J. F. Frank. 2006. A predictive model for heat inactivation of Listeria monocytogenes biofilm on buna-N rubber. LWT. 39:11-19. Chmielewski, R. A. N., and J. F. Frank. 2004. A predictive model for heat inactivation of Listeria monocytogenes biofilm on stainless steel. J. Food Prot. 67:2712-2718. Chmielewski, R. and J. F. Frank. 2003. Biofilm formation and control in food processing facilities. Comp. Rev. Food Sci. Food Safety 2:22-32.

130
Codex Alimentarius Commission (CAC). 1999. Principles and guidelines for the conduct of microbiological risk assessment. CAC/GL-30. Available at http://www.codexalimentarius.net/web/more_info.jsp?id_sta=357. Accessed May 18, 2011. Codex Alimentarius Commission (CAC). 2007. Working principles for risk analysis for food safety for application by governments. CAC/GL-62. Available at http://www.codexalimentarius.net/web/more_info.jsp?id_sta=10751. Accessed May 18, 2011. Coleman, M. E., and H. M. Marks. 1998. Topics in dose-response modeling. J. Food Protect. 61:1550-1559. Coleman, M. E., and H. M. Marks. 2000. Mechanistic modeling of salmonellosis. Quant. Microbiol. 2:227–247. Department of Agriculture/Food Safety and Inspection Service (USDA/FSIS). 2005. Risk assessments of Salmonella Enteritidis in shell eggs and Salmonella spp. in egg products. Available at http://www.fsis.usda.gov/PDF/SE_Risk_Assess_Oct2005.pdf. Accessed May 18, 2011. Department of Health and Human Services Food and Drug Administration (DHHS/FDA). 2002. Initiation and conduct of all "major" risk assessments within a risk analysis framework: A report by the CFSAN risk analysis working group. Available at http://www.fda.gov/Food/ScienceResearch/ResearchAreas/RiskAssessmentSafetyAssessment/ucm242929.htm. Accessed June 1, 2011. Department of Health and Human Services/ Food and Drug Administration (DHHS/FDA). 2008a. Guidance for industry: Control of Listeria monocytogenes in refrigerated or frozen ready-to-eat foods; Draft guidance. February 2008. Available at http://www.fda.gov/Food/GuidanceComplianceRegulatoryInformation/GuidanceDocuments/FoodProcessingHACCP/ucm073110.htm. Accessed May 9, 2011. Department of Health and Human Services/ Food and Drug Administration (DHHS/FDA). 2008b. Guidance for industry: Guide to minimize microbial food safety hazards of fresh-cut fruits and vegetables. February 2008. Available at http://www.fda.gov/Food/GuidanceComplianceRegulatoryInformation/GuidanceDocuments/ProduceandPlanProducts/ucm064458.htm. Accessed May 9, 2011. Department of Health and Human Services/Food and Drug Administration (DHHS/FDA) and Department of Agriculture/Food Safety and Inspection Service (USDA/FSIS). 2003. Quantitative assessment of relative risk to public health from foodborne Listeria monocytogenes among selected categories of ready-to-eat foods. Available at: http://www.fda.gov/Food/ScienceResearch/ResearchAreas/RiskAssessmentSafetyAssessment/ucm183966.htm. Accessed December 27, 2010. Disson, O., G. Nikitas, S. Grayo, O. Dussurget, P. Cossart, and M. Lecuit. 2009. Modeling human listeriosis in natural and genetically engineered animals. Nature Protocols. 4:799-810.

131
Economic Research Service (ERS). 2010. Foodborne illness cost calculator. Updated December 28, 2010. Available at http://www.ers.usda.gov/Data/FoodborneIllness/. Accessed May 27, 2011. Farber, J. M., W. H. Ross, and J. Harwig. 1996. Health risk assessment of Listeria monocytogenes in Canada. Intl. J. Food Microbiol. 30:145–156. Food and Agriculture Organization of the United Nations, World Health Organization (FAO/WHO). 2004. Risk assessment of Listeria monocytogenes in ready-to-eat foods. Technical report. Microbiological Risk Assessment Series 5. FAO/WHO. Rome. Available at http://www.fao.org/docrep/010/y5394e/y5394e00.htm. Accessed May 9, 2011. Food and Agriculture Organization of the United Nations, World Health Organization (FAO/WHO). 2002. Risk assessments of Salmonella in eggs and broiler chickens. Technical report. Microbiological Risk Assessment Series 2. FAO/WHO. Rome. Available at http://www.fao.org/docrep/010/y5394e/y5394e00.htm. Accessed May 9, 2011. Food and Agriculture Organization of the United Nations, World Health Organization (FAO/WHO). 2003. Hazard characterization for pathogens in food and water: Guidelines. Microbiological Risk Assessment Series 3. Available at http://www.fao.org/ag/agn/agns/jemra_guidelines_hazard_en.asp. Accessed May 11, 2011. Francois, K., F. Devlieghere, M. Uyttendaele, and J. Debevere. 2006. Risk assessment of Listeria monocytogenes: Impact of individual cell variability on the exposure assessment step. Risk Ana. 26:105-114. Frank, J. F. 2009. Biofilms in the food environment. pp. 95-115. In L.-A. Jaykus, H. Wang, and L. S. Schlesinger (eds.). Foodborne Microbes: Shaping the Host Ecosystem. ASM Press, Washington, D.C. Gary, G. W., L. J. Anderson, B. H. Keswick, P. C. Johnson, H. L. DuPont, S. E. Stine, and A. V. Bartlett. 1987. Norwalk virus antigen and antibody response in an adult volunteer study. J. Clin. Microbiol. 25:2001-2003. Gombas, D. E., Y. Chen, R. S. Clavero, and V. N. Scott. 2003. Survey of Listeria monocytogenes in ready-to-eat foods. J. Food Prot. 66:559-569. Haas, C. N., A. Thayyar-Madabusi, J. B. Rose, and C. P. Gerba. 1999. Development and validation of dose response relationship for Listeria monocytogenes. Quant. Microbiol. 1:89-102. Holcomb, D. L., M. A. Smith, G. O. Ware, Y-C. Hung, R. E. Brackett, and M. P. Doyle. 1999. Comparison of six dose-response models for use with food-borne pathogens. Risk Anal. 19:1091-1100.

132
Hwang, C. A., and S. Sheen. 2009. Modeling the growth characteristics of Listeria monocytogenes and native microflora in smoked salmon. J. Food Sci. 74: M125-M130. Institute of Food Technologists (IFT). 2006. Antimicrobial resistance: Implications for the food system. IFT Expert Report. Comprehensive Reviews in Food Science and Food Safety. 5:71-137. International Life Sciences Institute (ILSI). 2010. Impact of microbial distributions of food safety. J. Bassett (ed.). ILSI Europe Report Series, Brussels, May 2010. Available at http://www.ilsi.org/Europe/Publications/Microbial%20Distribution%202010.pdf. Accessed May 17, 2011. Jongenburger, I., M. W. Reij, E. P. J. Boer, L. G. M. Gorris, and M. H. Zwietering. 2011. Actual distribution of Cronobacter spp. in industrial batches of powdered infant formula and consequences for performance of sampling strategies, Int. J. Food Microbiol. doi:10.1016/j.ijfoodmicro.2011.08.003. Johnson, P. C., J. J. Mathewson, H. L. DuPont, and H. B. Greenberg. 1990. Multiple-challenge study of host susceptibility to Norwalk gastroenteritis in US adults. J. Infect. Dis. 161:18-21. Kemmeren, J. M., M.-J. J. Mangen, Y. T. H. P. van Duynhoven, and A. H. Havelaar. 2006. Priority setting of foodborne pathogens: Disease burden and costs of selected enteric pathogens. RIVM report 3300080001/2006. RIVM, Bilthoven, the Netherlands. Available at http://www.rivm.nl/bibliotheek/rapporten/330080001.pdf. Accessed May 17, 2010. Latimer, H. K., L.-A. Jaykus, R. A. Morales, P. Cowen, and D. Crawford-Brown. 2001. A weighted composite dose-response model for human salmonellosis. Risk Anal. 21:295-305. Lecuit, M. 2005. Understanding how Listeria monocytogenes targets and crosses host barriers. Clin. Microbiol. Infect. Dis. 11:430-436. Lecuit, M. 2007. Human listeriosis and animal models. Microbes Infect 9: 1216-1225. Lecuit, M., and P. Cossart P. 2002. Genetically-modified-animal models for human infections: The Listeria paradigm. Trends Mol. Med. 8:537–542. Lecuit, M., J. L. Sonnenburg, P. Cossart, and J. I. Gordon. 2007. Functional genomic studies of
the intestinal response to a foodborne enteropathogen in a humanized gnotobiotic mouse model. J. Biol. Chem. 282: 15065-15072.
Mejlholm, O., A. Gunvig, C. Borggaard, J. Blom-Hanssen, L. Mellefont, T. Ross, F. Leroi, T. Else, D. Visser, and P. Dalgaard. 2010. Predicting growth rates and growth boundary of Listeria monocytogenes - An international validation study with focus on processed and ready-to-eat meat and seafood. Intl. J. Food Microbiol. 141:137-150.

133
Montville, R., Y. Chen, and D. W. Schaffner. 2001. Glove barriers to bacterial cross-contamination between hands to food. J. Food Prot. 64:845-849. Mylius, S. D., M. J. Nauta, and A. H. Havelaar. 2007. Cross-contamination during food preparation: A mechanistic model applied to chicken-borne Campylobacter. Special Issue on Campylobacter Risk Management and Assessment (CARMA). Risk Anal. 27:803-813. National Advisory Committee on Microbiological Criteria for Foods (NACMCF). 2005. Considerations for establishing safety-based consume-by date labels for refrigerated ready-to-eat foods. J. Food Prot. 68:1761–1775. National Advisory Committee on Microbiological Criteria for Foods (NACMCF). 2010. Parameters for Determining Inoculated Pack/Challenge Study Protocols. J. Food Prot. 73: 140-202. National Research Council (NRC). 2010. Toxicity pathway-based risk assessment: Preparing for paradigm change. A Symposium Summary. Standing Committee on Risk Analysis Issues and Reviews. E. Mantus (rapporteur). Available at http://www.nap.edu/catalog.php?record_id=12913. Access June 6, 2011. National Research Council of the National Academies (NRC). 2007. Toxicity testing in the 21st century: A vision and a strategy. Committee on Toxicity Testing and Assessment of Environmental Agents. The National Academies Press: Washington, D.C., USA. http://www.nap.edu/catalog.php?record_id=11970. Access June 6, 2011. Nauta, M. J. 2005. Risk assessment modelling of the food handling processes mixing and partitioning. Int. J. Food Microbiol. 100(1-3):311-22. Nauta, M. J. 2008. The modular process risk model (MPRM): A structured approach for food chain exposure assessment. pp. 99-136. In Schaffner, D. W. (ed.) Microbial Risk Analysis of Foods. ASM Press, Washington, D.C. Nauta, M., and B. Christensen. 2011. The impact of consumer phase models in microbial risk analysis. Risk Anal. 31:255-265. New Zealand Food Safety Authority (NZFSA). 2001. Microbial Pathogen Data Sheets. Available at http://www.foodsafety.govt.nz/science/other-documents/data-sheets/. Accessed June 8, 2011. Newsome, R., N. Tran, G. M. Paoli, L. A. Jaykus, B. Tompkin, M. Miliotis, T. Ruthman, E. Hartnett, F. F. Busta, B. Petersen, F. Shank, J. McEntire, J. Hotchkiss, M. Wagner, and D.W. Schaffner. 2009. Development of a risk-ranking framework to evaluate potential high-threat microorganisms, toxins, and chemicals in food. J. Food Sci. 74:R39-R45. Nightingale, K. K., R. A. Ivy, A. J. Ho, E. D. Fortes, B. L. Njaa, R. M. Peters, and M. Wiedmann. 2008. inlA premature stop codons are common among Listeria monocytogenes

134
isolated from foods and yield virulence-attenuated strains that confer protection against fully virulent strains. Appl. Environ. Microbiol. 74:6570-6583. Rydell, G. E., E. Kindberg, G. Larson, and L. Svensson. 2011. Susceptibility to winter vomiting disease: a sweet matter. Rev. Med. Virol. 21:370–382. Scallan, E., R. M. Hoekstra, F. J. Angulo, R.V. Tauxe, M.-A. Widdowson, S. L. Roy, J. L. Jones, and P. M. Griffin. 2011. Foodborne illness acquired in the United States – major pathogens. Emerg. Infect. Dis. 17:7-12.
Schaffner, D. W. 2010. Preliminary risk assessment for Salmonella in formulated dry foods. Poster Abstract M2-G.1. Society for Risk Analysis annual meeting. Salt Lake City. December 5-8. Schmidt, P. J., and M. B. Emelko. 2011. QMRA and decision-making: Are we handling measurement errors associated with pathogen concentration data correctly? Water Res. 45: 427-438. Scott, V. N., K. M. J. Swanson, T. A. Freier, W. P. Pruett, W. H. Sveum, P. A. Hall, L. A. Smoot, and D. G. Brown. 2005. Guidelines for conducting Listeria monocytogenes challenge testing of foods. Food Prot. Trends 25: 818-25. Smith, M. A., K. Takeuchi, G. Anderson, G. O. Ware, H. M. McClure, R. B. Raybourne, N. Mytle, and M. P. Doyle. 2008. Dose-response model for Listeria monocytogenes-induced stillbirths in non-human primates. Infect. Immun. 76:726-731. Smith, M. A., K. Takeuchi, R. E. Brackett, H. M. McClure, R. B. Raybourne, K. M. Williams, U. S. Babu, and G. O. Ware, J. R. Broderson, and M. P. Doyle. 2003. A nonhuman primate model for Listeria monocytogenes-induced stillbirths. Infect. Immun. 71:1574-1579. Teunis, P. F. M., F. Kasuga, A. Fazil, I. D. Ogden, O. Rotariu, and N. J. C. Strachan. 2010. Dose response modeling of Salmonella using outbreak data. Intl. J. Food Microbiol. doi:10.1016/j.ijfoodmicro.2010.09.026. Teunis, P. F. M., I. D. Ogden, and N. J. C. Strachan. 2008. Hierarchical dose response of E. coli O157:H7 from human outbreaks incorporating heterogeneity in exposure. Epidemiol. Infect. 136:761-770. U.S. Environmental Protection Agency (US EPA). 2010a. Workshop report: State-of-the-art science for the determination and application of dose-response relationships in microbial risk assessment. EPA/600/R-10/022, 2010. Available at http://www.epa.gov/nhsrc/pubs/600r10022.pdf . Accessed May 11, 2011. U.S. Environmental Protection Agency (US EPA). 2010b. Help System for BMDS Version 2.1.2. http://www.epa.gov/ncea/bmds/documentation/BMDS-users-manual-v2.pdf. Accessed May 16, 2011.

135
Van Stelten, A., J. M. Simpson, T. J. Ward, and K. K. Nightingale. 2010. Revelation by single-nucleotide polymorphism genotyping that mutations leading to a premature stop codon in inlA are common among Listeria monocytogenes isolates from ready-to-eat foods but not human listeriosis cases. Appl. Environ. Microbiol. 76:2783-2790. Van Stelten, A., J. M. Simpson, Y. Chen, V. N. Scott, R. C. Whiting, W. H. Ross, and K. K. Nightingale. 2011. Significant shift in median guinea pig infectious dose shown by an outbreak-associated Listeria monocytogenes epidemic clone strain and a strain carrying a premature stop codon mutation in inlA. Appl. Environ. Microbiol. 77:2479-2487. Ward, T. J., P. Evans, M. Wiedmann, T. Usgaard, S. E. Roof, S. G. Stroike, and K. Hise. 2010. Molecular and phenotypic characterization of Listeria monocytogenes from U.S. Department of Agriculture Food Safety and Inspection Service surveillance of ready-to-eat foods and processing facilities. J. Food Prot. 73:861-869. Williams, D., E. A. Irvin, R. A. Chmielewski, J. F. Frank, and M. A. Smith. 2007. Dose-response of Listeria monocytogenes after oral exposure in pregnant guinea pigs. J. Food Prot. 70:1122-1128.


