PEER-REVIEWED ARTICLE bioresources.com Yoshihara (2013). “Mode II K IIc value of MDF,” BioResources 8(2), 1771-1789. 1771 Mode II Critical Stress Intensity Factor of Medium- Density Fiberboard Measured by Asymmetric Four-Point Bending Tests and Analyses of Kink Crack Formation Hiroshi Yoshihara Using medium-density fiberboard specimens, asymmetric four-point bending tests were conducted to obtain the Mode II critical stress intensity factor for this in-plane system. Because the medium-density fiberboard is in-plane quasi-isotropic about its board plane, the crack propagates obliquely with respect to the initial crack direction under the asymmetric four-point loading condition. A finite element analysis is required to obtain the Mode II stress intensity factor. The analysis herein was conducted to take into account the kink crack formation. In addition, a three-point bend end-notched flexure test was also conducted, and the results obtained by the experiments and numerical calculations were compared. When the initial crack’s length-to-specimen’s depth ratio ranged from 0.85 to 0.95 and when the additional crack length was taken into account, the Mode II critical stress intensity factor KIIc was appropriately obtained by the asymmetric four-point bending test. Keywords: Medium-density fiberboard; Critical stress intensity factor; Asymmetric four-point bending test; Finite element analysis; Virtual crack closure technique; Kink crack Contact information: Faculty of Science and Engineering, Shimane University, Nishikawazu-cho 1060, Matsue Shimane 690-8504, Japan; [email protected]INTRODUCTION Medium-density fiberboard (MDF) is one of the principal wood products used for various construction projects; therefore, a better understanding of its mechanical properties, including its fracture mechanical properties, is required. The fracture mechanics of MDF has been considered in several previous studies (Niemz et al. 1997, 1999; Olbert and Schenck 1997; Suzuki and Matsushita 1998; Olbert 1999; Nairn 2009; Matsumoto and Nairn 2009; Yoshihara 2010). Nevertheless, most of these studies have been limited to the study of Mode I (crack opening mode) fracture mechanics. In contrast, there have been only a few studies that investigated Mode II (in- plane shear mode) fracture mechanics. An exception is a study by the author of the present study, in which the three-point bend end-notched flexure (3ENF) test for measuring the relationship between the propagation fracture toughness and the crack length (resistance curve; i.e., R-curve) was conducted (Yoshihara 2010). The 3ENF test is advantageous for measuring the Mode II fracture mechanics parameters because the fracture mechanics parameters can be obtained from beam theory, which is based on energy considerations and is mathematically well-defined (Adams et al. 2003). As shown in the previous study by the present author (Yoshihara 2010), it was difficult to conduct 3ENF for MDF without cutting grooves on the side surfaces to enhance crack propagation while preventing bending failure. Nevertheless, tests using a
Transcript
PEER-REVIEWED ARTICLE bioresources.com
Yoshihara (2013). “Mode II KIIc value of MDF,” BioResources 8(2), 1771-1789. 1771
Mode II Critical Stress Intensity Factor of Medium-Density Fiberboard Measured by Asymmetric Four-Point Bending Tests and Analyses of Kink Crack Formation
Hiroshi Yoshihara
Using medium-density fiberboard specimens, asymmetric four-point bending tests were conducted to obtain the Mode II critical stress intensity factor for this in-plane system. Because the medium-density fiberboard is in-plane quasi-isotropic about its board plane, the crack propagates obliquely with respect to the initial crack direction under the asymmetric four-point loading condition. A finite element analysis is required to obtain the Mode II stress intensity factor. The analysis herein was conducted to take into account the kink crack formation. In addition, a three-point bend end-notched flexure test was also conducted, and the results obtained by the experiments and numerical calculations were compared. When the initial crack’s length-to-specimen’s depth ratio ranged from 0.85 to 0.95 and when the additional crack length was taken into account, the Mode II critical stress intensity factor KIIc was appropriately obtained by the asymmetric four-point bending test.
Medium-density fiberboard (MDF) is one of the principal wood products used for
various construction projects; therefore, a better understanding of its mechanical
properties, including its fracture mechanical properties, is required.
The fracture mechanics of MDF has been considered in several previous studies
(Niemz et al. 1997, 1999; Olbert and Schenck 1997; Suzuki and Matsushita 1998; Olbert
1999; Nairn 2009; Matsumoto and Nairn 2009; Yoshihara 2010). Nevertheless, most of
these studies have been limited to the study of Mode I (crack opening mode) fracture
mechanics. In contrast, there have been only a few studies that investigated Mode II (in-
plane shear mode) fracture mechanics. An exception is a study by the author of the
present study, in which the three-point bend end-notched flexure (3ENF) test for
measuring the relationship between the propagation fracture toughness and the crack
length (resistance curve; i.e., R-curve) was conducted (Yoshihara 2010).
The 3ENF test is advantageous for measuring the Mode II fracture mechanics
parameters because the fracture mechanics parameters can be obtained from beam theory,
which is based on energy considerations and is mathematically well-defined (Adams et
al. 2003). As shown in the previous study by the present author (Yoshihara 2010), it was
difficult to conduct 3ENF for MDF without cutting grooves on the side surfaces to
enhance crack propagation while preventing bending failure. Nevertheless, tests using a
PEER-REVIEWED ARTICLE bioresources.com
Yoshihara (2013). “Mode II KIIc value of MDF,” BioResources 8(2), 1771-1789. 1772
side-grooved specimen have a drawback – the crack path deviates from the general
direction along which the crack should propagate.
In general, cracks contained in fibrous materials, such as wood, propagate along
the fiber direction; therefore, when the initial crack direction coincides with the fiber
direction, it is rather easy to analyze the fracture mechanics because of the coincidence of
these directions. In an in-plane quasi-isotropic system such as the board plane of MDF,
however, the cracks often propagate obliquely in the board plane under pure Mode II
loading conditions. This oblique propagation phenomenon is described below in detail.
Oblique propagation is related to kink formation; therefore, to analyze the Mode II
fracture mechanics of MDF, kink crack formation should be taken into account. The
asymmetric four-point bending (AFPB) test of a single-edge-notched (SEN) specimen,
the details of which are described below, can be conducted without cutting grooves on
the side surfaces, enabling the analysis of Mode II fracture mechanics while considering
the kink crack formation.
In the present study, AFPB tests were performed on MDF using SEN specimens
with various crack lengths. The crack geometry factor, which is required to calculate the
Mode II critical stress intensity factor KIIc, was obtained using finite element analyses
(FEAs), which included consideration of kink crack formation. In addition, 3ENF tests
were independently conducted. The Mode II fracture toughness, GIIc, obtained by the
3ENF test was transformed into KIIc. The validity of the AFPB test was examined by
comparing the results from experiments and numerical calculations.
Kink Crack Formation under the Asymmetric Four-Point Bending Test of Single-Edge-Notched Specimens Figure 1 presents a schematic diagram of the AFPB test of a SEN specimen. This
test has been originally developed for examining the fracture behaviors of isotropic
material under various mixed Mode I/II conditions (Suresh et al. 1990; Fett et al. 1995;
Li and Sakai 1996; He and Hutchinson 2000; Choi et al. 2003, 2005). When the location
of the crack is varied with respect to the center plane of the specimen, the mixed-mode
ratio can be controlled. As in this research, however, the pure Mode II condition is
expected when the crack is located at the center plane.
Fig. 1. A diagram of the asymmetric four-point bending (AFPB) test of a single-edge-notched bending (SENB) specimen
The specimen was eccentrically supported at two trisected points, and loads were
applied at the remaining two points. The crack length is defined as a, and the distance
between the left loading point and the right supporting point is defined as L. The
P
L 3
L 3
L 3
G
FB
C E
D
A
L
T
W
a
H
PEER-REVIEWED ARTICLE bioresources.com
Yoshihara (2013). “Mode II KIIc value of MDF,” BioResources 8(2), 1771-1789. 1773
directions parallel and perpendicular to the crack surface are defined as x and y,
respectively. This fracture test has been previously conducted to measure Mode II
fracture mechanics of ceramics (Suresh et al. 1990; Fett et al. 1995; Li and Sakai 1996;
He and Hutchinson 2000; Choi et al. 2003, 2005), and later it was applied to solid wood
(Yoshihara 2008, 2012) and composite materials with a glue line at the center (Krishnan
and Xu 2010).
The Mode II stress intensity factor KII is derived using the following equation
(Suresh et al. 1990; Fett et al. 1995; Li and Sakai 1996; He and Hutchinson 2000; Choi et
al. 2003, 2005),
(1)
where B and W are the beam width and depth, respectively, and f(a/W) is the crack
geometry factor. The term f(a/W) is usually determined by FEAs. The details of the
calculation of this last term are described below.
In an orthotropic material, such as wood, cracks usually propagate along the fiber
direction. When Mode II mechanics are the dominant condition, such as in isotropic
materials, the crack does not propagate straight from the crack tip. Rather, it propagates
obliquely with respect to the initial direction (Suresh et al. 1990; Fett et al. 1995; Li and
Sakai 1996; He and Hutchinson 2000; Choi et al. 2003, 2005). Several previous studies
suggested that the anisotropy of MDF sheets can arise because of the directionality that is
induced during the manufacturing process (Kitahara 1963; Kazemi Najafi et al. 2007). To
confirm the quasi-isotropy of the MDF sheet, off-axis specimens were therefore cut from
the sheet, and the Young’s modulus and shear modulus corresponding to the off-axis
angle were measured by a flexural vibration test, whereas the Poisson’s ratio was
measured by a tension test. Figure 2 shows the elastic constants corresponding to the off-
axis angle. From this figure, the elastic constants can be regarded as being independent of
the off-axis angle.
Fig. 2. Young’s modulus, shear modulus, and Poisson’s ratio corresponding to the off-axis angle of the MDF sheet. Unfilled circles and vertical bars represent the average and standard deviations, respectively.
Additionally, the GIc values obtained from this MDF panel were 1.60 0.27 and
1.78 0.34 J/m2 for the TL and LT systems, respectively, whereas the GIIc values of TL
and LT systems were 2.58 0.25 and 2.41 0.30 J/m2, respectively (Yoshihara 2010a).
Therefore, there were no significant differences between the fracture toughness values
0.8
1
1.2
1.4
1.6
0 15 30 45 60 75 90
Off axis angle (degrees)
Sh
ear
mo
du
lus
(G
Pa
)
0.3
0.35
0.4
0.45
0 15 30 45 60 75 90
Off axis angle (degrees)
Po
iss
on
's r
ati
o
2
2.5
3
3.5
4
0 15 30 45 60 75 90
Off axis angle (degrees)
Yo
un
g's
mo
du
lus
(G
Pa
)
PEER-REVIEWED ARTICLE bioresources.com
Yoshihara (2013). “Mode II KIIc value of MDF,” BioResources 8(2), 1771-1789. 1774
obtained from the different systems. From these results, the MDF sheet investigated in
this study can be regarded to be in-plane quasi-isotropic about its board plane.
Several studies have been conducted on kink crack formation in isotropic bodies
(Nuismer 1974; Bilby and Cardew 1975; Hayashi and Nemat-Nasser 1981; Kageyama
and Okamura 1982). Among them, Kageyama and Okamura (1982) proposed a criterion
for kink crack formation under a generalized Mode I and Mode II combined state. When
the directions parallel and perpendicular to the kink crack surface are defined as X and Y,
respectively, and the angle between the x- and X-directions is defined as as shown in
Fig. 3d, the Kageyama and Okamura’s criterion is derived as follows,
(2)
where Gtotal is the total strain energy release rate, KI and KII are the Mode I and Mode II
stress intensity factors before the occurrence of kink crack, respectively, which are each
defined according to the initial crack direction (xy coordinate system). The parameter E is
Young’s modulus under plane strain conditions. The parameters h1(), h12(), and h2()
are represented as follows,
(3)
where =/90 (degrees). The value of is defined as the angle that allows the maximum
value of Gtotal. Under the pure Mode II conditions, KI = 0, so Eq. (2) can be simplified as
follows:
(4)
Figure 4 shows the relationship between the parameter h2() and . When = 76°,
the value of h2() is at its maximum and derived as 1.52. Thus, Eq. (4) is:
(5)
As shown in Figs. 3(a)-(c), the crack propagated in a curve when it approached
the loading point. At the initiation of the crack propagation, the experimentally-obtained
value of was 75.6 ± 5.8°. In addition, the value of h2() did not vary significantly from
the = 76°. From these issues, it is concluded that the crack propagated under a rather
pure Mode II condition and that Eq. (5) is effective for analyzing the formation of kink
cracks in the AFPB test.
PEER-REVIEWED ARTICLE bioresources.com
Yoshihara (2013). “Mode II KIIc value of MDF,” BioResources 8(2), 1771-1789. 1775
Fig. 3. Kink crack formation under the asymmetric four-point bending (AFPB) test of a single-edge-notched bending (SENB) specimen of medium-density fiberboard (MDF). The angle
between the x and X axes, , is approximately 76 at the initiation of crack propagation. L and T represent the length and the width (transverse direction) of the MDF sheet, respectively.
Fig. 4. The relationship between the parameter h2() and the angle between the x- and X-axes,
Finite Element Analyses (FEA) Two-dimensional FEAs were conducted using the virtual crack closure technique
(VCCT). The FE program utilized was ANSYS 12. Figure 5 shows the FE model of a
representative specimen. The horizontal length of the model was 260 mm, and the model
depth W and model width B were 40 mm and 15 mm, respectively. The model consisted
of four-noded plane elements similar to previous studies by the author (Yoshihara 2010b,
c, 2012; Yoshihara and Satoh 2009; Yoshihara and Usuki 2011). Although the finite
element mesh was confirmed to be fine enough, further research should be undertaken on
PEER-REVIEWED ARTICLE bioresources.com
Yoshihara (2013). “Mode II KIIc value of MDF,” BioResources 8(2), 1771-1789. 1776
the model containing the special elements to simulate the crack tip singularity (Xie et al.
2004). The analysis was conducted under plane stress conditions.
Similar to the actual AFPB test, the vertical and horizontal directions of the model
were defined as the x- and y-directions so that the direction of the initial crack coincided
with the x-axis. The mesh size of the model was refined near the crack tip. As described
above, a kink crack was always induced in the AFPB test of MDF, as shown in Fig. 3. FE
models for the unkinked and kinked states were prepared based on the following “two-
step-analysis approach” (Xie et al. 2004). Figures 5(b) and (d) show the details of the FE
models in the unkinked state, whereas Figs. 5(c) and (e) show those in the kinked state.
For both models, the dimensions of the elements around the crack tip were 0.1 0.1
mm2. As described above, the crack under pure Mode II loading conditions initially
propagated in the direction inclined at 76° with respect to the initial crack direction;
therefore, the geometrical axis of the elements around the crack tip was inclined at 76°
with respect to the initial crack direction in the kinked state as shown in Figs. 5(b) and
(d). Similar to the actual AFPB test, the directions parallel and perpendicular to the kink
crack direction were also defined as the X and Y directions, respectively. The initial crack
length, a, varied from 28 to 38 mm at intervals of 2 mm; therefore, the crack length-to-
specimen’s depth ratio, a/W, varied from 0.7 to 0.95 in intervals of 0.05. The Young’s
modulus, E, and Poisson’s ratio, used in the present calculations were 3.2 GPa and
0.36, respectively; thus, the shear modulus, G (= E/(2 + 2)), used was 1.18 GPa. As
described above, the Young’s modulus and Poisson’s ratio values were determined from
the flexural vibration and tension tests, respectively. The model was supported in the
vertical direction at y = 90 and 250 mm at the bottom surface, and a vertical displacement
ux of 1 mm was applied to the nodes at y = 10 and 170 mm downward at the top surface.
Hence, the distance between the left supporting point and the right loading point L was
240 mm, giving L/W = 6 in this simulation.
Fig. 5. The finite element model used for the SEN-AFPB test analysis: (a) the overall mesh, (b) the detail of zone A in (a) at the unkinked state, (c) the detail of zone A in (a) at the kinked state, (d) the detail of zone B in (b), (e) the detail of zone C in (c), (f) the detail around the crack tip at the unkinked state, and (g) the detail around the crack tip at the kinked state. The angle between
the x- and X-axes is 76.
PEER-REVIEWED ARTICLE bioresources.com
Yoshihara (2013). “Mode II KIIc value of MDF,” BioResources 8(2), 1771-1789. 1777
The Mode I and Mode II strain energy release rates in the unkinked state, GI(1)
and
GII(1)
, respectively, were calculated using the following equation (Rybicki and Kanninen
1977),
(6)
where Fxj(1)
and Fyj(1)
are the nodal forces at the crack tip node j(1), which is shown as
Fig. 5(f), in the x and y directions, respectively. The xj(1)
and yj(1)
variables are the
relative displacements between the nodes i(1) and i’(1), respectively, which are located at
a distance of a mm behind the crack tip as shown in Fig. 5(f). These displacements are
calculated from the state before the kink crack propagation using the model represented
by Figs. 5(a), (b), and (d). The value of Gtotal(1)
is defined as follows:
(7)
From the values of GI(1)
/Gtotal(1)
and GII(1)
/Gtotal(1)
, the mixed-mode ratio before the kink
crack formation was evaluated.
There is a concern that the strain energy release rate produced by the kink crack
formation cannot be evaluated appropriately using Eq. (6), which is based on the
hypothesis that the crack propagates collinearly from the initial crack tip; therefore, the
post crack formation Mode I and Mode II strain energy release rate components, GI(2)
and
GII(2)
, were calculated based on the two-step-analysis approach (Xie et al. 2004). From
the results of unkinked and kinked models, the Mode I and Mode II strain energy release
rates in the kinked state, GI(2)
and GII(2)
, were obtained as follows (Xie et al. 2004),
(8)
where FXj(1)
and FYj(1)
are the nodal forces at the crack tip node j(1) in the X and Y
directions, respectively, which were calculated from the unkinked state using the model
represented by Figs. 4(a), (b), and (d). In contrast, xj(2)
and yj(2)
are the relative
displacements between nodes i(2) and i’(2) in the X and Y directions (Fig. 5(g)),
respectively, which were calculated from the kinked state using the model represented in
Figs. 5(a), (c), and (e). The total energy release rate for closing the kink crack Gtotal(2)
is
thus derived as follows:
(9)
PEER-REVIEWED ARTICLE bioresources.com
Yoshihara (2013). “Mode II KIIc value of MDF,” BioResources 8(2), 1771-1789. 1778
The value of Gtotal(2)
can be regarded as Gtotal in Eq. (5); therefore, the crack geometry
factor f(a/W) is derived from Eqs. (1), (2), (5), and (9), eliminating KII as follows:
(10)
By substituting the total load, P, applied to the FE model and the total energy release rate
Gtotal(2)
, which was calculated by inserting the VCCT into this equation, the value of
f(a/W) corresponding to the initial crack length-to-specimen’s depth ratio a/W was
obtained. In addition, the mixed-mode ratio after the kink crack formation was evaluated
using the values of GI(2)
/ Gtotal(2)
and GII(2)
/ Gtotal(2)
.
EXPERIMENTAL Materials An MDF sheet sized to 1820 x 910 x 15 mm
3 (length x width x thickness) was
used to obtain the test specimens for this study. The board was fabricated in a board mill
using softwood with a typical fiber length of 2 to 4 mm and urea-formaldehyde (UF)
resin. The resin content of the MDF sheet was 7%. It had a density of 0.58 0.01 g/cm3
and was stored in a room kept at 20ºC and 65% relative humidity before testing. The
moisture content in the air-dry condition was 10%. All of the specimens were cut from
this board.
Similar to the definitions in previous studies (Nairn 2009; Matsumoto and Nairn
2009), the directions along the length, width, and thickness of the board were defined as
the L, T, and Z directions, respectively, and an in-plane crack system (TL-system) was
examined. The first and second letters, T and L, represent the direction normal to the
crack surface and the direction along the crack length, respectively.
Asymmetric Four-Point Bending Test of a Single-Edge-Notched Specimen In the AFPB test of the SEN specimen, two types of specimens were used to
examine the scale effect on the value of KIIc. The larger specimens had dimensions of 40
260 15 mm3 in the x (L), y (T), and z directions of the MDF sheet, respectively, while
these dimensions were 20 130 15 mm3 for the smaller specimens; therefore, the
specimen depth, W, was 40 mm for the larger specimens and 20 mm for the smaller
specimens. A crack was produced in the mid-span. The crack was first cut with a band
saw (thickness of 1 mm) and then extended 1 mm ahead of the crack tip using a razor
blade. The extension of the crack was performed under a magnifying glass. The crack
length a varied from 28 to 38 mm at an interval of 2 mm in the larger specimens and
from 14 to 19 mm at an interval of 1 mm in the smaller specimens. Thus, the value of
a/W varied from 0.7 to 0.95 at an interval of 0.05. These conditions were similar to those
used in the FEA. In preliminary tests, failure by bending was often induced at points C or
F in Fig. 1 before crack propagation occurred when the value of a/W was less than 0.7.
The range of a/W was therefore determined as described above to induce crack
propagation before the occurrence of bending failure.
PEER-REVIEWED ARTICLE bioresources.com
Yoshihara (2013). “Mode II KIIc value of MDF,” BioResources 8(2), 1771-1789. 1779
In the 3ENF tests, the detail of which is described in a previous report (Yoshihara
2010a), grooves were cut along the neutral axis of both side surfaces to enhance the crack
propagation while preventing the specimen from bending failure. In the MDF sheet,
however, there is a density profile in the thickness direction, and the density at the region
close to its surface is usually larger than that close to the mid-thickness (Bodig and Jayne
1982; Schulte and Früwald 1996; Dunky and Niemz 2002). When the groove is inserted
on the surface of the specimen, the portion with a large density is cut away, so the KIIc
value of the side-grooved specimen may be different from that of the groove-free
specimen. To examine the influence of the grooves in the AFPB test, side-grooved
specimens were prepared using specimens with dimensions similar to those described
above. Grooves with a width of 1.5 mm and a depth of 6 mm were cut along the depth
direction at the mid-length in both side surfaces of the specimen, so the remaining
ligament thickness was 3 mm. The groove width and thickness were similar to those of
the 3ENF specimen, the detail of which is described below. Consequently, the following
four types of specimens were prepared: larger and groove-free, smaller and groove-free,
larger and grooved, and smaller and grooved.
As shown in Fig. 1, the specimens were asymmetrically supported and loaded.
The total span length L, which corresponds to the distance between the left supporting
point and the right loading point, was 240 and 120 mm in specimens A and B,
respectively. These values give an L/W ratio of 6. A steel platen was placed between the
specimen and the support to reduce indentation at the supporting point. The platen could
rotate around the supporting point without any indentations and did not interrupt
deformation of the specimen. Platens with lengths equal to 30 mm and 15 mm were used
for testing the larger and smaller specimens, respectively. Table 1 shows the crosshead
speed corresponding to the testing conditions. The load P was applied until the specimen
split into two pieces or the load decreased to the half of its maximum. The total testing
time was approximately 5 min each. Five specimens were used for each a/W ratio, so the
total specimen numbers were 120.
Table 1. The Crosshead Speed Corresponding to the Testing Conditions a/W
0.7 0.75 0.8 0.85 0.9 0.95
W = 40 mm Groove-free 0.6 0.5 0.4 0.3 0.2 0.1
W = 20 mm Groove-free 0.4 0.375 0.3 0.225 0.15 0.075
W = 40 mm Side-grooved 0.3 0.25 0.2 0.15 0.1 0.05
W = 20 mm Side-grooved 0.2 0.175 0.15 0.125 0.1 0.075
*unit: mm/min
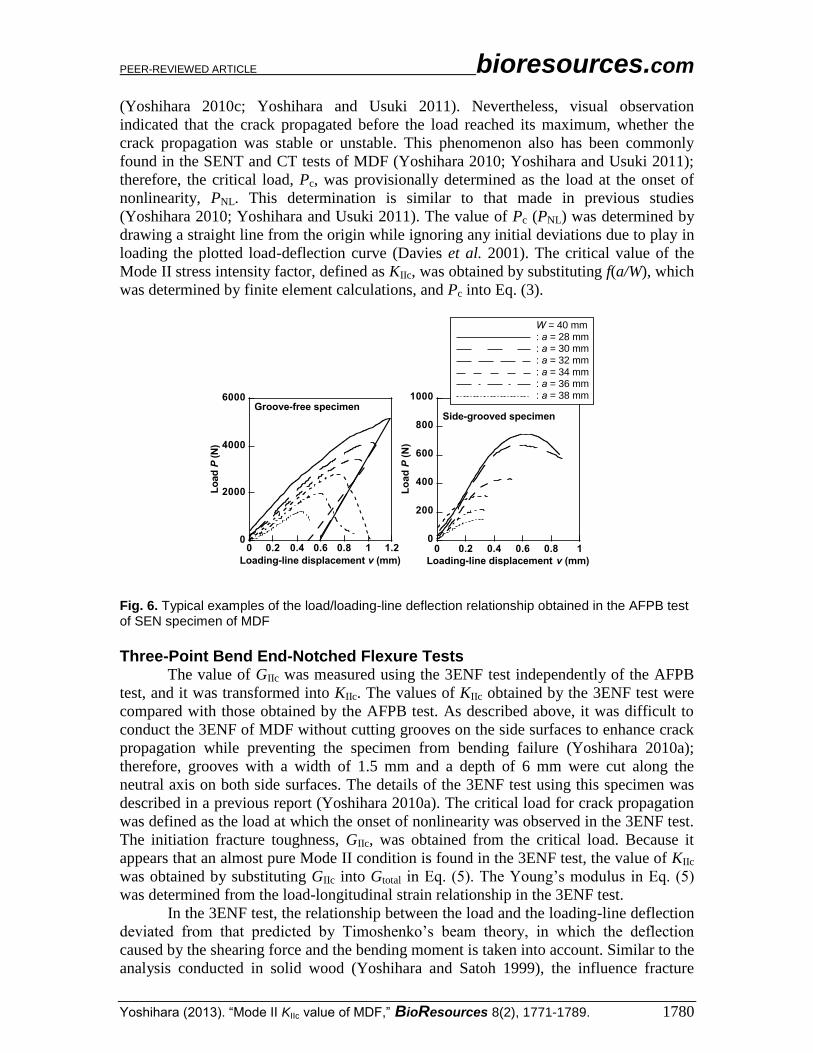
To eliminate the influence of indentation from the measurement of displacements
at the left and the right loading points, two linear variable differential transducers
(LVDTs) were set below points A and E, as seen in Fig. 1. The loading-line displacement
v was calculated by averaging the two LVDT readings. Figure 6 shows typical P-v
relationships obtained by the AFPB tests of groove-free and side-grooved specimens with
various initial crack lengths. As shown, the crack often propagates unstably when the
initial crack length is less than 0.8 times the depth of the specimen. Alternatively, the
crack propagates stably when the initial crack is longer than 0.85 times the depth. Similar
to the single-edge-notched tension (SENT) and the compact tension (CT) tests of MDF, it
was difficult to determine the critical load for crack propagation in the AFPB test
PEER-REVIEWED ARTICLE bioresources.com
Yoshihara (2013). “Mode II KIIc value of MDF,” BioResources 8(2), 1771-1789. 1780
(Yoshihara 2010c; Yoshihara and Usuki 2011). Nevertheless, visual observation
indicated that the crack propagated before the load reached its maximum, whether the
crack propagation was stable or unstable. This phenomenon also has been commonly
found in the SENT and CT tests of MDF (Yoshihara 2010; Yoshihara and Usuki 2011);
therefore, the critical load, Pc, was provisionally determined as the load at the onset of
nonlinearity, PNL. This determination is similar to that made in previous studies
(Yoshihara 2010; Yoshihara and Usuki 2011). The value of Pc (PNL) was determined by
drawing a straight line from the origin while ignoring any initial deviations due to play in
loading the plotted load-deflection curve (Davies et al. 2001). The critical value of the
Mode II stress intensity factor, defined as KIIc, was obtained by substituting f(a/W), which
was determined by finite element calculations, and Pc into Eq. (3).
Fig. 6. Typical examples of the load/loading-line deflection relationship obtained in the AFPB test of SEN specimen of MDF
Three-Point Bend End-Notched Flexure Tests The value of GIIc was measured using the 3ENF test independently of the AFPB
test, and it was transformed into KIIc. The values of KIIc obtained by the 3ENF test were
compared with those obtained by the AFPB test. As described above, it was difficult to
conduct the 3ENF of MDF without cutting grooves on the side surfaces to enhance crack
propagation while preventing the specimen from bending failure (Yoshihara 2010a);
therefore, grooves with a width of 1.5 mm and a depth of 6 mm were cut along the
neutral axis on both side surfaces. The details of the 3ENF test using this specimen was
described in a previous report (Yoshihara 2010a). The critical load for crack propagation
was defined as the load at which the onset of nonlinearity was observed in the 3ENF test.
The initiation fracture toughness, GIIc, was obtained from the critical load. Because it
appears that an almost pure Mode II condition is found in the 3ENF test, the value of KIIc
was obtained by substituting GIIc into Gtotal in Eq. (5). The Young’s modulus in Eq. (5)
was determined from the load-longitudinal strain relationship in the 3ENF test.
In the 3ENF test, the relationship between the load and the loading-line deflection
deviated from that predicted by Timoshenko’s beam theory, in which the deflection
caused by the shearing force and the bending moment is taken into account. Similar to the
analysis conducted in solid wood (Yoshihara and Satoh 1999), the influence fracture
0
200
400
600
800
1000
0 0.2 0.4 0.6 0.8 10
2000
4000
6000
0 0.2 0.4 0.6 0.8 1 1.2
Lo
ad
P (
N)
Loading-line displacement v (mm)
Groove-free specimenSide-grooved specimen
W = 40 mm : a = 28 mm : a = 30 mm : a = 32 mm : a = 34 mm : a = 36 mm : a = 38 mm
Lo
ad
P (
N)
Loading-line displacement v (mm)
PEER-REVIEWED ARTICLE bioresources.com
Yoshihara (2013). “Mode II KIIc value of MDF,” BioResources 8(2), 1771-1789. 1781
process zone (FPZ), the deformation caused by crack tip rotation, and the shear
deformation of the beam ahead of the crack tip was taken into account as the additional
crack length.
RESULTS AND DISCUSSION
Finite Element Analyses (FEA) Figure 7 shows comparisons of the mixed-mode ratios before and after the kink
crack formation obtained by the FEA, which were calculated from Eqs. (6) and (8),
respectively. At the state before the kink crack formation, the Mode II component
exceeds 99% of the total strain energy release rate; therefore, an almost pure Mode II
condition can be found in the AFPB test of MDF. In the state after the kink crack
formation, however, the Mode II component markedly decreases, and the Mode I
component exceeds 90% of the total strain energy release rate. This issue indicates that
the crack propagates under a Mode I dominant condition once the kink crack is initiated.
In a previous work, the 3ENF test of MDF was conducted using a side-grooved
specimen, and it was difficult to obtain the Mode II R-curve (Yoshihara 2010). The FEA
results indicate that it may be essentially impossible to obtain the R-curve of MDF under
a pure Mode II condition.
Fig. 7. The mixed-mode ratio before and after the kink crack formation obtained by the FEA
In studies by Fett et al. (1995) and He and Hutchinson (2000), the relationship
between f(a/W) and a/W was derived as follows:
Fett et al.:
(11)
He and Hutchinson:
PEER-REVIEWED ARTICLE bioresources.com
Yoshihara (2013). “Mode II KIIc value of MDF,” BioResources 8(2), 1771-1789. 1782
(12)
In the present study, the relationship between f(a/W) and a/W obtained by the FEA was
regressed into a 3rd
-order polynomial equation because it could be approximated better
with a linear or 4th
order polynomial functions (Yoshihara 2012). The obtained equation
is:
(13)
Figure 8 shows the relationships between the crack geometry factor f(a/W) and the
crack length-to-specimen’s depth ratio a/W obtained by the FEAs and compares it with
the relationships derived in the previous studies. As described earlier, the kink crack
formation was not taken into account in the analyses of the quoted authors. The FEA
results that consider kink crack formation coincide well with the analyses of the quoted
authors as well as those conducted in this study, except for the f(a/W) value derived by
Eq. (11) at a/W of 0.95. Although the equations proposed by the quoted authors derive
the proper relationship between f(a/W) and a/W, Eq. (13) is used for the analysis of
fracture mechanics of MDF obtained by the actual AFPB test because it is appropriate to
use results obtained while considering the kink crack formation. The mesh used in this
study was confirmed to be fine enough that the crack geometry factor was not dependent
on the mesh size.
Fig. 8. The relationships between the crack geometry factor f(a/W) and the initial crack length-to specimen’s depth ratio a/W obtained by the virtual crack closure technique (VCCT) and the equations derived by Fett et al. (1995), He and Hutchinson (2000), and the regression of Eq (13).
PEER-REVIEWED ARTICLE bioresources.com
Yoshihara (2013). “Mode II KIIc value of MDF,” BioResources 8(2), 1771-1789. 1783
Asymmetric Four-Point Bending Test of Single-Edge-Notched Specimen Based on the results of the FEA, KIIc is derived from Eqs. (1) and (13) as follows:
(14)
Figure 9 shows the KIIc-a/W relationships obtained by the AFPB and 3ENF tests.
When applying Eq. (14) to the results of the AFPB test, the values of KIIc obtained using
the specimen with a depth value, W, of 40 mm are significantly larger than those obtained
by specimens with a W value of 20 mm. This tendency is common for both results
obtained from the groove-free and side-grooved specimens. Interestingly, the dependence
of KIIc on a/W is not significant in the results obtained using the groove-free specimens,
whereas the KIIc value decreases as the a/W increases in the results obtained from the
side-grooved specimens. The KIIc value obtained from the groove-free specimen is larger
than that obtained from the side-grooved specimen for the same a/W value. As described
earlier, a density profile usually exists in MDF about its thickness, so the region with a
higher density is removed when cutting a groove on the side surface of MDF (Bodig and
Jayne 1982; Schulte and Früwald 1996; Dunky and Niemz 2002). The KIIc value obtained
from the side-grooved specimen is, therefore, smaller than that of the groove-free
specimen.
Fig. 9. The comparison of the KIIc-a/W relationships obtained by the asymmetric four-point bending (AFPB) test of a single-edge-notched (SEN) specimen and a three-point bend end-
notched flexure (3ENF) test. The additional crack lengths, each defined as used in Eq. (16) were found to be 3.7 and 3.4 mm for specimens with depths of 40 and 20 mm, respectively.
PEER-REVIEWED ARTICLE bioresources.com
Yoshihara (2013). “Mode II KIIc value of MDF,” BioResources 8(2), 1771-1789. 1784
When comparing the KIIc values obtained from the AFPB tests using the groove-
free and side-grooved specimens and the 3ENF tests using the side-grooved specimens,
the KIIc value obtained from the AFPB tests was definitively smaller than that obtained
from the 3ENF tests. According to previous studies on the Mode I tests of solid wood and
MDF and the Mode II test of solid wood, a cracked specimen often behaves as if the
crack were longer than the actual length because of deformation around the crack tip,
deflection caused by the shearing force, and development of a fracture process zone
(FPZ) at the crack tip (Irwin 1961; Bažant and Kazemi 1990; Bao and Suo 1992; Ehart et
and Smith 2002, 2003; Vasic et al. 2002; Anderson 2005; de Moura et al. 2006, 2008,
2010; Silva et al. 2006; Yoshihara and Satoh 2009; Dourado et al. 2010; Susanti et al.
2010, 2011; Yoshihara 2010, 2012; Nakao et al. 2012). In these studies, the crack
propagated straight from the crack tip. In contrast, Bažant and Pfeiffer (1986) suggest
that the concept of a FPZ is also applicable for the asymmetric four-point loading of
concrete where the kink crack is produced; therefore, it may be feasible that the cracked
AFPB specimens of MDF also behave as if the crack were longer than the actual length.
Further research must be conducted to determine whether this concept is applicable for
the loading condition where the kink crack is produced. Similar to the approach adopted
in previous studies (Yoshihara 2010, 2012; Yoshihara and Usuki 2011; Susanti et al.
2010, 2011; Nakao et al. 2012), the relationship between KIIc and a is represented by
introducing an additional crack length, into Eq. (1), as follows:
(15)
Therefore, Eq. (14) is modified as follows:
(16)
The appropriate value of the additional crack length is determined by the
following procedure, which is similar to that adopted in previous works (Yoshihara
2010b, c; 2012; Yoshihara and Usuki 2011): (1) for various values of , calculate the
probability value (p-value) for the average values of KIIc obtained by the AFPB test
corresponding to each a/W and 3ENF test by conducting Student’s t-test and (2) sum the
p-values corresponding to each . For large p-values, the average values of KIIc obtained
by the AFPB and the 3ENF tests can be regarded as close to one another. With this
procedure, it was determined that the additional crack lengths, are 3.7 and 3.4 mm for
the groove-free specimens with the larger and smaller sizes, respectively, and 6.0 and 4.1
mm for the side-grooved specimen with the larger and smaller sizes, respectively. Figure
8 also shows the values of KIIc calculated using Eq. (16); these values are close to those
obtained from the 3ENF tests. A statistical analysis of the difference between the KIIc
PEER-REVIEWED ARTICLE bioresources.com
Yoshihara (2013). “Mode II KIIc value of MDF,” BioResources 8(2), 1771-1789. 1785
values obtained using the AFPB and the 3ENF tests shows that the difference is not
significant in the a/W range from 0.85 to 0.95. When the crack length is short, however,
the load for inducing material nonlinearity may be smaller than that for inducing the
crack propagation; therefore, when a/W is smaller than 0.8, the onset of nonlinearity is
not due to propagation of the crack but rather due to the initiation of material
nonlinearity.
Table 2 shows the Mode I and Mode II fracture toughness and critical stress
intensity factor values obtained in a previous study (Yoshihara 2010a) and in the present
study. Under pure Mode I conditions, KII = 0 and h1() = 1 because the crack propagates
straight and forward ahead of the crack tip ( = 0), so Eq. (2) is simplified as follows:
(17)
Similar to solid wood, the GIIc value of MDF is significantly larger than the GIc value.
Because of the difference between the crack paths under the Mode I and Mode II
conditions, however, the Mode I and Mode II critical stress intensity factors are derived
by Eqs. (17) and (5), respectively. As shown in Table 2, the difference between the KIc
and KIIc values tends to be smaller than that between the GIc and GIIc values.
Table 2. The Mode I and Mode II Fracture Toughness and Critical Stress Intensity Factors of MDF Obtained in the Present Study and a Previous Study (Yoshihara 2010a)


![The starred publications are in Peer-reviewed Congress ... · The starred publications are in Peer-reviewed Congress Proceedings, the others are in Peer- Reviewed Journals 2018 [178]](https://static.documents.pub/doc/80x56/5ead514d568d9a70b57151ef/the-starred-publications-are-in-peer-reviewed-congress-the-starred-publications.jpg)


