79
Peer-to-Peer Distributed Ledger Technology Assessment Virtual peer-to-peer energy trading using distributed ledger technology: comprehensive project assessment report
Peer-to-Peer Distributed Ledger Technology Assessment Virtual peer-to-peer energy trading using distributed ledger technology: comprehensive project assessment report

171003 Final Report-MHC-AGL-IBM P2P DLT Report (002).docx _3.10.2017 1
AGL Energy Limited
ABN: 74 115 061 375
Level 24, 200 George St
Sydney NSW 2000
Locked Bag 1837
St Leonards NSW 2065
t: 02 9921 2999
f: 02 9921 2552
agl.com.au

3
Table of Contents
Project Executive Summary .................................................................................................................... 6
MHC Stage 1 Report ............................................................................................................................. 11
1 Summary: Stage 1 .................................................................................................................... 12
2 Project Hypothesis ................................................................................................................... 14
3 Introduction ............................................................................................................................... 15
4 Methodology ............................................................................................................................. 17
5 Model ........................................................................................................................................ 20
6 Scenarios and Analysis ............................................................................................................ 23
7 Distributed Ledger Technology ................................................................................................ 31
8 Conclusions and Observations ................................................................................................ 33
9 Stage 1 Appendices ................................................................................................................. 36
IBM Stage 2 Report ............................................................................................................................... 41
1 Summary: Stage 2 .................................................................................................................... 42
2 Review of Distributed Ledger Technology ............................................................................... 44
4
3 Background .............................................................................................................................. 50
4 Review of P2P Renewable Energy Trading Market Structure ................................................. 51
5 Suitability of Distributed Ledger Technology for P2P Renewable Energy Trading .................. 58
6 Considerations and Recommendations for Building a DLT-Based P2P Energy Trading Platform ................................................................................................................................................. 61
7 Stage 2 Conclusions ................................................................................................................ 69
8 Appendix 1: Reference Data for Distributed Ledger ................................................................ 70
9 Project Conclusions – Stage 1 and Stage 2 ............................................................................ 72
Sources .................................................................................................................................... 76

5
6
Project Executive Summary
Consumers are becoming increasingly active participants in the Australian energy market, exerting
greater control over their energy supply arrangements than ever before. Testament to this is that
Australia has the highest proportion of ‘Prosumers’ in the world with over 1.6 million PV installations, a
combined capacity of over 5.7GW and a monthly output of approximately 600GWh1. To realise the full
potential of distributed energy resources (DER), including solar PV, smart inverters, energy storage,
electric vehicles and controllable loads, it is proposed that market(s) be established for available
energy where its value can be measured, communicated and transacted in the most efficient way
possible. Several innovative approaches are being trialled around the world to satisfy the strong
interest of prosumers and consumers in distributed energy.
Peer-to-peer (P2P) trading is one such approach which allows grid-connected parties – in this study,
households, to trade electricity. This is most likely to either occur directly, i.e. between two market
participants who form a short-term contract, or indirectly between two participants who remain
anonymous to one another and trade across a secure, auditable marketplace.
Residential P2P energy trading would involve large numbers of transactions between prosumers and
consumers, requiring methods for low-cost authentication, validation, and settlement, while protecting
consumer data privacy. One emerging approach to sharing transaction data between market
participants is using distributed ledger technology (DLT). Incumbent and start-up entities in many
global markets are testing new P2P business models, some underpinned by such DLT (or blockchain)
applications. However, there are relatively few studies to date that have assessed the viability of DLT
for P2P energy trading, particularly in Australia.
The project participants have a keen interest in exploring the potential for innovative technologies to
enable a P2P market which responds to consumer expectations for a more personalised energy
experience, assists customers in gaining greater control over their energy supply and derives more
value for customers out of their distributed energy investments.
The project’s hypothesis was “that operational data from an existing residential market deployment of
DER can be used to gain a deeper understanding of the value of P2P trading for customers, the
applicability of distributed ledger technology to a P2P market place and the impacts that this new
market might have on existing markets and market actors.”
In this vein, Stage 1 of this project sought to use historical consumption and production data to gain a
deeper understanding of the potential value of P2P trading for customers and market participants,
while Stage 2 reviewed the applicability of distributed ledger technology to the P2P market place
considered for Stage 1. This report concludes with a summary of both Stages and observations on
the impact on customers, role of markets, space for technology and need for effective, forward-
thinking policy and regulation.
Stage 1: Virtual P2P Trading Model Report
In Stage 1, Marchment Hill Consulting (MHC) explored the value of P2P power trading using
distributed renewable energy generation. The underlying driver for P2P trading is that customers
1 http://pv-map.apvi.org.au/analyses
7
prefer to support locally supplied renewable energy that has lower emissions than centralised thermal
generation, and that the costs of transmission and distribution can be reduced, with the savings
shared through such an approach.
MHC concluded that a valid P2P trade could be identified when demand existed for energy exported
by a prosumer in the physical electricity system. This trade would be transacted automatically and
both consumer and prosumer would be better off for having used the P2P, rather than buying/selling
from their Retailer, respectively. Peers will trade PV output against demand, with prosumers being
paid slightly more than market feed in tariff rates to supply their local market.
It appears most likely that P2P trades will initially occur between solar PV and battery owners and
individual consumers without these assets, using market meters which provide the standardised and
auditable reference point for transactions. Over time, with developments in intelligent technology, and
as confidence in a local market grows, it is envisaged that the trading ‘level’ might devolve further to
individual devices within and across homes, as a customer’s EV or other specific loads ‘bid’ against
the peers for DER output2.
MHC modelled three hypothetical scenarios, examining the impact of modifications to network prices,
changes to customer load profiles and changing in the competitive landscape on the potential for a
P2P market to develop. The scenarios modelled generated specific insights, including:
• Network prices that vary based on the location and time of the generation can enable
P2P product offerings and a P2P market. Network usage charges are currently only levied
on consumers (not producers) of electricity and there is no distinction made based on the
centralised or decentralised source of the electricity, regardless of the consumer’s proximity to
the source of generation.
• Using storage and intelligent energy management systems to shift load to match
consumption to local DER generation has the potential to unlock more significant P2P
market value. While technically challenging, shifting load to such a degree that all PV
production exported can be sold in the P2P market increases the count of P2P trades
significantly and has the potential to deliver benefits to networks and wholesale market
participants through improving system utilisation and flattening the system load profile.
• A new entrant, low-cost provider for P2P market administration delivers the greatest
savings to P2P customers. Specifically, the model reveals that the entry of a new market
administrator, assumedly supported by or under the auspices of a current licensed retailer3
delivers the most significant increase in prosumers’ income and reduction in consumer bills.
The modelling exercise also raised some notable observations:
• If P2P trading is limited to pure economic drivers, under existing rules, the P2P market can only
be brought to life by an existing or new market participant (retailer or network) reducing their
cost to serve for P2P customers, thus creating the basis for reduced P2P customer prices
relative to existing prices.
• Individual consumer preferences are likely to drive further value over and above the pure
economic value of this P2P market. In the same way some customers choose to pay more for
green power, customers may also derive additional non-economic value from locally-generated
2 The data used for this project did not allow for the evaluation of this future state. Similarly, a full transactive energy market could also see bids and offers from grid operators seeking locational capital or operating efficiencies and retailers seeking wholesale market advantage.
3 I.e. the retailer is assumed to continue to act as the FRMP, but has an interest in peer to peer trading.
8
energy, energy they recognise as being provided by family or friends, or from supporting the
community by engaging in the P2P market.
Stage 2: Applicability of DLT: Technical Assessment Report
In Stage 2, IBM used the Stage 1 model outputs to review whether distributed ledger technologies
could be used to enable P2P trading of distributed renewable energy between customers or their
agents; and particularly what the advantages or disadvantages of DLT would be against traditional
systems.
DLT(s) appealing in such applications is the fact that they are tamper-resistant, redundant, and
verifiable systems of records that do not require a central entity to store and manage shared data and
business processes. Moreover, they allow for the definition of smart contracts, which is the design
abstraction used to implement the policies defining the behaviour of business networks at the platform
level.
The DLT offers most value where transactions involve trust boundaries between entities, concerns
about security, the need for reconciliation of views, auditability, immutability of records, and existence
of governing policies. In short, DLT provides real value in scenarios where multiple organisations
have a stake in shared data and processes for which accountability and reconciliation matter.
IBM concluded that in the P2P context, the distributed ledger framework offers most value under
modelling scenarios 1 and 3 which involve a different regulatory framework. Specifically, a model in
which P2P trading extends to multiple retailers and may require changes to network pricing and/or to
existing market settlement processes.
IBM also outlined some of the key considerations for using a DLT application for P2P trading. In
particular, that DLTs are not currently suitable for high-frequency and very high-volume transactions.
While it could be of intuitive interest to store all prosumers and consumer transactions in the ledger,
the volume and frequency of such data would make this difficult and costly to maintain effectively in a
full-scale market.
IBM performed a preliminary analysis of the specific data and business processes that would need to
be managed by a DLT under the scenarios modelled by MHC. IBM assessed whether the current
capabilities of DLT(s) could support the performance requirements of these processes. Overall, a
strong case can be made for using DLT(s) to support and enable future P2P renewable energy
trading markets; particularly if the DLT were configured to record:
1. trading instructions and parameters provided by prosumers and consumers, and
2. the history of net P2P trading positions between retailers for the aggregated volume of P2P trades
undertaken by their contracted consumers and prosumers.
This design has the additional benefit of putting clear boundaries between the roles and functions of
DLT(s) and existing systems.
IBM conclude that careful design of the overall system architecture is required to ensure that the
Distributed Ledger Technologies do bring benefit to supported business networks.
Summary
1. Customers are driving the development of P2P energy models in Australia and elsewhere;
preferring to be active energy market participants and exert greater control over their DER
9
investments. This is changing how customers consider and use the grid. Given Australia’s world-
leading deployment of DER, the grid and our market model need to evolve to enable 2-way
energy flows to facilitate exports as much as the imports of electricity they were designed for.
2. Stage 1 demonstrated that P2P energy trading – under specific market conditions – provides
financial benefits to both consumers and prosumers. Additionally, P2P trading provides one of a
number of potential new revenue streams for Prosumers, which improves the payback on their
DER investments.
3. Stage 2 demonstrated that DLT, capturing particularly the trading instructions established by
market participants, plus the history of net P2P trading positions for the aggregated volume of
P2P trades, can support a P2P energy trading market and offer real process and security
benefits.
4. Pricing structures should evolve to reflect that the grid is now a two-way energy platform. Network
pricing has historically been static, and not considered the consumer’s proximity to generation
sources. It also creates no financial incentive for prosumers to supply local markets or for
consumers to match their demand to DER output. Policies and pricing should reflect the value
DER brings to system optimisation for both networks and retailers.
5. Market reform that engenders consumer choice, drives innovation, and promotes technology
neutrality and a level playing field would be welcome. Consumers should have incentives to use
their DER investments for systemic and societal benefit. Reform could also consider a focus on
the future development of competitive, efficient and equitable markets that deliver customer direct
customer benefits for DER.
Next Steps & Areas for Further Research
The project participants identified significant areas of interest for further research, including:
1. Extending the current P2P trading model to:
• Include a more diverse range of customers and longer ranges of historical load data;
simulating different customer preferences to further explore enabling features of P2P market;
• Assess appropriate pricing of access to the grid (and network cost recovery) in a future with
high penetrations of DER; and
• Create specific customer behaviours to try to create bespoke elasticities of demand and
supply that better assess their appetite to participate in a P2P market
2. Assess the cost and benefits of implementing DLT in more detail to better judge whether the
investment is viable within the context of a P2P energy trading market, relative to the traditional
IT systems used in the market.
3. Extend the virtual model to a real-world trial with a larger sample size to assess the revenue and
cost impacts for different stakeholders. This trial could explore the opportunity for cost-reflective
tariffs in enabling the growth of P2P markets by offering cost-reflective charges for local peer to
peer trades or investigating other opportunities for equitable network tariff reform. Although this
concept has been proposed before (for example, the recently declined rule change request
relating to Local Generation Network Credits) there could be opportunity for a network service
provider to trial this approach within a defined area through funding from the Demand
Management Incentive Scheme, or Demand Management Innovation Allowance (details of which
are currently being determined by the AER). Trialling these arrangements in a confined area are
would allow for practical assessment of the up-take and impact of P2P markets and stimulate
innovation in products and services and provide a more comprehensive evidence base to support

10
potential regulatory changes. This approach is also in line with recommendations 2.8 and 2.9 in
the recently released Independent Review into the Future Security of the National Electricity
Market to allow for proof-of-concept trials of new approaches and technologies 4 . Such
arrangement could also allow the network service providers to understand how they might
approach network pricing to support customers desires for innovative products, while ensuring
these do not aversively impact other customers through cross subsidisation
4. Use the outcomes of the real-world trial to support policy makers and regulators with specific
recommendations on how to make informed, proactive decisions about enabling peer-to-peer
markets.
4 Independent Review into the Future Security of the National Electricity Market, p66

11
MHC Stage 1 Report
12
1 Summary: Stage 1
The objective of this project was to use historical consumption and production data to gain a deeper
understanding of the potential value of P2P trading for customers and market participants, and the
applicability of distributed ledger technology to a peer-to-peer market place.
The data sample used consists of 85 de-identified consumer accounts and 27 de-identified prosumer
accounts in suburban Melbourne, Victoria. A summer weekday with a standard load profile was
selected as a representative day. On this day, the aggregate electricity bill for the consumers’ 897.51
kWh was $319.68 at their current tariff rates and in aggregate prosumers earned $11.39 for their
228.36 kWh at current Victorian feed in tariffs. This forms the baseline scenario for this analysis, with
impacts to market participants in alternative scenarios assessed relative to this baseline.
The sample selected deliberately ensured total sample solar PV supply exceeded the sample’s
collective demand for a few hours in the middle of the day, simulating a future, but not unreasonable,
penetration of solar PV owners.
Three hypothetical scenarios were modelled, examining the impact of modifications to network
charges, or changes to customer load profiles, on the potential for a P2P market to develop. In all
cases the modelled changes to costs and charges are illustrative only, based on a conceptual cost
stack, and not based on any analysis of the actual cost impacts from the implementation of a P2P
marketplace facilitated by distributed ledger technology.
Based on the analysis undertaken to date, the scenarios generate specific insights, including:
• Pricing access to the grid may need to evolve to ensure it is efficient and equitable in a high
DER environment. Currently network charges are only levied on consumers (not producers) of
electricity and there is no distinction made based on the assumed source of the electricity
(centralised or local/distributed). By providing the distribution network with visibility over trades
of local generation, distributed ledger technology may technically enable network charging to
vary based on the source of the generation. Scenario 1 explores the impact on P2P trading of a
reduction in transmission network charges for locally traded electricity. By revising transmission
charges in the conceptual cost stack5, network revenues fell 9% relative to the baseline
scenario - but prosumers received an additional 66% payment for their PV output, and
consumers’ bills fell 2%. As the modelling demonstrates, the viability of certain new products
and markets, like P2P, are highly dependent on the underpinning network pricing framework.
• Using storage and intelligent energy management systems to shift load has the potential to
unlock more significant P2P market value. Scenario 2 assumes consumer peak demand shifts
six hours earlier, to coincide with peak solar output. Retailers’ revenues were held constant
while network revenues were reduced as a proxy for the localised system benefits of P2P
trading, as in Scenario 1. This scenario increases prosumers revenues by 84% while
consumers share a 3% reduction in their bills compared to the baseline scenario. While
challenging to administer at this scale, shifting load such that all PV production exported can be
sold in the P2P market also increases the total number of P2P trades by 8% compared to
Scenario 1. However, to contextualise these results, it is notable that customer take-up of time-
of-use and demand based tariffs has been low to date indicating a reluctance for customers to
5 TUOS charges are based on United Energy’s published breakdown of network charges presented in Section 6.2 of this report.
13
shift load out of peak periods. Accordingly, the findings of potential savings here are optimistic,
but useful for demonstration purposes.
• Scenario 3 reverts to the BAU load profile, but introduces a new, very low-cost provider for P2P
market administration while holding network revenues constant. Under this scenario, the total
value of all trades in the P2P market is as much as 12.4% of BAU market value. Prosumers
share a 45% increase in their earnings, while consumers share a 2% reduction in their bills.
The retailer earns 12% less than they did under the baseline scenario.
The modelling exercise also raised some notable observations:
• P2P trading which does not change customer load does not appear to create additional
economic value where an assumed reduction in retail and network charges is not achieved
through at least a commensurate reduction in costs achieved through DLT or a P2P market. In
this case value is only shifted between existing market participants. Therefore, under the
current rules an economically-driven P2P market is only brought to life by one participant
reducing their cost to serve so that there is a basis for reduced charges.
• Individual elasticities of demand and supply for each consumer are likely to deliver further
benefits over and above the pure economic value of this P2P market. For example, some
residential customers already pay a price premium for green power. More broadly, customers
may also derive additional non-economic value from their preference for locally-generated
energy, directed trades with a named counterparty, or from supporting the community by
engaging in the P2P market. This presents additional opportunities for the P2P market to
develop, which have not been included in the current model.
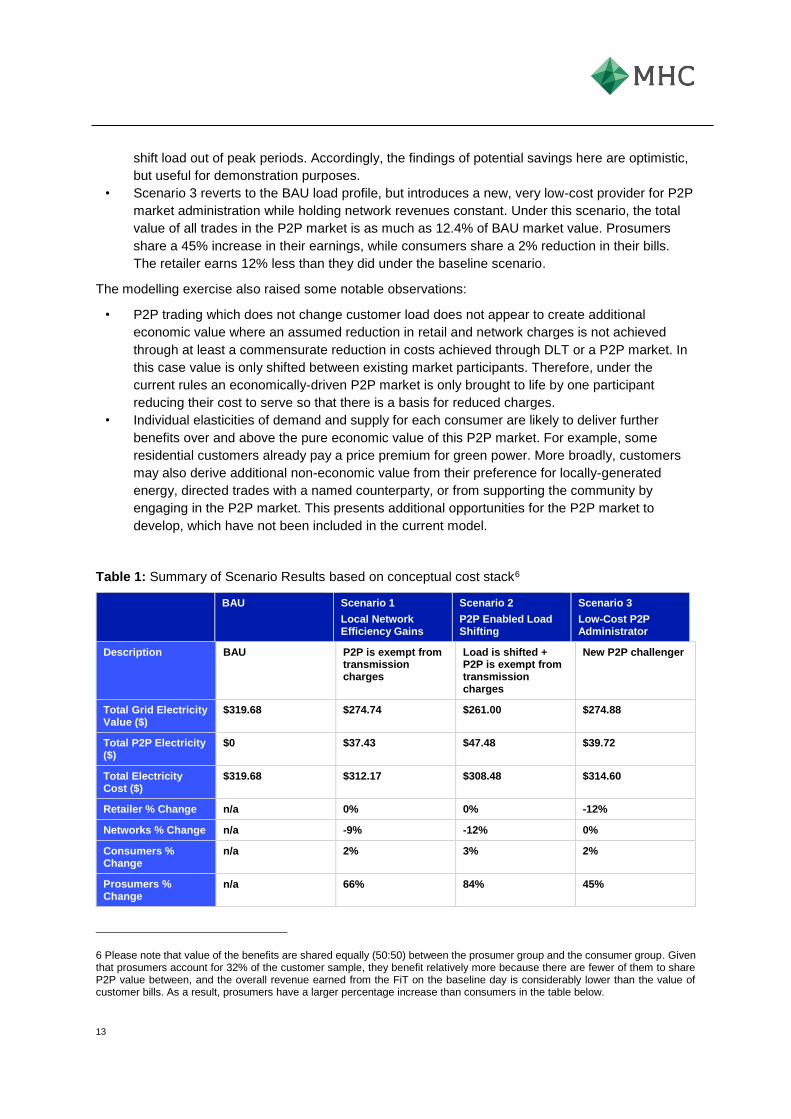
Table 1: Summary of Scenario Results based on conceptual cost stack6
BAU Scenario 1
Local Network Efficiency Gains
Scenario 2
P2P Enabled Load Shifting
Scenario 3
Low-Cost P2P Administrator
Description BAU P2P is exempt from transmission charges
Load is shifted + P2P is exempt from transmission charges
New P2P challenger
Total Grid Electricity Value ($)
$319.68 $274.74 $261.00 $274.88
Total P2P Electricity ($)
$0 $37.43 $47.48 $39.72
Total Electricity Cost ($)
$319.68 $312.17 $308.48 $314.60
Retailer % Change n/a 0% 0% -12%
Networks % Change n/a -9% -12% 0%
Consumers % Change
n/a 2% 3% 2%
Prosumers % Change
n/a 66% 84% 45%
6 Please note that value of the benefits are shared equally (50:50) between the prosumer group and the consumer group. Given that prosumers account for 32% of the customer sample, they benefit relatively more because there are fewer of them to share P2P value between, and the overall revenue earned from the FiT on the baseline day is considerably lower than the value of customer bills. As a result, prosumers have a larger percentage increase than consumers in the table below.

14
2 Project Hypothesis
The champions of transactive energy7 envision allowing customers with distributed energy resource
(or DERs) to trade power and grid services with other energy users and their utilities in real time.
In addition to satisfying customer preferences for low-emissions and locally produced generation, the
capability to match local production to consumption may allow utilities to leverage customer-sited
resources to unlock system-wide benefits (such as the reduced need for additional network
infrastructure or the operation of centralised generation).
This Stage 1 project report and the underlying model seek to answer high-level questions:
• What peer-to-peer trades could occur between customers in a community with DER, and at
what level can trades occur?
• What are the peers trading?
• What rules would identify a valid P2P trade?
• What is the customer value created by the trades in different scenarios and under what market
conditions is this value unlocked?
• What is the volume of trades anticipated under a range of scenarios?
• What are the financial impacts for incumbents?
7 “A set of economic and control mechanisms that allows the dynamic balance of supply and demand across the entire electrical infrastructure using value as a key operational parameter.” - GridWise Architecture Council Framework
15
3 Introduction
The Australian power sector is in a period of transition to a mix of renewable and non-renewable
resources that transmit electricity via an ‘intelligent’ electricity grid enabled by digital technologies –
which also influences and can even directly manage consumers’ loads per their preferences and/or
commercial signals.
In short, the existing grid of large-scale, centralised generation is rapidly being supplemented by a
complex web of interconnected, variable renewable generation sources.
More and more households are becoming energy “prosumers”, meaning they are both consuming and
producing energy. Australia hosts 1.6 million solar PV micro-generators in homes all over the country
– as well as significant numbers of larger-scale wind and solar installations - and PV prices continue
to fall. In 2015, solar panels were already around 20% cheaper than had been forecast in 2013, and
are expected to fall by another third in the coming decade8.
Battery storage, another DER, is currently relatively more expensive, but prices are expected to fall by
two-thirds over the coming decade9. In parallel, residential power bills are rising. This has been a
function of increased network investment, plus recent increases in wholesale electricity prices. This is
likely to continue: the Australian Energy Market Commission expects residential bills to rise by an
average of $78 by 2018 in the NEM-connected states.
In parallel, society has become accustomed to the sharing economy. Uber, Airbnb and many other
decentralised asset-sharing initiatives have become household names. A P2P market offers
participants the opportunity to support their local communities, and potentially earn more for their
solar generation or buy locally produced renewable energy for less than conventional energy. A P2P
market enables access to the benefits of DER to those living in rented accommodation without rooftop
spaces to site PV, or perhaps not able to access the necessary capital to invest in a PV system of
their own. If retailers can empower prosumers to sell power to each other or on to consumers without
PV, they may be able to attract new residential customers and reduce retail market churn.
While the opportunity is clearly significant, taken together, these factors present technical, regulatory,
accounting, marketing and systems challenges for the current market structure and function. It
remains unproven whether a combination of distributed ledger technology and a peer-to-peer market
place can improve system efficiency.
This project
Project participants are interested to determine whether P2P trading could be applied to real customer
data in Australia. Specifically, participants would like to determine the value of these trading markets,
how they would operate and what would need to be in place for P2P trades to be realised (Step 1).
The participants are also keen to explore the applicability of distributed ledger technology to a
peer-to-peer market place.
On that basis, Stage 2 considered whether distributed ledger technology could provide efficiencies
that may offer cost and/or efficiency benefits in a P2P market: saving time, removing cost, reducing
8 Graham, P., CSIRO, 2015: https://blog.csiro.au/the-electricity-network-is-changing-fast-heres-where-were-heading/
9 Graham, P., CSIRO, 2015: https://blog.csiro.au/the-electricity-network-is-changing-fast-heres-where-were-heading/
16
risk, increasing trust and transparency and so on. (The Stage 2 report, by research partners IBM,
forms the latter half of this final, summary document.)
This Stage 1 report presents a model that uses real operational data from a mixture of anonymised
customer connection points (some with distributed energy resources and some without) to assess the
feasibility of peer-to-peer energy trading and quantify the impact for different market participants
under three different scenarios.
This report concludes with findings and observations on the roles and responsibilities required to
facilitate a P2P trading market, as well as specific notes on what a distributed ledger would need to be
able to record to maintain the market.
Project participants
There are three project participants:
1. AGL provide the data preparation and assess the commercialisation of the P2P market
2. IBM provide IT expertise through a review of the conceptual peer-to-peer trading platform design
from the perspective of the suitability of distributed ledger technology
3. MHC provide specialist industry knowledge to develop the list of potential trades, the rules that
may apply to these trades and the valuation that could be applied, as well as manage the overall
project and lead the drafting of the Stage 1 and final reports.
17
4 Methodology
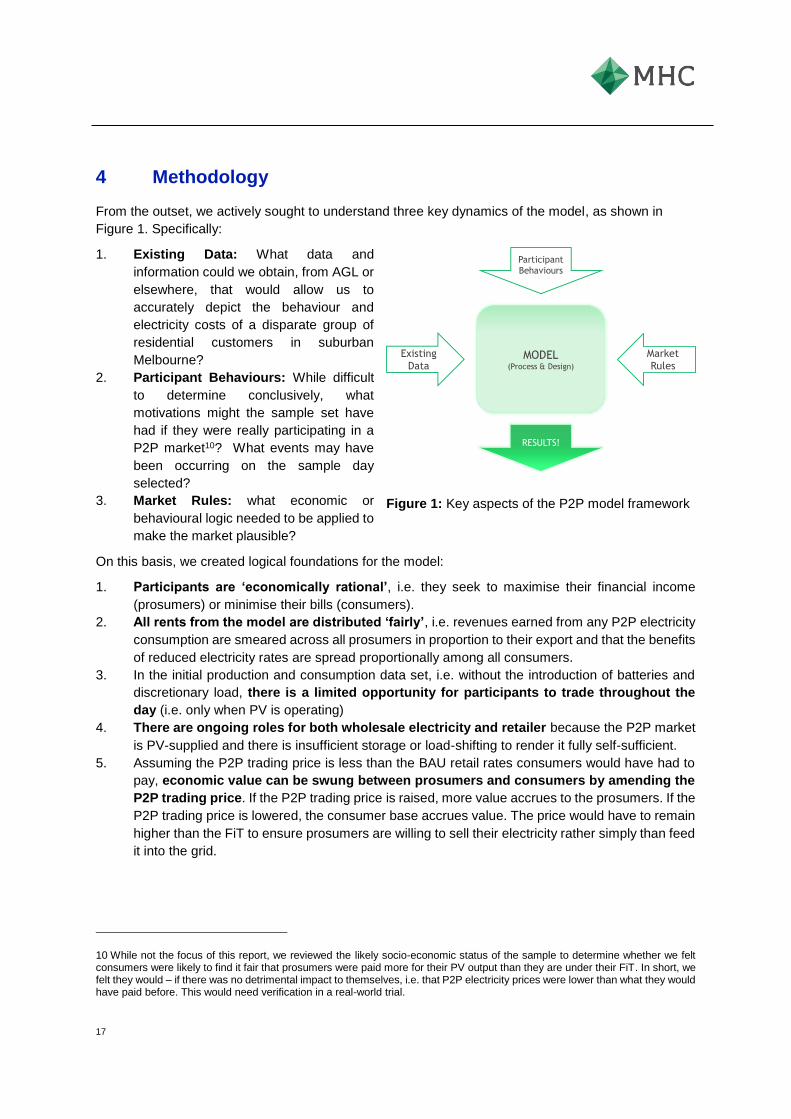
From the outset, we actively sought to understand three key dynamics of the model, as shown in
Figure 1. Specifically:
1. Existing Data: What data and
information could we obtain, from AGL or
elsewhere, that would allow us to
accurately depict the behaviour and
electricity costs of a disparate group of
residential customers in suburban
Melbourne?
2. Participant Behaviours: While difficult
to determine conclusively, what
motivations might the sample set have
had if they were really participating in a
P2P market10? What events may have
been occurring on the sample day
selected?
3. Market Rules: what economic or
behavioural logic needed to be applied to
make the market plausible?
On this basis, we created logical foundations for the model:
1. Participants are ‘economically rational’, i.e. they seek to maximise their financial income
(prosumers) or minimise their bills (consumers).
2. All rents from the model are distributed ‘fairly’, i.e. revenues earned from any P2P electricity
consumption are smeared across all prosumers in proportion to their export and that the benefits
of reduced electricity rates are spread proportionally among all consumers.
3. In the initial production and consumption data set, i.e. without the introduction of batteries and
discretionary load, there is a limited opportunity for participants to trade throughout the
day (i.e. only when PV is operating)
4. There are ongoing roles for both wholesale electricity and retailer because the P2P market
is PV-supplied and there is insufficient storage or load-shifting to render it fully self-sufficient.
5. Assuming the P2P trading price is less than the BAU retail rates consumers would have had to
pay, economic value can be swung between prosumers and consumers by amending the
P2P trading price. If the P2P trading price is raised, more value accrues to the prosumers. If the
P2P trading price is lowered, the consumer base accrues value. The price would have to remain
higher than the FiT to ensure prosumers are willing to sell their electricity rather simply than feed
it into the grid.
10 While not the focus of this report, we reviewed the likely socio-economic status of the sample to determine whether we felt consumers were likely to find it fair that prosumers were paid more for their PV output than they are under their FiT. In short, we felt they would – if there was no detrimental impact to themselves, i.e. that P2P electricity prices were lower than what they would have paid before. This would need verification in a real-world trial.
MODEL(Process & Design)
Existing
Data
Participant
Behaviours
Market
Rules
RESULTS!
Figure 1: Key aspects of the P2P model framework
18
6. The model is a “facilitated” P2P as there is no generator differentiation, unlike some real-world
P2P markets11. Therefore, all prosumers sell into a pool of P2P customers, and all consumers
buy from that pool – instead of direct, specific customer to customer trades. (This was also
implemented partly for modelling simplicity.)
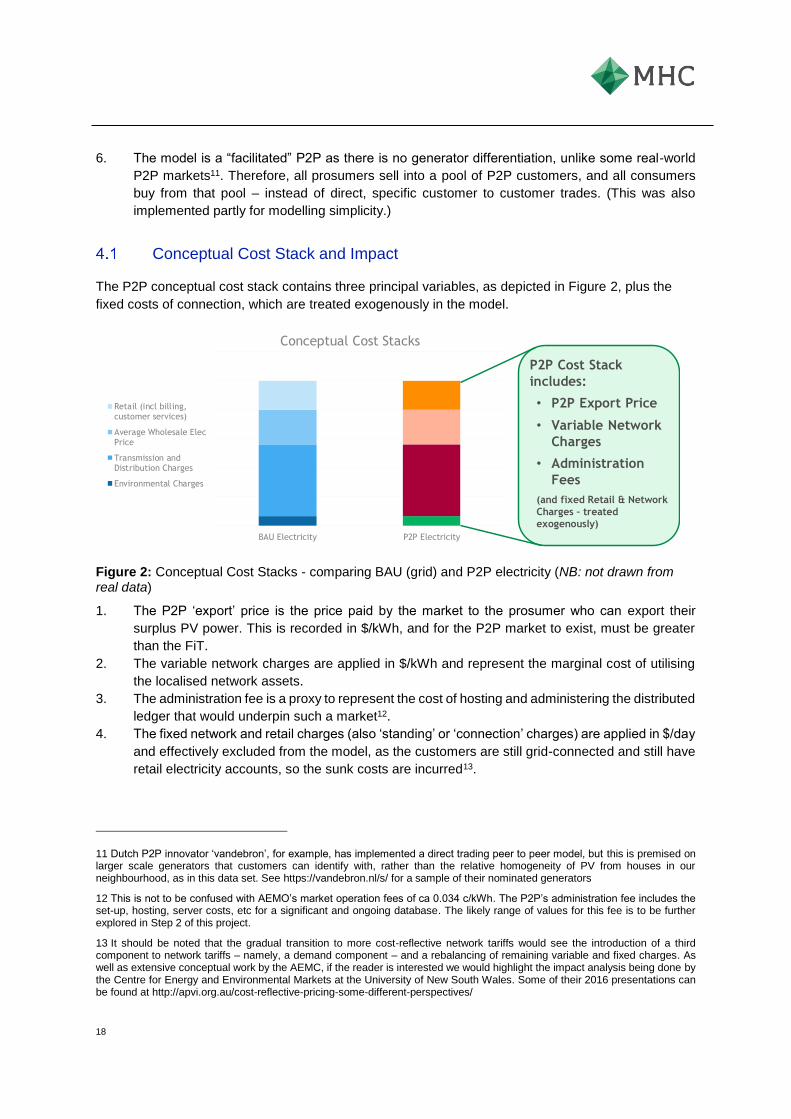
Conceptual Cost Stack and Impact
The P2P conceptual cost stack contains three principal variables, as depicted in Figure 2, plus the
fixed costs of connection, which are treated exogenously in the model.
Figure 2: Conceptual Cost Stacks - comparing BAU (grid) and P2P electricity (NB: not drawn from real data)
1. The P2P ‘export’ price is the price paid by the market to the prosumer who can export their
surplus PV power. This is recorded in $/kWh, and for the P2P market to exist, must be greater
than the FiT.
2. The variable network charges are applied in $/kWh and represent the marginal cost of utilising
the localised network assets.
3. The administration fee is a proxy to represent the cost of hosting and administering the distributed
ledger that would underpin such a market12.
4. The fixed network and retail charges (also ‘standing’ or ‘connection’ charges) are applied in $/day
and effectively excluded from the model, as the customers are still grid-connected and still have
retail electricity accounts, so the sunk costs are incurred13.
11 Dutch P2P innovator ‘vandebron’, for example, has implemented a direct trading peer to peer model, but this is premised on larger scale generators that customers can identify with, rather than the relative homogeneity of PV from houses in our neighbourhood, as in this data set. See https://vandebron.nl/s/ for a sample of their nominated generators
12 This is not to be confused with AEMO’s market operation fees of ca 0.034 c/kWh. The P2P’s administration fee includes the set-up, hosting, server costs, etc for a significant and ongoing database. The likely range of values for this fee is to be further explored in Step 2 of this project.
13 It should be noted that the gradual transition to more cost-reflective network tariffs would see the introduction of a third component to network tariffs – namely, a demand component – and a rebalancing of remaining variable and fixed charges. As well as extensive conceptual work by the AEMC, if the reader is interested we would highlight the impact analysis being done by the Centre for Energy and Environmental Markets at the University of New South Wales. Some of their 2016 presentations can be found at http://apvi.org.au/cost-reflective-pricing-some-different-perspectives/
P2P Cost Stack
includes:
• P2P Export Price
• Variable Network
Charges
• Administration
Fees
(and fixed Retail & Network
Charges – treated
exogenously)
BAU Electricity P2P Electricity
Conceptual Cost Stacks
Retail (incl billing,customer services)
Average Wholesale ElecPrice
Transmission andDistribution Charges
Environmental Charges

19
The relationships between the retail, network and P2P administration fee elements determine the
economic space that can be created for the P2P to exist and how much is ‘left over’ to distribute
among consumers.
The total P2P cost stack must sum to less than the consumer would have paid under their standard
tariff for them to want to purchase electricity in the P2P market.
20
5 Model
Design and Intent
A robust, transparent platform allows project participants to review and assess clear results, as well
as be frank about some of the weaknesses and challenges that the model and P2P market might
raise. Simplicity was therefore key to the model approach.
Models naturally evolve out of the creator’s requirements to test different scenarios or sensitivities,
and are often the product of multiple iterations and changes of focus. Complex models result when
limited thought is given to ensuring a disciplined methodical approach for design, build,
documentation or integrity checks in advance.
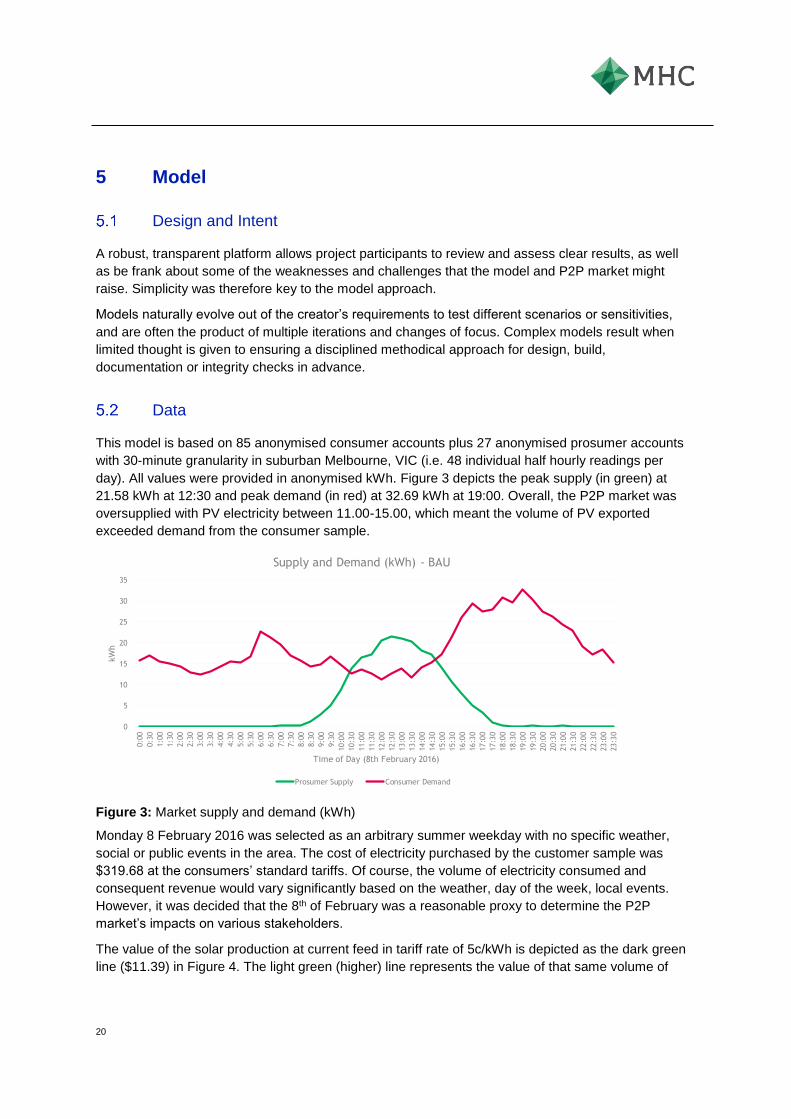
Data
This model is based on 85 anonymised consumer accounts plus 27 anonymised prosumer accounts
with 30-minute granularity in suburban Melbourne, VIC (i.e. 48 individual half hourly readings per
day). All values were provided in anonymised kWh. Figure 3 depicts the peak supply (in green) at
21.58 kWh at 12:30 and peak demand (in red) at 32.69 kWh at 19:00. Overall, the P2P market was
oversupplied with PV electricity between 11.00-15.00, which meant the volume of PV exported
exceeded demand from the consumer sample.
Figure 3: Market supply and demand (kWh)
Monday 8 February 2016 was selected as an arbitrary summer weekday with no specific weather,
social or public events in the area. The cost of electricity purchased by the customer sample was
$319.68 at the consumers’ standard tariffs. Of course, the volume of electricity consumed and
consequent revenue would vary significantly based on the weather, day of the week, local events.
However, it was decided that the 8th of February was a reasonable proxy to determine the P2P
market’s impacts on various stakeholders.
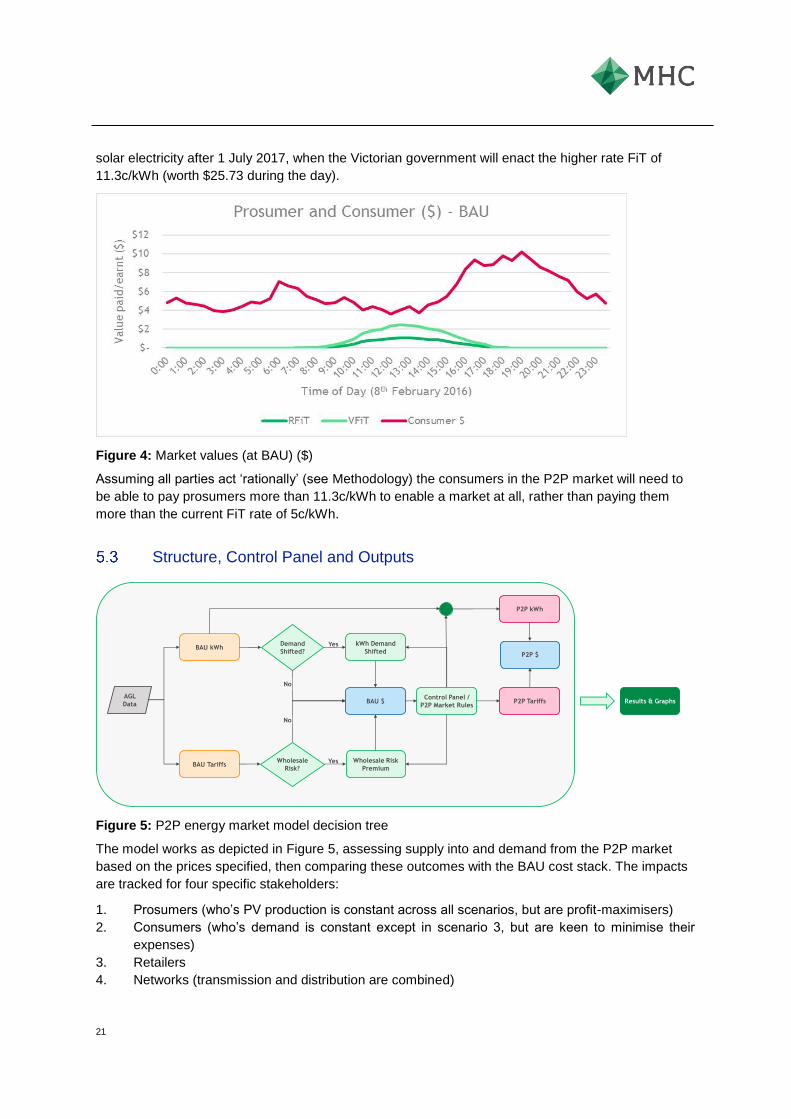
The value of the solar production at current feed in tariff rate of 5c/kWh is depicted as the dark green
line ($11.39) in Figure 4. The light green (higher) line represents the value of that same volume of
0
5
10
15
20
25
30
35
0:0
0
0:3
0
1:0
0
1:3
0
2:0
0
2:3
0
3:0
0
3:3
0
4:0
0
4:3
0
5:0
0
5:3
0
6:0
0
6:3
0
7:0
0
7:3
0
8:0
0
8:3
0
9:0
0
9:3
0
10:0
0
10:3
0
11:0
0
11:3
0
12:0
0
12:3
0
13:0
0
13:3
0
14:0
0
14:3
0
15:0
0
15:3
0
16:0
0
16:3
0
17:0
0
17:3
0
18:0
0
18:3
0
19:0
0
19:3
0
20:0
0
20:3
0
21:0
0
21:3
0
22:0
0
22:3
0
23:0
0
23:3
0
kW
h
Time of Day (8th February 2016)
Supply and Demand (kWh) - BAU
Prosumer Supply Consumer Demand
21
solar electricity after 1 July 2017, when the Victorian government will enact the higher rate FiT of
11.3c/kWh (worth $25.73 during the day).
Figure 4: Market values (at BAU) ($)
Assuming all parties act ‘rationally’ (see Methodology) the consumers in the P2P market will need to
be able to pay prosumers more than 11.3c/kWh to enable a market at all, rather than paying them
more than the current FiT rate of 5c/kWh.
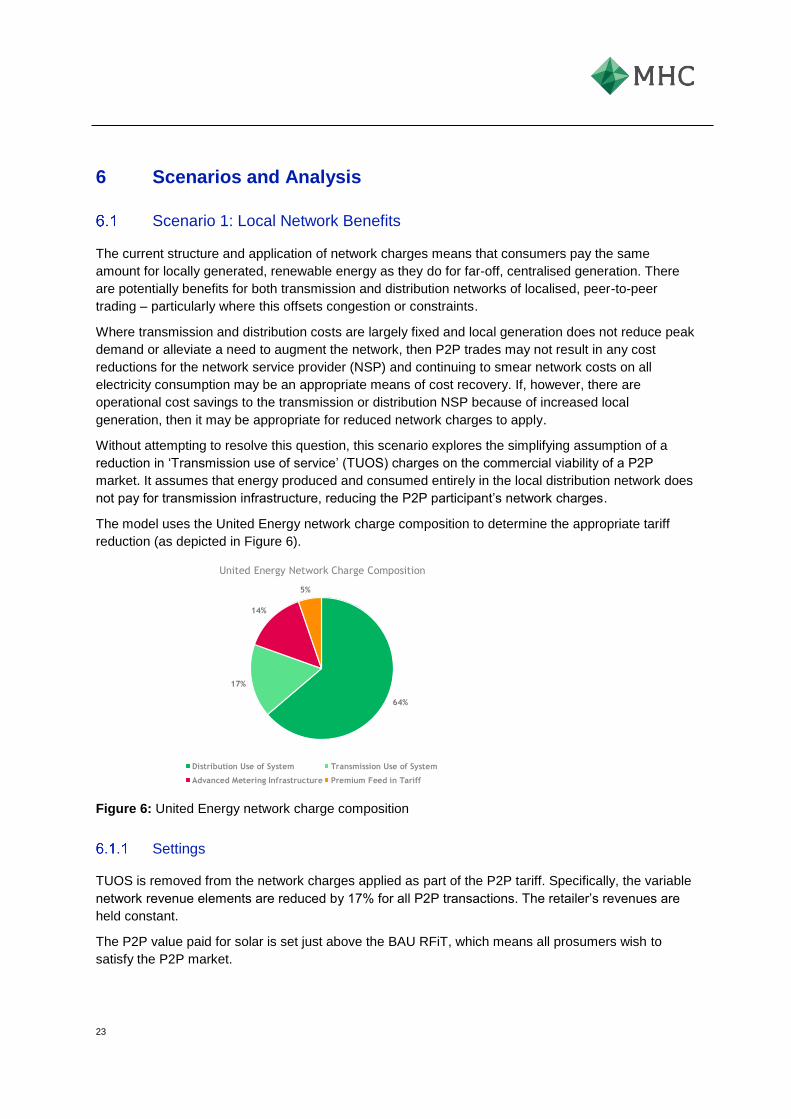
Structure, Control Panel and Outputs
Figure 5: P2P energy market model decision tree
The model works as depicted in Figure 5, assessing supply into and demand from the P2P market
based on the prices specified, then comparing these outcomes with the BAU cost stack. The impacts
are tracked for four specific stakeholders:
1. Prosumers (who’s PV production is constant across all scenarios, but are profit-maximisers)
2. Consumers (who’s demand is constant except in scenario 3, but are keen to minimise their
expenses)
3. Retailers
4. Networks (transmission and distribution are combined)
AGL
Data
BAU kWh
BAU TariffsWholesale
Risk?
Demand
Shifted?
kWh Demand
Shifted
BAU $
Wholesale Risk
Premium
Control Panel /
P2P Market Rules
P2P kWh
P2P $
P2P Tariffs
Yes
Yes
No
Results & Graphs
No

22
The specific model outputs are:
1. Consumer bills / PV revenue per customer type compared to BAU
2. Traded volumes compared to BAU
3. Retailer revenues compared to BAU
4. Level of network/retail/administration charges to facilitate market and how this has been
implemented
Any ‘wholesale market impacts’ proposed in the report are suggested based on the net number of grid
kWh purchased once the P2P is active, then extrapolated to the full wholesale market. Note that this
is a purely theoretical exercise – as there has been no direct modelling of the wholesale market.
23
6 Scenarios and Analysis
Scenario 1: Local Network Benefits
The current structure and application of network charges means that consumers pay the same
amount for locally generated, renewable energy as they do for far-off, centralised generation. There
are potentially benefits for both transmission and distribution networks of localised, peer-to-peer
trading – particularly where this offsets congestion or constraints.
Where transmission and distribution costs are largely fixed and local generation does not reduce peak
demand or alleviate a need to augment the network, then P2P trades may not result in any cost
reductions for the network service provider (NSP) and continuing to smear network costs on all
electricity consumption may be an appropriate means of cost recovery. If, however, there are
operational cost savings to the transmission or distribution NSP because of increased local
generation, then it may be appropriate for reduced network charges to apply.
Without attempting to resolve this question, this scenario explores the simplifying assumption of a
reduction in ‘Transmission use of service’ (TUOS) charges on the commercial viability of a P2P
market. It assumes that energy produced and consumed entirely in the local distribution network does
not pay for transmission infrastructure, reducing the P2P participant’s network charges.
The model uses the United Energy network charge composition to determine the appropriate tariff
reduction (as depicted in Figure 6).
Figure 6: United Energy network charge composition
Settings
TUOS is removed from the network charges applied as part of the P2P tariff. Specifically, the variable
network revenue elements are reduced by 17% for all P2P transactions. The retailer’s revenues are
held constant.
The P2P value paid for solar is set just above the BAU RFiT, which means all prosumers wish to
satisfy the P2P market.
64%
17%
14%
5%
United Energy Network Charge Composition
Distribution Use of System Transmission Use of System
Advanced Metering Infrastructure Premium Feed in Tariff
24
The benefits to prosumer and consumers (i.e. the remainder of the cost stack in $/kWh) are split
evenly between the two groups.
An additional 1c/kWh fee per kWh traded has been applied to cover the administration fee for
establishing, hosting and enabling the P2P trading platform as well as provide an incentive to enable
the market.
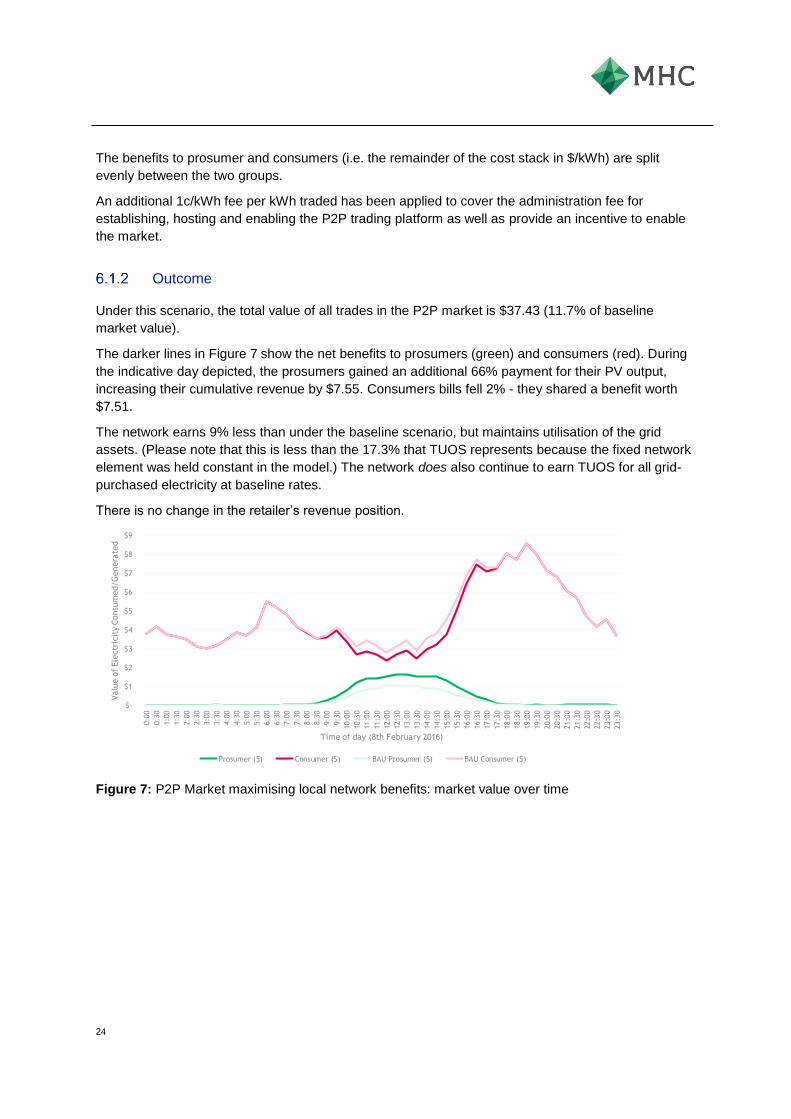
Outcome
Under this scenario, the total value of all trades in the P2P market is $37.43 (11.7% of baseline
market value).
The darker lines in Figure 7 show the net benefits to prosumers (green) and consumers (red). During
the indicative day depicted, the prosumers gained an additional 66% payment for their PV output,
increasing their cumulative revenue by $7.55. Consumers bills fell 2% - they shared a benefit worth
$7.51.
The network earns 9% less than under the baseline scenario, but maintains utilisation of the grid
assets. (Please note that this is less than the 17.3% that TUOS represents because the fixed network
element was held constant in the model.) The network does also continue to earn TUOS for all grid-
purchased electricity at baseline rates.
There is no change in the retailer’s revenue position.
Figure 7: P2P Market maximising local network benefits: market value over time
$-
$1
$2
$3
$4
$5
$6
$7
$8
$9
0:0
0
0:3
0
1:0
0
1:3
0
2:0
0
2:3
0
3:0
0
3:3
0
4:0
0
4:3
0
5:0
0
5:3
0
6:0
0
6:3
0
7:0
0
7:3
0
8:0
0
8:3
0
9:0
0
9:3
0
10:0
0
10:3
0
11:0
0
11:3
0
12:0
0
12:3
0
13:0
0
13:3
0
14:0
0
14:3
0
15:0
0
15:3
0
16:0
0
16:3
0
17:0
0
17:3
0
18:0
0
18:3
0
19:0
0
19:3
0
20:0
0
20:3
0
21:0
0
21:3
0
22:0
0
22:3
0
23:0
0
23:3
0
Valu
e o
f Ele
ctr
icit
y C
onsu
med/G
enera
ted
Time of day (8th February 2016)
Scenario 2: Local Network Benefit
Prosumer ($) Consumer ($) BAU Prosumer ($) BAU Consumer ($)
25
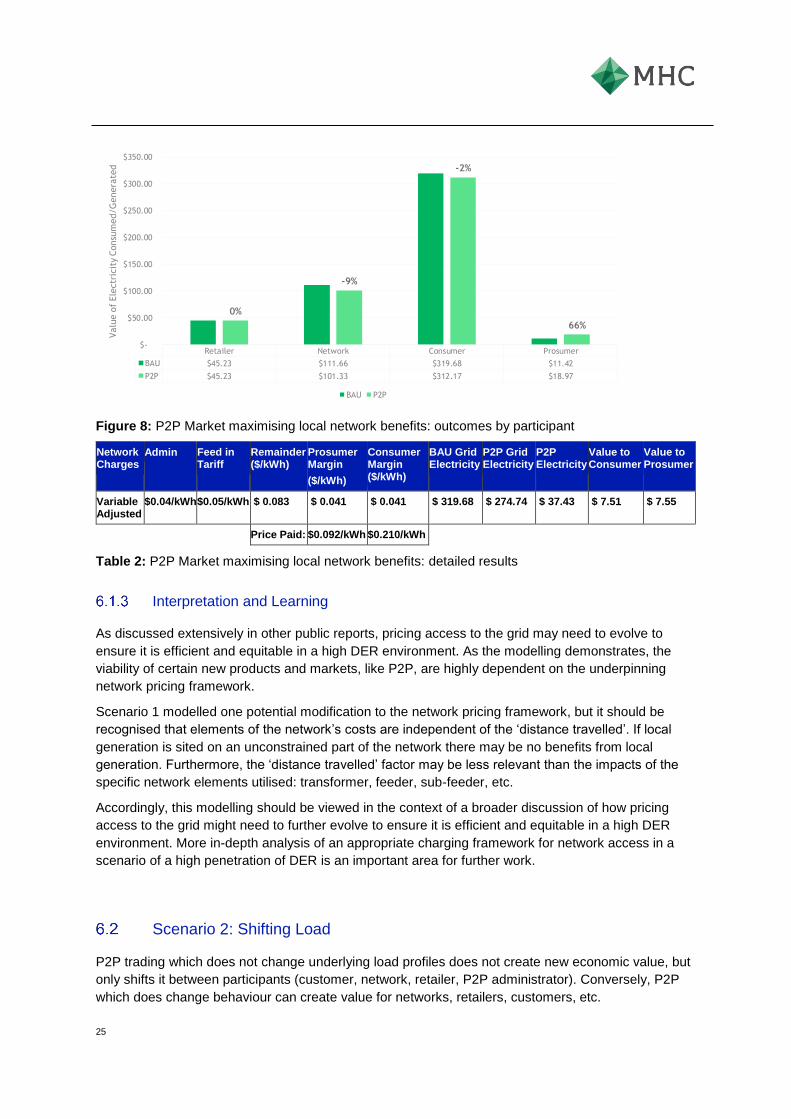
Figure 8: P2P Market maximising local network benefits: outcomes by participant
Network Charges
Admin Feed in Tariff
Remainder ($/kWh)
Prosumer Margin
($/kWh)
Consumer Margin ($/kWh)
BAU Grid Electricity
P2P Grid Electricity
P2P Electricity
Value to Consumer
Value to Prosumer
Variable Adjusted
$0.04/kWh $0.05/kWh $ 0.083 $ 0.041 $ 0.041 $ 319.68 $ 274.74 $ 37.43 $ 7.51 $ 7.55
Price Paid: $0.092/kWh $0.210/kWh
Table 2: P2P Market maximising local network benefits: detailed results
Interpretation and Learning
As discussed extensively in other public reports, pricing access to the grid may need to evolve to
ensure it is efficient and equitable in a high DER environment. As the modelling demonstrates, the
viability of certain new products and markets, like P2P, are highly dependent on the underpinning
network pricing framework.
Scenario 1 modelled one potential modification to the network pricing framework, but it should be
recognised that elements of the network’s costs are independent of the ‘distance travelled’. If local
generation is sited on an unconstrained part of the network there may be no benefits from local
generation. Furthermore, the ‘distance travelled’ factor may be less relevant than the impacts of the
specific network elements utilised: transformer, feeder, sub-feeder, etc.
Accordingly, this modelling should be viewed in the context of a broader discussion of how pricing
access to the grid might need to further evolve to ensure it is efficient and equitable in a high DER
environment. More in-depth analysis of an appropriate charging framework for network access in a
scenario of a high penetration of DER is an important area for further work.
Scenario 2: Shifting Load
P2P trading which does not change underlying load profiles does not create new economic value, but
only shifts it between participants (customer, network, retailer, P2P administrator). Conversely, P2P
which does change behaviour can create value for networks, retailers, customers, etc.
Retailer Network Consumer Prosumer
BAU $45.23 $111.66 $319.68 $11.42
P2P $45.23 $101.33 $312.17 $18.97
0%
-9%
-2%
66%
$-
$50.00
$100.00
$150.00
$200.00
$250.00
$300.00
$350.00
Valu
e o
f Ele
ctr
icit
y C
onsu
med/G
enera
ted
Scenario 2: Local Network Benefit
BAU P2P
26
Scenario 2 shifts consumer load by several hours, reflecting the behaviour of controlling major
household loads.
Settings
This scenario can be applied by making the simplifying assumption that peak load consumed between
5-8pm can be shifted to maximum solar export hours between 10-3pm. (The assumption is that the
shifted load would perfectly match the excess solar load. It should be noted that this would require the
capability to perfectly forecast and control load, the technologies for which are not widely distributed in
the residential population at present. Critically, it would also require sufficient flexible load at customer
premises).
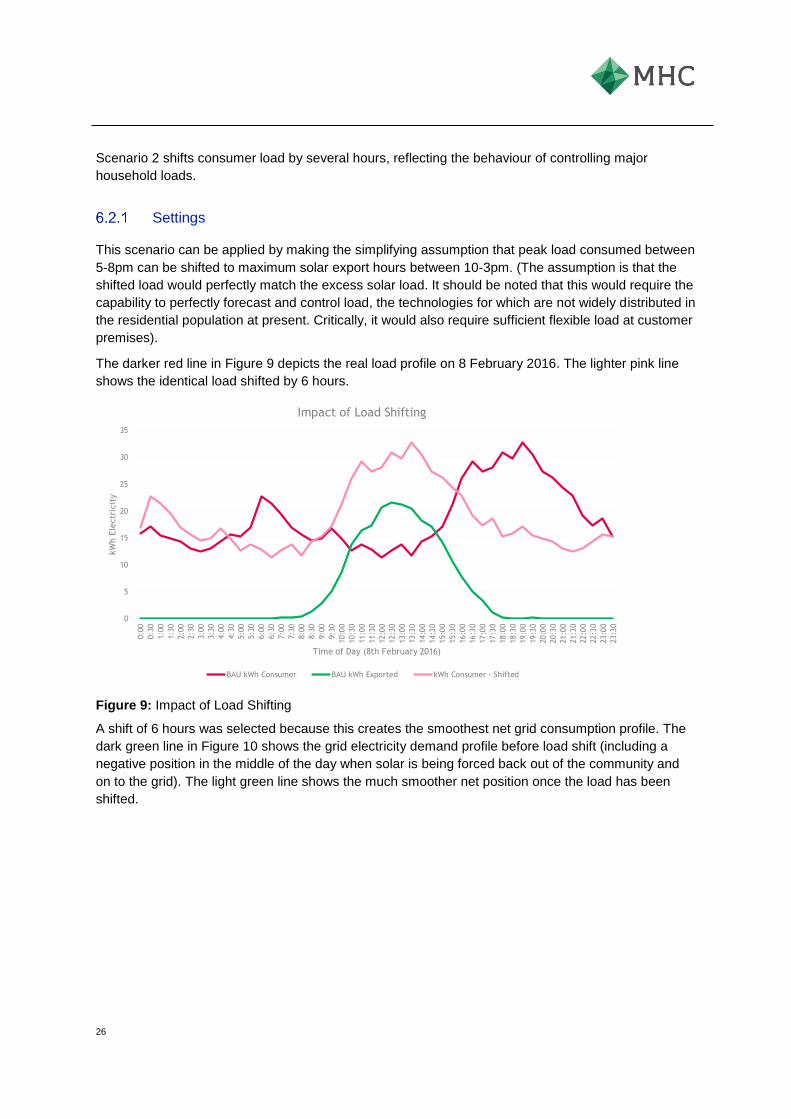
The darker red line in Figure 9 depicts the real load profile on 8 February 2016. The lighter pink line
shows the identical load shifted by 6 hours.
Figure 9: Impact of Load Shifting
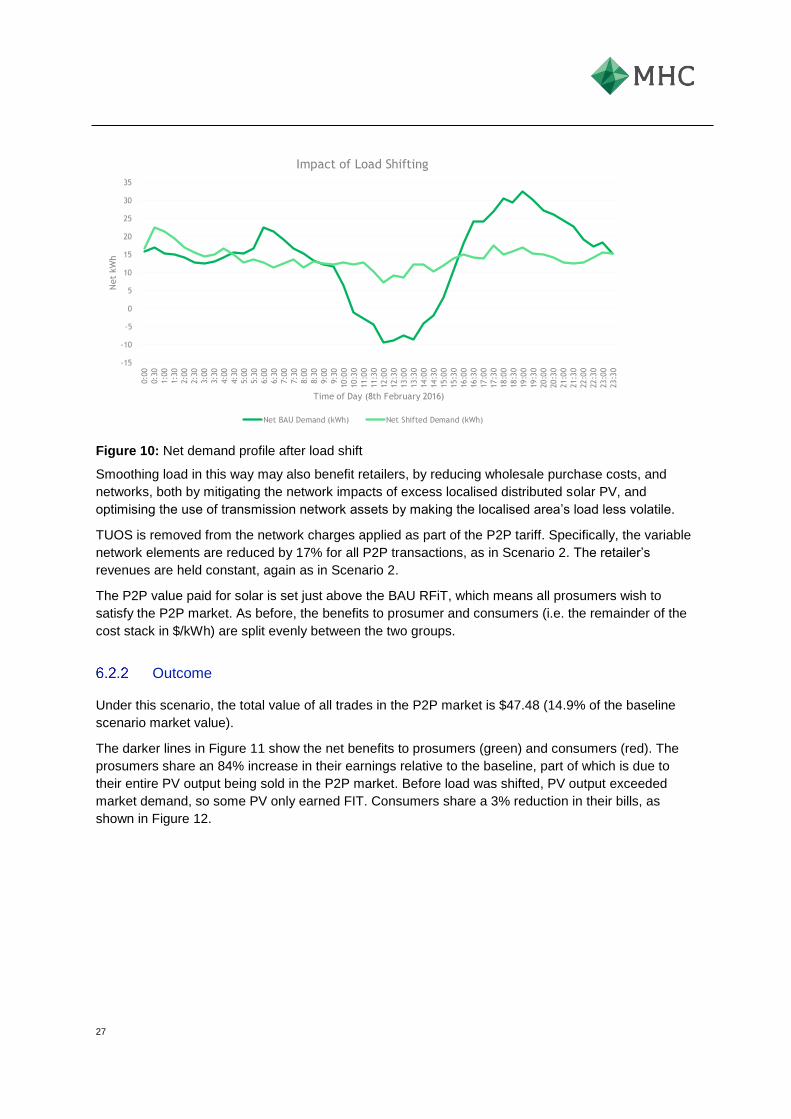
A shift of 6 hours was selected because this creates the smoothest net grid consumption profile. The
dark green line in Figure 10 shows the grid electricity demand profile before load shift (including a
negative position in the middle of the day when solar is being forced back out of the community and
on to the grid). The light green line shows the much smoother net position once the load has been
shifted.
0
5
10
15
20
25
30
35
0:0
0
0:3
0
1:0
0
1:3
0
2:0
0
2:3
0
3:0
0
3:3
0
4:0
0
4:3
0
5:0
0
5:3
0
6:0
0
6:3
0
7:0
0
7:3
0
8:0
0
8:3
0
9:0
0
9:3
0
10:0
0
10:3
0
11:0
0
11:3
0
12:0
0
12:3
0
13:0
0
13:3
0
14:0
0
14:3
0
15:0
0
15:3
0
16:0
0
16:3
0
17:0
0
17:3
0
18:0
0
18:3
0
19:0
0
19:3
0
20:0
0
20:3
0
21:0
0
21:3
0
22:0
0
22:3
0
23:0
0
23:3
0
kW
h E
lectr
icit
y
Time of Day (8th February 2016)
Impact of Load Shifting
BAU kWh Consumer BAU kWh Exported kWh Consumer - Shifted
27
Figure 10: Net demand profile after load shift
Smoothing load in this way may also benefit retailers, by reducing wholesale purchase costs, and
networks, both by mitigating the network impacts of excess localised distributed solar PV, and
optimising the use of transmission network assets by making the localised area’s load less volatile.
TUOS is removed from the network charges applied as part of the P2P tariff. Specifically, the variable
network elements are reduced by 17% for all P2P transactions, as in Scenario 2. The retailer’s
revenues are held constant, again as in Scenario 2.
The P2P value paid for solar is set just above the BAU RFiT, which means all prosumers wish to
satisfy the P2P market. As before, the benefits to prosumer and consumers (i.e. the remainder of the
cost stack in $/kWh) are split evenly between the two groups.
Outcome
Under this scenario, the total value of all trades in the P2P market is $47.48 (14.9% of the baseline
scenario market value).
The darker lines in Figure 11 show the net benefits to prosumers (green) and consumers (red). The
prosumers share an 84% increase in their earnings relative to the baseline, part of which is due to
their entire PV output being sold in the P2P market. Before load was shifted, PV output exceeded
market demand, so some PV only earned FIT. Consumers share a 3% reduction in their bills, as
shown in Figure 12.
-15
-10
-5
0
5
10
15
20
25
30
35
0:0
0
0:3
0
1:0
0
1:3
0
2:0
0
2:3
0
3:0
0
3:3
0
4:0
0
4:3
0
5:0
0
5:3
0
6:0
0
6:3
0
7:0
0
7:3
0
8:0
0
8:3
0
9:0
0
9:3
0
10:0
0
10:3
0
11:0
0
11:3
0
12:0
0
12:3
0
13:0
0
13:3
0
14:0
0
14:3
0
15:0
0
15:3
0
16:0
0
16:3
0
17:0
0
17:3
0
18:0
0
18:3
0
19:0
0
19:3
0
20:0
0
20:3
0
21:0
0
21:3
0
22:0
0
22:3
0
23:0
0
23:3
0
Net
kW
h
Time of Day (8th February 2016)
Impact of Load Shifting
Net BAU Demand (kWh) Net Shifted Demand (kWh)
28
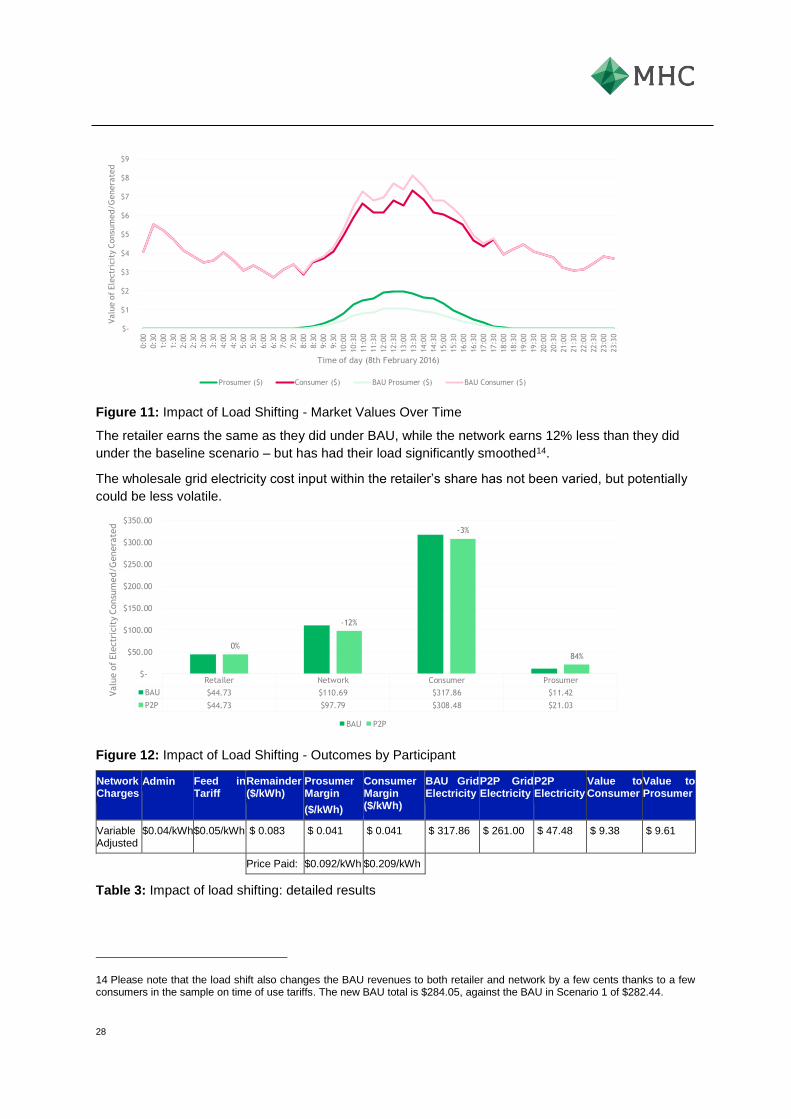
Figure 11: Impact of Load Shifting - Market Values Over Time
The retailer earns the same as they did under BAU, while the network earns 12% less than they did
under the baseline scenario – but has had their load significantly smoothed14.
The wholesale grid electricity cost input within the retailer’s share has not been varied, but potentially
could be less volatile.
Figure 12: Impact of Load Shifting - Outcomes by Participant
Network Charges
Admin Feed in Tariff
Remainder ($/kWh)
Prosumer Margin
($/kWh)
Consumer Margin ($/kWh)
BAU Grid Electricity
P2P Grid Electricity
P2P Electricity
Value to Consumer
Value to Prosumer
Variable Adjusted
$0.04/kWh $0.05/kWh $ 0.083 $ 0.041 $ 0.041 $ 317.86 $ 261.00 $ 47.48 $ 9.38 $ 9.61
Price Paid: $0.092/kWh $0.209/kWh
Table 3: Impact of load shifting: detailed results
14 Please note that the load shift also changes the BAU revenues to both retailer and network by a few cents thanks to a few consumers in the sample on time of use tariffs. The new BAU total is $284.05, against the BAU in Scenario 1 of $282.44.
$-
$1
$2
$3
$4
$5
$6
$7
$8
$9
0:0
0
0:3
0
1:0
0
1:3
0
2:0
0
2:3
0
3:0
0
3:3
0
4:0
0
4:3
0
5:0
0
5:3
0
6:0
0
6:3
0
7:0
0
7:3
0
8:0
0
8:3
0
9:0
0
9:3
0
10:0
0
10:3
0
11:0
0
11:3
0
12:0
0
12:3
0
13:0
0
13:3
0
14:0
0
14:3
0
15:0
0
15:3
0
16:0
0
16:3
0
17:0
0
17:3
0
18:0
0
18:3
0
19:0
0
19:3
0
20:0
0
20:3
0
21:0
0
21:3
0
22:0
0
22:3
0
23:0
0
23:3
0
Valu
e o
f Ele
ctr
icit
y C
onsu
med/G
enera
ted
Time of day (8th February 2016)
Scenario 3: Impact of Load Shifting
Prosumer ($) Consumer ($) BAU Prosumer ($) BAU Consumer ($)
Retailer Network Consumer Prosumer
BAU $44.73 $110.69 $317.86 $11.42
P2P $44.73 $97.79 $308.48 $21.03
0%
-12%
-3%
84%
$-
$50.00
$100.00
$150.00
$200.00
$250.00
$300.00
$350.00
Valu
e o
f Ele
ctr
icit
y C
onsu
med/G
enera
ted
Scenario 3: Impact of Load Shifting
BAU P2P
29
Interpretation and Learning
Scenario 2 demonstrates that there may be additional value available through P2P if the market can
incentivise load shifting in ways that deliver system (e.g. wholesale or network) value, as described
above.
To realise these benefits, the P2P product would need to include a mechanism for monetising that
value – both the retailer and the network would need to quantify and reward the value created by
technologies that allowed for intelligent load control.
Real efforts to shift customer load at scale to date have been challenging, so this scenario is intended
for demonstration purposes.
Interestingly, the number of transactions in the P2P market grows by 8% in this scenario compared to
Scenario 1. This is due to all PV supply now being traded in the P2P market if the price is
economically beneficial to both prosumers and consumers.
Scenario 3: A low-cost P2P administrator
Scenarios 1 and 2 offer market deviations that can be explained plausibly: networks (1) see value in
the existence of P2P or load shifting alters consumer profiles (2). Scenario 3 deliberately seeks to
create the maximum value for the P2P market, by envisaging the arrival of a low-cost P2P
administrator who enables the market.
Settings
In this scenario, the administration fees are set to 2c/kWh and the variable network charges are zero.
While unlikely, this could arise if a start-up P2P market administrator were to enter the market under
the auspices of an existing retailer prepared to act as the Financially Responsible Market Participant
(FRMP).
The P2P value paid for solar is set just above the BAU RFiT, which means all prosumers wish to
satisfy the P2P market. As before, the benefits to prosumer and consumers (i.e. the remainder of the
cost stack in $/kWh) are split evenly between the two groups.
This scenario does not model any increase in costs to (and associated pricing of) the incumbent
FRMP for establishing the capability to reconcile trades in the P2P market with its ongoing
responsibilities for NEM settlement or any potential impacts on wholesale purchase costs for load
being priced outside of the P2P market.
Outcome
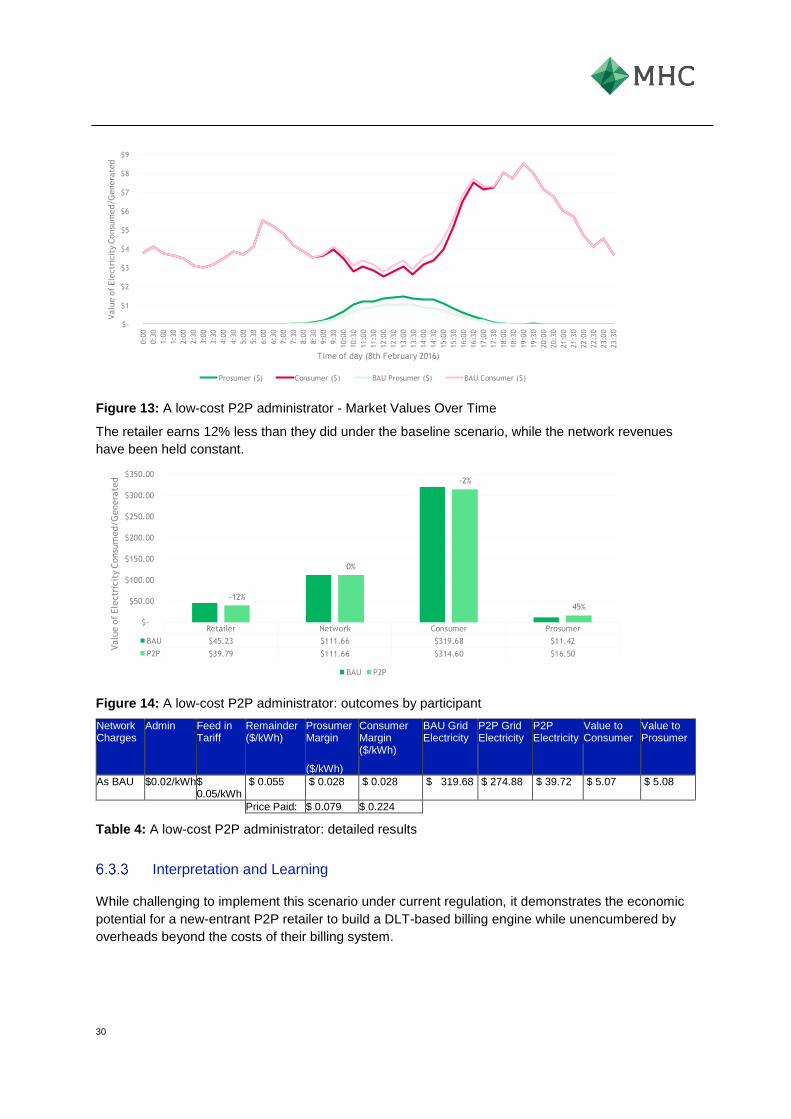
Under this scenario, the total value of all trades in the P2P market is $39.72 (12.4% of BAU market
value). The values for consumers are significant though: the darker lines in Figure 13 show the net
benefits to prosumers (green) and consumers (red).
The prosumers share an 45% increase in their earnings against BAU (worth $5.08). Consumers share
a 2% reduction in their bills (worth another $5.07), as shown in Figure 14.
30
Figure 13: A low-cost P2P administrator - Market Values Over Time
The retailer earns 12% less than they did under the baseline scenario, while the network revenues
have been held constant.
Figure 14: A low-cost P2P administrator: outcomes by participant
Network Charges
Admin Feed in Tariff
Remainder ($/kWh)
Prosumer Margin
($/kWh)
Consumer Margin ($/kWh)
BAU Grid Electricity
P2P Grid Electricity
P2P Electricity
Value to Consumer
Value to Prosumer
As BAU $0.02/kWh $ 0.05/kWh
$ 0.055 $ 0.028 $ 0.028 $ 319.68 $ 274.88 $ 39.72 $ 5.07 $ 5.08
Price Paid: $ 0.079 $ 0.224
Table 4: A low-cost P2P administrator: detailed results
Interpretation and Learning
While challenging to implement this scenario under current regulation, it demonstrates the economic
potential for a new-entrant P2P retailer to build a DLT-based billing engine while unencumbered by
overheads beyond the costs of their billing system.
$-
$1
$2
$3
$4
$5
$6
$7
$8
$9
0:0
0
0:3
0
1:0
0
1:3
0
2:0
0
2:3
0
3:0
0
3:3
0
4:0
0
4:3
0
5:0
0
5:3
0
6:0
0
6:3
0
7:0
0
7:3
0
8:0
0
8:3
0
9:0
0
9:3
0
10:0
0
10:3
0
11:0
0
11:3
0
12:0
0
12:3
0
13:0
0
13:3
0
14:0
0
14:3
0
15:0
0
15:3
0
16:0
0
16:3
0
17:0
0
17:3
0
18:0
0
18:3
0
19:0
0
19:3
0
20:0
0
20:3
0
21:0
0
21:3
0
22:0
0
22:3
0
23:0
0
23:3
0
Valu
e o
f Ele
ctr
icit
y C
onsu
med/G
enera
ted
Time of day (8th February 2016)
Scenario 4 - A low-cost P2P administrator
Prosumer ($) Consumer ($) BAU Prosumer ($) BAU Consumer ($)
Retailer Network Consumer Prosumer
BAU $45.23 $111.66 $319.68 $11.42
P2P $39.79 $111.66 $314.60 $16.50
-12%
0%
-2%
45%
$-
$50.00
$100.00
$150.00
$200.00
$250.00
$300.00
$350.00
Valu
e o
f Ele
ctr
icit
y C
onsu
med/G
enera
ted
Scenario 4: A low-cost P2P administrator
BAU P2P
31
7 Distributed Ledger Technology
Distributed ledger technology is an innovative method of storing, consensually sharing, and validating
data that could record direct transactions between energy producers and consumers. The individual
trades would be recorded on copied ledgers held by different servers, transparent to auditors and
regulators and information becomes immutable due to the authentication processes.
P2P markets offer many more trading options than the classic “retailer to customer”, but also make
the individual trades more complex to track and verify. Distributed ledger technology, due to the write-
once nature of their update processes, could act as the trusted “source of truth” for consumers and
prosumers, but also for retailers, networks, AEMO, auditors and regulators.
MHC believes there is value for utilities in adopting the DLT for recording P2P transactions and billing
(and leading to a potential reduction in overheads that would enable the P2P market). Specifically,
potential opportunities for the distributed ledger in a peer-to-peer market setting include:
• Simplifying operation: DLT could reduce effort in account reconciliation and handling bill
complaints as well as improve settlement times. While this benefit is not exclusive to the peer-
to-peer market, operational benefits could be achieved if the market administrator had visibility
over multi-party peer-to-peer trades, compared to the current system which only provides a
retailer with visibility over their own customers’ data.
• Streamlining regulation: DLT enables the real-time monitoring and auditing of trading activity.
Regulations to enable and assess the peer-to-peer power trading market do not yet exist, but
their design could reflect the concept that a P2P market could reduce the regulatory burden on
market participants by providing the regulator with visibility over the market and its outcomes
directly.
• Settlement time reduction: DLT disintermediates third parties that support transaction
verification or validation and accelerates settlement, so retailers, P2P prosumers and
consumers could settle their accounts at any specified interval, in near real-time and with lower
(or no) transaction fees.
Conceptually, the opportunity may even go beyond these: a distributed ledger may also be
appropriate for asset management and optimisation and the issuance, proof and trading of
renewables or carbon certificates.
Further opportunities for integration in the energy space may emerge between distributed ledger
technology and a range of broader innovations, including network planning or the rapidly evolving
internet of energy (interconnected devices and ‘intelligence’ at all levels, from generators through the
network to consumers). For example, parallel ledgers could be run for ancillary services and network
support markets, like volt/VAR optimisation.
In the most extreme example, if the entire system’s meters, including all generators, networks,
distribution nodes, households and businesses, were transitioned onto a distributed ledger, then
theoretically the retailer’s cost to serve could be reduced across the board – i.e. for both grid and P2P
energy.
However, one of the challenges for DLT – for the P2P market, but also for the power sector more
widely - is the sheer volume of data produced. While not insurmountable, it is unclear whether the
required volume of P2P data transactions could be run concurrently, particularly if tracking multiple
information streams (e.g. market preferences, ancillary services delivered, kWh produced, kWh
consumed, dollars paid) in near real-time. As a conceptual illustration, if 9m Australian households
32
were connected to a single distributed ledger and generated one ‘entry’ of their actual power
consumption every 30 minutes, there would be the equivalent of 5,000 ledger entries per second15,
which is beyond the current capabilities of existing distributed ledgers.
If the retailer were also the DLT P2P administrator, system duplication may lead to complexity and
increased costs. Stage 2 of this project (the IBM report that forms the second half of this document)
considers these issues in more detail.
Attributes of the Trading Market
There were a maximum of 2,177 successful transactions in the 48 half hour periods on the arbitrary
day selected (8 Feb 2016) for this sample size (27 prosumer and 85 consumer accounts), with loads
shifted as in Scenario 2.
The P2P market modelled works via a central aggregator or market (so each participant has a
relationship via a central market, rather than a plethora of direct bilateral relationships). Specifically,
there were 534 prosumer sales to and 1,643 consumer purchases from the central market – but there
could have been many multiples of these numbers if everyone could have traded with each other
bilaterally as their actual consumption or production varied. Each transaction was a specific transfer of
$ value. The key attributes and criteria recorded at this point were:
• Customer reference number (alphanumeric)
• Energy consumption or production – both per person and in the market (kWh)
• Tariff category (AGL reference)
• P2P PV price established (which must be greater than RFIT at 5c/kWh) ($/kWh)
• Amount of P2P PV available (kW)
• Variable network charges ($/kWh)
• Additional fee’ and margin element (the $/kWh proxy for what the DLT is likely to cost in
future/the retailer’s share of the P2P conceptual cost stack). This is an important variable that
had to bring the total conceptual cost stack in under baseline tariff rates.
15 A 30-minute interval might be judged too slow, given the incremental shifts in demand and supply at the household level that are not reflected in this cumulative outcome. If so, shorter intervals will lead to increasing data processing requirements.
33
8 Conclusions and Observations
The underlying argument for peer to peer trading is that customers prefer to support locally supplied
renewable energy that has lower emissions than centralised thermal generation.
The P2P market modelled works via a central aggregator or market, so each participant has a
relationship via a central market, rather than a plethora of direct bilateral relationships. This is for four
principal reasons:
• The prosumers’ PV generation and the electricity used by consumers must travel over a
distribution network. The operation of this network is coordinated by the distribution company,
not the peers in the transaction.
• As a third party’s (and not the peers’) distribution network is used, the prosumer will be paid for
the electricity it exports into the network, and the consumer will pay for the power it uses.
• The peers could not be expected to bilaterally or multilaterally negotiate contract prices with
each other in real time.
• The participants also require ongoing access to grid electricity for consumption requirements
beyond those that can be satisfied by the P2P pool, which is why the model commonly
assumes this role is undertaken by the retailer as per the current Rules.
As expected therefore, the model demonstrates that P2P trading does not create additional economic
value, where a reduction in retail and network charges is not achieved through at least a
commensurate reduction in costs achieved through DLT or a P2P market. In this case value is only
shifted away from the retailer and/or network, depending on the approach adopted16.
If the current Rules regarding network asset remuneration are applied, it is only the retailer who can
lose revenue for prosumers and consumers to gain. As such, the ongoing suitability of network cost
recovery and pricing frameworks are a key area for further investigation.
In the last scenario, the arrival of a low-cost P2P market administrator captures significant revenue
from traditional retailers and delivers this value to consumers and prosumers. There are currently
several practical and regulatory challenges to this happening in practice.
A successful P2P
Consumers benefit most from Scenario 3, the low-cost P2P administrator.
Scenario 2 (load shifting) could offer benefit to all participants, in which prosumers maximise their
income by being able to trade all their PV output in the market, while networks gain operational
efficiencies from the smoothing of localised asset loads. Smoothing load in this way may also benefit
retailers by reducing wholesale purchase costs.
However, it should be acknowledged that the value in this scenario stems from the reduction in
network impacts due to load shifting17, and that there are also products and means available to
16 The model built does not isolate the economic value from load shifted trades either. Some potential economic value for networks and prosumers was observed in the form of altered grid-load curves, as more of the locally generated power was consumed locally, but the absolute economic value of those alterations at scale was not assessed.
17 Please see the University of Technology Sydney’s “Facilitating Local Network Charges and Local Electricity Trading” report for further details: https://www.uts.edu.au/research-and-teaching/our-research/institute-sustainable-futures/our-research/energy-and-climate-2
34
reward load shifting, including time of use and demand tariffs, demand response technology and
virtual power plants (VPPs).
To summarise, there are three challenges with moving to this specific peer to peer scenario in future:
• There must be sufficient flexible load, storage and/or ‘intelligence’ in the P2P market to shift the
load significantly and this is likely to be too expensive for the P2P market to cover alone.
• Mechanisms to incentivise and reward matching local generation to consumption needs
through a P2P framework should be further explored, as they do not directly remunerate this
relationship at present18.
• The networks and retailers must have ways of recording how much net improvement in asset
utilisation and wholesale exposure can be credited to the market. This would be complicated,
as load is unlikely to move as dramatically and instantaneously as depicted in the load-shifting
scenario.
Arguably, there are significant benefits for P2P trading that are not necessarily economical and the
current model does not value. For example, premium payments for green energy, the emotional or
environmental benefits associated with directed trades to friends or family, or improving return on
investment in DER through providing an additional value stream to customers. Future work should
endeavour to understand and capture these important nuances.
Addressing the hypothesis and initial questions
It appears most likely that P2P trades will initially occur between solar PV owners and individual
consumers, using market meters which provide the standardised and auditable reference point for
transactions. Over time, with developments in intelligent technology, and as confidence in a local
market grows, we envisage the trades devolving further to individual devices within and across
homes, as EVs or other specific load nodes ‘bid’ against the neighbours for DER output19. Digital
meters and a deeper understanding of elasticities of supply and demand would facilitate such trades.
A valid P2P trade could be identified when demand existed for electrons exported by a prosumer in
the registered market. This would be transacted automatically and both consumer and prosumer
would be better off for having used the P2P, rather than selling/buying from the grid, respectively.
Peers will trade PV output against demand, with prosumers being paid slightly more than market rates
(RFIT) to supply their local market.
Next Steps
We would propose:
1. Building out the current model to include a more diverse range of customers and longer ranges
of historical load data; simulating different customer preferences – for green energy, directed
trades; assessing the impact of battery storage and demand response events on a customer’s
18 It is noted that this has been the impetus behind the recent introduction of more cost-reflective pricing by networks, but we believe the regulatory framework could encourage more innovation. Further, to meet immediate or acute network needs, networks are obliged to consider potential ‘non-network’ options. Non-network options commonly focus on peak demand management in a constrained area of the network, and will include elements of load shifting.
19 Please note the data provided for this project did not allow for the evaluation of the future state at this point.

35
P2P trading volumes and assessing the relative impacts of a fixed network ‘access’ charge that
can enable a P2P market.
2. Assessing appropriate pricing of access to the grid (and network cost recovery) in a future with
high penetrations of DER;
3. Using the current model to create and assess specific customer behaviours and preferences in
more detail to try to create bespoke elasticities of demand and supply;
4. Based on the results, extending the virtual model to a real-world trial with a larger sample size
and integrate DLT if appropriate to assess the revenue and cost impacts for different
stakeholders. This would provide deeper insights to the emotional or environmental benefits
associated with directed trades to friends or family and providing an additional value stream for
DER;
5. Exploring the opportunity for network service providers to stimulate the growth of P2P markets
by offering a reduced network charge for local peer to peer trades. Although this concept has
been explored before (for example, the recently declined rule change request for Local
Generation Network Credits) there could be opportunity for a network to trial this approach within
a defined area through funding from the Demand Management Incentive Scheme, or Demand
Management Innovation Allowance (details of which are currently being determined by the AER).
Trialling these arrangements in a confined area are would allow for practical assessment of the
up-take and impact of peer to peer markets and stimulate innovation in products and services.
This approach is also in line with recommendations in the Finkel Review to allow for trials of new
approaches and technologies. Such arrangement would also allow the network service providers
to understand how they might approach network pricing to support customers desires for
innovative products, while ensuring these do not aversively impact other customers through cross
subsidisation.
6. Finally, using the outcomes of the real-world trial to support policy makers and regulators with
specific recommendations on how to make informed, proactive decisions about enabling peer-
to-peer markets, as well as supporting AGL with specific advice on how to provide additional
value to their consumer base.
36
9 Stage 1 Appendices
International peer-to-peer energy markets
Utilities around the world are experimenting and innovating in energy trading under peer-to-peer and
distributed ledger technology frameworks. Often, the degree of implementation depends directly the
regulatory flexibility of the country in which they offer their services.
Market leaders are assessing blockchain databases to streamline transaction processing and reduce
transaction costs, as well as participating in the value chain created by direct or completely
decentralised P2P markets. Table 5 lays out some of the international trials, start-ups and innovative
markets under development, many of which are limited trials and often under the auspices of
universities, utilities and public agencies.
Table 5: International examples of the application of DLT and P2P in utilities (update based on “Utilities and Blockchain Pilots: A Global Snapshot” – The Energy Collective, 2016)
P2P Trading EV charging
using DLT
Notable
Start-ups
Renewable
Energy DLT
Bitcoin
Meter
Payments
Wholesale
Trading (via
DLT)
Alliander Chargepartner
EVMatch GENERcoin Marubeni BTL
Co-Tricity Elbnb Adpteve Smappee bankymoon New4.0
Fortum Innogy Filament SolarCoin BAS Ponton
LO3 Energy Oxygen Initiative
Fortum Solarplaza Bitpay Priogen
PowerLedger Share&Charge
GSy Vector Elegant Qiwi
Powerpeers Slock.it NExergy Enercity Wien Energie
Selectricity ZF The Sun Exchange
PEY Yus
Vector Volt Markets Wanxiang
Table 6 and the subsequent section provides some background on how these markets have come
about, and specifically focuses on the policy and regulatory evolution that has permitted P2P or DLT
transactions to be officially recognised, but perhaps not yet to flourish.
Table 6 Regulation summary from key international comparator markets
Country Company Policies and regulation
Germany Sonnen P2P may use the grid, but excess energy cannot be fed
into the grid, so net exchange between consumers must
always be zero
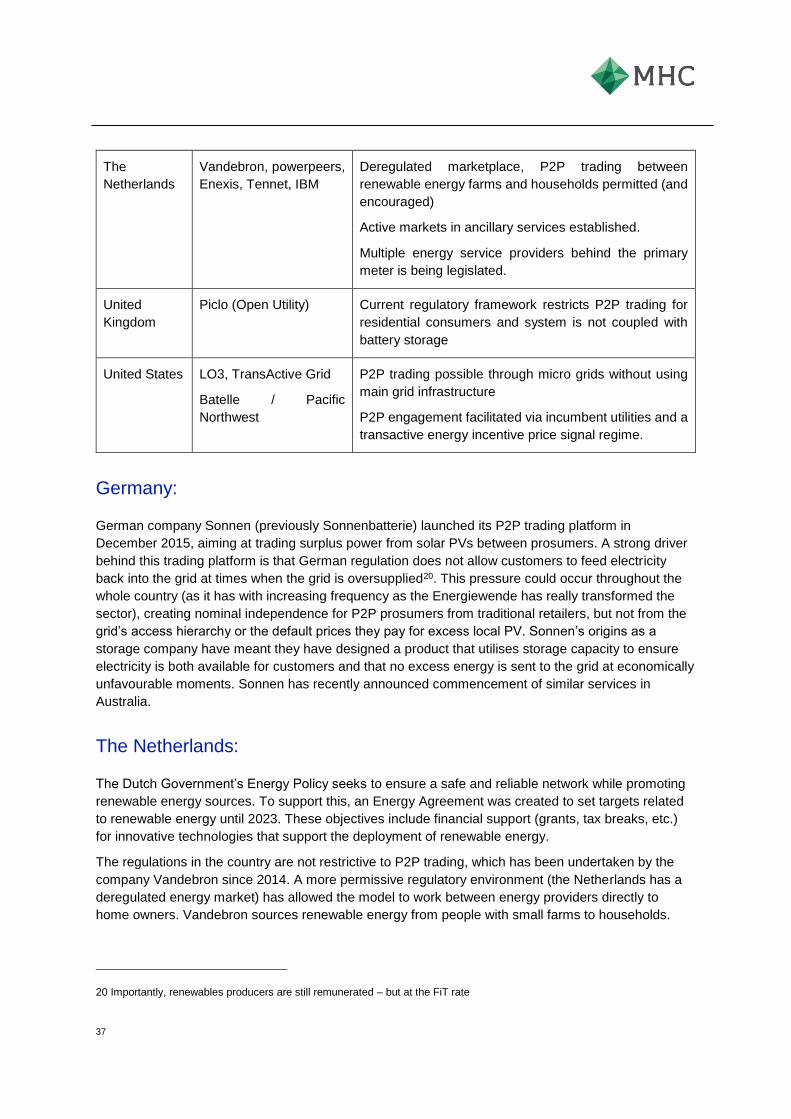
37
The
Netherlands
Vandebron, powerpeers,
Enexis, Tennet, IBM
Deregulated marketplace, P2P trading between
renewable energy farms and households permitted (and
encouraged)
Active markets in ancillary services established.
Multiple energy service providers behind the primary
meter is being legislated.
United
Kingdom
Piclo (Open Utility) Current regulatory framework restricts P2P trading for
residential consumers and system is not coupled with
battery storage
United States LO3, TransActive Grid
Batelle / Pacific
Northwest
P2P trading possible through micro grids without using
main grid infrastructure
P2P engagement facilitated via incumbent utilities and a
transactive energy incentive price signal regime.
Germany:
German company Sonnen (previously Sonnenbatterie) launched its P2P trading platform in
December 2015, aiming at trading surplus power from solar PVs between prosumers. A strong driver
behind this trading platform is that German regulation does not allow customers to feed electricity
back into the grid at times when the grid is oversupplied20. This pressure could occur throughout the
whole country (as it has with increasing frequency as the Energiewende has really transformed the
sector), creating nominal independence for P2P prosumers from traditional retailers, but not from the
grid’s access hierarchy or the default prices they pay for excess local PV. Sonnen’s origins as a
storage company have meant they have designed a product that utilises storage capacity to ensure
electricity is both available for customers and that no excess energy is sent to the grid at economically
unfavourable moments. Sonnen has recently announced commencement of similar services in
Australia.
The Netherlands:
The Dutch Government’s Energy Policy seeks to ensure a safe and reliable network while promoting
renewable energy sources. To support this, an Energy Agreement was created to set targets related
to renewable energy until 2023. These objectives include financial support (grants, tax breaks, etc.)
for innovative technologies that support the deployment of renewable energy.
The regulations in the country are not restrictive to P2P trading, which has been undertaken by the
company Vandebron since 2014. A more permissive regulatory environment (the Netherlands has a
deregulated energy market) has allowed the model to work between energy providers directly to
home owners. Vandebron sources renewable energy from people with small farms to households.
20 Importantly, renewables producers are still remunerated – but at the FiT rate
38
For Enexis, IBM are developing a blockchain based sub-metering, as an alternative for multiple smart
meter setups as is required in upcoming legislation in the Netherlands. Large energy consuming IoT
appliances will record their energy on the blockchain and provide the sub-metering data to the smart
meter. Enexis, the meter operator, will create billing determinant data based on the smart meter reads
in combination to the blockchain. On a business level this means that concurrent energy delivery by
multiple retailers can be facilitated (eg a different retailer to charge you EV, vs power the home).
In another highly cooperative project led by the TSO Tennet, along with Vandebron, IBM, Sonnen,
and Tesla, DLT is being deployed to manage aggregated flexibility services (both energy and
demand) in an ancillary market to assist overall grid balancing in both the Netherlands and western
Germany.
A bigger shift is occurring with powerpeers, a venture by Vattenfall AB (the biggest utility in the Nordic
Region), which has indicated they will transition out of their current business model. The trading
platform they have created allows other companies (e.g. solar panel installers) to sell energy services
through Vattenfall’s platform by paying subscription fees starting at €6.99. The platform will also allow
consumers to buy excess energy off their neighbours’ roofs. Powerpeers is available in the
Netherlands and may soon expand to Germany, Sweden, Finland and France.
United Kingdom:
OFGEM, the UK’s National Regulatory Authority for gas and electricity markets, created a framework
for setting price controls for network companies called RIIO (Revenue = Incentives + Innovations +
Outputs). This uses a performance based model to set price controls to benefit consumers. Although
the OFGEM framework seeks to fund innovation and create competitive prices through this
framework, the Electricity Act 1989 (that regulates electricity supply and distribution licence
conditions) is still restrictive of P2P trading. It seems there are three predominant challenges limiting
P2P trading schemes in the UK: no allowance for partial network charges, restrictions for commercial
use battery storage and the requirement of a licence to sell electricity to households.
UK based Open Utility (running the Piclo marketplace in collaboration with renewable supplier
GoodEnergy) has highlighted these restrictions. The platform allows the owners of small-scale
renewables to sell their excess electricity directly to local commercial users, but this trade must occur
immediately as battery storage does not form part of the trading model.
In the UK, storage is treated as both a source of demand and of supply. Therefore, networks must
comply with two sets of regulations, making the use of this technology inefficient. Although this
regulation does not directly affect residential storage, Open Utility is subject to the regulations
applicable for networks too.
Piclo does not offer more cost-effective energy as they must still pay the full network charges for
locally-sourced electricity. Open Utility is developing a change proposal to cut distribution network
operator (DNO) charges when sourcing electricity from nearby generation.
In addition to these limitations, Piclo is currently only available for businesses. Selling electricity to
households in the UK requires a specific licence, which prohibits a P2P market between households.
United States of America (Pacific Northwest, New York, others):
39
From 2009 to 2014 with significant funding from the American Recovery and Reinvestment Act,
Batelle, Pacific Northwest National Laboratory, 11 US utilities, BPA, IBM and Alsthom Grid developed
a transactive energy, nodal pricing, exchange and settlement system for the US DoE with 60,000
customers, 90,000 participating devices and over 500MW dispatchable DER over 5 states (DoE,
2015). The large-scale demonstration showed that nodal pricing and market based systems can
create incentive and automated response on a wide scale. While DLT was not deployed, the system
used incentive signals to coordinate a broad range of customer and utility assets, including demand
response, distributed generation and storage, and distribution automation.
New York is a deregulated market, in which distribution is separated from generation. The state’s
Public Service Commission (PSC) created the Reforming Energy Vision (REV) to support the creation
of a decentralised and resource-diverse power supply system.
The microgrid provider TransActive Grid (TAG) is piloting peer-to-peer energy exchange using
blockchain, which would allow for a direct energy sell between consumers. They are currently working
on a proof-of-concept for this model with utility LO3 Energy. However, this is not a transaction across
the utility grid but a series of direct bilateral relationships. The pilot consists of connecting
neighbouring buildings using microgrid technologies to transfer energy instead of making use of
traditional infrastructure.
The REV envisages the creation of Distributed System Platforms (DSPs) by incumbent utilities, which
would then become Distributed System Platform Providers (DSPPs) and facilitate trade between
Distributed Energy Resources (DERs) and retail customers (including buying and selling power,
network support and ancillary services). Utility DSPPs may not own DERs under this model, but will
have financial incentives for successfully providing services to customers that increase the integration
of renewables into the grid. This exchange system could be leveraged by P2P trading companies.
As part of this program, NY REV’s May 2016 Order created changes that allows utilities to get profits
from new sources, including market-facing platform activities (called Platform Service Revenues). In
addition, the Order sets out Earning Adjustment Systems as transitional outcome-based efficiency
measures for utilities. These earning adjustments include interconnection between utilities and eco-
friendly sources and system efficiency to assist in peak decrease and load factor improvement.
PSRs are relevant to P2P trading as they incentivise energy profits related to operating and making it
possible for distribution-level markets to exist. This process seeks to separate monopoly services
from services that might be performed by third parties. The new model is looking for rate design
modifications that increase chances of customers getting involved in DER markets by increasing
information sharing (utilities may no longer charge customer for sharing data) and affordability of the
grid. Another initiative which may be adopted under this new model, the Smart Hour Rate, would
allow customers to offer load moving, peak decrease, voltage and other secondary services.


41
IBM Stage 2 Report
42
1 Summary: Stage 2
In this report, we assess and evaluate the feasibility of using Distributed Ledger Technologies (DLT)
for peer-to-peer (P2P) energy trading using distributed renewable energy technologies. This report
builds on the initial study performed by Marchment Hill Consulting (MHC), which focused on
determining the potential economic value of P2P energy trading in a virtual trial. The report,
henceforth referred to as ‘the Stage 1 report’, modelled three possible scenarios examining the impact
of changing either electricity pricing structure or customer energy usage behaviour for such P2P
markets to develop. Based on the scenarios laid out in the Stage 1 report, this study evaluates the
suitability of applying DLT to a P2P energy trading market model.
To this end, we derived two possible market structures: one broadly operating within the current
regulations and encompassing prosumers and consumers continuing existing relationships with a
single retailer, and another which extends trading to multiple retailers and would require changes to
network pricing and/or to existing market settlement processes. We have concluded that DLT provide
value only in the case of the second market structure, which applies to only Scenarios 1 and 3
presented in the Stage 1 report. Within the context of the selected market structure we have
discussed the benefits and the potential role that DLT could play.
DLT(s) provide real value in scenarios where multiple organisations have a stake in shared data and
processes for which accountability and reconciliation matter. Participants in a DLT form a business
network that governs their roles and protocols of operation. In the P2P energy trading market
discussed in this report a business network consisting of the following parties emerges: Consumers
and Prosumers, Retailers, Transmission and Distribution Network Services Providers, Market
Regulators and Operators, and Ombudsman. To further qualify the value of DLT(s) we evaluated the
needs of a P2P energy trading market against the criteria IBM uses to assess the applicability of
DLT(s) in multiple industries. These include concerns about security, the need for reconciliation of
views, auditability, immutability of records, and existence of governing policies.
Besides the suitability of DLT from a purely modelling standpoint, we outlined some of the key
considerations in building such a trading model by highlighting the role that DLT(s) would play from
the perspective of the overall system functions, data models, and scalability requirements. One
important observation is that DLTs are not currently suitable for high-frequency and high-volume
transactions. This limitation has implications for the market structure selected for exploration. For
instance, while it could be of interest to store all Prosumers and Consumer transactions in the ledger,
the volume and frequency of such data make this difficult to maintain effectively using DLT(s).
Specifically, we propose an approach where the ledger will keep track of
1. trading instructions provided by Prosumers and Consumers but not the individual transactions
for energy trades associated with any given user, and
2. the history of net P2P trading positions between Retailers for the aggregated volume of P2P
trades undertaken by their contracted Consumers and Prosumers.
Therefore, the definition of smart contracts enacting the business logic in the ledger will be limited to
such entities.
Such an approach puts clear boundaries between the roles and responsibilities of DLT(s) and existing
systems. In our view, Retailers play a pivotal role in this scenario as they will be the intermediaries for
Consumers and Prosumers for the shared ledger and will also be the source of the detailed
transaction data that would allow for the aggregated trading positions accounted in the ledger on a
43
periodic basis. We envisage that to serve the needs of their customer base they will develop
capabilities for Consumers and Prosumers for defining trading instructions.
The other entities identified as having a stake on the business network primarily play a role of
interested parties seeking to access and monitor information stored within a P2P energy trading DLT.
They benefit from DLT(s) as it provides them with an untampered, auditable view of the P2P
renewable energy trading market, but do not actively contribute to generating transactions. Their
interests are dictated by the role they play in the market and therefore: 1) they seek different
information, or 2) do not require a complete view of the ledger. This is also true for the network
providers, which are primarily interested in accessing and modifying the information about their
customer base (unless of course they are directly participating in the market). This requirement
presents a need for the adoption of permissioned DLT(s) through which participants in the network
can be restricted to a set of relevant entities, and their roles within the business network prescribed.
We have also performed a preliminary analysis of the specific data and business processes that
would need to be managed by a DLT, and assessed whether the current capabilities of DLT(s) would
suffice to support the performance requirements of these processes. Overall, the results are positive
and the above considerations, which are further developed in this report, make a strong case for
using DLT(s) to support and enable a future of P2P renewable energy trading markets.
44
2 Review of Distributed Ledger Technology
Readers of this report are encouraged to develop a basic understanding of Distributed Ledger
Technology. Distributed Ledger Technology is a relatively new emerging technology and there are still
variations in how terminology related to it is used across industries. Those with an existing
understanding of Distributed Ledger Technology should still review this section of the report to
understand the terms used in the rest of this report.
Ledgers
Ledgers are groups of records maintained by legal entities (individuals, corporations and
governments) that record facts about assets, most frequently the movement (i.e. transfer of
ownership) of assets between themselves and other entities – such transfers are called transactions.
Ledger records are the basis of accounting systems that are used to facilitate the management of
those entities, and ultimately form the basis of reports that entities are legally required to produce e.g.
individuals must submit tax returns, corporations must submit tax returns and annual reports to their
shareholders and government regulators.
Ledgers have existed for centuries and their form has evolved as new technologies have been
invented. Contemporary ledgers are typically implemented as electronic records stored in
computerised databases.
In the context of this paper, the assets that are primarily of interest are energy and the information
assets needed to support the rules for trading that energy.
Throughout the long history of ledgers, they have primarily been a tool that served a single entity i.e.
each ledger has had a single owner who has been responsible for maintaining the integrity
(truthfulness) of the ledgers they control. Where assets flow between different unrelated entities, each
entity recorded that fact in their own ledgers, using various source documents or data feeds that are
exchanged between the entities as evidence that a transaction occurred e.g. purchase orders,
invoices, payment receipts, meter readings etc.
Transactions are governed by business rules codified in contracts between the parties to the
transaction. Contracts specify the pre-conditions that must exist before an asset transfer can occur.
Contracts established between entities may also require the transfer of two or more different types of
assets in a coordinated manner, with a specific sequence and with specific timing i.e. a trade of one
type of asset for another. For example, many transfers of physical assets require a corresponding
transfer of monetary assets i.e. a payment.
Many real-world transfers of assets may involve multiple entities as an asset moves between its
originating entity and ultimate consuming entity in a supply chain. Often entities that have no existing
relationship or trust with one another rely on multiple intermediaries to facilitate an asset transfer.
Additional entities such as regulators or auditors may require visibility of asset transfers. In this paper,
the network of all entities involved in such transfers are referred as a business network.
Complex and time-consuming settlement processes have evolved to ensure that asset transfers
within a business network can be successfully completed between the entities involved with minimal
risk. These settlement processes often incorporate deliberate delays to allow sufficient time for the
entities involved to exchange the information needed to support the process i.e. to keep their
45
independently maintained ledgers synchronised. During these delays, the assets involved might not
be available for other purposes, which may result in a cost to the entities involved.
Disputes can sometimes arise when different entities have come to different conclusions around
whether and when an asset transfer actually occurred and whether the transfers complied with the
terms of the governing contract i.e. their independently maintained ledgers do not agree. Significant
resources are often expended in resolving such disputes at a cost to all entities involved.
Distributed Ledgers
A shared ledger can enable multiple entities to rely on (i.e. trust) a common ledger to record the
transfer of assets.
It is possible to create a shared ledger by appointing an independent 3rd party to manage the ledger in
such a manner that all entities involved in an asset transfer mutually agree to trust it.
For example, land title registries operated by (or on behalf of) many governments can be considered
to be a form of shared ledger that is trusted as a consequence of the government statutes under
which they were established. Such registries have simplified the processes associated with the
transfer of land and reduce the likelihood of disputes as all entities that use the registry accept that it
is a single “source of truth”.
Distributed shared ledgers allow the establishment of shared ledgers that all entities in a business
network can trust without the requirement for a mutually trusted 3rd party to maintain a single ledger.
Distributed shared ledgers achieve this by establishing multiple replicas of the shared ledger and a
Distributed Ledger Technology is used to ensure that all such replicas are identical. The replicas
can be under the control of different entities and geographically distributed if desired.
In current usage, the term distributed ledger is used to describe such a distributed shared ledger.
Note that the practical use of a distributed ledger may still involve mutually trusted 3rd parties for other
purposes e.g. certifying the identity of those entities who have permission to access the distributed
ledger.
It is possible (and common) that some entities may choose not to maintain their own replica of the
shared ledger and instead choose to trust another entity to interact with the shared ledger on their
behalf should this suit their purposes.
Like other forms of shared ledgers, a distributed ledger can simplify many of the processes that were
previously required to accurately maintain independently managed ledgers when assets were
transferred between entities as well as reducing the likelihood of disputes.
For a distributed ledger to be useful, it must be trusted by all entities that depend on the ledger. The
level of trust required for a particular use case will vary depending on the purpose of the ledger and
what other sources of trust exist external to the ledger.
In order to be trusted, distributed ledgers must have mechanisms to provide:
• Consensus - a method for the various entities that share the ledger to agree when an entry
should be added to the ledger and that the contents of that entry are a true and correct
representation of a valid transaction.
• Provenance - a method for maintaining the full history of an asset from when it first came into
existence through all the transactions that subsequently deal with the asset.
46
• Immutability and finality - a method for ensuring that ledger entries cannot be changed once
consensus is achieved and that they become a permanent (final) part of the ledger.
Some uses of distributed ledgers may also require privacy. The level of privacy required will vary
depending on the purpose of the ledger. For example, some uses may require that the identity of
participants in a specific transaction cannot be determined despite other details in the transaction
being available to other entities in the business network.
Blockchain
A blockchain is a method for building a distributed shared ledger that can provide consensus,
provenance, immutability and finality when implemented appropriately.
In a blockchain, groups of ledger entries are periodically accumulated into a block. The blocks are
linked together in an ordered chain that starts with a genesis block. Each block contains a
cryptographic hash of the prior block linking the blocks together in a manner that allows the global
order of the ledger entries in the chain to be established and to verify that the contents of a particular
block have not been modified. These characteristics underpin the capability for a blockchain based
distributed ledger to provide provenance, immutability and finality.
A complete Distributed Ledger Technology combines a blockchain with an appropriate consensus
mechanism and protocols for distributing blocks across replicas so they remain synchronised.
The use of a blockchain for building a distributed ledger was first popularised by Bitcoin (Nakamoto,
2008), which is a cryptocurrency (a form of virtual currency). Bitcoin implements a distributed ledger
to record the transfer of bitcoins (the asset) between anonymous entities using a consensus method
called “Proof of Work” (PoW).
Since Bitcoin was conceived, other blockchain-based implementations of Distributed Ledger
Technology have been developed e.g. Hyperledger Fabric (Hyperledger Fabric Project, 2017) and
Ethereum (Ethereum Project, 2017). While the core concept of a blockchain is common to many
Distributed Ledger Technologies, there is significant variation in both the functional capabilities and
the non-functional characteristics of those technologies. Some of these differences are explored in
subsequent sections of this paper.
Current usage of the term “distributed ledger” is frequently referring to a ledger implemented using a
blockchain and these terms are often used interchangeably. However, these terms are not strictly
interchangeable as there are some Distributed Ledger Technologies that have been proposed that do
not incorporate a blockchain e.g. R3 Corda (Hearn, 2016).
Smart Contracts
Some Distributed Ledger Technologies support an additional capability called a smart contract.
Smart contracts enable the terms (i.e. business rules) of the contracts that govern the transfer of
assets between entities to be captured in computer programs.
The programs that implement smart contracts are tightly coupled to the distributed ledger and can
validate that all necessary pre-conditions to a transaction are satisfied before allowing the transaction
to be recorded in the ledger i.e. the only way the ledger can be updated is via the smart contracts.
Smart contracts may use existing information in the ledger as well as information from other trusted
sources to perform such validation.
47
Smart contracts can also generate events that notify other systems when a specific set of conditions
are satisfied as the result of a transaction that is successfully recorded in the ledger. Such events can
be used to automate the initiation of further transactions. For example, when the transfer of one type
of asset occurs, a smart contract might automatically initiate another type of asset transfer as part of a
trade specified in a contract.
Smart contracts allow shared processes within a business network to be standardised, automated
and enforced to increase the integrity of the ledger and enable entities to depend upon it as a single
“source of truth”.
The deployment of smart contracts needs to be managed in a manner similar to the ledger itself i.e.
there need to be mechanisms for providing consensus, provenance, immutability and finality as to the
contents of the computer program that is the basis of each smart contract.
Permissioned Distributed Ledgers
In the Bitcoin distributed ledger implementation the entities that participate in the transfer of assets
are anonymous and any entity can participate i.e. no permission is required. Ledgers of this type are
called non-permissioned or permission-less distributed ledgers.
Many business networks may have a need for a distributed ledger that is only accessible to a closed
community of known entities. For example, some business entities are required to comply with “Know
Your Customer” (KYC) laws that have been implemented to prevent money laundering and related
criminal activities.
Permissioned Distributed Ledger Technologies have been developed to support these requirements.
Such technologies require that entities are identified so that their permissions can be determined i.e.
anonymous entities are not permitted to use the shared ledger. However, the Distributed Ledger
Technology may still provide privacy and confidentiality, so that the activities of an entity are only
visible to those participants of the business network that have a need to know. Both Hyperledger
Fabric and R3 Corda are examples of permissioned Distributed Ledger Technologies.
Consensus Methods
Distributed Ledger Technologies vary significantly in the methods they use to achieve consensus i.e.
that an entry should be added to the ledger and that the entry is true and correct. The consensus
method used can have a significant impact on the cost of maintaining the distributed ledger, the time
to achieve consensus and the throughput (i.e. transaction rate) that the distributed ledger can support.
The distributed ledger in Bitcoin uses a consensus method called “Proof of Work” (PoW) that is
particularly computationally expensive (by design) and consumes vast computing resources
(Deetman, 2016).
The PoW consensus method requires participants to solve a complex cryptographic puzzle as a
precondition for the formation of a new block in the chain. The real costs associated with performing
this work motivate participants to achieve consensus on the truth. The participants that perform PoW
are compensated for their efforts with rewards of cryptocurrency that effectively passes on the cost to
all users of the distributed ledger.
Subsequent permission-less cryptocurrency-based Distributed Ledger Technologies have adopted
different consensus methods that are less computationally expensive and therefore require fewer
48
resources. For example, Ethereum uses a consensus method called “Proof of Stake” (PoS). Both
PoW and PoS rely on a cryptocurrency to facilitate the consensus method.
Permissioned Distributed Ledger Technologies where participants are identified, have been
developed that use consensus methods that do not require a cryptocurrency. Examples are those
based on variants of Byzantine fault-tolerant (BFT) state machines (Vukolic, 2015). These methods
have been chosen to provide higher transaction throughputs and lower consensus latency than those
methods typically used by permission-less Distributed Ledger Technologies.
Some Distributed Ledger Technologies may also provide pluggable consensus where the
consensus method can be selected based on the particular needs of the business network. Where
there are lower levels of existing trust, more rigorous forms of consensus can be used. Where there
are higher levels of existing trust, less rigorous forms of consensus can be used that may provide
higher levels of transaction throughput. Both Hyperledger Fabric and R3 Corda provide such a
capability.
Deployment Models
A business network considering the use of a distributed ledger has several choices in how it is
deployed.
At one extreme, the business network can require each participant to maintain its own replicas of the
distributed ledger. This model requires the lowest level of trust between the participants of the
business network as each participant is in complete control of its replicas.
At the other extreme, the entire distributed ledger can be deployed under the control of a single
trusted 3rd party. In such a deployment only a small number of replicas may be required, sufficient to
ensure that the distributed ledger can continue to operate in the event of a disaster that destroys a
complete replica.
Other models in between these extremes are also possible. For example, only a subset of participants
in a business network may maintain replicas of the distributed ledger. Other participants would access
the distributed ledger via a participant that maintained replicas.
Non-Functional Properties
In evaluating the potential use of Distributed Ledger Technologies for a particular use case, it is
necessary to compare the non-functional requirements of the use case with the non-functional
properties of candidate Distributed Ledger Technologies.
Properties that typically need to be considered include:
• Latency – The time taken for a proposed transaction to be included in the ledger and for it to be
accepted as true. Note that in some Distributed Ledger Technologies (specifically Bitcoin), the
consensus method used implies that it takes some time after a transaction first appears in the
ledger before the probability of it being valid is universally accepted i.e. the time for it to be
accepted as true can be significantly longer than the time taken for a transaction to first appear
in the ledger.
• Transaction throughput – How many transactions can be processed by the distributed ledger
per unit time.
49
• Network scalability – How many ledger replicas can be synchronised before latency and
transaction throughput are adversely impacted.
Public non-permissioned distributed ledgers such as Bitcoin are designed to support high network
scalability, but offer only low transaction throughput and can have significant latency. The current
Bitcoin implementation has an upper transaction throughput of approximately 7 transactions per
second (for the smallest feasible transactions) and the time before a proposed transaction is
universally accepted as true can be 30 minutes or more.
Permissioned distributed ledgers such as Hyperledger Fabric are designed to provide high transaction
throughput, lower latency but do not provide the same levels of network scalability.
Recent independent benchmarks of Distributed Ledger Technologies (Dinh, et al., 2017) suggest that
permissioned distributed ledgers can achieve transaction rates exceeding 1000 per second for simple
smart contracts in a distributed ledger network of 8 nodes.
Where Distributed Ledger Technologies support pluggable consensus methods and smart contracts,
the non-functional properties will be dependent on the consensus method used and the complexity of
the smart contracts.
Summary
Distributed Ledger Technology is an emerging technology that can be used to record the transfer of
assets within a business network in a shared ledger that provides a single “source of truth” for the
participants in the business network.
Distributed Ledger Technologies provide mechanisms for consensus, provenance, immutability and
finality that can be exploited to simplify processes and reduce disputes within the business network.
There are significant variations in both the consensus methods used, and the non-functional
properties of different Distributed Ledger Technologies.
50
3 Background
IBM, along with AGL and Marchment Hill Consulting (MHC), is an “Activity Participant” within the
context of the ARENA Funding Agreement between AGL and ARENA.
The remaining Sections of this report (Milestone Report 2) are based on IBM’s assumptions around
the form of the peer-to-peer (P2P) market for trading energy amongst customers with distributed
renewable energy technologies. These variants of a P2P Renewable Energy Trading Platform are
based on the 3 different market scenarios detailed in the Milestone Report 1: ‘Virtual Peer to Peer
trading model – summary results report’ prepared by MHC.
• Scenario 1: Local Network benefits;
• Scenario 2: Shifting load;
• Scenario 3: A low-cost P2P administrator;
In order to validate the applicability of Distributed Ledger Technologies to each of the 3 modelled
scenarios, IBM constructed high level business services and process flows that might apply in each
case. These are described in Section 4 of this report and are constructed to match the scenarios for
consistency. We recognise however, that a number of limitations applied to the modelling:
• the scenarios were constructed with the goal of calculating potential economic value, rather
than as a full market design,
• the current Australian market arrangements and regulation create limits on the flexibility of P2P
arrangements, and
• the data set did not include details of parameters such as grid capacity or data from beyond the
meter.
Nevertheless, we note that the processes are somewhat simpler than the real world P2P energy
trading systems that IBM has built for clients in Europe and North America. In particular:
• The 3 scenarios modelled each applied an approach where the Retailer sets the price for the
energy exchanged. More complex systems allow the consumers and prosumers to agree
pricing by means of auction, reverse-auction, bid/offer matching and/or pool clearance
mechanisms;
• Network charges are modelled in each scenario as part of the cost stack seen by the
participants. Where the scenario allows for network benefits to be extracted, this is achieved by
simple elimination of TUOS charges (on the hypothetical basis that local
generation/consumption requires no transmission resources). In real world P2P systems the
network provider participates more actively - for instance as a buyer of flexibility services, as a
publisher of local marginal pricing, or through time of use (ToU) grid pricing.
51
4 Review of P2P Renewable Energy Trading Market Structure
This report assesses the applicability of Distributed Ledger Technology to facilitate the peer-to-peer
market for trading renewable energy in the context of the assumptions reviewed in this Section.
Business Network Entities
To describe the market, it is first necessary to define the entities that could potentially be involved.
The following types of entities have been considered as candidates for the business network that is
associated with a P2P energy market:
• Direct trading participants (buyer or seller) in the P2P market
• Providers of information assets necessary to support the P2P market
• Interested entities who supervise or have visibility over the P2P market
• Operator of the P2P market.
The following table defines the entities that could be part of the business network:
Entity P2P Role Description
Administrator P2P Market
operator
The P2P market operator. The administrator facilitates
the operation of a P2P market but is not a trading
participant i.e. they do not buy or sell energy.
Prosumer Direct trading
participant
A seller into a P2P market of energy generated from a
renewable system (e.g. rooftop solar) or from energy
storage (e.g. batteries)
Consumer Direct trading
participant
A buyer of energy sourced from a P2P market to meet
a portion of their own energy needs.
Retailer Information
provider/FRMP
The default seller of energy to consumers and the
default buyer of energy from prosumers i.e. the
financially responsible market participant (FRMP)
defined under current rules. The retailer is responsible
for sourcing the balance of consumers’ and prosumers’
energy, which cannot be satisfied by the P2P market.
The retailer may also provide price signals to
consumers and prosumers participating in the P2P
market.
Transmission
Network Service
Provider (TNSP)
Interested party
and HV grid
operator
Operator of the high voltage transmission network that
transports energy from centralised generation to local
distribution networks. The TNSP delivers the net
energy required to meet demand within a distribution
network i.e. the difference between the local energy
consumption and production. In the scenarios
modelled, it is anticipated that TNSPs will have limited
interested in monitoring net positions in the P2P
52
market, but in some applications, there may be a
warranted use case.
Distribution
Network Service
Provider (DNSP)
Information
provider and
electricity network
operator
Operator of distribution network that transports energy
within a geographic area between the transmission
network and consumers and prosumers. The DNSP
charges distribution use of system (DUOS) charges to
the Retailer for the net energy consumed by that
Retailer’s customers.
Although not modelled in any of the 3 scenarios, the
DNSP may also provide price signals to consumers
and prosumers participating in the P2P market, or be a
buyer of energy (or capacity) in order to reduce
network constraints.
Market Regulator Interested party
and regulator of
P2P market
Government appointed entity responsible for
implementing and enforcing regulations that apply to
energy markets. It is likely that a regulator would play a
role in overseeing a P2P market.
(Note this is different to the role performed by the
Australian Energy Regulator who regulates TNSP and
DNSP costs and charges)
Wholesale Market
Operator
Interested party Operator of wholesale energy market from which
retailers acquire energy. The retailer sources energy
from wholesale market when the total demand for
energy consumed in the P2P market exceeds the total
supply of energy produced for the customers for which
they are responsible. It is anticipated that the
Wholesale Market Operator will have limited interested
in monitoring net positions in the P2P market, but in
some applications, there may be a warranted use case.
Meter Data
Provider
Information
provider
Provides meter data on net energy consumption and
production to retailers and DNSPs.
Ombudsman Interested party Advocate for consumers and prosumers that attempts
to resolve disputes that may arise in their purchase or
sale of energy. It is possible that this role could extend
to the P2P market.
In the scenarios modelled by MHC, individuals or organisations could take on multiple roles within the
business network:
• Prosumers are individuals that are both consumers and producers of energy. A Prosumer,
while producing their own solar PV generation will also consume energy from the grid when
there is insufficient self-production to meet their energy needs, particularly during periods
where there is low solar PV generation or low prices available for their output.
53
• In Scenarios 1-2 modelled by MHC, the administrator entity is also a FRMP. Scenario 3
assumes the arrival of a low-cost P2P retailer who is assumed to be a new entrant to the
market. They perform the role of administrator, while engaging with an existing FRMP.
P2P Market Structure
The 3 scenarios modelled by MHC are:
• Scenario 1: Local Network benefits;
• Scenario 2: Shifting load;
• Scenario 3: A low-cost P2P administrator;
and can be analysed assuming two different market structures:
• Market Structure #1: A P2P market that operates broadly within the general context of existing
legislation and regulation and where P2P trades are confined to a pool that relates to a specific
Retailer. This applies to scenario 2.
• Market Structure #2: A P2P market that may require some change to existing legislation or
regulation and where P2P trades are not confined to a pool that relates to a specific Retailer.
This applies to scenarios 1 and 3.
For Market Structure #1, it is assumed that:
1. The Retailer is financially responsible for purchasing from the wholesale energy market the net
energy consumption for the Consumers and Prosumers for which they are responsible, and to
pay associated network charges which remain as they are today.
2. A Consumer or Prosumer has a contractual relationship with a single Retailer at any point in time
and the processes for switching retailers remain as-is.
3. The participants in a P2P market pool are confined to Consumers and Prosumers that have a
contractual relationship with the same Retailer.
4. There is no direct contractual relationship between individual Consumers and Prosumers. The
contract with the Retailer that is responsible for a particular Consumer or Prosumer would specify
the terms under which access to the P2P market is provided.
5. Meter data for Consumers and Prosumers is made available by the Meter Data Provider to the
Retailer that has an active contractual relationship with the Consumer or Prosumer.
6. The primary role of an Administrator is to operate a regional market whereby Consumers and
Prosumers can trade a portion of their energy consumption/production within a regional pool of
others. Therefore, in a single Retailer case in which the Retailer settles all trades, there is no
need for a separate Administrator.
7. The Retailer sets the buy and sell prices for energy traded21 within the P2P market pools
associated with the Consumers and Prosumers for which they are responsible.
For Market Structure #2, the same underlying assumptions apply as stated in points 1-4 above. In
addition to these steps it is assumed that:
1. There is a single Administrator for each geographically constrained area aligned with a DNSP’s
service area to optimise matching of consumption to local energy production, as well as to
maximise potential network benefits of local energy trading.
21 It is noted that this is a highly simplified construct devised to enable straightforward modelling of economic value created or transferred between parties. In real world P2P markets, the participants determine prices through a variety of mechanisms such as bid/offer matching, auctions etc.
54
2. The Administrator enables Consumers and Prosumers to trade within a local geographic pool of
Consumers and Prosumers; determines the price setting mechanism; applies business rules to
execute P2P trades; and facilitates settlement of net P2P trade positions between participating
Retailers.
3. With respect to P2P trades, Retailers will reach financial settlement amongst themselves for the
net P2P debit/credit positions for their contracted customers participating in the P2P market.
Retailers will settle P2P debit/credits with their customers via existing billing mechanisms (or
allow the administrator to do so), and would also be responsible for settling the debits/credits
resulting from P2P trades between their own customers.
4. There is a mechanism for DNSPs to pass on cost savings that may accrue as the consequence
of P2P trades via a reduction in network charges paid to DNSPs by Retailers22.
Market Structure #1 is essentially based on an existing trust relationship between a Retailer and
Consumer and an assumed trust relationship between a Retailer and Administrator. Since Distributed
Ledger Technology (DLT) is primarily designed to accommodate the needs of multiple business
entities to transact across trust boundaries, this model is not expected to benefit from DLT. It is
therefore not being assessed in this DLT suitability report.
The DLT suitability assessment report is based on Market Structure #2 since it involves trust
boundaries between multiple Retailers, Administrators, network operators and
Consumers/Prosumers, where use of a DLT might be justified.
According to Market Structure #2, the existing National Electricity Market (NEM) will continue to
operate largely as it does today. The growth of P2P energy trading markets, may drive further uptake
of distributed energy resources (DER), which will impact the energy supply mix in the NEM. However,
it is unlikely that P2P energy trading markets, beyond embedded networks and microgrids, will be
able to ensure a reliable and secure electricity supply without integration with the NEM. For this
reason, a P2P market will exist alongside the NEM, however the P2P market will have its own rules
and settlement processes.
The concept of geographically constrained market pools has been applied so that:
• Different jurisdictional rules can be applied in the trading and settlement processes for each
geography;
• Different entities can participate in each geography (in particular the local DNSP boundaries
may determine the pool, and different say state-based regulators and ombudsmen may have
an interest);
• Retailers may want to offer pricing or bids that vary according to NEM wholesale conditions
(which may vary across state interconnectors); and
• DNSPs may want to offer pricing or even bids in the P2P market that vary according to local
grid constraints or local marginal costs.
This last point is of particular importance and may ultimately mean that the P2P pools seeking to
extract network benefits, are defined by grid topological boundaries. One such grid segmentation may
limit a trading pool to the customers connected to a particular primary or zone substation. This level
22 While the scenario modelling used a simple reduction in TUOS/DUOS, this mechanism may be significantly more complex including direct participation in the P2P market by the DNSP.
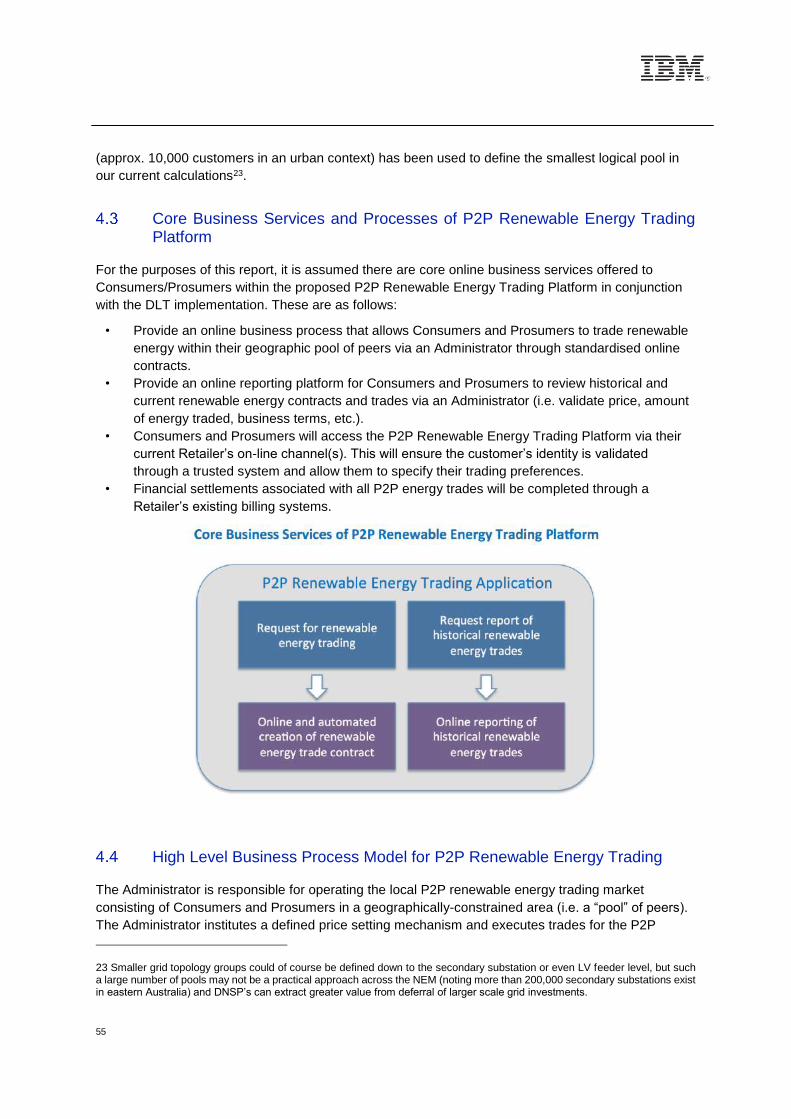
55
(approx. 10,000 customers in an urban context) has been used to define the smallest logical pool in
our current calculations23.
Core Business Services and Processes of P2P Renewable Energy Trading Platform
For the purposes of this report, it is assumed there are core online business services offered to
Consumers/Prosumers within the proposed P2P Renewable Energy Trading Platform in conjunction
with the DLT implementation. These are as follows:
• Provide an online business process that allows Consumers and Prosumers to trade renewable
energy within their geographic pool of peers via an Administrator through standardised online
contracts.
• Provide an online reporting platform for Consumers and Prosumers to review historical and
current renewable energy contracts and trades via an Administrator (i.e. validate price, amount
of energy traded, business terms, etc.).
• Consumers and Prosumers will access the P2P Renewable Energy Trading Platform via their
current Retailer’s on-line channel(s). This will ensure the customer’s identity is validated
through a trusted system and allow them to specify their trading preferences.
• Financial settlements associated with all P2P energy trades will be completed through a
Retailer’s existing billing systems.
High Level Business Process Model for P2P Renewable Energy Trading
The Administrator is responsible for operating the local P2P renewable energy trading market
consisting of Consumers and Prosumers in a geographically-constrained area (i.e. a “pool” of peers).
The Administrator institutes a defined price setting mechanism and executes trades for the P2P
23 Smaller grid topology groups could of course be defined down to the secondary substation or even LV feeder level, but such a large number of pools may not be a practical approach across the NEM (noting more than 200,000 secondary substations exist in eastern Australia) and DNSP’s can extract greater value from deferral of larger scale grid investments.
56
market. All Prosumers and Consumers in the market define energy trading instructions and
preferences through a registration process on the P2P renewable energy trading platform. For the
purposes of this report the term “trading instructions” is used to define the commercial contract terms
based on which the system automatically executes P2P energy trades.
The DLT itself does not directly record individual trades of energy blocks since the volume of such
data would be too large at scale. Instead the DLT records details of the trading instructions, including
each participant’s history of instructions over the contract period. It also stores the history of net P2P
trading positions between Retailers for the aggregated volume of P2P trades undertaken by their
contracted Consumers and Prosumers. The transaction rate requirements of this more modest
application of DLT are consistent with the capabilities of today’s DLT, while the shared ledger of the
DLT provides partial justification for the net trading positions. The detailed transaction data required to
justify the Retailer net trading positions would need to be held off-chain. This would allow Retailers to
adjust their own obligations to the wholesale market in accordance to the observed trades, to
distribute trade credits and debits to each Prosumer/Consumer, and to permit review by an
Ombudsman or Regulator.
The Retailer settles P2P trades with each Consumer and Prosumer using existing billing processes
through debiting or crediting the incremental value of P2P energy trades. This is in addition to the
standard energy bills paid by customers based on their existing energy plan and tariff.
The diagram below provides a high-level overview of the basic business processes that are
associated with the P2P trading of distributed renewable energy resources by Consumers and
Prosumers.
Each Prosumer and Consumer is able to access their P2P trade history through the Retailer’s on-line
channels(s) (see Section 4.3 on business processes required to support P2P).
Business rules need to be applied to ensure that:
• Each participant is located within exactly one eligible, local, geographically-constrained P2P
pool;
• Each block of energy is traded at most once.
Business rules governing the above eligibility checks will be coded into the DLT’s Smart Contracts,
thereby ensuring all relevant transactions are subject to these business rules.
For the purposes of this report, it is assumed that all P2P renewable energy trading is facilitated by an
Administrator within a local P2P pool, who determines pricing and allocations of P2P energy trades.
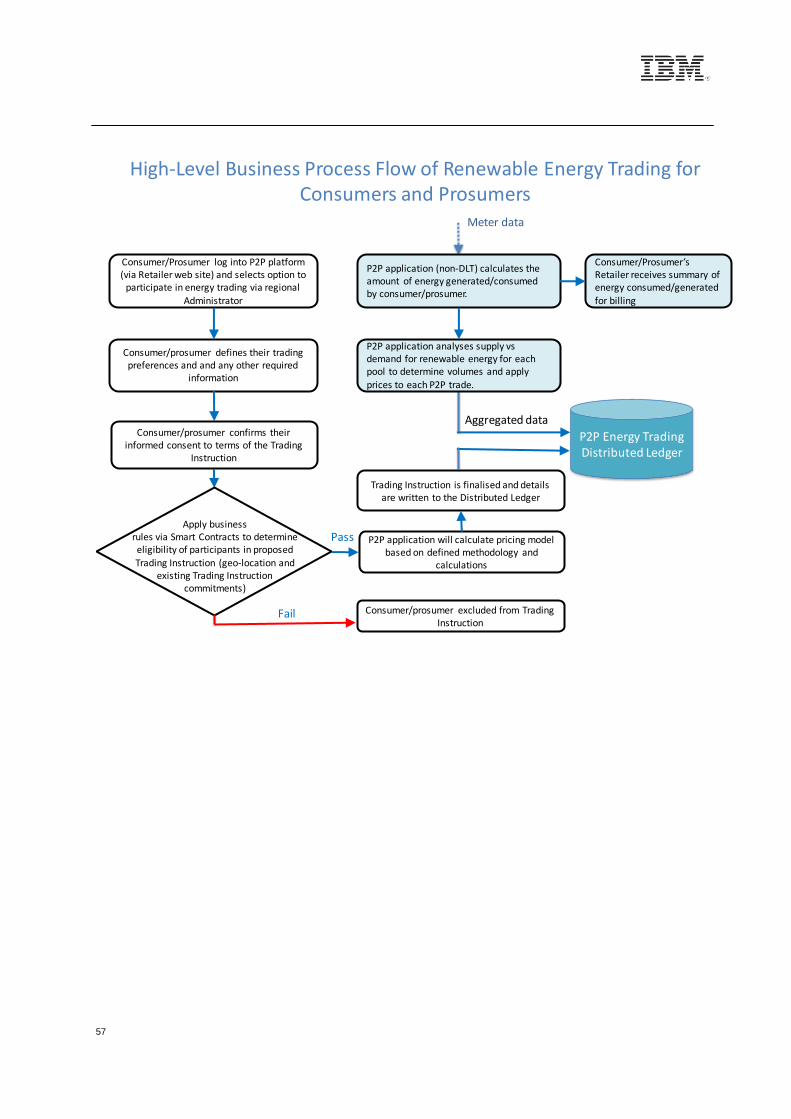
57
Consumer/prosumer defines their trading preferences and and any other required
information
Consumer/prosumer excluded from Trading Instruction
Fail
P2P application will calculate pricing model based on defined methodology and
calculations
Pass
Consumer/Prosumer log into P2P platform (via Retailer web site) and selects option to
participate in energy trading via regional
Administrator
Consumer/prosumer confirms their informed consent to terms of the Trading
Instruction
Apply business rules via Smart Contracts to determine eligibility of participants in proposed
Trading Instruction (geo-location and existing Trading Instruction
commitments)
P2P Energy TradingDistributed Ledger
Trading Instruction is finalised and details are written to the Distributed Ledger
P2P application (non-DLT) calculates the amount of energy generated/consumed by consumer/prosumer.
P2P application analyses supply vs demand for renewable energy for each pool to determine volumes and apply prices to each P2P trade.
Meter data
Consumer/Prosumer’s Retailer receives summary of energy consumed/generated
for billing
High-Level Business Process Flow of Renewable Energy Trading for Consumers and Prosumers
Aggregated data
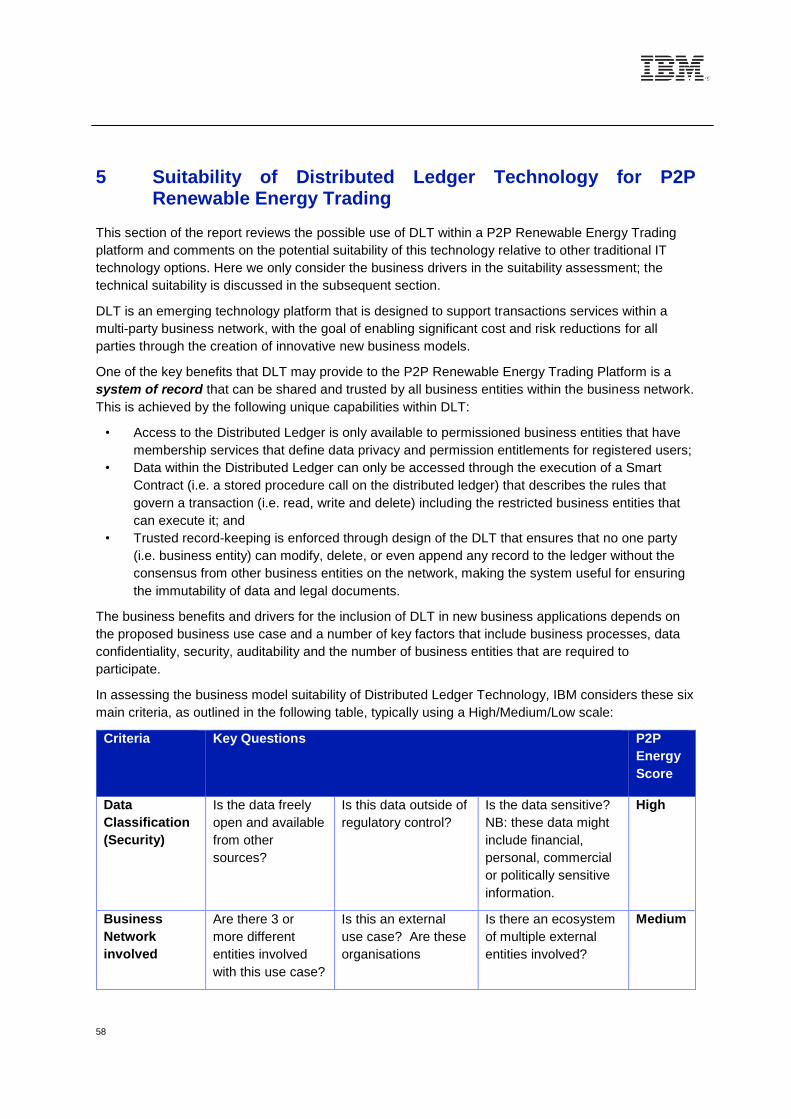
58
5 Suitability of Distributed Ledger Technology for P2P Renewable Energy Trading
This section of the report reviews the possible use of DLT within a P2P Renewable Energy Trading
platform and comments on the potential suitability of this technology relative to other traditional IT
technology options. Here we only consider the business drivers in the suitability assessment; the
technical suitability is discussed in the subsequent section.
DLT is an emerging technology platform that is designed to support transactions services within a
multi-party business network, with the goal of enabling significant cost and risk reductions for all
parties through the creation of innovative new business models.
One of the key benefits that DLT may provide to the P2P Renewable Energy Trading Platform is a
system of record that can be shared and trusted by all business entities within the business network.
This is achieved by the following unique capabilities within DLT:
• Access to the Distributed Ledger is only available to permissioned business entities that have
membership services that define data privacy and permission entitlements for registered users;
• Data within the Distributed Ledger can only be accessed through the execution of a Smart
Contract (i.e. a stored procedure call on the distributed ledger) that describes the rules that
govern a transaction (i.e. read, write and delete) including the restricted business entities that
can execute it; and
• Trusted record-keeping is enforced through design of the DLT that ensures that no one party
(i.e. business entity) can modify, delete, or even append any record to the ledger without the
consensus from other business entities on the network, making the system useful for ensuring
the immutability of data and legal documents.
The business benefits and drivers for the inclusion of DLT in new business applications depends on
the proposed business use case and a number of key factors that include business processes, data
confidentiality, security, auditability and the number of business entities that are required to
participate.
In assessing the business model suitability of Distributed Ledger Technology, IBM considers these six
main criteria, as outlined in the following table, typically using a High/Medium/Low scale:
Criteria Key Questions P2P
Energy
Score
Data
Classification
(Security)
Is the data freely
open and available
from other
sources?
Is this data outside of
regulatory control?
Is the data sensitive?
NB: these data might
include financial,
personal, commercial
or politically sensitive
information.
High
Business
Network
involved
Are there 3 or
more different
entities involved
with this use case?
Is this an external
use case? Are these
organisations
Is there an ecosystem
of multiple external
entities involved?
Medium
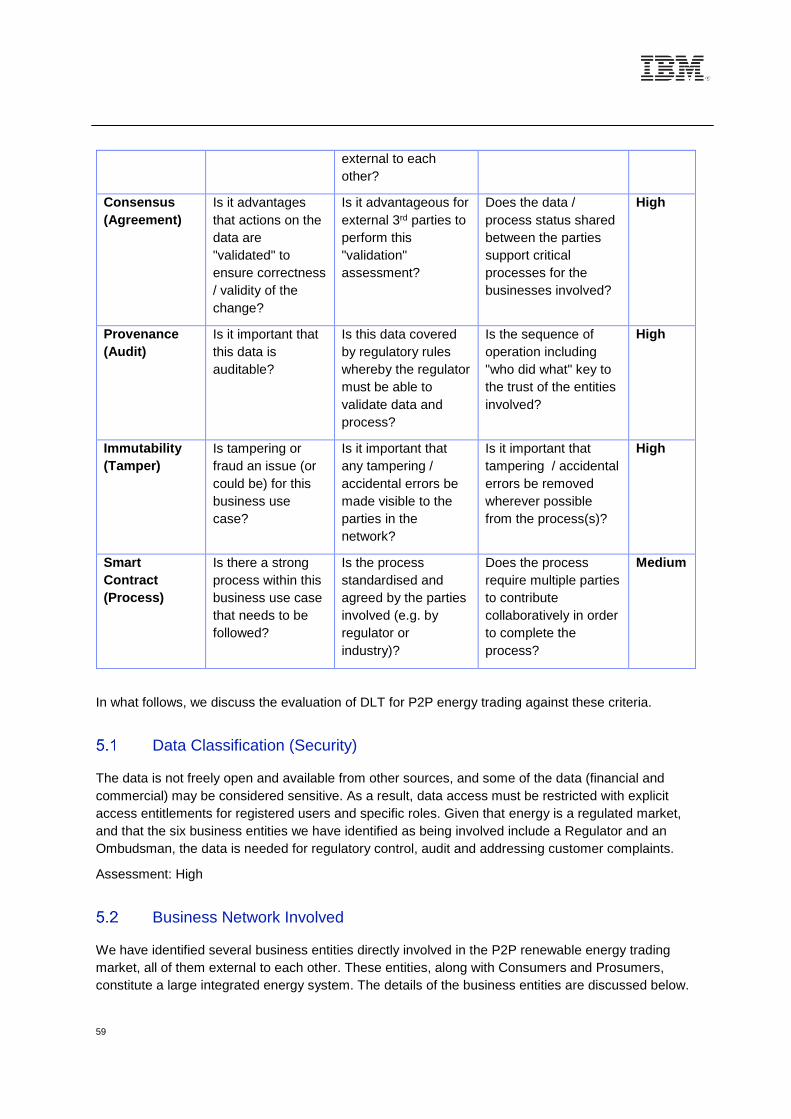
59
external to each
other?
Consensus
(Agreement)
Is it advantages
that actions on the
data are
"validated" to
ensure correctness
/ validity of the
change?
Is it advantageous for
external 3rd parties to
perform this
"validation"
assessment?
Does the data /
process status shared
between the parties
support critical
processes for the
businesses involved?
High
Provenance
(Audit)
Is it important that
this data is
auditable?
Is this data covered
by regulatory rules
whereby the regulator
must be able to
validate data and
process?
Is the sequence of
operation including
"who did what" key to
the trust of the entities
involved?
High
Immutability
(Tamper)
Is tampering or
fraud an issue (or
could be) for this
business use
case?
Is it important that
any tampering /
accidental errors be
made visible to the
parties in the
network?
Is it important that
tampering / accidental
errors be removed
wherever possible
from the process(s)?
High
Smart
Contract
(Process)
Is there a strong
process within this
business use case
that needs to be
followed?
Is the process
standardised and
agreed by the parties
involved (e.g. by
regulator or
industry)?
Does the process
require multiple parties
to contribute
collaboratively in order
to complete the
process?
Medium
In what follows, we discuss the evaluation of DLT for P2P energy trading against these criteria.
Data Classification (Security)
The data is not freely open and available from other sources, and some of the data (financial and
commercial) may be considered sensitive. As a result, data access must be restricted with explicit
access entitlements for registered users and specific roles. Given that energy is a regulated market,
and that the six business entities we have identified as being involved include a Regulator and an
Ombudsman, the data is needed for regulatory control, audit and addressing customer complaints.
Assessment: High
Business Network Involved
We have identified several business entities directly involved in the P2P renewable energy trading
market, all of them external to each other. These entities, along with Consumers and Prosumers,
constitute a large integrated energy system. The details of the business entities are discussed below.
60
Assessment: Medium
Consensus (Agreement)
Regulatory requirements demand that actions on the data are validated for correctness, and it is
expected that the data will be audited regularly. Data validity is also critical to support the entirety of
the P2P renewable energy trading market, but also supports critical business processes (e.g. billing
and compliance) of all of the businesses involved. Agreement on the system of record is critical.
Assessment: High
Provenance (Audit)
Regular audits, particularly for regulatory compliance, are part of all scenarios considered in this
study, and the data is covered by regulatory rules requiring the Regulator to validate both data and
process. As a result, trusted record keeping is critical to the P2P Renewable Energy Market Platform.
Assessment: High
Immutability (Tamper)
Tampering and fraud are important to detect and expose to all parties involved, and should be
removed whenever possible when they occur. However, the presence of regulatory control and
auditing is expected to reduce incidences of fraud and tampering to a minimum. Immutability is critical
for trusted record keeping, however, as noted above.
Assessment: High
Smart Contract (Process)
As discussed above in Section 3.4, Smart Contracts are required for standardising, issuing and
executing trading instructions in the distributed ledger, as well as for defining data access. It is
unclear, however, whether significant collaboration between business entities is required to complete
the process.
Assessment: Medium
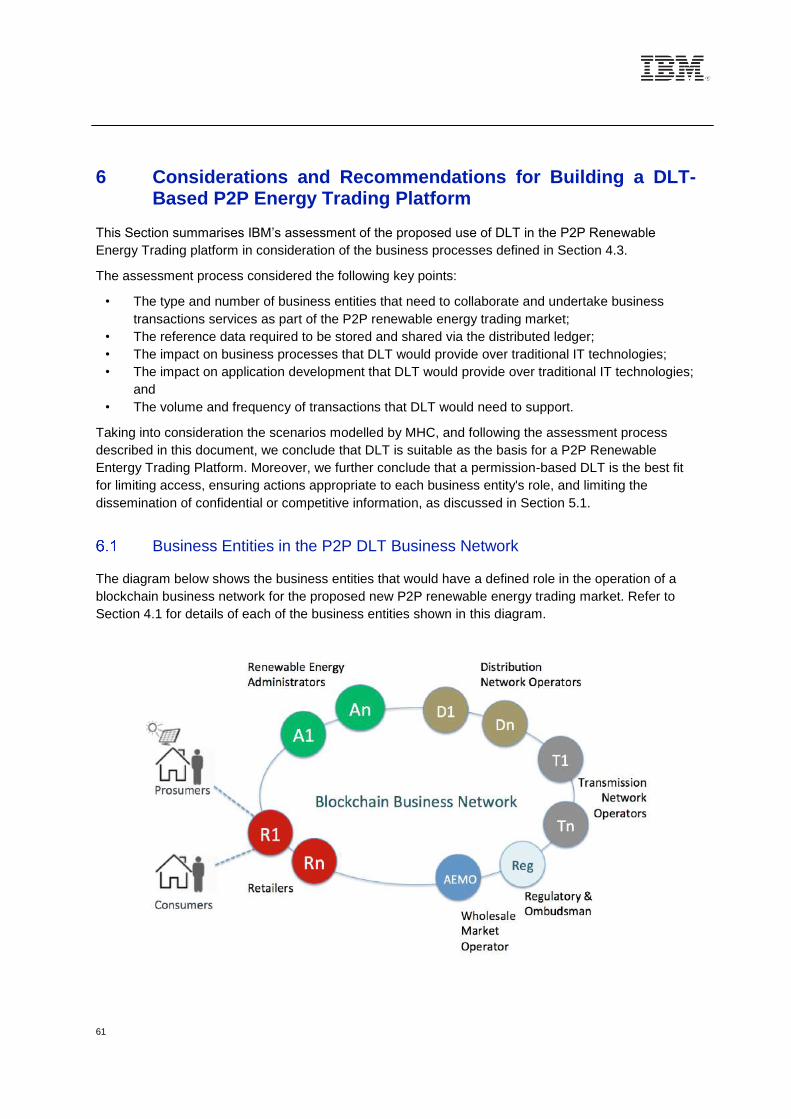
61
6 Considerations and Recommendations for Building a DLT-Based P2P Energy Trading Platform
This Section summarises IBM’s assessment of the proposed use of DLT in the P2P Renewable
Energy Trading platform in consideration of the business processes defined in Section 4.3.
The assessment process considered the following key points:
• The type and number of business entities that need to collaborate and undertake business
transactions services as part of the P2P renewable energy trading market;
• The reference data required to be stored and shared via the distributed ledger;
• The impact on business processes that DLT would provide over traditional IT technologies;
• The impact on application development that DLT would provide over traditional IT technologies;
and
• The volume and frequency of transactions that DLT would need to support.
Taking into consideration the scenarios modelled by MHC, and following the assessment process
described in this document, we conclude that DLT is suitable as the basis for a P2P Renewable
Entergy Trading Platform. Moreover, we further conclude that a permission-based DLT is the best fit
for limiting access, ensuring actions appropriate to each business entity's role, and limiting the
dissemination of confidential or competitive information, as discussed in Section 5.1.
Business Entities in the P2P DLT Business Network
The diagram below shows the business entities that would have a defined role in the operation of a
blockchain business network for the proposed new P2P renewable energy trading market. Refer to
Section 4.1 for details of each of the business entities shown in this diagram.
62
Each business entity within the blockchain network will have membership services and credentials
that define what transactional data within the distributed ledger they can view/edit, and which DLT
processes they are able to execute. For example:
• The Ombudsman and Regulator may require full access to view all transaction records in the
distributed ledger to ensure regulatory compliance.
• AEMO may in specific use cases require full access to view all transaction records in the
distributed ledger to assess the impact of the P2P market on the NEM wholesale market.
• Administrators have full access to view all P2P energy trade transaction records in the
distributed ledger to ensure effective operation of the P2P market.
• Retailers may only require access to transaction records in the distributed ledger associated
with their customers.
• Prosumers and Consumers will not require direct participation in the blockchain business
network but should gain access to the P2P Energy Trading Platform via their Retailer’s on-line
channel(s) or website.
• DNSP and TNSP entities may only require access to transactional records associated with
aggregate energy supply and demand in the pool. These transaction records could be held in
the distributed ledger, or in a separate distributed ledger that would store the transaction
records associated with P2P energy trades.
Selecting Reference Data to be Stored in the Distributed Ledger
Only data with a defined purpose within the business network should be stored in the distributed
ledger.
However, the development of a P2P renewable energy trading market is likely to still require the use
of traditional databases, security and encryption technology to manage data that is not required to be
shared between the respective business entities, in addition to the use of DLT. For example, the
recording of interval meter data is not deemed appropriate for DLT and therefore would be stored in a
traditional database because DLT is not designed to process the volumes of data associated with
interval meter data.
Based on the high-level business processes and services that have been identified within the P2P
Renewable Energy Trading Platform outlined in Section 4.4, the reference data to be stored in the
distributed ledger can be divided into two logical groups; one comprising the relatively static data
representing P2P energy trade business rules and contract information; and the other, limited to P2P
renewable energy only, representing the much more dynamic data related to P2P energy supply and
demand.
The diagram below shows a summary of the reference data associated with each of these 2
categories.
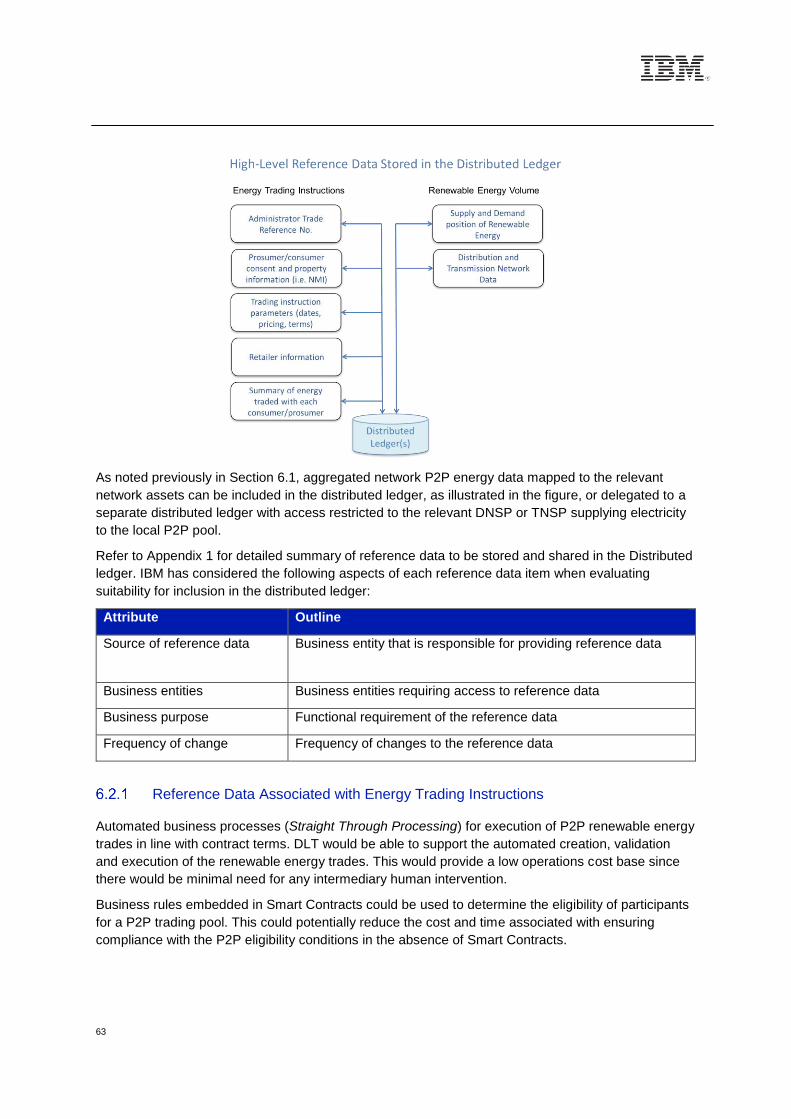
63
As noted previously in Section 6.1, aggregated network P2P energy data mapped to the relevant
network assets can be included in the distributed ledger, as illustrated in the figure, or delegated to a
separate distributed ledger with access restricted to the relevant DNSP or TNSP supplying electricity
to the local P2P pool.
Refer to Appendix 1 for detailed summary of reference data to be stored and shared in the Distributed
ledger. IBM has considered the following aspects of each reference data item when evaluating
suitability for inclusion in the distributed ledger:
Attribute Outline
Source of reference data Business entity that is responsible for providing reference data
Business entities Business entities requiring access to reference data
Business purpose Functional requirement of the reference data
Frequency of change Frequency of changes to the reference data
Reference Data Associated with Energy Trading Instructions
Automated business processes (Straight Through Processing) for execution of P2P renewable energy
trades in line with contract terms. DLT would be able to support the automated creation, validation
and execution of the renewable energy trades. This would provide a low operations cost base since
there would be minimal need for any intermediary human intervention.
Business rules embedded in Smart Contracts could be used to determine the eligibility of participants
for a P2P trading pool. This could potentially reduce the cost and time associated with ensuring
compliance with the P2P eligibility conditions in the absence of Smart Contracts.
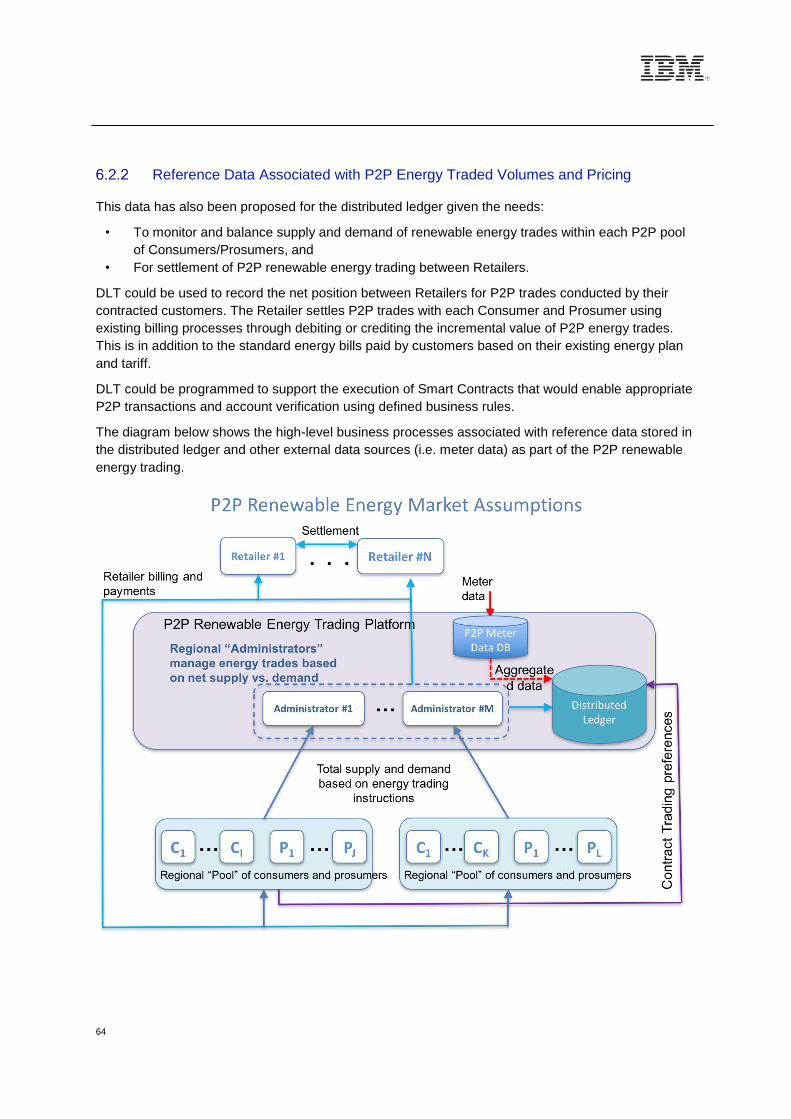
64
Reference Data Associated with P2P Energy Traded Volumes and Pricing
This data has also been proposed for the distributed ledger given the needs:
• To monitor and balance supply and demand of renewable energy trades within each P2P pool
of Consumers/Prosumers, and
• For settlement of P2P renewable energy trading between Retailers.
DLT could be used to record the net position between Retailers for P2P trades conducted by their
contracted customers. The Retailer settles P2P trades with each Consumer and Prosumer using
existing billing processes through debiting or crediting the incremental value of P2P energy trades.
This is in addition to the standard energy bills paid by customers based on their existing energy plan
and tariff.
DLT could be programmed to support the execution of Smart Contracts that would enable appropriate
P2P transactions and account verification using defined business rules.
The diagram below shows the high-level business processes associated with reference data stored in
the distributed ledger and other external data sources (i.e. meter data) as part of the P2P renewable
energy trading.
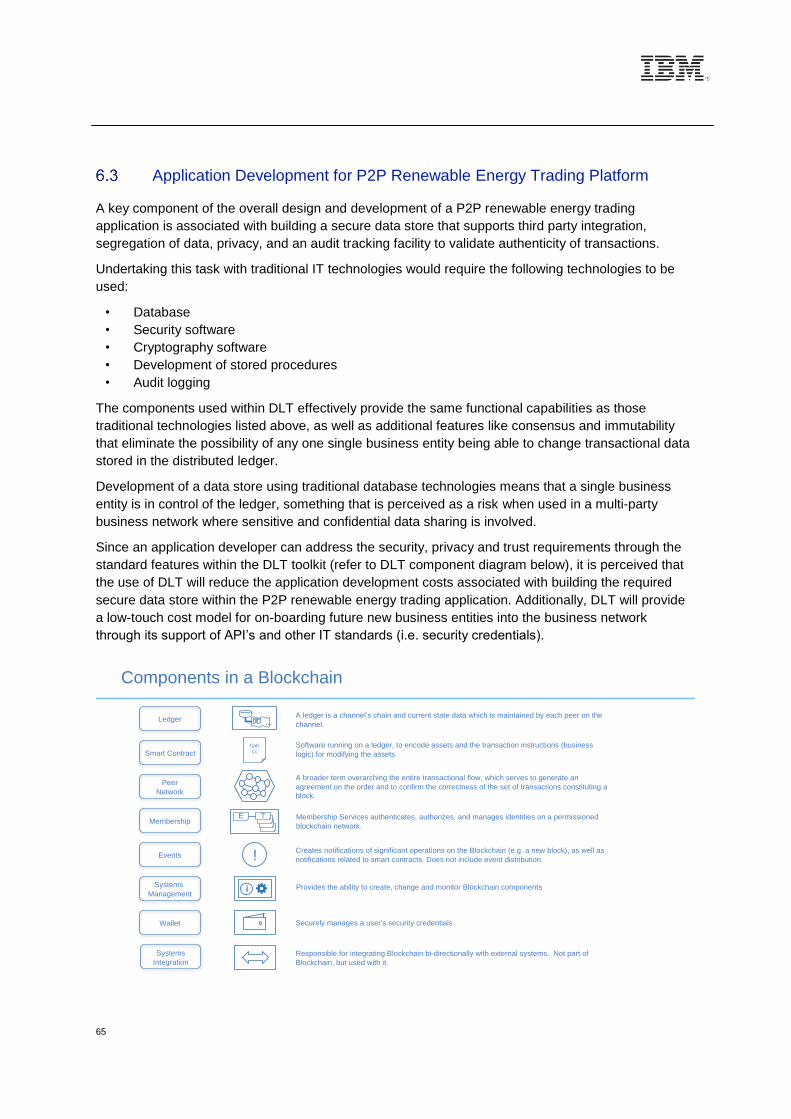
65
Application Development for P2P Renewable Energy Trading Platform
A key component of the overall design and development of a P2P renewable energy trading
application is associated with building a secure data store that supports third party integration,
segregation of data, privacy, and an audit tracking facility to validate authenticity of transactions.
Undertaking this task with traditional IT technologies would require the following technologies to be
used:
• Database
• Security software
• Cryptography software
• Development of stored procedures
• Audit logging
The components used within DLT effectively provide the same functional capabilities as those
traditional technologies listed above, as well as additional features like consensus and immutability
that eliminate the possibility of any one single business entity being able to change transactional data
stored in the distributed ledger.
Development of a data store using traditional database technologies means that a single business
entity is in control of the ledger, something that is perceived as a risk when used in a multi-party
business network where sensitive and confidential data sharing is involved.
Since an application developer can address the security, privacy and trust requirements through the
standard features within the DLT toolkit (refer to DLT component diagram below), it is perceived that
the use of DLT will reduce the application development costs associated with building the required
secure data store within the P2P renewable energy trading application. Additionally, DLT will provide
a low-touch cost model for on-boarding future new business entities into the business network
through its support of API’s and other IT standards (i.e. security credentials).
Components in a Blockchain
Membership
Smart Contract
Systems
Management
Events
Peer
Network
Wallet
LedgerA ledger is a channel’s chain and current state data which is maintained by each peer on the
channel.
f(ab
c);Software running on a ledger, to encode assets and the transaction instructions (business
logic) for modifying the assets.
…
E T
A broader term overarching the entire transactional flow, which serves to generate an
agreement on the order and to confirm the correctness of the set of transactions constituting a
block.
Membership Services authenticates, authorizes, and manages identities on a permissioned
blockchain network.
Creates notifications of significant operations on the Blockchain (e.g. a new block), as well as
notifications related to smart contracts. Does not include event distribution.
Provides the ability to create, change and monitor Blockchain components
Securely manages a user’s security credentials
i
Systems
Integration
Responsible for integrating Blockchain bi-directionally with external systems. Not part of
Blockchain, but used with it.
!
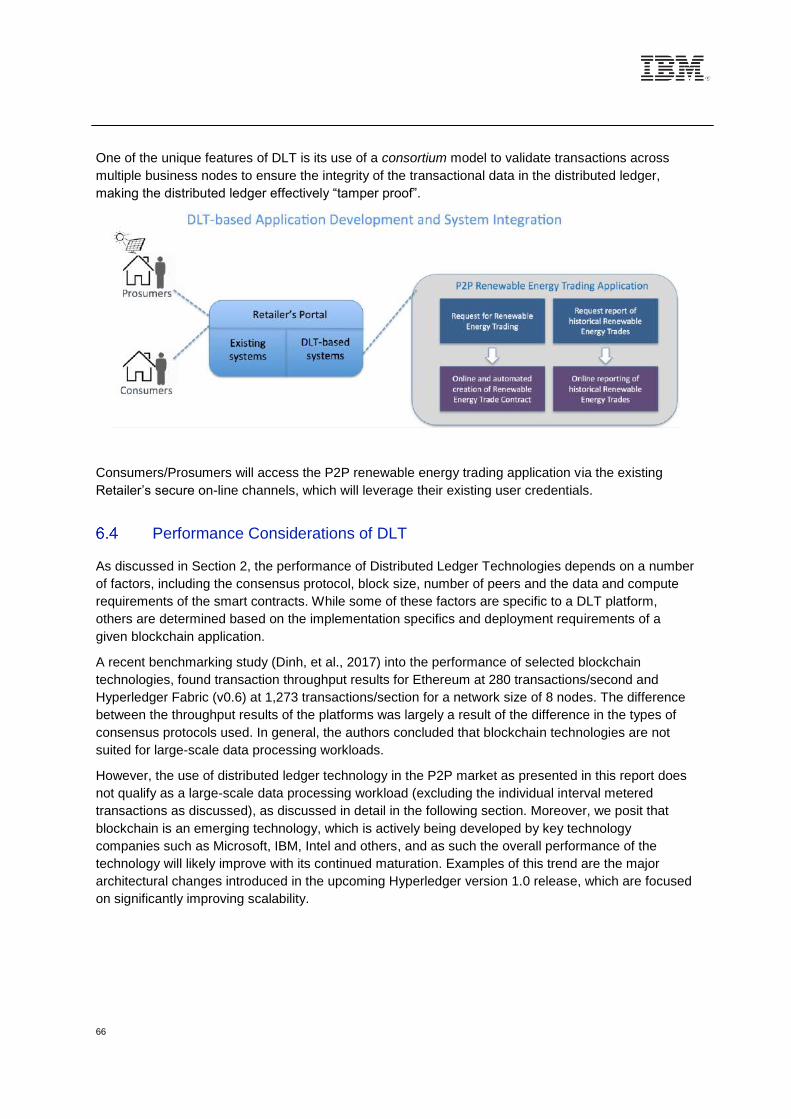
66
One of the unique features of DLT is its use of a consortium model to validate transactions across
multiple business nodes to ensure the integrity of the transactional data in the distributed ledger,
making the distributed ledger effectively “tamper proof”.
Consumers/Prosumers will access the P2P renewable energy trading application via the existing
Retailer’s secure on-line channels, which will leverage their existing user credentials.
Performance Considerations of DLT
As discussed in Section 2, the performance of Distributed Ledger Technologies depends on a number
of factors, including the consensus protocol, block size, number of peers and the data and compute
requirements of the smart contracts. While some of these factors are specific to a DLT platform,
others are determined based on the implementation specifics and deployment requirements of a
given blockchain application.
A recent benchmarking study (Dinh, et al., 2017) into the performance of selected blockchain
technologies, found transaction throughput results for Ethereum at 280 transactions/second and
Hyperledger Fabric (v0.6) at 1,273 transactions/section for a network size of 8 nodes. The difference
between the throughput results of the platforms was largely a result of the difference in the types of
consensus protocols used. In general, the authors concluded that blockchain technologies are not
suited for large-scale data processing workloads.
However, the use of distributed ledger technology in the P2P market as presented in this report does
not qualify as a large-scale data processing workload (excluding the individual interval metered
transactions as discussed), as discussed in detail in the following section. Moreover, we posit that
blockchain is an emerging technology, which is actively being developed by key technology
companies such as Microsoft, IBM, Intel and others, and as such the overall performance of the
technology will likely improve with its continued maturation. Examples of this trend are the major
architectural changes introduced in the upcoming Hyperledger version 1.0 release, which are focused
on significantly improving scalability.
67
Modelling Transaction Workloads for DLT
Modelling of transaction workloads/throughput rates is subject to many core assumptions associated
with the business processes (i.e. Energy Trading Instruction and P2P Energy Volumes) that would be
performed by the P2P renewable energy trading platform.
IBM has created a spreadsheet (see below) to model the major factors that impact the transaction
workloads associated with the energy trading instructions. The diagram below shows the factors that
have been modelled to help quantify the notional transaction workloads, which is essentially the sum
of total contracts created in the network and the net settlements transacted between retailers on a
periodic basis, assumed to be every six hours.
Refer to the electronic spreadsheet version of this table to interactively change the model parameters
to see their impact on notional transaction throughput volumes that the DLT would need to support.
In the particular example in the spreadsheet, we have assumed a platform corresponding to the
largest of our DNSPs (currently Energy Queensland) with 2.1 million residential households
nationally, 35% of who are assumed to be consumers and/or prosumers participating in renewable
energy trading. Depending on their preferences of contract types such as short-term, mid-term, or
long-term contracts, an estimated number of 29 million trading instructions per year are created.
In addition to the transaction volume related to trading instructions, we also estimated the number of
net settlement transaction volumes the P2P Renewable Energy Trading Platform would be expected
to process. Assuming that net settlements are updated every 6 hours, i.e., four times a day, we
considered a range of configurations, from low numbers of both retailers and regional pools (10 and
10, respectively) to much larger numbers of both (i.e. 100 retailers and 500 regional pools each
representing roughly the size of a zone substation load area).
Combined with the trading instructions, these parameter configurations resulted in transaction rates of
between 1 and 4 transactions per second at the low end, and just over 100 transactions per second at
the high end, all well within the scaling capabilities of some DLT technologies, including Hyperledger
Fabric.
The total number of net settlements grows quadratically with the number of retailers per pool, but only
linearly with the number of regional pools. The quadratic scaling is due to the possibility that all
retailers in a regional pool could in theory have net settlements with all other retailers in that pool for
every settlement period. It is worth noting, however, that this is an upper bound, and the actual
number of net settlements will be less. We also note that in the smaller configurations, the
transactions related to trading instructions constitute the majority of the total DLT workload, whereas
at the larger configurations, the net settlement transactions dominate.
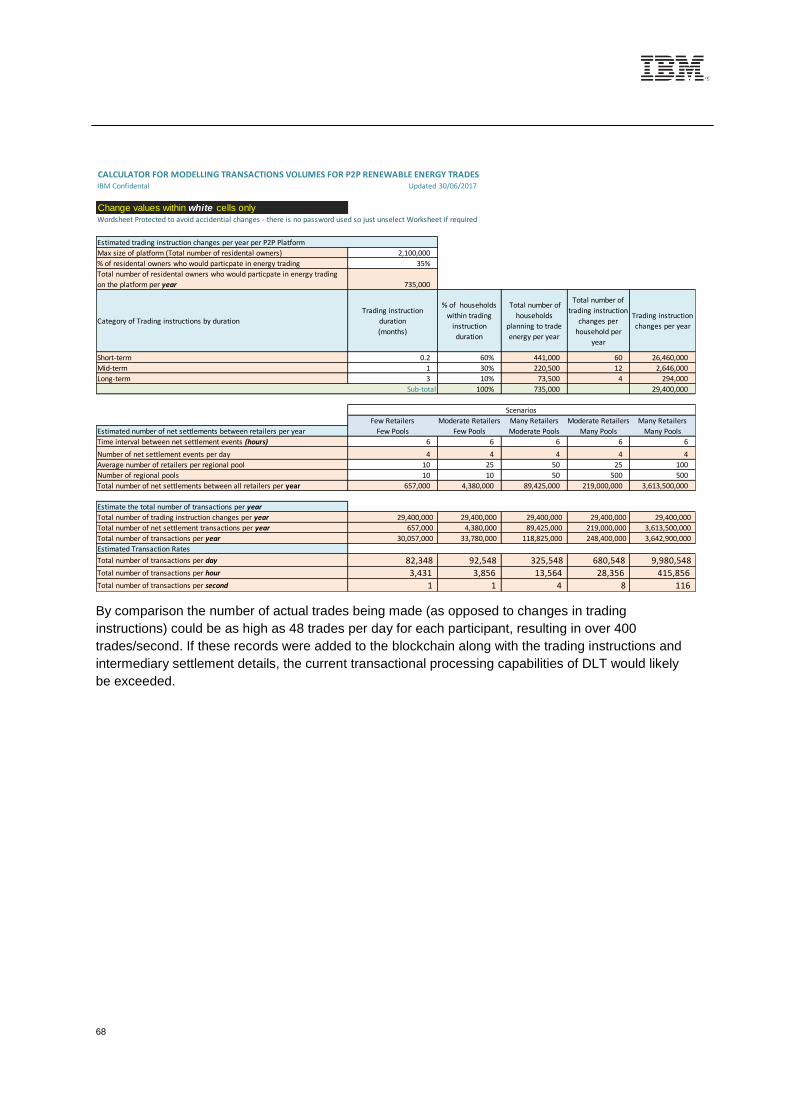
68
By comparison the number of actual trades being made (as opposed to changes in trading
instructions) could be as high as 48 trades per day for each participant, resulting in over 400
trades/second. If these records were added to the blockchain along with the trading instructions and
intermediary settlement details, the current transactional processing capabilities of DLT would likely
be exceeded.
CALCULATOR FOR MODELLING TRANSACTIONS VOLUMES FOR P2P RENEWABLE ENERGY TRADESIBM Confidental Updated 30/06/2017
Change values within white cells onlyWordsheet Protected to avoid accidential changes - there is no password used so just unselect Worksheet if required
Max size of platform (Total number of residental owners) 2,100,000
% of residental owners who would particpate in energy trading 35%
Total number of residental owners who would particpate in energy trading
on the platform per year 735,000
Category of Trading instructions by duration
Trading instruction
duration
(months)
% of households
within trading
instruction
duration
Total number of
households
planning to trade
energy per year
Total number of
trading instruction
changes per
household per
year
Trading instruction
changes per year
Short-term 0.2 60% 441,000 60 26,460,000
Mid-term 1 30% 220,500 12 2,646,000
Long-term 3 10% 73,500 4 294,000
100% 735,000 29,400,000
Few Retailers Moderate Retailers Many Retailers Moderate Retailers Many Retailers
Estimated number of net settlements between retailers per year Few Pools Few Pools Moderate Pools Many Pools Many Pools
Time interval between net settlement events (hours) 6 6 6 6 6
Number of net settlement events per day 4 4 4 4 4
Average number of retailers per regional pool 10 25 50 25 100
Number of regional pools 10 10 50 500 500
Total number of net settlements between all retailers per year 657,000 4,380,000 89,425,000 219,000,000 3,613,500,000
Estimate the total number of transactions per year
Total number of trading instruction changes per year 29,400,000 29,400,000 29,400,000 29,400,000 29,400,000
Total number of net settlement transactions per year 657,000 4,380,000 89,425,000 219,000,000 3,613,500,000
Total number of transactions per year 30,057,000 33,780,000 118,825,000 248,400,000 3,642,900,000
Estimated Transaction Rates
Total number of transactions per day 82,348 92,548 325,548 680,548 9,980,548
Total number of transactions per hour 3,431 3,856 13,564 28,356 415,856
Total number of transactions per second 1 1 4 8 116
Estimated trading instruction changes per year per P2P Platform
Sub-total
Scenarios
69
7 Stage 2 Conclusions
In this report, we have discussed the suitability of Distributed Ledger Technologies as a backbone for
enabling peer-to-peer renewable energy market trading. Distributed Ledger Technologies are a
relatively new technology that introduce new properties to existing distributed systems and enable
systems to support the operations of a business network. In particular, what makes DLT(s) appealing
in such applications is the fact that they are tamper-resistant, redundant, and verifiable systems of
records that do not require a central entity to store and manage shared data and business processes.
Moreover, they allow for the definition of smart contracts, which is the design abstraction used to
implement the policies defining the behaviour of business networks at the platform level.
In assessing whether DLT(s) could be a viable solution to support P2P renewable energy market
trading, we first qualified and defined the reference business network that represents the problem of
interest, by identifying its stakeholders and their roles. This exercise built upon the study done by
Marchment Hill Consulting (MHC), focused on understanding the value of P2P market trading from
distributed renewable energy technologies. Three scenarios were identified in that study, and we have
identified two market structures that would address the P2P pricing models proposed in such
scenarios. While one market structure considered those scenarios that did not require a change to
current regulations, the other addressed those that required regulatory changes and/or the
participation of parties without an existing trust relationship. This report focused on the latter market
structure, which was used as a frame of reference for building a case for the suitability of DLT(s). This
is because, besides regulatory changes, that market structure supported the scenarios that require
crossing the trust boundaries between organisations, and this presents a more compelling reason for
the use of Distributed Ledger Technologies.
To solidify our point of view, we also utilized a set of criteria specifically aimed at identifying whether a
particular business ecosystem could benefit from the use of Distributed Ledger Technologies. These
include security requirements around the information being exchanged, the level of interaction within
the business network, the need for auditability and immutability of system or records, the necessity of
sharing a common view about key assets and processes, which need to be executed according to
well defined policies. When evaluating these criteria, we found that in P2P renewable energy market
trading most of these aspects are either critical or of importance, and overall justify the use of DLT(s)
in some form.
Next, we proposed an approach that is mindful of the current technical capabilities of such
technologies and identified the types of assets (i.e. key information) and processes that should be
managed within a distributed ledger. We also discussed their integration patterns with the traditional
systems that still play an important role in this approach. The proposed architecture was then
validated against statistical information about the number of Consumers and Prosumers that may
trade within a given regional area, to ensure that the performance of the suggested DLT(s)
implementation would be sufficient to support the projected transaction throughput generated in such
scenario.
We conclude that current DLT(s) technologies already have the technical maturity to support P2P
renewable energy market trading in the proposed form. We also concluded that DLT is currently not
suited to processing the significant volumes of interval data that would result from individual records
of P2P energy transactions in a full-scale system. Careful design of the overall system architecture is
required to ensure that the Distributed Ledger Technologies do bring benefit to supported business
networks.
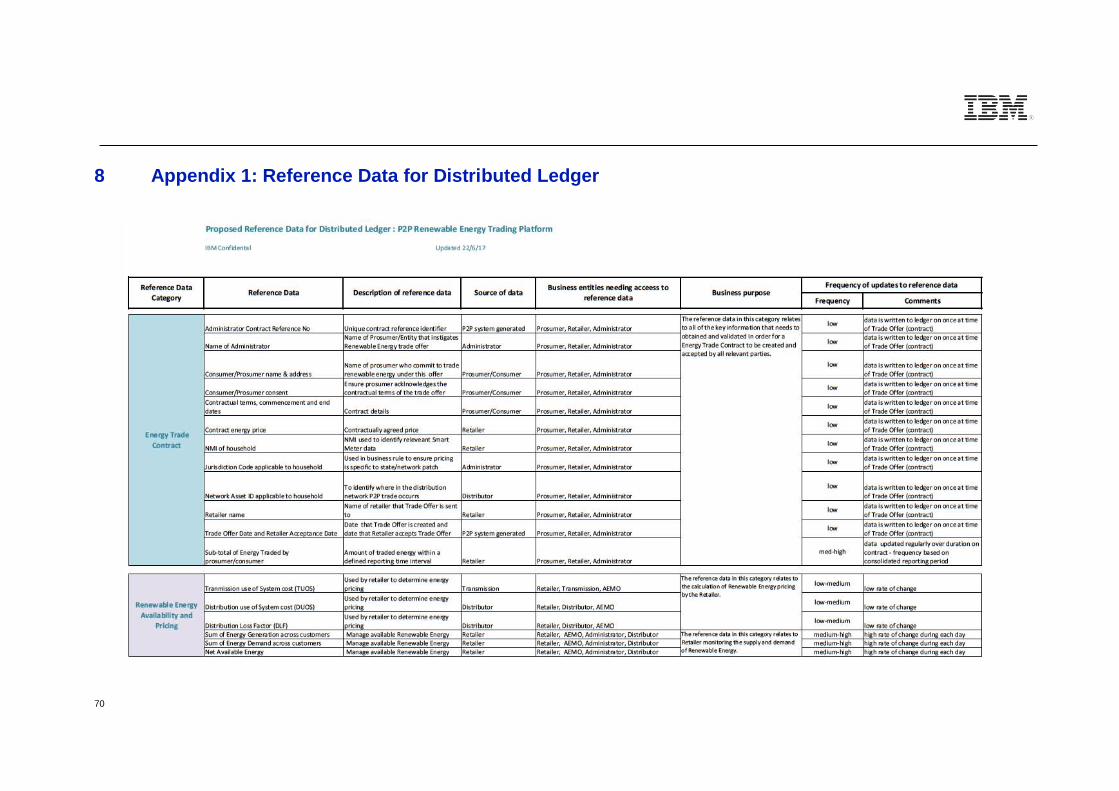
70
8 Appendix 1: Reference Data for Distributed Ledger

72
9 Project Conclusions – Stage 1 and Stage 2
The convergence of several consumer, market and technology trends is creating a unique opportunity for
establishing P2P renewable energy trading markets. New entrants and existing players are testing new
P2P business models in global markets, some underpinned by blockchain applications. Australia, with
amongst the highest consumer DER penetration and electricity prices in the world, presents an opportune
landscape for a P2P market. But to date P2P trading remains relatively untested and underdeveloped.
This report has assessed the potential value of P2P renewable energy trading to customers and market
participants and the role that DLT could play in enabling a P2P trading market. This section considers the
role of the customer, market participants, DLT and policy and regulation in accelerating the growth of a P2P
market, taking into account the key findings and conclusions from the Stage 1 (Virtual P2P Trading Model
Result Report) and Stage 2 (Applicability of DLT: Technical Assessment Report) Reports.
Customer
Customers are the driving force behind growing industry interest in P2P energy trading in the Australia.
Industry attention on P2P energy trading is a direct response to changing customer preferences with
customers becoming increasingly active market participants, exerting greater control over their energy
supply arrangements than ever before. Testament to this is that Australia has the highest proportion of
‘Prosumers’ in the world with 1.7m small-scale solar PV systems installed in to date24. Installations will
continue to grow, and will increasingly be accompanied by the installation of battery energy storage
systems as costs continues to decline. These developments are changing the way customers view and use
the grid, especially in terms of the grid being used as much as a means to facilitate exports, as to import
electricity.
Early DER adopters have been rewarded premium feed-in-tariffs (FiTs) for their excess solar PV
generation fed back into the grid. In recent years State governments have closed premium FiT schemes to
new entrants and in cases these premium FiTs have expired. The removal of premium FiTs has left many
solar PV households with the desire to ‘do more’ with their excess solar generation. P2P energy trading
offers prosumers the ability to derive new value from ‘sharing’ their energy with consumers.
Many consumers are not able to invest in DER due to not owning their own home or their roof not being
physically suitable for solar. These consumers are locked out of the benefits of DER investment. They have
also experienced several years of electricity price growth, in part caused by DER reducing the total energy
delivered without shifting peak demand or other cost drivers. P2P energy trading can provide consumers
with the opportunity to access some DER benefits without need for an upfront investment or financing.
Macro consumer trends, such as the emergence of the ‘sharing economy’ based on community sharing of
assets and services, as well as the growing public concern about the contribution of Australia’s
predominantly fossil fuel based energy mix to climate change, also support P2P market development.
The Stage 1 Report has validated, albeit with a relatively limited sample of customer data, that P2P energy
trading under enabling market conditions provides energy bill savings to both consumers and prosumers in
24 As of April 2017. Australian PV Institute, Market Analyses.
73
all three scenarios modelled, with Scenario 3 delivering the greatest financial value. Additionally, P2P
trading provides a new revenue stream for prosumers, improving the payback on their DER investments.
Consumers could derive further value from P2P trading beyond financial savings, which is not quantified in
the Stage 1 Report. For example, some prosumers may gain altruistic value from ‘sharing’ their energy with
family, friends, or community members, while some consumers may value purchasing local, ‘green’ DER
generation. These customer value propositions should be tested in market in a way that is compliant with
the National Energy Customer Framework and provides an equal playing field for all customers.
Market
The above consumer trends make the Australian electricity market an excellent test case for P2P energy
trading with exciting opportunities for both new entrants and traditional market participants. For incumbents,
a P2P market is a chance to enhance customer engagement and deliver additional customer value beyond
a reliable, secure electricity supply. This Report also outlines the prospects for new entrants: start-up
retailers with P2P product offers, P2P Market Operators or Administrators who operate the P2P trading
platforms, and Aggregators trading on behalf of groups of Prosumers and Consumers.
Existing electricity pricing structures are based on providing electricity delivered from centralised
generation. The prevailing network pricing regime applies the same network charges for a tariff and
customer class, regardless of the Consumer’s proximity to the source of generation. Pricing structures
need to evolve to reflect that the grid is moving towards a two-way energy platform. Current pricing does
not provide an incentive for Consumers to match their consumption to excess Prosumer generation within
the same low-voltage or medium-voltage distribution network. An increased matching of consumption to
DER exports, as considered in Scenario 2, or timely battery dispatches within a ‘local network’ enabled
through advanced control systems could deliver network benefits in terms of avoiding or delaying more
expensive augmentations or providing voltage regulation services back to the distribution network. New
DER technologies can become a key part of system management for both networks and retailers.
Scenario 1 considered a highly-simplified approach to a ‘local network’ charge to highlight the value that
could be created through alternative network pricing. However, further analysis is required to assess
alternative network pricing regimes, which provides effective price signals for both rewarding local DER
generation for its contribution to network performance and equitable and efficient investment in DER.
The financial model that underpins the Stage 1 Report operates on the basis that participants are
economically rational. Therefore, a P2P trade only occurs when Consumers and Prosumers can purchase
P2P energy below their contracted retail rate for electricity consumption. Similarly, Prosumers only sell their
excess generation when the P2P sell price exceeds their FiT rate. Because of this simplifying assumption,
Prosumers and Consumers save money on P2P trades, but existing market participants incur a financial
loss relative to the business as usual scenario. The financial losses to these participants are substantiated
in terms of the loss being offset by a reduced cost to serve the customer in a P2P market. However, this
Report has not analysed the reduced cost to serve of a P2P customer. Therefore, further analysis is
required to assess the basis for P2P electricity priced at a lower rate than ‘grid’ electricity.
74
IT Technology
There are multiple IT systems and databases that could be used to support a P2P energy trading market.
With the emergence of DLTs underpinning P2P trading for multiple asset classes, notably for crypto-
currency, there is a growing interest in DLT applications to support P2P energy trading. However, there are
relatively few studies and pilots to date that have assessed the viability of DLT for P2P energy trading.
Therefore, this Report aimed to provide an initial assessment of the suitability of DLT as a viable solution
for the P2P trading market reflected in the Stage 1 Report.
The Stage 2 report focused on the Scenarios 2 and 3 where DLT was deemed to add value in the context
of a P2P business network. Under this market structure DLT delivers value because there are multiple
entities with existing trust boundaries and with a requirement to share data for purposes of P2P trades
settlement and reconciliation, P2P market oversight and visibility.
IBM qualitatively evaluated the value of a DLT application for P2P trading against their standard six
assessment criteria25. The Stage 2 Report concluded that DLT was justified for its application in this
business case on the basis that it ranked relatively high on average across the assessment criteria. Further
analysis could be undertaken to provide a quantitative assessment of the value of DLT with respect to
these criteria.
The Stage 2 Report highlighted current performance limitations of DLT applications in processing high-
frequency and high-volume transactions. For a P2P energy market to reflect energy flows in the physical
system this relies on matching consumption and production at sub 30-minute time intervals. This implies a
high volume and frequency of transactions, which current DLTs were not considered capable of processing
once the size of the P2P market reached ‘utility-scale’ with hundreds of thousands of active customers.
There was also limited deemed value of recording all individual transactions ‘on chain’.
However, Stage 2 Report did identify value in using a DLT to share P2P contract information (‘trading
instructions’) and the history of net, aggregated P2P trading positions to allow for market settlement and
reconciliation between retailers. DNSPs may also benefit from visibility over the ledger to monitor P2P
energy flows within their network (or indeed as market participants as in European examples). AER, the
Ombudsman and AEMO may also want ledger access for market oversight to ensure consumers and the
market are not adversely affected by the P2P market.
Further analysis needs to be carried out on the cost and benefits of implementing DLT to assess whether
the investment is viable within the context of a P2P energy trading market, relative to traditional IT systems.
Policy and Regulation
This Report has highlighted that market reform is required to support a future power system, which includes
enabling customers to ‘share’ their energy through a P2P market. The participants have attempted to stay
25 1. Data classification (security requirements around information exchange); 2. Business network involvement and interaction; 3. Consensus (agreement); 4. Provenance (auditability); 5. Immutability (tamper proof); 6. Smart Contracts (government process).
75
true to the guiding principles of Dr Finkel’s recent independent review of the security of the National
Electricity Market26.
In this view, initial market reform should promote consumer choice, innovation, and technology neutrality,
while providing a level playing field for market participants. Market arrangements should enable consumers
to monetise as many potential sources of revenue for their DER investments, such as P2P energy trading,
as possible and to ensure the future development of a competitive, efficient and accessible market for
DER.
The effective modernisation of the electricity grid requires ongoing reform to network pricing and the
continued transition to more cost-reflective network tariffs. Network pricing that reflects the variable costs
placed on the network by different patterns of use will promote more efficient investment in and use of DER
technologies (and deter inefficient grid substitution), promote better network utilisation and lower network
costs for all users. Care in the design of network cost-recovery and pricing frameworks is also key to
mitigating potential equity issues that arise where those without the ability to adopt DER technologies are
left to bear a disproportionate share of remaining network costs.
The AEMC’s Distribution Market Model Draft Report is a crucial focal point for the development of fit-for-
purpose regulation to support the growth of DER technology and the associated evolution to a more
decentralised provision of electricity services. P2P energy trading has potential to be a key element of this
market evolution.
26 Independent Review into the Future Security of the National Electricity Market (2017), http://www.environment.gov.au/system/files/resources/1d6b0464-6162-4223-ac08-3395a6b1c7fa/files/electricity-market-review-final-report.pdf
76
Sources
The following sources are in addition to those directly credited or referenced in the main report.
Stage 1 Sources
Colthorpe, A. (2015). Secrets of the trade: Insights into Sonnen’s PV-plus-storage energy trading platform.
Retrieved from Energy Storage News: http://www.energy-storage.news/interviews/secrets-of-the-trade-
insights-into-sonnens-pv-plus-storage-energy-trading-p
Crols, J. (2013). Reducing cost to serve, while increasing customer satisfaction: Ferranti’s view on how
MECOMS™ helps reduce costs for utilities. Retrieved from:
http://www.mecoms.com/Downloads/MECOMS_Cost_to_Serve_Whitepaper.pdf
Deign, J. (2016). P2P energy player lobbies for storage. Retrieved from Energy Storage Report:
http://energystoragereport.info/tag/p2p-energy/
Deign, J. (2016). Regulation to dominate today’s ESN meeting. Retrieved from Energy Storage Report:
http://energystoragereport.info/electricity-storage-network-energy-storage-uk/
Government of Netherlands. (n.d.). Energy Agreement for Sustainable Growth. Retrieved from
https://www.government.nl/topics/energy-policy/contents/energy-agreement-for-sustainable-growth
Hazelwood-Smith, S. (2016). Peer-to-Peer Energy: How the Future of Energy Supply Relies on Your
Neighbor. Retrieved from How We Get To Next: https://howwegettonext.com/peer-to-peer-energy-how-the-
future-of-energy-supply-relies-on-your-neighbor-today-we-ve-seen-the-1b9a49972cae#.e8y2ma39a
Hirtenstein, A. (2016). Green-Power Traders Sought in Utility’s Bid to Emulate Airbnb. Retrieved from
Bloomberg: http://www.bloomberg.com/news/articles/2016-06-14/green-power-traders-sought-in-utility-s-
bid-to-emulate-airbnb
Holly. (2016). New York Adopts New Earnings Design For Electric Utilities Under REV. Retrieved from
Holston Business Review: http://www.holstonbusinesscenter.com/new-york-adopts-new-earnings-design-
for-electric-utilities-under-rev/
Holmberg, D et al (2016). Transactive Energy Application Landscape Scenarios. Retrieved from SGIP:
http://www.sgip.org/wp-content/uploads/SGIP_White_Paper_TE_Application_Landscape_Scenarios_12-
15-2016_FINAL.pdf
Unknown. (2016). Retrieved from Fast Company: https://www.fastcompany.com/3058201/this-new-york-
project-fuses-energy-microgrids-with-blockchain-technology
Sullivan & Worcester LLP (2016). New York’s reforming the energy vision— opportunities and obstacles on
the horizon. Retrieved from Lexology: http://www.lexology.com/library/detail.aspx?g=bbeb89a4-810f-47fc-
bae1-c6271e366f99
Meyers, G. (2015). Germany’s Sonnenbatterie Launches Energy Trading Platform. Retrieved from Clean
Technica: https://cleantechnica.com/2015/12/06/germanys-sonnenbatterie-launches-energy-trading-
platform/
77
OFGEM. (2016). Network regulation - the RIIO model. Retrieved from https://www.ofgem.gov.uk/network-
regulation-riio-model
Piclo. (2017). FAQs. Retrieved from Piclo: https://piclo.uk/faqs
Ravens, S. (2017) Understanding Peer-to-Peer, Blockchain, and Transactive Energy. Retrieved from
www.navigantresearch.com
SIA Partners. (2015) The Dutch Energy Agreement 2013-2023: Where Are We Heading To? Retrieved
from Energy Outlook: http://energy.sia-partners.com/dutch-energy-agreement-2013-2023
Tweed, K. (2014). New York Launches Major Regulatory Reform for Utilities. Retrieved from Greentech
Media: http://www.greentechmedia.com/articles/read/new-york-launches-major-regulatory-reform-for-
utilities
World Economic Forum (2016). The future of financial infrastructure: An ambitious look at how blockchain
can reshape financial services. Retrieved from WEF:
http://www3.weforum.org/docs/WEF_The_future_of_financial_infrastructure.pdf
Stage 2 Sources
Colthorpe, A. (2015, Dec 10). Secrets of the trade: Insights into Sonnen’s PV-plus-storage energy trading
platform. Retrieved from Energy Storage News: http://www.energy-storage.news/interviews/secrets-of-the-
trade-insights-into-sonnens-pv-plus-storage-energy-trading-p
Deetman, S. (2016, March 30). Bitcoin Could Consume as Much Electricity as Denmark by 2020. Retrieved
May 31, 2017, from https://motherboard.vice.com/en_us/article/bitcoin-could-consume-as-much-electricity-
as-denmark-by-2020
Deign, J. (2016, May 16). P2P energy player lobbies for storage. Retrieved from Energy Storage Report:
http://energystoragereport.info/tag/p2p-energy/
Deign, J. (2016, January 27). Regulation to dominate today’s ESN meeting. Retrieved from Energy Storage
Report: http://energystoragereport.info/electricity-storage-network-energy-storage-uk/
Dinh, T., Wang, J., Chen, G., Liu, R., Ooi, B., & Tan, K.-L. (2017). BLOCKBENCH: A Framework for
Analyzing Private Blockchains. Retrieved May 31, 2017, from https://arxiv.org/pdf/1703.04057.pdf
Ethereum Project. (2017). Ethereum Project. Retrieved May 31, 2017, from https://www.ethereum.org/
Government of Netherlands. (n.d.). Energy Agreement for Sustainable Growth. Retrieved from
https://www.government.nl/topics/energy-policy/contents/energy-agreement-for-sustainable-growth
Hazelwood-Smith, S. (2016). Peer-to-Peer Energy: How the Future of Energy Supply Relies on Your
Neighbor. Retrieved from How We Get To Next: https://howwegettonext.com/peer-to-peer-energy-how-the-
future-of-energy-supply-relies-on-your-neighbor-today-we-ve-seen-the-1b9a49972cae#.e8y2ma39a
Hearn, M. (2016, November 16). Corda: A distributed ledger. Retrieved May 31, 2017, from
https://docs.corda.net/_static/corda-technical-whitepaper.pdf
78
Hirtenstein, A. (2016, June 14). Green-Power Traders Sought in Utility’s Bid to Emulate Airbnb. Retrieved
from Bloomberg: http://www.bloomberg.com/news/articles/2016-06-14/green-power-traders-sought-in-
utility-s-bid-to-emulate-airbnb
Holly. (2016, June 10). New York Adopts New Earnings Design For Electric Utilities Under REV. Retrieved
from Holston Business Review: http://www.holstonbusinesscenter.com/new-york-adopts-new-earnings-
design-for-electric-utilities-under-rev/
https://www.fastcompany.com/3058201/this-new-york-project-fuses-energy-microgrids-with-blockchain-
technology. (2016, January 05). Retrieved from Fast Company:
https://www.fastcompany.com/3058201/this-new-york-project-fuses-energy-microgrids-with-blockchain-
technology
Hyperledger Fabric Project. (2017). Hyperledger Fabric. Retrieved May 31, 2017, from
https://www.hyperledger.org/projects/fabric
LLP, S. &. (2016, May 11). New York’s reforming the energy vision— opportunities and obstacles on the
horizon. Retrieved from Lexology: http://www.lexology.com/library/detail.aspx?g=bbeb89a4-810f-47fc-
bae1-c6271e366f99
Meyers, G. (2015, December 6). Germany’s Sonnenbatterie Launches Energy Trading Platform. Retrieved
from Clean Technica: https://cleantechnica.com/2015/12/06/germanys-sonnenbatterie-launches-energy-
trading-platform/
Nakamoto, S. (2008). Bitcoin: A Peer-to-Peer Electronic Cash System. Retrieved May 31, 2017, from
https://bitcoin.org/bitcoin.pdf
OFGEM. (2016). Network regulation - the RIIO model. Retrieved from https://www.ofgem.gov.uk/network-
regulation-riio-model
Piclo. (2016). FAQs. Retrieved from Piclo: https://piclo.uk/faqs
SIA Partners. (2015, 12 17). The Dutch Energy Agreement 2013-2023: Where Are We Heading To?
Retrieved from Energy Outlook: http://energy.sia-partners.com/dutch-energy-agreement-2013-2023
Tweed, K. (2014, April 28). New York Launches Major Regulatory Reform for Utilities. Retrieved from
Greentech Media: http://www.greentechmedia.com/articles/read/new-york-launches-major-regulatory-
reform-for-utilities
Vardy, S. (2016, July). New Energy Ecosystem. Accenture. Retrieved from Clean Energy Summit.
Vukolic, M. (2015). The Quest for Scalable Blockchain Fabric: Proof-of-Work vs. BFT Replication.
Retrieved May 31, 2017, from http://www.vukolic.com/iNetSec_2015.pdf


