mixed with Cement companies and selects private banks posted reasonably robust numbers whereas
growth momentum for IT and Pharma companies continues to be weak in Q4FY17.Implementation of GST
would reduce tax evasion and would help to achieve higher growth in long term.
We continue to be positive in select private banking, consumer discretionary, Oil & Gas and select domestic
FMCG companies in India.
UPDATE ON MAY 2017 STOCK PICKS
STOCK CALL INITATED
AT (INR) DATE POTENTIAL
TARGET RATING PRICE(25
MAY 2017) REMARKS
HDFC BANK 1569 27-Apr-17 1600 ACCUMULATE 1617.15 OPEN
IOC 443 27-Apr-17 500 ACCUMULATE 438.95 OPEN
ICICI PRUDENTIAL 399 27-Apr-17 440 ACCUMULATE 399.75 OPEN
MARICO 318 27-Apr-17 360 ACCUMULATE 315.95 OPEN
TITAN 478 27-Apr-17 530 ACCUMULATE 463.90 OPEN
Stock price in INR
Performance reports of recommended stock return in this report are carried on cash closing price and the call deemed to be open (for 12 months) on F&O expiry date of respective month until target is revised downward/upward depending on companies’ future performance. We have now revised this stock return performance policy from 30 Sep 2016(Oct derivative series) onwards and STOPLOSS BASIS stock calls are not given.
How Benchmark Index- Nifty moved in MAY 2017(Till May25, 2017)
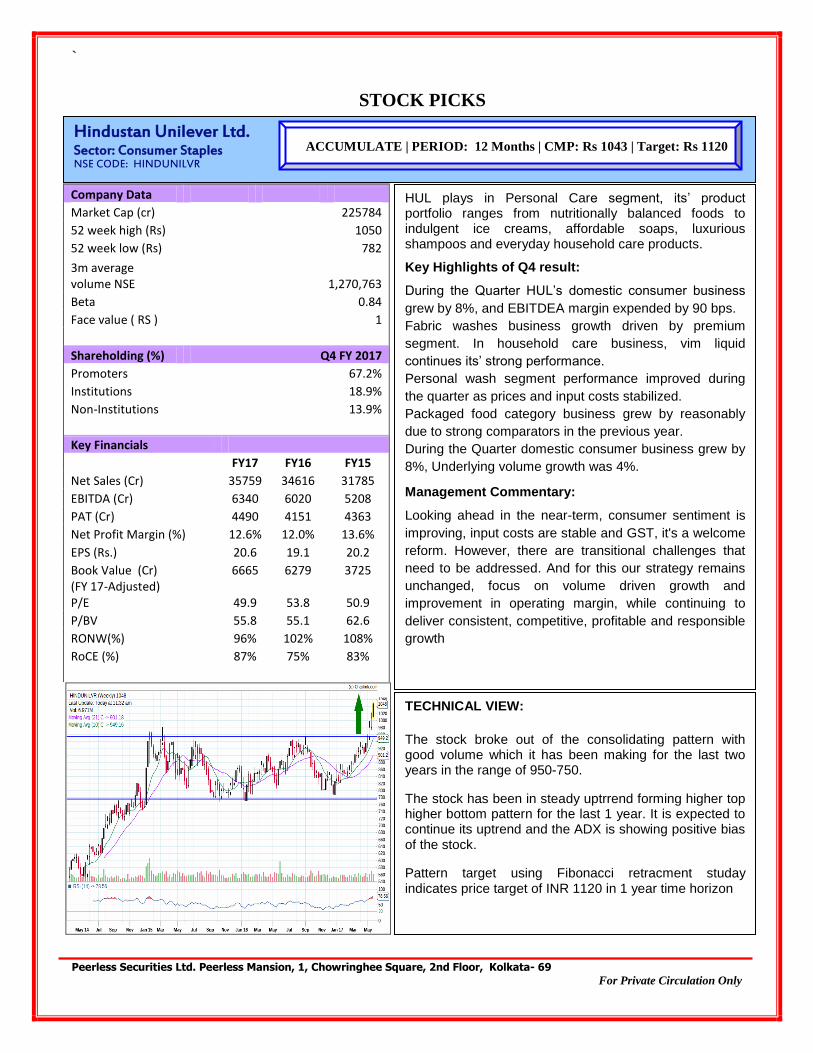
The stock broke out of the consolidating pattern with good volume which it has been making for the last two years in the range of 950-750.
The stock has been in steady uptrrend forming higher top higher bottom pattern for the last 1 year. It is expected to continue its uptrend and the ADX is showing positive bias of the stock.
Pattern target using Fibonacci retracment studay indicates price target of INR 1120 in 1 year time horizon
HUL plays in Personal Care segment, its’ product portfolio ranges from nutritionally balanced foods to indulgent ice creams, affordable soaps, luxurious shampoos and everyday household care products.
Key Highlights of Q4 result:
During the Quarter HUL’s domestic consumer business
grew by 8%, and EBITDEA margin expended by 90 bps.
Fabric washes business growth driven by premium
segment. In household care business, vim liquid
continues its’ strong performance.
Personal wash segment performance improved during
the quarter as prices and input costs stabilized.
Packaged food category business grew by reasonably
due to strong comparators in the previous year.
During the Quarter domestic consumer business grew by
8%, Underlying volume growth was 4%.
Management Commentary:
Looking ahead in the near-term, consumer sentiment is
improving, input costs are stable and GST, it's a welcome
reform. However, there are transitional challenges that
need to be addressed. And for this our strategy remains
unchanged, focus on volume driven growth and
improvement in operating margin, while continuing to
deliver consistent, competitive, profitable and responsible
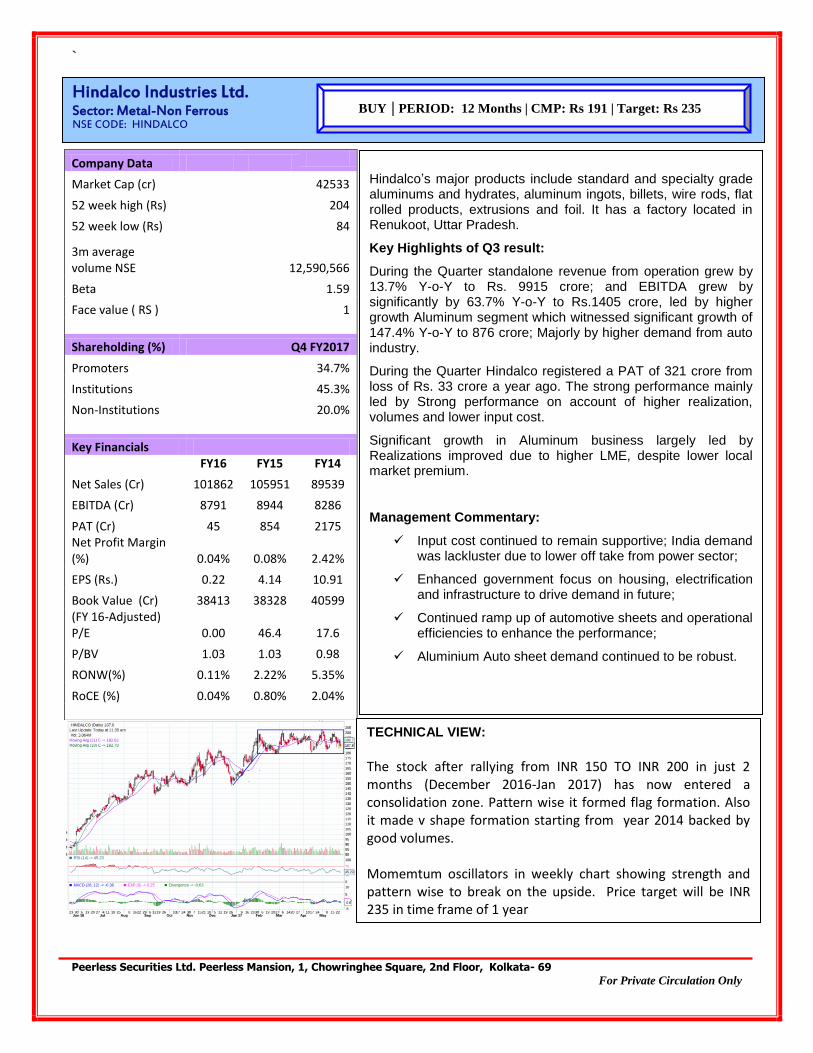
Hindalco’s major products include standard and specialty grade aluminums and hydrates, aluminum ingots, billets, wire rods, flat rolled products, extrusions and foil. It has a factory located in Renukoot, Uttar Pradesh.
Key Highlights of Q3 result:
During the Quarter standalone revenue from operation grew by 13.7% Y-o-Y to Rs. 9915 crore; and EBITDA grew by significantly by 63.7% Y-o-Y to Rs.1405 crore, led by higher growth Aluminum segment which witnessed significant growth of 147.4% Y-o-Y to 876 crore; Majorly by higher demand from auto industry.
During the Quarter Hindalco registered a PAT of 321 crore from loss of Rs. 33 crore a year ago. The strong performance mainly led by Strong performance on account of higher realization, volumes and lower input cost.
Significant growth in Aluminum business largely led by Realizations improved due to higher LME, despite lower local market premium.
Management Commentary:
Input cost continued to remain supportive; India demand was lackluster due to lower off take from power sector;
Enhanced government focus on housing, electrification and infrastructure to drive demand in future;
Continued ramp up of automotive sheets and operational efficiencies to enhance the performance;
Aluminium Auto sheet demand continued to be robust.
TECHNICAL VIEW:
The stock after rallying from INR 150 TO INR 200 in just 2 months (December 2016-Jan 2017) has now entered a consolidation zone. Pattern wise it formed flag formation. Also it made v shape formation starting from year 2014 backed by good volumes. Momemtum oscillators in weekly chart showing strength and pattern wise to break on the upside. Price target will be INR 235 in time frame of 1 year
TECHNICAL VIEW: Torrent Pharma has taken classical triple support around this current market price and historically have bounced back strongly from this support zone. At current price, the stock is close to its weekly moving average (200wma) which is a base level accumulation zone for long term investment We expect target of INR 1450 in a time frame of 12 months
The company has presence in cardiovascular and central nervous system, gastro-intestinal, dialectology, anti-infective and pain management segments. The Company operates only in one business segment viz. pharmaceuticals, comprising mainly manufacture of branded formulations.
Key Highlights of Q3 result: During the quarter revenue from operation de grew by 6% to Rs. 1443 crore from 1542 crore. On geography wise India revenue grew by 12% to Rs. 503 crore, whereas US business witnessed a significant de growth in revenue, down by 44% to Rs. 310 crore, the de growth was largely due to the impact on the base of the limited competition products that company have launched from the US earlier. Brazil, Germany and Others region witnessed a strong growth. Net profit for the quarter was up by 10.6% to Rs. 229 crore, improvement in revenue largely constitutes by higher other income, lower interest cost and lower employee cost.
On the 9M basis R&D filings number was 10, which includes two Derma ANDAs as well as two FTF. As of Dec-31 2016, Torrent has 21 ANDAs under review at the FDA along with 4 ANDAs for which company have received tentative approval. Furthermore for the US at the Dahej factory company received 8 approvals so far and management except to receive see further four approvals in this current year.
Management Commentary:
Overall as the company torrent continues to focus on specialty physicians in the branded generics market and continue to focus on sales force productivity and brand building as well as continued with enhanced focus on a pipeline building in this quarter as well as year to date R&D expenses are now at 7% of sales.
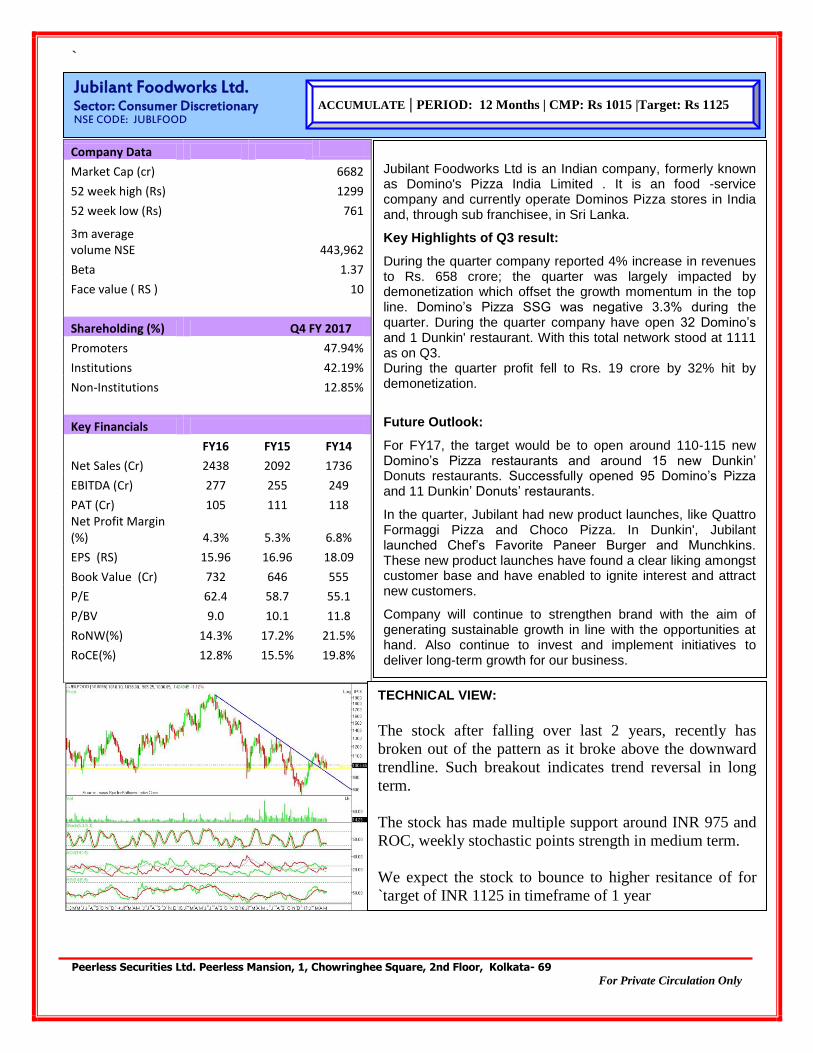
The stock after falling over last 2 years, recently has
broken out of the pattern as it broke above the downward
trendline. Such breakout indicates trend reversal in long
term.
The stock has made multiple support around INR 975 and
ROC, weekly stochastic points strength in medium term.
We expect the stock to bounce to higher resitance of for
`target of INR 1125 in timeframe of 1 year
Jubilant Foodworks Ltd is an Indian company, formerly known as Domino's Pizza India Limited . It is an food -service company and currently operate Dominos Pizza stores in India and, through sub franchisee, in Sri Lanka.
Key Highlights of Q3 result:
During the quarter company reported 4% increase in revenues to Rs. 658 crore; the quarter was largely impacted by demonetization which offset the growth momentum in the top line. Domino’s Pizza SSG was negative 3.3% during the quarter. During the quarter company have open 32 Domino’s and 1 Dunkin' restaurant. With this total network stood at 1111 as on Q3. During the quarter profit fell to Rs. 19 crore by 32% hit by demonetization.
Future Outlook:
For FY17, the target would be to open around 110-115 new Domino’s Pizza restaurants and around 15 new Dunkin’ Donuts restaurants. Successfully opened 95 Domino’s Pizza and 11 Dunkin’ Donuts’ restaurants.
In the quarter, Jubilant had new product launches, like Quattro Formaggi Pizza and Choco Pizza. In Dunkin', Jubilant launched Chef’s Favorite Paneer Burger and Munchkins. These new product launches have found a clear liking amongst customer base and have enabled to ignite interest and attract new customers.
Company will continue to strengthen brand with the aim of generating sustainable growth in line with the opportunities at hand. Also continue to invest and implement initiatives to deliver long-term growth for our business.
During the year Company’s unit sales grew by 9.8%, the net sales increased by 18.5%. This reflected the increase in share of higher segment models in the Company’s total sales. Along with it, higher non-operating income and material cost reduction initiatives help to make highest ever profit recorded of Rs 7338 crore, up by 36.8%, despite of foreign exchange movement and an increase in commodity prices.
During the quarter EBITDA has grew by 2.9% to Rs. 2561 crore and PAT has registered a de growth of 2% to Rs. 1709 crore.
Growth was broad-based, with almost half of the manufacturers showing improved sales over the previous year. New models were the primary growth drivers during the year. Reduction in lending rates, coupled with banks’ renewed focus on retail loans, and implementation of 7th Pay Commission supported the growth.
Future Outlook:
The Company worked extensively on network expansion, both in the existing channel as well as NEXA. The Company also introduced a new channel for light commercial vehicles taking the total network strength to 2,312 outlets.
Going forward, with increased political stability, the government’s focus on manufacturing and infrastructure development, lower interest rates, lower fuel prices, increasing consumption and reforms like GST, there is optimism with regard to economic growth. It is widely expected that the economy will support growth of the automobile industry.
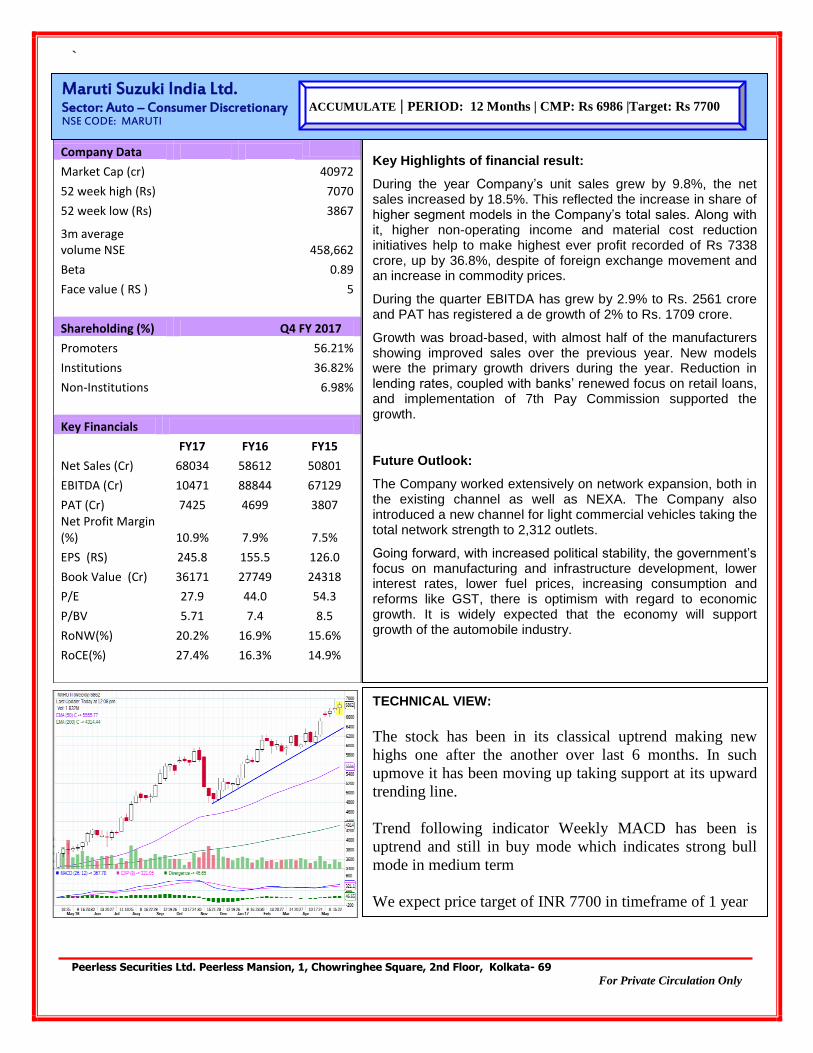
TECHNICAL VIEW:
The stock has been in its classical uptrend making new
highs one after the another over last 6 months. In such
upmove it has been moving up taking support at its upward
trending line.
Trend following indicator Weekly MACD has been is
uptrend and still in buy mode which indicates strong bull
mode in medium term
We expect price target of INR 7700 in timeframe of 1 year
BUY We expect the stock to deliver more than 15% returns over the next 12 months
ACCUMULATE We expect the stock to deliver 6% - 15% returns over the next 12 months
REDUCE We expect the stock to deliver 0% - 5% returns over the next 12 months
SELL We expect the stock to deliver negative returns over the next 12 months NOTE Target prices are for a period of 12-month perspective. Returns stated in the rating parameter are for our internal
benchmark.
TECHNICAL CALL RATING PARAMETER
BUY A condition that indicates a good time to buy a stock. The exact circumstances of the signal will be determined by the
indicator that an analyst is using.
SELL A condition that indicates a good time to sell a stock. The exact circumstances of the signal will be determined by the
indicator that an analyst is using.
STOP LOSS An instruction to the broker to buy or sell stock when it trades beyond a specified price. They serve to either protect
your profits or limit your losses.
DISCLOSURE/ DISCLAIMER Peerless Securities Ltd (PSL) e s t a b l i s h e d in 1995, is a subsidiary of Peerless General Finance & Investment Co Ltd. PSL is a corporate trading member of Bombay Stock Exchange Limited (BSE), Metropolitan Stock Exchange of India Limited (MSEI) & National Stock Exchange of India Limited (NSE). Our businesses include stock broking, services rendered in connection with distribution of primary market issues and financial products like mutual funds and fixed deposits, and depository services.
Peerless Securities Ltd is also a depository participant with National Securities Depository Limited (NSDL) and Central Depository Services (India) Limited (CDSL). We are registered as a Research Analyst under SEBI (Research Analyst) Regulations, 2014.
We hereby declare that our activities were neither suspended nor we have defaulted with any stock exchange authority with whom we are registered in last five years. However SEBI, Exchanges and Depositories have conducted the routine inspection and based on their observations have issued advise/warning/ deficiency letters/ or levied minor penalty on PSL for certain operational deviations. We have not been debarred from doing business by any Stock Exchange/ SEBI or any other authorities; nor has our certificate of registration been cancelled by SEBI at any point of time.
We offer our research services to clients as well as our prospects.
This document is not for public distribution and has been furnished to you solely for your information and must not be reproduced or redistributed to any other person. Persons into whose possession this document may come are required to observe these restrictions.
This material is for the personal information of the authorized recipient, and we are not soliciting any action based upon it. This report is not to be construed as an offer to sell or the solicitation of an offer to buy any security in any jurisdiction where such an offer or solicitation would be illegal. It is for the general information of clients of Peerless Securities Ltd. It does not constitute a personal recommendation or take into account the particular investment objectives, financial situations, or needs of individual clients.
We have reviewed the report, and in so far as it includes current or historical information, it is believed to be reliable though its accuracy or completeness cannot be guaranteed. Neither Peerless Securities Ltd, nor any person connected with it, accepts any liability arising from the use of this document. The recipients of this material should rely on their own investigations and take their own professional advice. Price and value of the investments referred to in this material may go up or down. Past performance is not a guide for future performance.
Certain transactions -including those involving futures, options and other derivatives as well as non-investment grade securities - involve substantial risk and are not suitable for all investors. Reports based on technical analysis centres on studying charts of a stock's price movement and trading volume, as opposed to focusing on a company's fundamentals and as such, may not match with a report on a company's fundamentals.
Opinions expressed are our current opinions as of the date appearing on this material only. While we endeavour to update on a reasonable basis the information discussed in this material, there may be regulatory, compliance or other reasons that prevent us from doing so. Prospective investors and others are cautioned that any forward-looking statements are not predictions and may be subject to change without notice. Our proprietary trading and group company/associate companies may make investment decisions that are inconsistent with the recommendations expressed herein.
PSL shall not be liable for any delay or any other interruption which may occur in presenting the data due to any reason including network (Internet) reasons or snags in the system, break down of the system or any other equipment, server breakdown, maintenance shutdown, breakdown of communication services or inability of the PSL to present the data. In no event shall PSL be liable for any damages, including without limitation direct or indirect, special, incidental, or consequential damages, losses or expenses arising in connection with the data presented by the PSL through this report.
We and our affiliates/associates, group companies, officers, directors, and employees, Research Analysts may: (a) from time to time, have long or short positions in, and buy or sell the securities thereof, of company (ies) mentioned herein or (b) be engaged in any other transaction involving such securities and earn brokerage or other compensation or act as a market maker in the financial instruments of the subject company/company (ies) discussed herein or act as advisor or lender / borrower to such company (ies) or have other potential/material conflict of interest with respect to any recommendation and related information and opinions at the time of publication of Research Report or at the time of public appearance. Peerless Securities Ltd (PSL) may have proprietary long/short position in the above mentioned scrip(s) and therefore may be considered as interested. The views provided herein are general in nature and does not consider risk appetite or investment objective of particular investor; readers are requested to take independent professional advice before investing. This should not be construed as invitation or solicitation to do business with PSL. Peerless Securities Ltd does not provide any promise or assurance of favourable view for a particular industry or sector or business group in any manner. The investor is requested to take into consideration all the risk factors including their financial condition, suitability to risk return profile and take professional advice before investing.
The analyst for this report certifies that all of the views expressed in this report accurately reflect his or her personal views about the subject company or companies and its or their securities, and no part of his or her compensation was, is or will be, directly or indirectly related to specific recommendations or views expressed in this report.
Details of Associates and group companies are available on our website i.e. www.peerlesssec.co.in
Research Analyst has served as an officer, director or employee of subject company(ies): No
Research Analyst’s financial interest in the subject company(ies): No
Peerless Securities Limited has financial interest in the subject company (ies): Yes
Research Analyst has actual/beneficial ownership of 1% or more securities of the subject company(ies) at the end of the month immediately preceding the date of publication of Research Report: No
Peerless Securities Ltd has actual/beneficial ownership of 1% or more securities of the subject company (ies) at the end of the month immediately preceding the date of publication of Research Report: No
We or our associates may have received compensation from the subject company (ies) in the past 12 months. We or our associates may have received compensation for investment banking or merchant banking or brokerage services from the subject company(ies) in the past 12 months. We or our associates may have received any compensation for products or services other than investment banking or merchant banking or brokerage services from the subject company(ies) in the past 12 months. We or our associates may have received compensation or other benefits from the subject company(ies) or third party in connection with the research report. Our associates may have financial interest in the subject company (ies).
Our associates/Group Companies may have actual/beneficial ownership of 1% or more securities of the subject company(ies) at the end of the month immediately preceding the date of publication of Research Report.
Subject company(ies) may have been client during twelve months preceding the date of distribution of the research report.
"A graph of daily closing prices of securities is available at www.nseindia.com (Choose a company from the list on the browser and select the "three years" icon in the price chart)."
SEBI Registration No: NSE INB/INE/INF 230821137, BSE INB010821131, BSE Currency- SEBI registered; AMFI ARN 2103, Research Analyst INH300002365. NSDL: IN-DP-NSDL-96-99, DP ID: IN300958; CDSL: IN-DP-CDSL-505-2009; CIN: U67120WB1995PLC067616
Our research should not be considered as an advertisement or advice, professional or otherwise. The investor is requested to take into consideration all the risk factors including their financial condition, suitability to risk return profile and the like and take professional advice before investing. Investments in securities are subject to market risk, please read all the related documents carefully before investing. Please read the SEBI prescribed Combined Risk Disclosure Document (refer to SEBI website) prior to investing. Derivatives are a sophisticated investment device. The investor is requested to take into consideration all the risk factors before actually trading in derivative contracts.


![Peerless Masterpicks - March 2017 edition...[Type text] 23 rd February 2017 For regular market watch update, please scan the QR code Peerless Securities Limited Peerless Mansion, 1,](https://static.documents.pub/doc/80x56/5fe06e3160d8761535343a77/peerless-masterpicks-march-2017-type-text-23-rd-february-2017-for-regular.jpg)


