Date post: | 30-Dec-2015 |
Category: |
Documents |
Upload: | alfred-chase |
View: | 223 times |
Download: | 0 times |
PENNSTATE
© T. W. SIMPSONPENNSTATE
Optimization Approaches for Product Family DesignOptimization Approaches for Product Family Design
Timothy W. SimpsonProfessor of Mechanical & Industrial Engineering and Engineering DesignThe Pennsylvania State University
University Park, PA 16802 USA
phone: (814) 863-7136email: [email protected]
http://www.mne.psu.edu/simpson/courses/me546
ME 546 - Designing Product Families - IE 546
© T. W. SIMPSON
PENNSTATE
© T. W. SIMPSON
Optimization in Product Family DesignOptimization in Product Family Design
• Optimization can be a helpful tool to support design decision-making
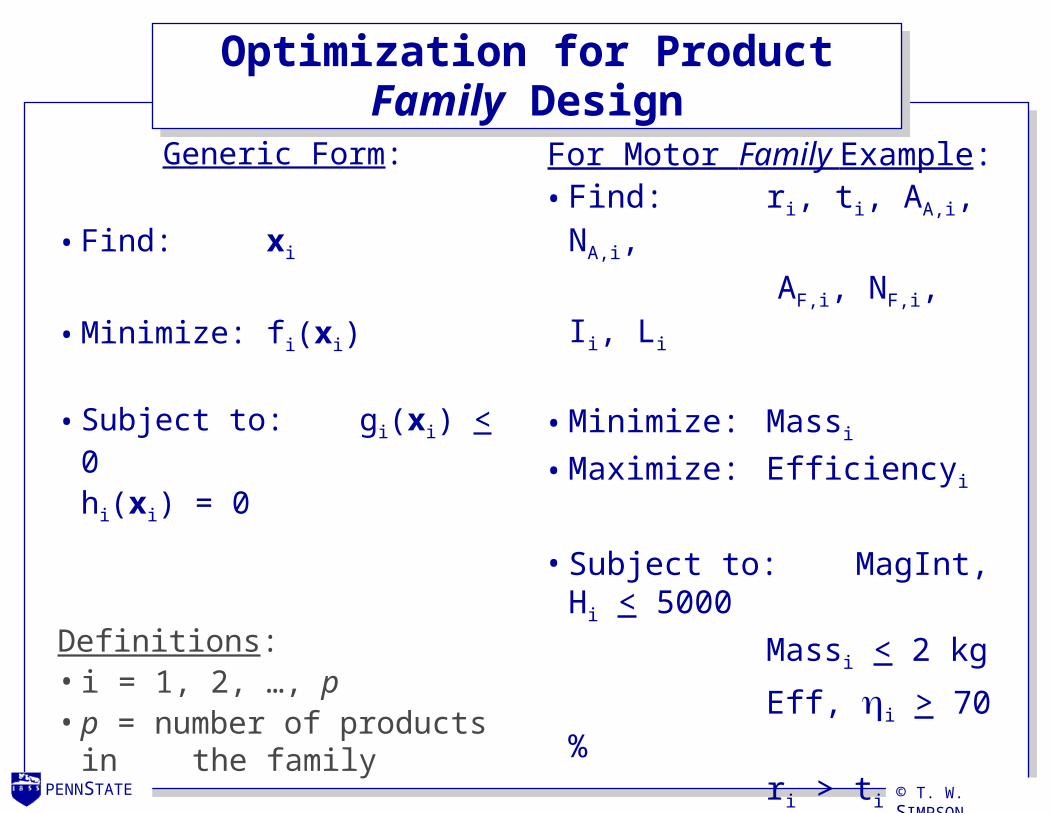
• Optimization is frequently used in product design to help determine values of design variables, x, that minimize (or maximize) one or more objectives, f(x), with satisfying a set of constraints, {g(x), h(x)}
• In product family design, optimization can be used to help balance the tradeoff between commonality and individual product performance in the family
• Let’s consider a motivating example to define key terms and introduce different optimization formulations
PENNSTATE
© T. W. SIMPSON
Motivating ExampleMotivating Example
Objective: Design a family of ten (10) universal electric motors based on a product platform to provide a variety of power and torque outputs
PENNSTATE
© T. W. SIMPSON
• Universal motor is most common component in power tools
• Challenge: redesign the universal motor to fit into 122 basic tools with hundreds of variations
• Result: a common platform where geometry and axial profile common stack length varied from 0.8”-1.75”
to obtain 60-650 Watts fully automated assembly process material, labor, and overhead costs
reduced from $0.51 to $0.31 labor reduced from $0.14 to $0.02
Universal Motor Platform Example
Electric motor field componentsprior to standardization
Universal motor variants0.8” 1.75”
60
650
Wat
ts
Stack length
PENNSTATE
© T. W. SIMPSON
Scale-based Family: Rolls Royce Engines
• Rolls Royce scales its aircraft engines to efficiently and effectively satisfy a variety of performance requirements
Incremental improvements and variations made to increase thrust and reduce fuel consumption
RTM322 is common to turboshaft, turboprop, and turbofan engines When scaled 1.8x, RTM322 serves as the core for RB550 series
PENNSTATE
© T. W. SIMPSON
Example Leveraging Strategies: Boeing Aircraft
• Boeing 737 is divided into 3 platforms: Initial-model (100 and 200) Classic (300, 400, and 500) Next generation (600, 700,
800, and 900 models)
• The new 777 is also being designed knowing a priori that it will be stretched to carry more passengers and increase range
PENNSTATE
© T. W. SIMPSON
Boeing 737 Interior Layouts
737-300126 passengers (8 first class)
737-400147 passengers (10 first class)
737-500110 passengers (8 first class)
737-600110 passengers (8 first class)
737-700126 passengers (8 first class)
737-800162 passengers (12 first class)
737-900177 passengers (12 first class)
PENNSTATE
© T. W. SIMPSON
Flight Ranges for 737-300, -500, -600, and -700
Flight Ranges for 737-700
Flight Ranges for 737-300
Capacity: 126 Passengers Capacity: 110 Passengers
Flight Ranges for 737-600
Flight Ranges for 737-500
PENNSTATE
© T. W. SIMPSON
Dimensions of Boeing 737-300, -400, and -500
Boeing 737-300 Boeing 737-400 Boeing 737-500
• All three aircraft share common height and width...
…but their fuselage lengths are different:
PENNSTATE
© T. W. SIMPSON
Boeing 737-600
Dimensions of Boeing 737-600, -700, -800, and -900
• The same holds true for the 737-600 through 900
Boeing 737-900
Boeing 737-700
Boeing 737-800
PENNSTATE
© T. W. SIMPSON
Optimization for Single Product DesignOptimization for Single Product Design
Generic Form:
• Find: x
• Minimize: f(x)
• Subject to: g(x) < 0h(x) = 0
Definitions:• x = design variables• f(x) = objective function• g(x) = inequality constraints• h(x) = equality constraints
For Motor Example:• Find: r, t, AA, NA,
AF, NF, I, L
• Minimize: Mass• Maximize: Efficiency,
• Subject to: MagInt, H < 5000
Mass < 2 kg
Eff, > 70 %r > tPower = 300 WTorque = 0.5
Nm
PENNSTATE
© T. W. SIMPSON
Optimization for Product Family Design
Generic Form:
• Find: xi
• Minimize: fi(xi)
• Subject to: gi(xi) < 0
hi(xi) = 0
Definitions:• i = 1, 2, …, p • p = number of products in
the family
For Motor Family Example:• Find: ri, ti, AA,i, NA,i,
AF,i, NF,i, Ii, Li
• Minimize: Massi
• Maximize: Efficiencyi
• Subject to: MagInt, Hi < 5000
Massi < 2 kg
Eff, i > 70 %
ri > ti
Poweri = 300 W
Torquei = Ti
where:Ti = {0.05, 0.1, 0.125, 0.2, 0.25, 0.3, 0.35,
0.4, 0.45, 0.5} Nm
PENNSTATE
© T. W. SIMPSON
Challenges in Product Family OptimizationChallenges in Product Family Optimization
• The dimensionality and size of the optimization problem increases very quickly as the number of products in the family increases
• For motor example, p = 10: Number of design variables = 8 x p = 8 x 10 = 80 Number of objective functions = 2 x p = 2 x 10 = 20 Number of constraints = 6 x p = 6 x 10 = 60
• Using a product platform will reduce the dimensionality of the optimization problem but not the size (i.e., the number of objectives or constraints): Number of design variables = c + (n-c) x p
where: c = number of common (platform) variablesn = number of design variables for each of the p
products
PENNSTATE
© T. W. SIMPSON
Product Platform Concept Exploration Method
Step 1Create Market Segmentation Grid
Step 2Classify Factors and Ranges
Step 3Simulation Analysis/Metamodels
Step 4Aggregate Product Platform Specifications
Step 5Develop Product Platform and Family
MarketSegmentation
Grid
Robust DesignPrinciples
MetamodelingTechniques
MultiobjectiveOptimization
Product Platform and Product Family Specifications
Overall Design Requirements
The PPCEM provides a Method that facilitates the synthesis and Exploration of a common Product Platform Concept that can be scaled into an appropriate family of products to satisfy a variety of market niches
PENNSTATE
© T. W. SIMPSON
Robust Design and Scalable Product Platforms
• Robust design principles are used to minimize the sensitivity of a product platform (and resulting product family) to changes in one or more scale factors
Functional• torque = fcn(motor stack length)• thrust = fcn(# compressor stages)
Conceptual/configurational• # passengers on an aircraft• size of an automobile underbody
Example Scaling VariablesPlatform
High
Mid
Low
Segment A Segment B Segment C
High
Mid
Low
Segment A Segment CSegment B
Platform
Scale dow
n
Sca
le u
p
Low-End Platform Leveraging
High-End Platform Leveraging
PENNSTATE
© T. W. SIMPSON
Compromise Decision Support ProblemCompromise Decision Support Problem
A hybrid of Goal Programming and Math Programming used to determine the values of design variables that satisfy a set of constraints and achieve as closely as possible a set of conflicting goals
Given Assumptions to model domain of interestSimulation and analyses to relate X and Y
Find Xi i = 1, …, n di-, di
+ i = 1, …,
m
SatisfySystem constraints (linear, nonlinear)
gi(X) = 0 ; i = 1, .., p
gi(X) < 0 ; i = p+1, .., p+q
System goals (linear, nonlinear)Ai(X) + di
- + di+ = Gi ; i = 1, …, m
BoundsXj
min < Xj < Xjmin; j = 1, …, n
di-, di
+ < 0 ; di- • di
+ = 0 ; i = 1, …, m
MinimizeDeviation Function
Z = { f1(di-, di
+), ..., fk(dk-, dk
+) }
FeasibleDesignSpace
Deviation Function
AspirationSpace
ConstraintsBounds
Goals
x1
x2
Reference: (Mistree, et al., 1993)
PENNSTATE
© T. W. SIMPSON
Platform Leveraging Strategy
PowerTools
Lawn &Garden
KitchenAppliances
High CostHigh Performance
Mid-Range
Low CostLow Performance
Ver
tical
Sca
ling
Standardizing motorinterfaces will facilitatehorizontal leveraging
to new segments
Standardizing motorinterfaces will facilitatehorizontal leveraging
to new segments
Lawn &Garden
KitchenAppliances
Universal Motor Platform(Common Design Variable Settings)
Design a single motor platform scaled by stack length
PENNSTATE
© T. W. SIMPSON
Electric Motor Family Design Problem IElectric Motor Family Design Problem I
• Platform parameters (common to all motors): radius of motor, r on armature:
– wire x-sectional area, AA
– number of wraps, NA
• Scaling variable (1/motor): i = 1, …, 10 stack length, Li
• Constraints (6/motor) and Objectives (2/motor):
thickness of motor, t on field:
– wire x-sectional area, AF
– number of wraps, NF
Name ConstraintMagnetizing Intensity, H Hi = 5000 Amp·turns/mFeasible geometry ro,i > tiPower, P Pi = 300 WTorque, T Ti = {0.05, 0.1, 0.125, 0.15, 0.2, 0.25, 0.3, 0.35, 0.4, 0.5} NmEfficiency,
i = 0.15 (Target = 70%)Mass, M Mi = 2.0 kg (Target = 0.5 kg)
PENNSTATE
© T. W. SIMPSON
Two-Stage Optimization Approach in PPCEM
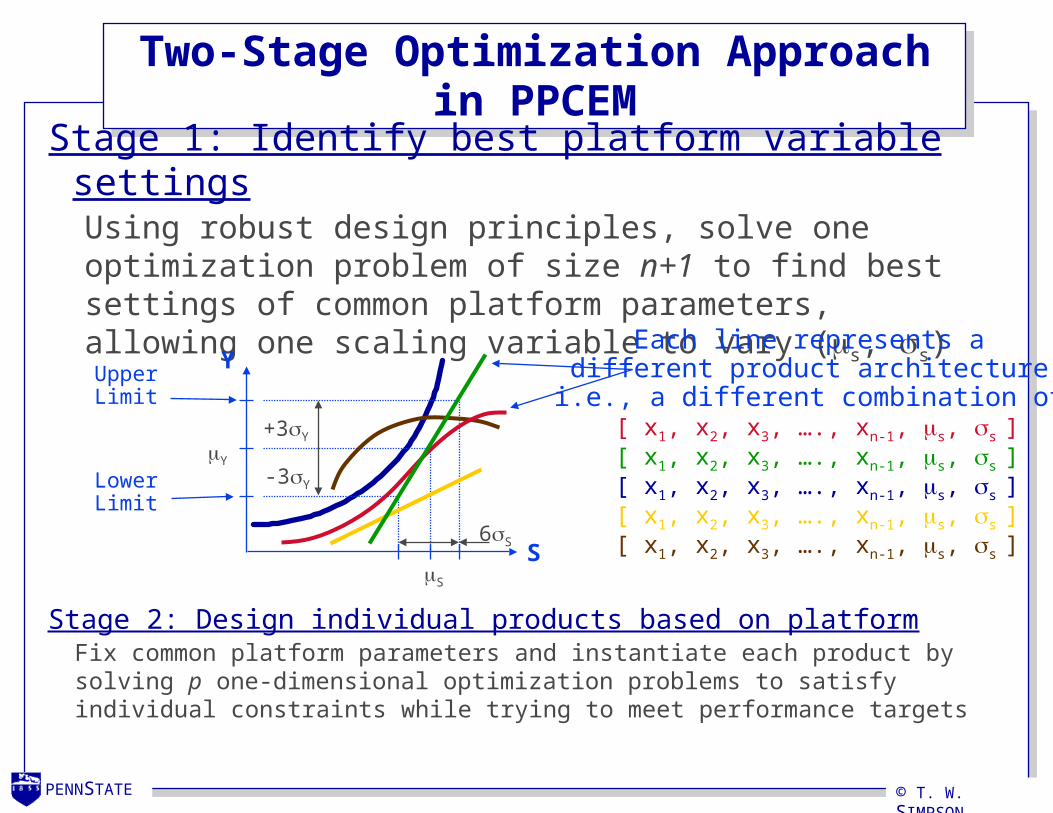
Stage 2: Design individual products based on platform Fix common platform parameters and instantiate each product by solving p one-dimensional optimization problems to satisfy individual constraints while trying to meet performance targets
Stage 1: Identify best platform variable settings Using robust design principles, solve one optimization problem of size n+1 to find best settings of common platform parameters, allowing one scaling variable to vary (s, s)
S
6S
Y
+3Y
-3Y
Y
S
LowerLimit
UpperLimit
Each line represents a different product architecture,i.e., a different combination of:
[ x1, x2, x3, …., xn-1, s, s ][ x1, x2, x3, …., xn-1, s, s ][ x1, x2, x3, …., xn-1, s, s ][ x1, x2, x3, …., xn-1, s, s ][ x1, x2, x3, …., xn-1, s, s ]
PENNSTATE
© T. W. SIMPSON
Stage 1 Using robust design principles, solve one optimization problem of size 8 to find best settings of common platform parameters, allowing one scaling variable to vary (stack_length, stack_length)
T
+3T
-3T
T
L
LowerTorqueLimit
UpperTorqueLimit
L
6L
Each line represents a different product architecture,i.e., a different combination of:
[r, t, Aarmature, Narmature, Afield, Nfield][r, t, Aarmature, Narmature, Afield, Nfield][r, t, Aarmature, Narmature, Afield, Nfield][r, t, Aarmature, Narmature, Afield, Nfield][r, t, Aarmature, Narmature, Afield, Nfield]
Optimization Problem for Motor FamilyOptimization Problem for Motor Family
Stage 2 Fix common platform parameters and instantiate each product by solving 10 one-dimensional optimization problems to satisfy individual constraints while trying to meet performance targets
PENNSTATE
© T. W. SIMPSON
L [cm] T [Nm] [%] M [kg]
2.44 0.50 47.9 0.83
2.40 0.40 53.1 0.82
2.33 0.35 55.9 0.80
2.21 0.30 58.8 0.78
2.04 0.25 61.8 0.73
1.81 0.20 65.1 0.68
1.50 0.15 68.5 0.61
1.32 0.13 70.3 0.56
1.11 0.10 72.2 0.51
0.62 0.05 76.0 0.40
Resulting Product Family Specifications
Universal Motor Platform{Nc, Ns, Awa, Awf, r, t}
1273, 61, 0.27, 0.27, 2.67, 7.75
High
Mid
Low
Product platform obtainedusing PPCEM
Platform instantiations
Na, Nf, A f, Aa, r, t L [cm] T [Nm] [%] M [kg]
1087, 72, 0.28, 0.25, 2.71, 7.15 3.16 0.50 55.3 0.99
1082, 72, 0.27, 0.24, 2.58, 6.67 2.87 0.40 57.7 0.84
1056, 73, 0.26, 0.24, 2.51, 6.46 2.81 0.35 59.8 0.78
1030, 73, 0.25, 0.23, 2.44, 6.35 2.74 0.30 62.2 0.71
1007, 73, 0.25, 0.22, 2.35, 6.17 2.61 0.25 64.9 0.64
988, 74, 0.24, 0.22, 2.26, 5.75 2.38 0.20 67.9 0.56
785, 95, 0.21, 0.21, 2.82, 8.88 1.63 0.15 70.5 0.50
760, 89, 0.19, 0.20, 3.12, 11.20 1.41 0.13 70.0 0.50
750, 76, 0.19, 0.20, 3.31, 11.77 1.28 0.10 70.6 0.50
730, 45, 0.20, 0.21, 3.62, 9.69 0.998 0.05 71.4 0.50
Group of individually designed motors
PENNSTATE
© T. W. SIMPSON
Comparison of Results: Individual Motors
0.3
0.4
0.5
0.6
0.7
0.8
0.9
1
40% 50% 60% 70% 80%
Efficiency
Mas
s (k
g)
Benchmark GroupPPCEM (s=length)
DesiredEfficiency(> 70%)
Desired Mass(< 0.5 kg)
4
3
2
1
8
10
9
8
7
6
5
4321
6
Desired Performance Region(i.e., targets for mass and efficiency are achieved)
9
5
710
PENNSTATE
© T. W. SIMPSON
Single-Stage Optimization ApproachOptimize product platform and product family members simultaneously by determine values of c common parameters for the product platform and s scaling variables for each product by solving one optimization problem of dimension (c + s*p)
where:
p = # products in the familyn = # design variables per product in the familys = # scaling variables per product in the familyc = # common platform variables (n = c + s)
Single-Stage Optimization Approach
• Use multiobjective optimization to formulate the product family optimization problem and resolve the tradeoff between commonality and individual performance
PENNSTATE
© T. W. SIMPSON
Universal Motor Family Design Problem II
• Design variables (8/motor): i = 1, …, 10 stack length, Li
radius of motor, ri
on armature:– wire x-sectional area, AA,i
– number of wraps, NA,i
• Constraints (6/motor) and Objectives (2/motor):
current, Ii
thickness of motor, ti
on field:– wire x-sectional area, AF,i
– number of wraps, NF,i
Name ConstraintMagnetizing Intensity, H Hi = 5000 Amp·turns/mFeasible geometry ro,i > tiPower, P Pi = 300 WTorque, T Ti = {0.05, 0.1, 0.125, 0.15, 0.2, 0.25, 0.3, 0.35, 0.4, 0.5} NmEfficiency,
i = 0.15 (Target = 70%)Mass, M Mi = 2.0 kg (Target = 0.5 kg)
PENNSTATE
© T. W. SIMPSON
10
Comparison of Results: Individual Motors
0.3
0.4
0.5
0.6
0.7
0.8
0.9
1
40% 50% 60% 70% 80%
Efficiency
Mas
s (k
g)
DesiredEfficiency(> 70%)
Desired Mass(< 0.5 kg)
108
6
5
4
3
1
9
7
2
1
2
4
5
678
3
10
9
8
7
6
5
4321
Desired Performance Region(i.e., targets for mass and efficiency are achieved)
10 98
7
6
5
4
3
2
1
Benchmark Group
PhysPro (s=length)PPCEM (s=length)
PhysPro (s=radius)
9
PENNSTATE
© T. W. SIMPSON
Comparison of ApproachesComparison of Approaches
• Single-stage approaches:+ yield performance improvements over two-stage approaches + use only a single optimization to determine best settings of
common and scaling variables
- increases dimensionality of optimization (many local optima)- assume best scaling variables are known a priori
• Two-stage approaches:+ provides flexible formulation for determining best combination
of common parameters and scaling variables within a family+ reduces dimensionality of optimization
- increases number of optimizations that must be solved- segments optimization of platform from individual products
which can lead to performance degradation within family
PENNSTATE
© T. W. SIMPSON
Varying Platform Commonality
• Ideally, an optimization algorithm would search all possible product platform combinations:
where:
the number of possible combinations of making n design variables common to platform c at a time
the null platform, i.e., no commonality within the family
and provide the designer with information about the:1) design variables that should be made common2) the values that they should take3) the values the remaining unique variables should take
n
0
n
1
n
2
n
1-n
n
n
n2esalternativ platform #
c
n
0
n
PENNSTATE
© T. W. SIMPSON
Genetic AlgorithmsGenetic Algorithms
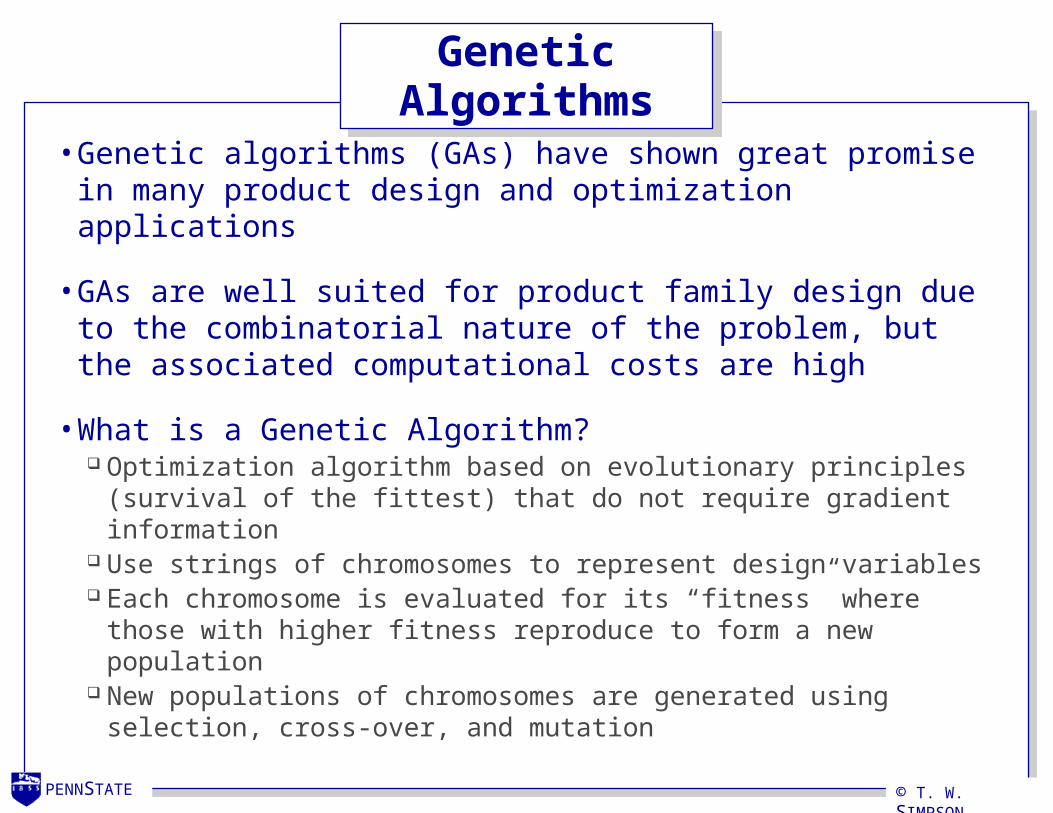
• Genetic algorithms (GAs) have shown great promise in many product design and optimization applications
• GAs are well suited for product family design due to the combinatorial nature of the problem, but the associated computational costs are high
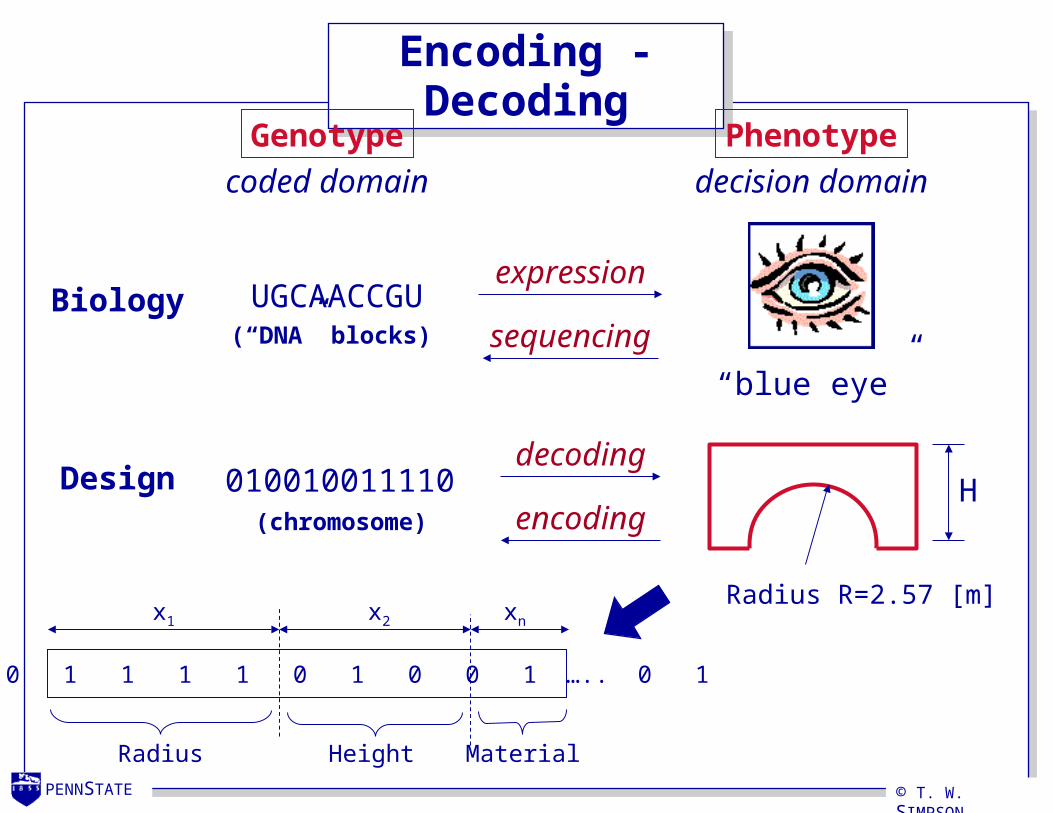
• What is a Genetic Algorithm? Optimization algorithm based on evolutionary principles
(survival of the fittest) that do not require gradient information Use strings of chromosomes to represent design variables Each chromosome is evaluated for its “fitness” where those
with higher fitness reproduce to form a new population New populations of chromosomes are generated using
selection, cross-over, and mutation
PENNSTATE
© T. W. SIMPSON
GA TerminologyGA Terminology
Chromosome
Population
Generation k Generation k+1
Selection CrossoverMutationInsertion
Geneticoperators
Individuals
gene
0 1 0 1 1 1 1 0 1 0 0 1 ….. 0 1
alleles
PENNSTATE
© T. W. SIMPSON
Encoding - DecodingEncoding - Decoding
PhenotypeGenotype
Biology
Design
“blue eye”
UGCAACCGU(“DNA” blocks)
010010011110
expression
(chromosome)
decoding
encoding
Radius R=2.57 [m]
H
sequencing
coded domain decision domain
0 1 0 1 1 1 1 0 1 0 0 1 ….. 0 1
Radius Height Material
x1 x2 xn
PENNSTATE
© T. W. SIMPSON
Basic Operation of a Genetic AlgorithmBasic Operation of a Genetic Algorithm
Initialize Population (initialization)
Select individual for mating (selection)
Mate individuals and produce children (crossover)
Mutate children (mutation)
Insert children into population (insertion)
Are stopping criteria satisfied?
Finish
yn
nex
t ge
ner
atio
n
Reference: Goldberg, D.E., 1989, Genetic Algorithms in Search, Optimization and Machine Learning, Addison Wesley
PENNSTATE
© T. W. SIMPSON
Genetic Operators: Selection Genetic Operators: Selection
Roulette Wheel Selection
12
3
45
6
Probabilistically select individuals based on some measure of their performance.
Sum Sum of individual’sselection probabilities
3rd individual in currentpopulation mapped to interval[0,Sum]
• Selection: generate random number in [0,Sum]• Repeat process until desired # of individuals areselected• Basically: stochastic sampling with replacement
PENNSTATE
© T. W. SIMPSON
Genetic Operators: SelectionGenetic Operators: Selection
2 members of currentpopulation chosen randomly
Dominant performerplaced in intermediatepopulation of survivors
PopulationFilled ?
Crossover andMutation form newpopulation
Old Population Fitness101010110111 8100100001100 4001000111110 6
Survivors Fitness101010110111 8001000111110 6101010110111 8
n
y
Tournament Selection
PENNSTATE
© T. W. SIMPSON
Genetic Operators: Crossover and Mutation
Classical: single point crossover
0 1 1 0 1
1 0 0 1 1
The parents
0 1 1 1 1
1 0 0 0 1
crossoverpoint
The children(“offspring”)
P1
P2
O1
O2
• Crossover takes 2 solutions and creates 1 or 2 more
• Mutation randomly changes one or more alleles in the chromosome to increase diversity in the population
With mutation probability Pm, O2: 1 0 0 0 1 1 0 1 0 1
PENNSTATE
© T. W. SIMPSON
Genetic Operators: InsertionGenetic Operators: Insertion
• Replacement scheme specifies how individuals from the parent generation k are chosen to be replaced by children from next generation k+1: Can replace an entire population at a time (go from generation k to k+1
with no survivors)– select N/2 pairs of parents– create N children, replace all parents– polygamy is generally allowed
Can select two parents at a time– create one child– eliminate one member of population (usually the weakest)
“Elitist” strategy– small number of fittest individuals survive unchanged
“Hall-of-fame” strategy– remember best past individuals, but do not use them for progeny
PENNSTATE
© T. W. SIMPSON
Stopping CriteriaStopping Criteria
Generation
Globaloptimum
(unknown)
Converged toofast (mutation ratetoo small?)A
vera
ge f
itnes
s
Typical convergenceTypical convergence
• There are a variety of stopping criteria: A specific number of generations completed - typically O(100) Mean deviation in individual performance falls below a
threshold k< (i.e., genetic diversity has become small) Stagnation - no or marginal improvement from one generation
to the next: (Fn+1 - Fn)<
PENNSTATE
© T. W. SIMPSON
Using GAs in Product Family DesignUsing GAs in Product Family Design
• Chromosomes typically represent a single product:
• For product family design, one can use multiple chromosomes to represent the products in the family:
• This requires added overhead to: make sure all products exist in equal numbers cluster products into families within each population ensure that selection and cross-over operators are performed
only on similar products
0 1 0 1 1 0 … 1 = one motor
= motor # 1
= motor # 2
= motor # 3
= motor # 8
= motor # 9
= motor # 10
0 1 0 1 0 0 … 0
0 1 1 0 1 0 … 0
1 1 0 1 1 0 … 0
1 1 1 1 1 0 … 1
0 1 1 1 1 1 … 1
1 1 1 1 1 1 … 1
PENNSTATE
© T. W. SIMPSON
Using GAs in Product Family Design (cont.)Using GAs in Product Family Design (cont.)
• Alternatively, you can extend a single chromosome to represent the entire product family:
• Adds overhead during the decoding process, but fitness function will be evaluated for the entire family genetic operators can be applied with little to no modification
• Challenge is to determine how to represent a platform within the family of products Specify common/unique variables a priori during initialization? Or let the GA vary the levels of commonality of the platform?
…0 1 0 1 0 0 … 0 1 0 0 1 0 0 … 1 1 1 1 1 1 0 … 1
motor # 1 motor # 2 motor # 10
PENNSTATE
© T. W. SIMPSON
Varying Platform Commonality with GA
• Add n commonality controlling genes to chromosomeThe length, L, of each chromosome in the GA is
determined by the number of design variables, n, and the number of products in the family, p:
L = n + np
...
Commonalitycontrolling genes
Design variablesfor Product 1
Design variablesfor Product p
0 1 0 0 ... 1 u11 c2 u31 u41… cn u1p c2 u3p u4p
… cn
• First n genes in the chromosome control the level of platform commonality: 0=unique, 1=common to family
PENNSTATE
© T. W. SIMPSON
Product Family Penalty FunctionProduct Family Penalty Function
• Incorporate a Product Family Penalty Function (PFPF) as an additional objective function, which provides a surrogate for manufacturing cost savings
• PFPF was introduced by Martinez, Messac, & Simpson (2000) to minimize variability of design variables within a product family to promote commonality
pvarj is the percent variation of the jth design variable:
p
p1i
ijj
xx
j
j
xvarjpvar
n
1ijpvarPFPF :Min
p
p1i
2jij
j)1()xx(
varwhere:
PENNSTATE
© T. W. SIMPSON
Step 1:Identify design
variables that could be made common
Step 2:Perform DOE to
check for possible reduction in design variables
Step 3:Identify reduced set of
design variables
Step 4:Make sample runsto determine GA
parameters
Step 7:Check constraint
violation and design feasibility
Step 8:Compute fitness values
for each designconfiguration
Step 5:Use GA to generate
design variable configurations
Step 6:Run simulation/synthesis
program for productfamily using GA
Manufacturingfeasibilityanalysis
Costanalysis
IdentifyBest
Design
Finalgen?
Yes
No
GA-Based Method for Product Family Design
PENNSTATE
© T. W. SIMPSON
Applying the GA-based Method to GAA Example
• Step 1: Identify design variables that could be made common to the platform There are 8 design variables that define each motor:
x = (r, t, Aa, Na, Af, Nf, I, L)
• Step 2: Perform DOE to check for possible reduction in number of design variables Typically used if design variables are > 8-10 Not needed for motor example
• Step 3: Identify reduced set of design variables Not necessary for this motor example
PENNSTATE
© T. W. SIMPSON
2.71
• Step 4: Setup GA for varying platform commonalityEach chromosome is 88 genes long (8 + 8*10)
Varying Platform Commonality in GAA Example
Commonalitycontrolling genes
(0=unique, 1=common)
Design variablesfor 1st motor
1
These genes are treated as variables that can take values of {0,1} and are subject to
mutation and cross-over
These genes are treated as variables that can take values of {0,1} and are subject to
mutation and cross-over
These genes can take on any real value within each variable’s boundsThese genes can take on any real
value within each variable’s bounds1 1 1 1 1 0 0
7.15 750 0.28 120 0.25 3.32 0.95 2.71 7.15 750 0.28 120 0.25 4.56 3.21
Design variablesfor 10th motor
...
PENNSTATE
© T. W. SIMPSON
Simulate Performance of GAA Families
• Step 5: Use GA to generate a population of solutions Create product family alternatives (chromosomes) using
selection, cross-over, and mutation We use NSGA-II algorithm from: <http://www.iitk.ac.in/kangal/>
• Step 6: Run simulation and/or analysis for each product in the family using GA generated design variables Developed a set of analytical equations to evaluate performance
of each motor: mass, efficiency, power, torque, etc.
• Step 7: Check each chromosome for constraint violation and design feasibility Each motor is checked against the set of constraints to ensure
that is feasible
PENNSTATE
© T. W. SIMPSON
• Step 8: Compute the three “fitness” values for each motor family (chromosome) in the generation
Fitness Function 1 (to minimize) = Mi
Fitness Function 2 (to maximize) = i
Fitness Function 3 (to minimize) = pvarj
where:– Mi and i are summed over i = 1, …, 10
– pvarj is the % variation in the jth design variable, j = 1, …, 8
Compute Fitness and PFPFCompute Fitness and PFPF
PENNSTATE
© T. W. SIMPSON
Result: Multiple Platforms and Multiple Families
New challenge: which platform and family do we choose?
A: -NSGA-II families(Simpson, et al., 2005)
B: NSGA-II families(Simpson, et al., 2005)
C: Two-stage; radius scaled(Nayak, et al., 2002)
D: Single-stage; length scaled(Messac, et al., 2002)
E: Hierarchical sharing(Hernandez, et al., 2002)
F: Ant colony optimization(Kumar, et al., 2004)
G: Preference aggregation(Dai and Scott, 2004)
H: Sensitivity/cluster analysis (Dai and Scott, 2004)
PENNSTATE
© T. W. SIMPSON
Generalizing Commonality and Scalability Issues
• Collaborating with Dr. Jeremy Michalek and Aida Khajavirad (CMU) to create an efficient and decomposable GA-based formulation that allows for partial commonality in a family
MOGA for 1MOGA for 1stst ProductProduct
MOGAMOGAfor Platform Selectionfor Platform Selection
Maximize Commonality
Minimize Sum of deviations from product targets received from Sub-GAs
With respect to Commonality chromosome
Minimize Deviation from 1st
product performance targets
Maximize Commonality
With respect to: 1st product design variables
Subject to: 1st productperformance constraints
MOGA for MOGA for ppthth ProductProduct
Minimize Deviation from pth
product performance targets
Maximize Commonality
With respect to: pth product design variables
Subject to: pth productperformance constraints
CommonalityCommonalityDeviationDeviation
DecomposableGA formulation
allows for parallelimplementation toimprove scalability
to large familiesof products
Source: (Khajavirad, et al., 2006)
PENNSTATE
© T. W. SIMPSON
Chromosome Representations for Problem
2
2
x11 x13 x14 x15
x33 x35 x41 x43 x44 x45
x23 x24 x25
Generalized commonality requires a 2D representation to define platform variable sharing and enforce design variable sharing among the variants
Product variants are represented using regular
chromosome coding
Source: (Khajavirad, et al., 2006)
PENNSTATE
© T. W. SIMPSON
Sample ResultsSample Results
• Solutions from generalized commonality formulation dominate all of the all-or-none commonality solutions
Co
mm
on
alit
y
Performance0.2
0.3
0.4
0.5
0.6
0.7
0.8
0.9
1.0
0.67 0.675 0.68 0.685
All-or-nonecommonality
Generalizedcommonality
Source: (Khajavirad, et al., 2006)
PENNSTATE
© T. W. SIMPSON
A Valuable Lesson from the Motor Example
• Optimization can provide a useful decision support tool for product family and product platform design In motor example, the resulting family should be scaled around
radius, not stack length, to achieve specified performance
• So why did B&D choose stack length? Manufacturing considerations and production costs dictated
decision: it was more economical to scale the motor along its stack length and wrap more wire around it than scale it radially
• Lesson: optimization can be useful for product family planning and strategic decision making, provided the right aspects are modeled for the individual products as well as the product family as a whole
PENNSTATE
© T. W. SIMPSON
Ongoing and Future Research Directions
• Classification of product family optimization problems: Number of stages in optimization process Platform defined a priori or a posteriori Single or multiple objectives Type of optimization algorithm Number of products in the family and type of family Module and/or scale-based product family
( configuration and/or parametric variety)
• Create a product family optimization testbed (on web)
• Incorporate multiple disciplines (e.g., manufacturing, marketing) in product family optimization problems
• Approaches for designing multiple platforms in a family
• Extend to product portfolio assignment problems involving multiple families and multiple platforms
PENNSTATE
© T. W. SIMPSON
Physical ProgrammingPhysical Programming
• Designer formulates the optimization problem in terms of physically meaningful parameters
[ ]
scn
iii
xxμPμP
1
)()( min
metrics) 4S class(for )(
metrics) 3S class(for )(
metrics) 2S class(for )(
metrics) 1S class(for )(
:Subject to
55
55
5
5
RiiLi
RiiLi
ii
ii
νxμν
νxμν
νxμ
νxμ
PENNSTATE
© T. W. SIMPSON
Implementation of Physical Programming
• Designer enters physically meaning preferences• Numbers express desirability ranges
PENNSTATE
© T. W. SIMPSON
• Showing all of these different objectives/ preferences gives a feel for what physical programming is capable of handling
• Number of objectives:2 motors: 12 objs.3 motors: 18 objs.5 motors: 30 objs.
10 motors: 60 objs.
Physical Programming Preferences for Motor Family
Class
HD D T U HUith Objective
1ig 2ig 3ig 4ig 5ig
Mass - 1 1-S .20 .30 .40 .50 .60Efficiency - 1 2-S .85 .80 .75 .70 .65Mass - 2 1-S .25 .35 .45 .55 .65Efficiency - 2 2-S .80 .75 .70 .65 .60Mass - 3 1-S .30 .40 .50 .60 .70Efficiency - 3 2-S .80 .75 .70 .65 .60Mass - 4 1-S .30 .40 .50 .60 .70Efficiency - 4 2-S .80 .75 .70 .65 .60Mass - 5 1-S .30 .40 .50 .60 .70Efficiency - 5 2-S .75 .70 .65 .60 .55Mass - 6 1-S .35 .45 .55 .65 .75Efficiency - 6 2-S .75 .70 .65 .60 .55Mass - 7 1-S .45 .55 .65 .75 .85Efficiency - 7 2-S .75 .70 .65 .60 .55Mass - 8 1-S .45 .55 .65 .75 .85Efficiency - 8 2-S .70 .65 .60 .55 .50Mass - 9 1-S .55 .65 .75 .85 .95Efficiency - 9 2-S .65 .60 .55 .50 .45Mass - 10 1-S .60 .70 .80 .90 1.0Efficiency - 10 2-S .60 .55 .50 .45 .40
Unacceptable Acceptable
Mag Int. (1-10) 1-H - - - - 5000Feasibility (1-10) 2-H - - - - 1Power (1-10) 3-H - - - - 300Torque (1-10) 3-H - - - - varies
HU: Highly Undesirable, U: Undesirable, T: Tolerable, D: Desirable, HD: Highly Desirable