48
Pennsylvania Municipal Retirement System Actuarial Valuation as of January 1, 2014 Produced by Cheiron April 2015

Pennsylvania Municipal Retirement System
Actuarial Valuation as of January 1, 2014
Produced by Cheiron
April 2015
TABLE OF CONTENTS
Section Page Letter of Transmittal ........................................................................................................................ i
Foreword ........................................................................................................................................ iii
Section I – Board Summary .............................................................................................................1 Section II – Assets .........................................................................................................................14 Section III – Liabilities ..................................................................................................................19 Section IV – Contributions ............................................................................................................20 Section V – Accounting Statement Information ............................................................................24 Appendices Appendix A – Membership Information ........................................................................................30 Appendix B – Actuarial Assumptions and Methods......................................................................36

i
April 30, 2015 Pennsylvania Municipal Retirement Board of the Pennsylvania Municipal Retirement System c/o Stephen W. Vaughn, Secretary P.O. Box 1165 Harrisburg, PA 17108-1165 Re: PMRS 2014 Actuarial Valuation Report Dear Members of the Board: At your request, we have conducted the annual actuarial valuation of the Pennsylvania Municipal Retirement System (System) as of January 1, 2014. This report includes the valuation of the four county plans and reflects a roll forward of all other plans administered by the System. The roll forward reflects an explicit valuation of the retirees as of January 1, 2014, with a roll forward of the active and terminated vested liabilities with an adjustment for the liabilities associated with new retirees that are being explicitly valued. The results of the valuation are contained in this report. The purpose of this report is to present the annual actuarial valuation of the Pennsylvania Municipal Retirement System which is discussed in more detail in the Foreword section of this report. This report was prepared for Pennsylvania Municipal Retirement Board of the Pennsylvania Municipal Retirement System for the purposes described herein and for the use by the plan auditor in completing an audit related to the matters herein. Other users of this report are not intended users as defined in the Actuarial Standards of Practice, and Cheiron assumes no duty or liability to such other users. This report contains analyses which combine asset and liability performance and projections. This is an Agent Multiple Employer retirement system (as defined under GASB 67/68) for participating municipalities and counties. Assets and liabilities are separately accounted for and reported to the Public Employee Retirement Commission of the Commonwealth of Pennsylvania. This report reflects aggregate valuation results for the System. The report provides statistics on employer contribution levels for the traditional defined benefit portion of the municipal plans participating in the system as of the valuation date, the updated methods and assumptions effective January 1, 2014, as well as disclosures under the Governmental Accounting Standards Board Statement #25 for the entire System. Your attention is called to the Foreword and Board Summary in which we refer to the general approach employed in the preparation of this report, a big picture view of the System, historical trends developed by Cheiron, and future stress testing of the System. The trend data developed prior to January 1, 2007 was developed by the prior actuary. We also comment on the sources and reliability of both the data and the actuarial assumptions on which our findings are based. Those comments are the basis for our certification that this report is complete to the best of our knowledge and belief. All municipalities that were required to file an Act 205 form as of January 1, 2013, had their liabilities actuarially adjusted and included in this report to represent a valuation of the System from year to year; however, only liabilities for the four county plans participating in the System were valued based on actual data as of January 1, 2014. Therefore,

Pennsylvania Municipal Retirement Board of the Pennsylvania Municipal Retirement System April 30, 2015
ii
county plans reported to the state for the 2014 Act 293 Filing represent the actual actuarial values. We rely on future System experience conforming to the underlying assumptions. To the extent that actual System experience deviates from the underlying assumptions, the results would vary accordingly. To the best of our knowledge, this report and its contents have been prepared in accordance with generally recognized and accepted actuarial principles and practices which are consistent with the Code of Professional Conduct and applicable Actuarial Standards of Practice set out by the Actuarial Standards Board. Furthermore, as credentialed actuaries, we meet the Qualification Standards of the American Academy of Actuaries to render the opinion contained in this report. This report does not address any contractual or legal issues. We are not attorneys and our firm does not provide any legal services or advice. Sincerely, Cheiron Kenneth A. Kent, FSA, FCA Karen M. Zangara, FSA Principal Consulting Actuary Principal Consulting Actuary cc: Anthony J. Bucci, Jr. Kristine Cline

PENNSYLVANIA MUNICIPAL RETIREMENT SYSTEM ACTUARIAL VALUATION AS OF JANUARY 1, 2014
FOREWORD
iii
Cheiron has performed the actuarial valuation of the Pennsylvania Municipal Retirement System (System) as of January 1, 2014. The purpose of this report is to: 1) Measure and disclose, as of the valuation date, the financial condition of the System; 2) Indicate trends in the financial progress of the System; 3) Provide specific information and documentation required by the Governmental Accounting
Standards Board (GASB). An actuarial valuation establishes and analyzes System assets and liabilities on a consistent basis and traces the progress of both from one year to the next. It includes measurement of the System’s investment performance as well as an analysis of actuarial liability gains and losses.
Section I presents a summary containing our findings and disclosing important trends experienced by the System in recent years. Section II contains details on various asset measures, together with pertinent performance measurements. Section III shows similar information on System liabilities, measured for actuarial, accounting, and government reporting purposes. Section IV shows the distribution of the county plans’ contribution rates by component. Section V includes the required disclosures under GASB Statement Number 25.
The appendices to this report contain a summary of the System’s membership at the valuation date, and the actuarial methods and assumptions used in the valuations. As this System is an Agent Multiple Employer retirement system in which each of the participating municipalities are entitled to define and submit to the Board the benefit provisions for their respective employees, the actual plan provisions are not included in this report. We based our results on the plan provisions defined and submitted to the State under the 2013 Act 205 filings and 2014 Act 293 filings in preparing this valuation as provided by the System. Because the System is bound by Act 293 to complete a biennial valuation for each county, we have developed liabilities for 2014 for all county plans required to submit a valuation as of January 1, 2014. For the municipalities valued as of January 1, 2013 we used the 2013 results to estimate the liabilities for the active and deferred vested participants in these plans to provide an overall measure of the funded status of the System. This method is referred to as a “roll forward” and is used throughout this report in all 2014 calculations for the municipalities to provide a reasonable estimate of the aggregate System results. All retiree liabilities (including municipalities) are valued as of January 1, 2014 based upon updated data as of this date. For new retirees, their liabilities from January 1, 2013 were subtracted from the active and vested terminated liabilities that were rolled forward. In aggregate, this method decreased the active and

PENNSYLVANIA MUNICIPAL RETIREMENT SYSTEM ACTUARIAL VALUATION AS OF JANUARY 1, 2014
FOREWORD
iv
vested terminated rolled forward liabilities as of January 1, 2014 by about $80.9 million for the municipal defined benefit plans. In preparing our report, we relied on information (some oral and some written) supplied by the System’s staff. This information includes, but is not limited to, plan provisions, employee data, and financial information. We performed an informal examination of the obvious characteristics of the data for reasonableness and consistency in accordance with Actuarial Standard of Practice #23.
The actuarial assumptions reflects the Board’s understanding of the likely future experience of the System, and the assumptions as a whole represent the best estimate for the future experience of the System based on the trends and results of periodic experience analysis performed as required under Act 205. The results of this report are dependent upon future experience conforming to these assumptions. To the extent that future experience deviates from the actuarial assumptions, the true cost of the System could vary from our results. Future valuation reports may differ significantly from the current report presented in this document due to such factors as the following: plan experience differing from that anticipated by the assumptions; changes in assumptions; and changes in plan provisions or applicable law.
Finally, in preparing this report, we have conformed to generally accepted actuarial principles and practices which are consistent with the Code of Professional Conduct, and applicable Actuarial Standards of Practice set out by the Actuarial Standards Board. To the extent the laws of the Commonwealth of Pennsylvania and/or the administrative practices of the System differ from Actuarial Standards of Practice, we have identified such deviations within the assumption section of this report.
PENNSYLVANIA MUNICIPAL RETIREMENT SYSTEM ACTUARIAL VALUATION AS OF JANUARY 1, 2014
SECTION I BOARD SUMMARY
1
General Comments The primary purpose of the actuarial valuation and this report is to disclose the following as of the valuation date:
The overall financial condition of the Pennsylvania Municipal Retirement System, Biennial valuation of the county plans participating in the System, Past trends and expected future trends in the System’s financial condition, and Information required by the Governmental Accounting Standards Board (GASB).
In this Section, we present a summary of the principal valuation results. This includes the basis upon which the January 1, 2014 valuation was completed and an examination of the current financial condition of the System. In addition, we present a review of the key historical trends followed by the System’s projected financial outlook. The county plans are valued every other year. Throughout our report, our discussion will address changes from January 1, 2012, the last time the county plans were valued, to January 1, 2014. In other parts of the discussion, we address the overall status of the System. In this case, we compare results from January 1, 2013 to January 1, 2014 to identify the changes in the overall System’s funded status. A. Valuation Basis The January 1, 2014 valuation results are based on the same actuarial assumptions used in the January 1, 2013 valuation. Since the last county valuation date, the Board has adopted a reduction in the assumed interest/discount rate from 6.0% to 5.5%. Because this change was adopted beginning with the January 1, 2013 valuation, the results in the county’s January 1, 2012 valuation do not reflect this assumption change. Below we identify a number of key results of this valuation. Unfunded Actuarial Liability (UAL): The UAL is the excess of the System’s Actuarial
Liability (AL) over the Actuarial Value of Assets (AVA). Because the System is made up of many plans, some with UAL and others with surplus (when the AVA is greater than the AL), the aggregate changes for each of these values combined provides the net funded level of the System. In aggregate, the System continues to be in a net deficit position which has increased from $16.9 million as of January 1, 2013 to $32.9 million as of January 1, 2014. This occurred partly because the liabilities increased due to the decrease in the discount rate from 6.0% to 5.5% for the 2013 municipal valuations and 2014 county valuations. Therefore, the timing of the contributions paid during 2013 were based upon the valuation results using the prior assumptions from the 2011 valuation representing lower required contributions. This delay creates additional losses.
PENNSYLVANIA MUNICIPAL RETIREMENT SYSTEM ACTUARIAL VALUATION AS OF JANUARY 1, 2014
SECTION I BOARD SUMMARY
2
On a snap shot basis comparing the Market Value of Assets (MVA) to AL provides information of the progress of the System’s funding status. As of January 1, 2014 the AL exceeded the MVA resulting in an unfunded liability of $54.0 million. This represents an improvement compared to the unfunded liability of $241.6 million as of January 1, 2013 or a net $187.6 million dollar improvement over last year.
Funding Ratio: This is the ratio of the System’s AVA to AL. The funding ratio decreased from 99.1% as of January 1, 2013 to 98.4% as of January 1, 2014. The decrease reflects the two-year contribution delay. While liabilities were increasing based upon the 5.50% discount rate assumption, the contributions paid were based upon the 2011 valuation results which had lower liabilities based upon the 6.00% discount rate assumption.
System Experience: On an actuarial asset value basis the return is 5.50% based upon the rate guaranteed by PMRS. However on a market asset basis the average investment return for the year ending December 31, 2013 was actually 18.8%. This favorable return has just about covered the balance of the 2009 investment loss.
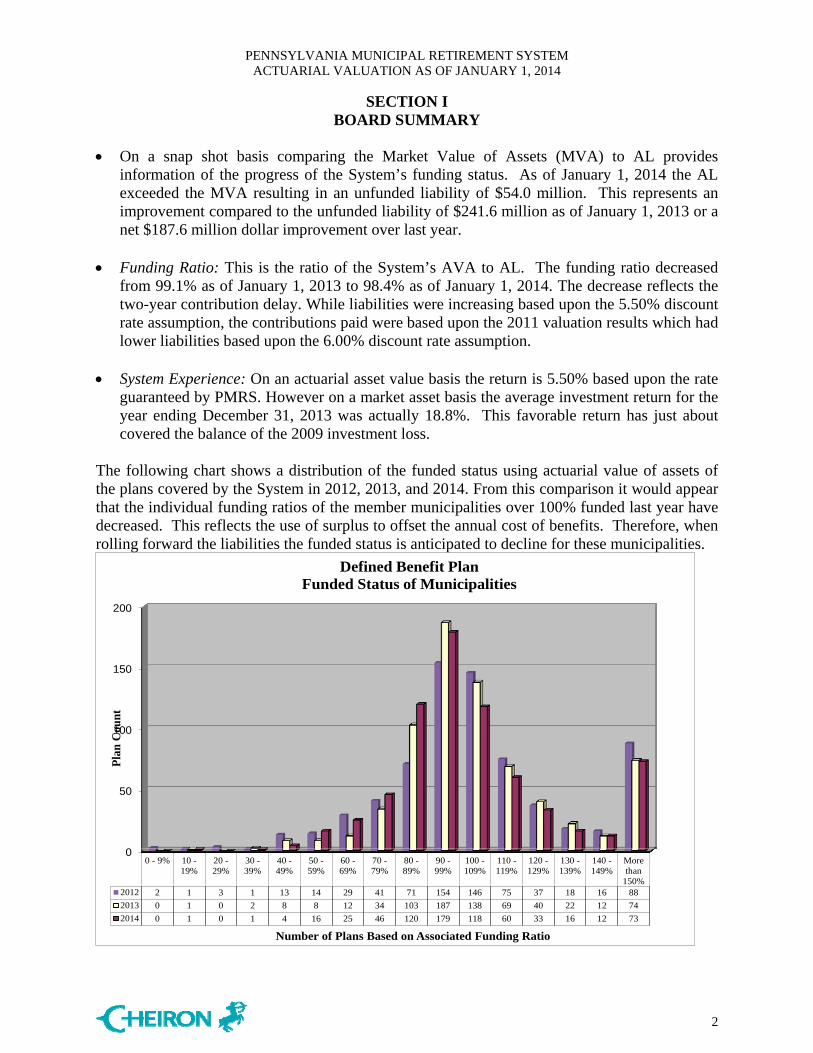
The following chart shows a distribution of the funded status using actuarial value of assets of the plans covered by the System in 2012, 2013, and 2014. From this comparison it would appear that the individual funding ratios of the member municipalities over 100% funded last year have decreased. This reflects the use of surplus to offset the annual cost of benefits. Therefore, when rolling forward the liabilities the funded status is anticipated to decline for these municipalities.
0
50
100
150
200
0 - 9% 10 -19%
20 -29%
30 -39%
40 -49%
50 -59%
60 -69%
70 -79%
80 -89%
90 -99%
100 -109%
110 -119%
120 -129%
130 -139%
140 -149%
Morethan
150%2012 2 1 3 1 13 14 29 41 71 154 146 75 37 18 16 88
2013 0 1 0 2 8 8 12 34 103 187 138 69 40 22 12 74
2014 0 1 0 1 4 16 25 46 120 179 118 60 33 16 12 73
Pla
n C
ount
Number of Plans Based on Associated Funding Ratio
Defined Benefit Plan Funded Status of Municipalities

PENNSYLVANIA MUNICIPAL RETIREMENT SYSTEM ACTUARIAL VALUATION AS OF JANUARY 1, 2014
SECTION I BOARD SUMMARY
3
B. Current Financial Condition On the following pages, we summarize the key results of the January 1, 2014 valuation and how they compare to the results from the January 1, 2013 valuation. 1. System Membership: As shown in Table I-1 below, total membership in the Retirement System increased by 2.1% from 2013 to 2014. The active participant counts reported for the Traditional Defined Benefit Plans increased by 1.0%. The aggregate covered payroll of the System increased by 3.3% and the average salary increased by 1.8%.
January 1, 2014 January 1, 2013 % ChangeTraditional Defined Benefit Actives 7,676 7,599 1.0%
Cash Balance Benefit Actives 1,185 1,131 4.8%Terminated Vesteds 1,058 1,149 -7.9%
Participants Receiving Benefit Payments 4,423 4,160 6.3%Beneficiaries 520 520 0.0%
Total System Members 14,862 14,559 2.1%
Annual Salaries* $434,603,924 $420,787,345 3.3%Average Salary per Active Member 49,047 48,200 1.8%
Membership TotalTable I-1
* Annualized salary for traditional defined benefit plan participants and actual salary for cash balance participants
PENNSYLVANIA MUNICIPAL RETIREMENT SYSTEM ACTUARIAL VALUATION AS OF JANUARY 1, 2014
SECTION I BOARD SUMMARY
4
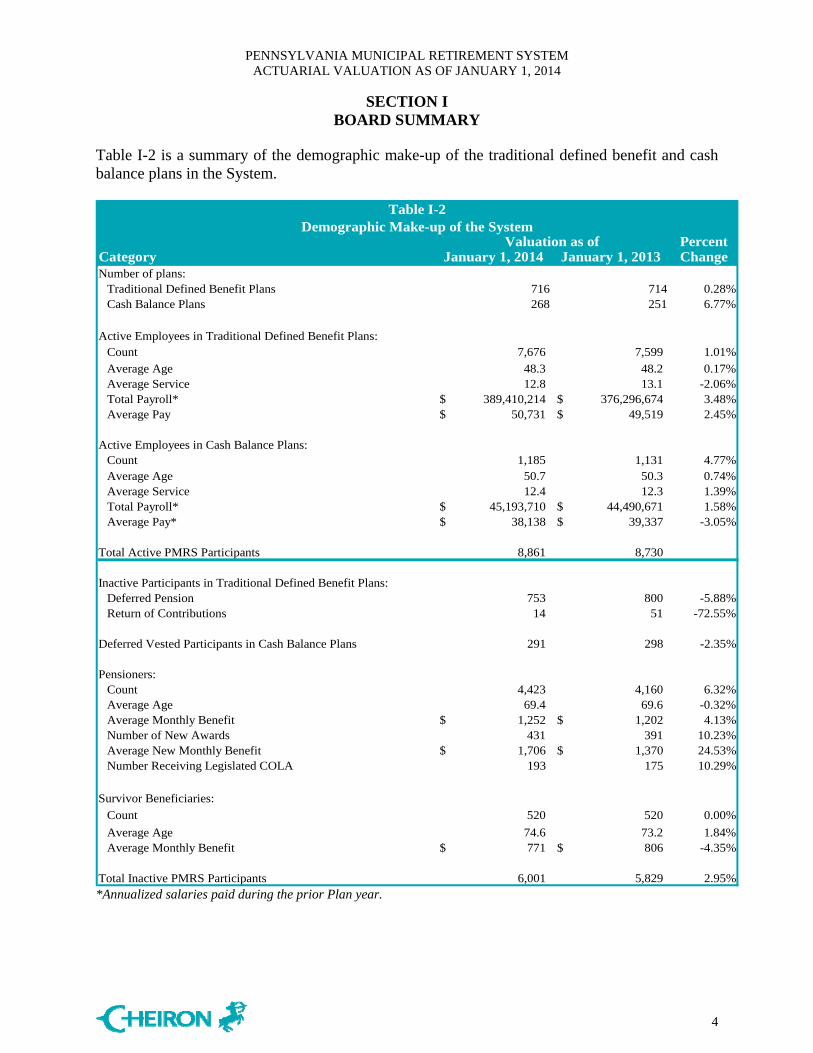
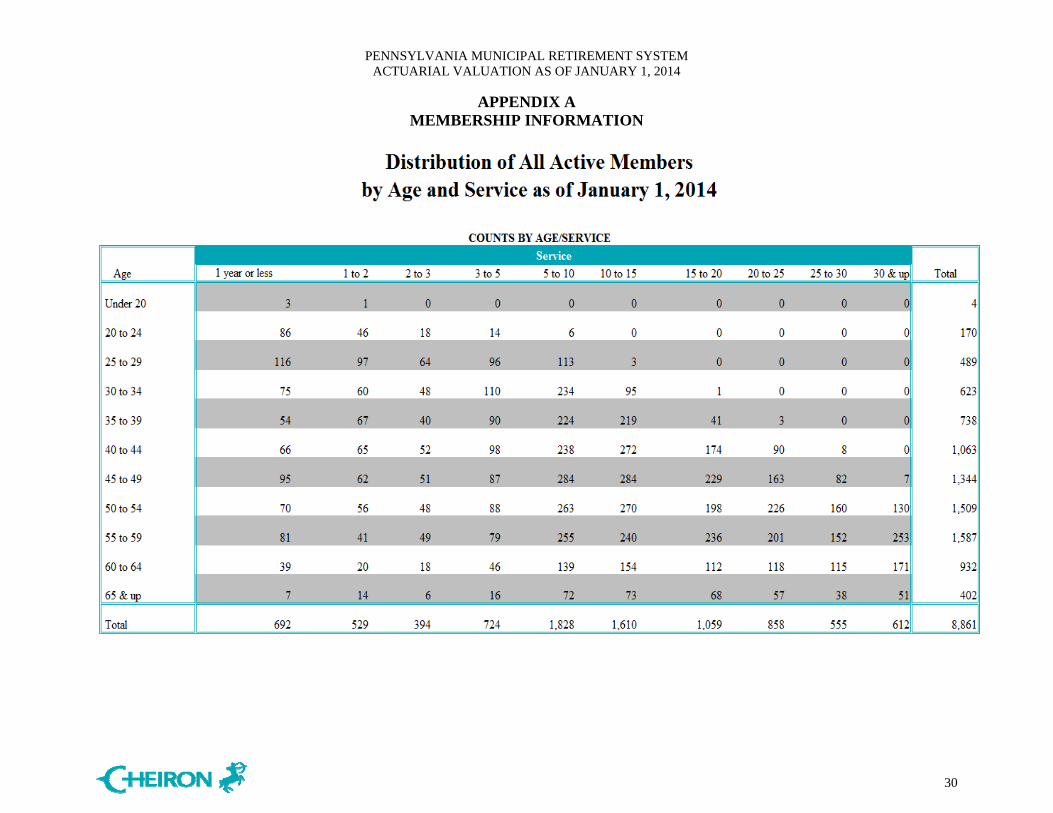
Table I-2 is a summary of the demographic make-up of the traditional defined benefit and cash balance plans in the System.
PercentCategory January 1, 2014 January 1, 2013 ChangeNumber of plans:
Traditional Defined Benefit Plans 716 714 0.28%Cash Balance Plans 268 251 6.77%
Active Employees in Traditional Defined Benefit Plans:Count 7,676 7,599 1.01%
Average Age 48.3 48.2 0.17%Average Service 12.8 13.1 -2.06%Total Payroll* $ 389,410,214 $ 376,296,674 3.48%Average Pay $ 50,731 $ 49,519 2.45%
Active Employees in Cash Balance Plans:Count 1,185 1,131 4.77%Average Age 50.7 50.3 0.74%Average Service 12.4 12.3 1.39%Total Payroll* $ 45,193,710 $ 44,490,671 1.58%Average Pay* $ 38,138 $ 39,337 -3.05%
Total Active PMRS Participants 8,861 8,730
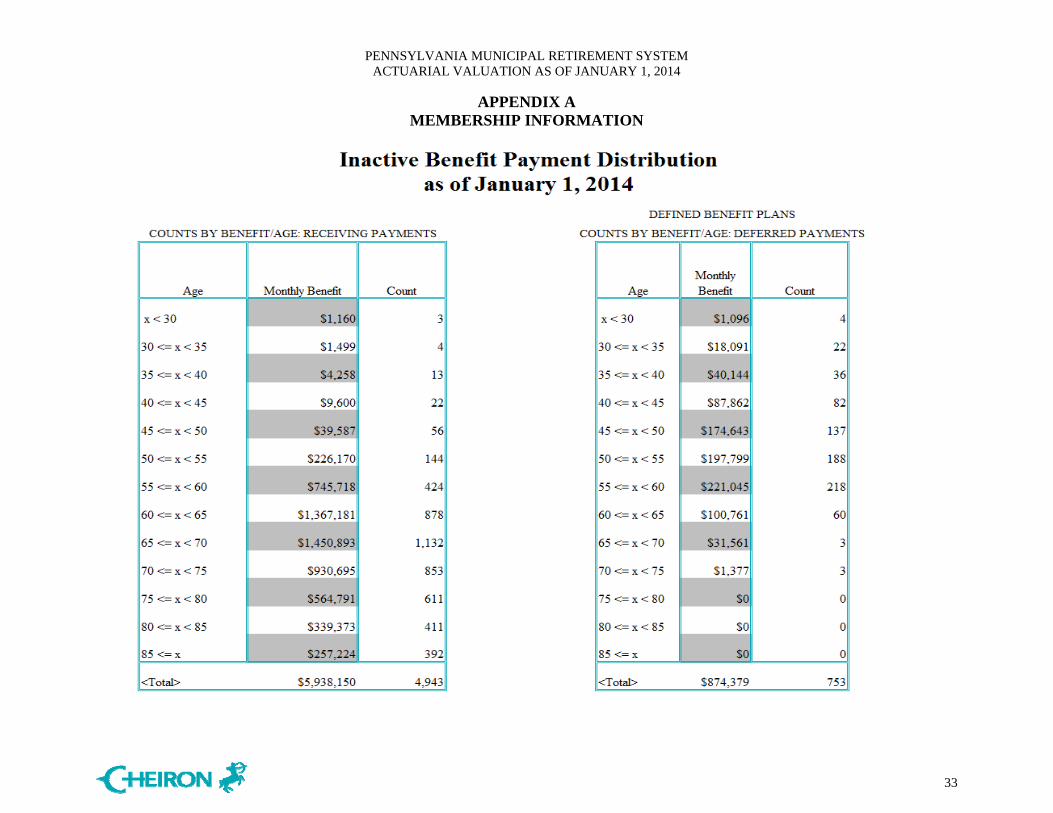
Inactive Participants in Traditional Defined Benefit Plans:Deferred Pension 753 800 -5.88%Return of Contributions 14 51 -72.55%
Deferred Vested Participants in Cash Balance Plans 291 298 -2.35%
Pensioners:Count 4,423 4,160 6.32%Average Age 69.4 69.6 -0.32%Average Monthly Benefit $ 1,252 $ 1,202 4.13%Number of New Awards 431 391 10.23%Average New Monthly Benefit $ 1,706 $ 1,370 24.53%Number Receiving Legislated COLA 193 175 10.29%
Survivor Beneficiaries:
Count 520 520 0.00%
Average Age 74.6 73.2 1.84%Average Monthly Benefit $ 771 $ 806 -4.35%
Total Inactive PMRS Participants 6,001 5,829 2.95%
Table I-2
Valuation as ofDemographic Make-up of the System
*Annualized salaries paid during the prior Plan year.

PENNSYLVANIA MUNICIPAL RETIREMENT SYSTEM ACTUARIAL VALUATION AS OF JANUARY 1, 2014
SECTION I BOARD SUMMARY
5
2. System Assets and Liabilities: Table I-3 presents a comparison between the January 1, 2013 and January 1, 2014 System assets, liabilities, unfunded actuarial liability, and funding ratios for traditional defined benefit non-county, traditional defined benefit county, and non-county cash balance plans. While this valuation was prepared to support the county plans, we were provided non-county participant data and rolled forward the active and vested terminated liabilities from the 2013 valuation for estimation purposes for these plans. Retiree liabilities were explicitly valued. The total funding ratio decreased from 99.1% as of January 1, 2013 to 98.4% as of January 1, 2014. However on a Market Value of Asset basis the increase in funding ratio demonstrates the underlying favorable investment returns for the year ending December 31, 2013. This funding ratio increased from 87.3% to 97.3% .

PENNSYLVANIA MUNICIPAL RETIREMENT SYSTEM ACTUARIAL VALUATION AS OF JANUARY 1, 2014
SECTION I BOARD SUMMARY
6
Final % ChangeJanuary 1, 2014 January 1, 2013 to Baseline
Traditional Defined Benefit (Non-county) Plans:Actives 997,992$ 982,801$ 1.5%
Terminated Vesteds 56,837 70,734 -19.6%In Pay Status 752,243 673,113 11.8%
Total Actuarial Liability 1,807,072$ 1,726,648$ 4.7%
Actuarial Value of Assets1 1,787,947 1,722,290 3.8%Unfunded/(Surplus) of Actuarial Liability 19,125$ 4,358$ 338.8%
Traditional Defined Benefit (County) Plans:Actives 60,238$ 48,840$ 23.3%
Terminated Vesteds 8,554 8,440 1.4%In Pay Status 35,797 34,691 3.2%
Total Actuarial Liability2 104,589$ 91,971$ 13.7%Actuarial Value of Assets1 102,364 94,898 7.9%
Unfunded/(Surplus) of Actuarial Liability 2,225$ (2,927)$ -176.0%
Cash Balance Plans:Actives 65,489$ 59,243$ 10.5%
Terminated Vesteds 11,720 11,441 2.4%In Pay Status 16,352 14,269 14.6%
Total Actuarial Liability 93,561$ 84,953$ 10.1%Actuarial Value of Assets1 93,561 84,953 10.1%
Unfunded/(Surplus) of Actuarial Liability 0$ 0$ 0.0%
Total of All PlansActives 1,123,719$ 1,090,884$ 3.0%
Terminated Vesteds 77,111 90,615 -14.9%In Pay Status 804,392 722,073 11.4%
Total Actuarial Liability 2,005,222$ 1,903,572$ 5.3%
Market Value of Assets (MVA) 1,951,247$ 1,661,926$ 17.4%
Actuarial Value of Assets (summation of above)1 1,983,872$ 1,902,141$ 4.3%Expenses in Excess of Assessment 3,412 3,126 9.1%
Actuarial Value of Asset Adjustment3 (15,010) (18,563) -19.1%
Final Actuarial Value of Assets4 1,972,274$ 1,886,704$ 4.5%
Unfunded/(Surplus) using Actuarial Value 32,948$ 16,868$ 95.3%Funding Ratio on Actuarial Asset Value 98.4% 99.1% -0.8%
Unfunded/(Surplus) using Market Asset Value 53,975$ 241,646$ -77.7%Funding Ratio on Market Asset Value 97.3% 87.3% 11.5%
Table I-3Total Plan Assets and Liabilities ($ thousands)
1 The assets shown above are attributable to the traditional defined benefit, cash balance, non-county and county plans based upon updated data and information provided. 2 Municipal plan liabilities are estimated in even years based upon a roll forward of the prior year’s liabilities. 3 The actuarial value of asset adjustment reflects the total estimated assets of the plan. 4 The final actuarial value of assets reflect the asset value based upon member, municipal, retiree,disability, and DROP reserve accounts, as approved by the Board and provided by PMRS.
PENNSYLVANIA MUNICIPAL RETIREMENT SYSTEM ACTUARIAL VALUATION AS OF JANUARY 1, 2014
SECTION I BOARD SUMMARY
7
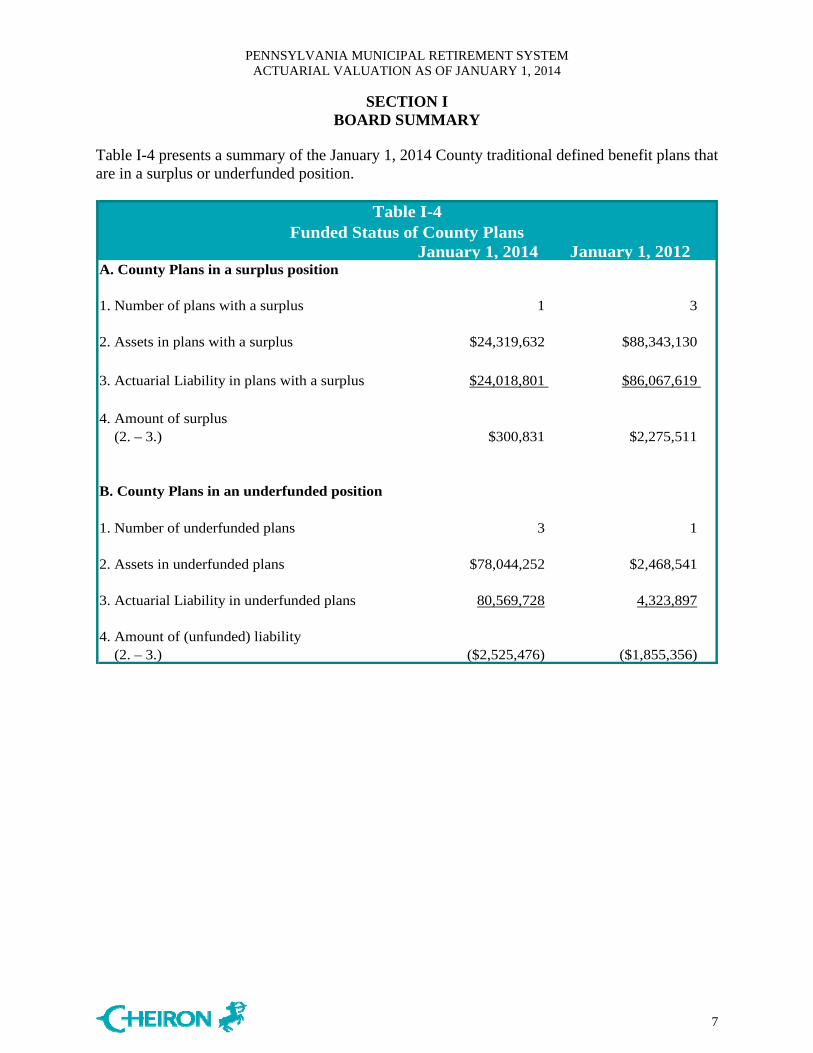
Table I-4 presents a summary of the January 1, 2014 County traditional defined benefit plans that are in a surplus or underfunded position.
January 1, 2014 January 1, 2012A. County Plans in a surplus position
1. Number of plans with a surplus 1 3
2. Assets in plans with a surplus $24,319,632 $88,343,130
3. Actuarial Liability in plans with a surplus $24,018,801 $86,067,619
4. Amount of surplus (2. – 3.) $300,831 $2,275,511
1. Number of underfunded plans 3 1
2. Assets in underfunded plans $78,044,252 $2,468,541
3. Actuarial Liability in underfunded plans 80,569,728 4,323,897
4. Amount of (unfunded) liability (2. – 3.) ($2,525,476) ($1,855,356)
Table I-4Funded Status of County Plans
B. County Plans in an underfunded position
PENNSYLVANIA MUNICIPAL RETIREMENT SYSTEM ACTUARIAL VALUATION AS OF JANUARY 1, 2014
SECTION I BOARD SUMMARY
8
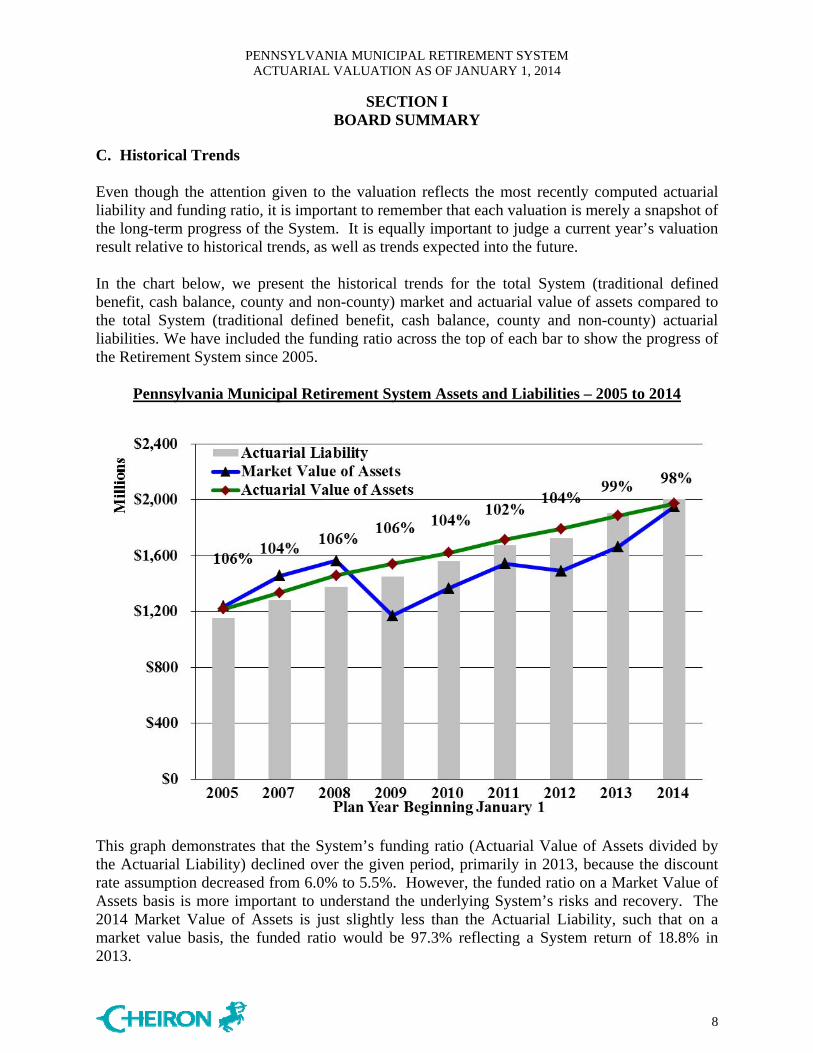
C. Historical Trends Even though the attention given to the valuation reflects the most recently computed actuarial liability and funding ratio, it is important to remember that each valuation is merely a snapshot of the long-term progress of the System. It is equally important to judge a current year’s valuation result relative to historical trends, as well as trends expected into the future. In the chart below, we present the historical trends for the total System (traditional defined benefit, cash balance, county and non-county) market and actuarial value of assets compared to the total System (traditional defined benefit, cash balance, county and non-county) actuarial liabilities. We have included the funding ratio across the top of each bar to show the progress of the Retirement System since 2005.
Pennsylvania Municipal Retirement System Assets and Liabilities – 2005 to 2014
This graph demonstrates that the System’s funding ratio (Actuarial Value of Assets divided by the Actuarial Liability) declined over the given period, primarily in 2013, because the discount rate assumption decreased from 6.0% to 5.5%. However, the funded ratio on a Market Value of Assets basis is more important to understand the underlying System’s risks and recovery. The 2014 Market Value of Assets is just slightly less than the Actuarial Liability, such that on a market value basis, the funded ratio would be 97.3% reflecting a System return of 18.8% in 2013.
PENNSYLVANIA MUNICIPAL RETIREMENT SYSTEM ACTUARIAL VALUATION AS OF JANUARY 1, 2014
SECTION I BOARD SUMMARY
9
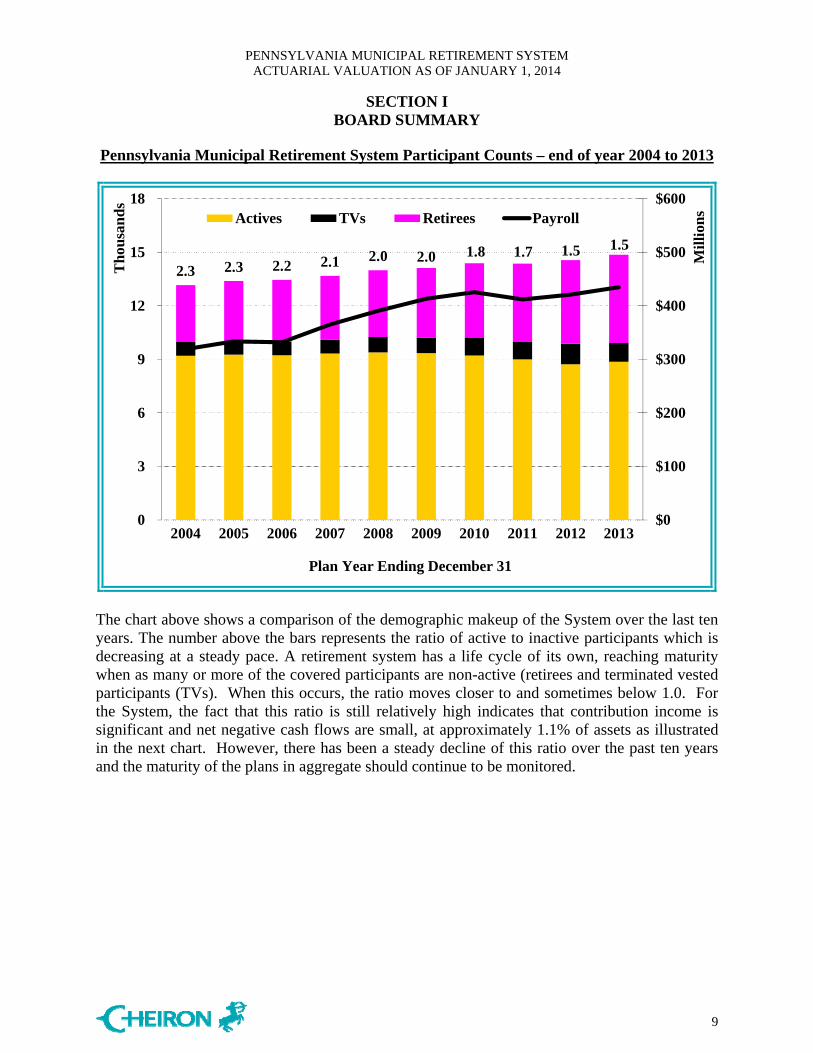
Pennsylvania Municipal Retirement System Participant Counts – end of year 2004 to 2013
2.3 2.3 2.2 2.1 2.0 2.0 1.8 1.7 1.5 1.5
$0
$100
$200
$300
$400
$500
$600
0
3
6
9
12
15
18
2004 2005 2006 2007 2008 2009 2010 2011 2012 2013
Mil
lion
s
Th
ousa
nd
s
Plan Year Ending December 31
Actives TVs Retirees Payroll
The chart above shows a comparison of the demographic makeup of the System over the last ten years. The number above the bars represents the ratio of active to inactive participants which is decreasing at a steady pace. A retirement system has a life cycle of its own, reaching maturity when as many or more of the covered participants are non-active (retirees and terminated vested participants (TVs). When this occurs, the ratio moves closer to and sometimes below 1.0. For the System, the fact that this ratio is still relatively high indicates that contribution income is significant and net negative cash flows are small, at approximately 1.1% of assets as illustrated in the next chart. However, there has been a steady decline of this ratio over the past ten years and the maturity of the plans in aggregate should continue to be monitored.

PENNSYLVANIA MUNICIPAL RETIREMENT SYSTEM ACTUARIAL VALUATION AS OF JANUARY 1, 2014
SECTION I BOARD SUMMARY
10
This next graph tracks the cash flow since 2004. An important risk element of a retirement system is the implication of cash flow and resources for paying benefits. If the level of benefit payments exceeds expected contributions plus expenses, then additional cash from existing assets are needed to make the benefit payments. This is referred to as negative cash flow which is typical among retirement systems where the number of retirees increase relative to the active participants. On the right-hand side, we show the net cash flow as a percent of assets. As the graph below illustrates, the net negative cash flow falls within the range of 0.3% to 2.0% of total assets. This implies that along with proceeds from contributions, an additional amount of cash generated from asset investments must be identified to pay benefits. Another way to consider this is that for the total value of assets to grow, the fund needs a minimum return between 0.3% and 2.0%. The volatility of the net cash flow is not only a function of contributions and benefit payments, but also reflects transfer of funds into the System from new participating municipalities and asset outflows to municipalities that choose to leave the System.
Pennsylvania Municipal Retirement System Cash Flows – 2004 through 2013
-4.0%
-2.0%
0.0%
2.0%
4.0%
($100.0)
($80.0)
($60.0)
($40.0)
($20.0)
$0.0
$20.0
$40.0
$60.0
$80.0
$100.0
2004 2005 2006 2007 2008 2009 2010 2011 2012 2013
Mil
lion
s
Plan Year Ending December 31
Contributions Benefits & Expenses
Net Cash Flow (NCF) NCF as % of MVA

PENNSYLVANIA MUNICIPAL RETIREMENT SYSTEM ACTUARIAL VALUATION AS OF JANUARY 1, 2014
SECTION I BOARD SUMMARY
11
D. Projected Financial Trends Our analysis of the Pennsylvania Municipal Retirement System’s projected financial trends is an important part of this valuation. In this section, we present our assessment of the implications of the January 1, 2014 valuation results on the future outlook in terms of benefit security (assets sufficient to cover liabilities) and the System’s expected funding progression. In the charts that follow, we project the Retirement System’s resources and obligations. We assume the Act 205 contributions are made each year. The projections are provided under four different assumptions:
1) Assuming 5.50% investment returns each and every year, 2) Assuming 7.50% investment returns each and every year, 3) Assuming average investment returns over the projected period equal to a 5.50% but
which vary each year based on Table I-5. We do this to demonstrate a more realistic projection because the System’s return will never be level from year to year.
4) Assuming 20 years of varied returns equal to an overall average 7.50% investment return
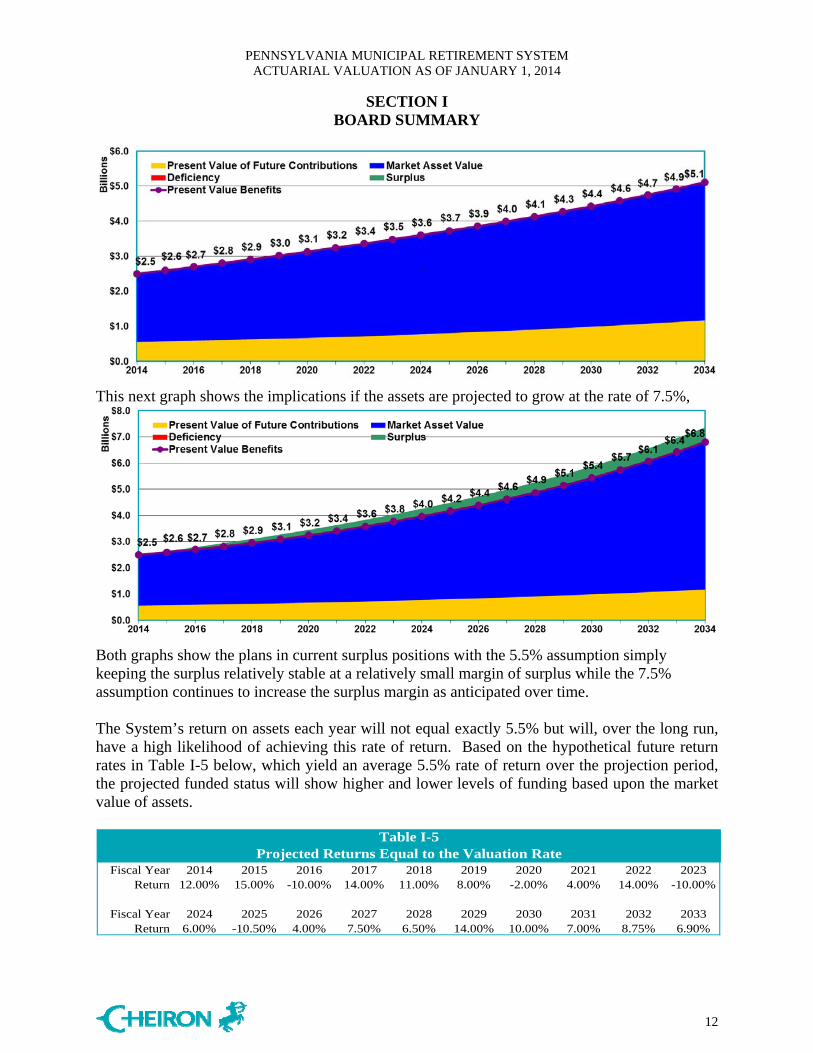
based on Table I-6. The projections that follow show how the total obligations of the System, assuming the current active population, remain constant (shown by the purple line). This is an open group projection which means when an active participant is expected to change status, they are assumed to be replaced. The area under the curve represents the Present Value of Benefits. This amount takes into account the value of all benefits earned up to this point of time called the actuarial liability plus benefits assumed to be earned into the future. This represents the total PMRS obligation over time. To meet these obligations, the System has resources which include the Market Value of Assets (in blue) and the present value of future contributions (in gold). To the extent these two sources are insufficient to meet the obligations today or in the future, the result will be a deficit (in red). If the resources are more than enough, the result will be a surplus (green). For this System, given that the investment crediting return rate for all municipalities is guaranteed currently at 5.5% the only resource to cover a deficit or create surplus is through average future investment returns anticipated in excess of the 5.5% rate. Under the current projection, there is a slight deficiency that remains over the projection period because the 5.5% rate does not increase.
PENNSYLVANIA MUNICIPAL RETIREMENT SYSTEM ACTUARIAL VALUATION AS OF JANUARY 1, 2014
SECTION I BOARD SUMMARY
12
This next graph shows the implications if the assets are projected to grow at the rate of 7.5%,
Both graphs show the plans in current surplus positions with the 5.5% assumption simply keeping the surplus relatively stable at a relatively small margin of surplus while the 7.5% assumption continues to increase the surplus margin as anticipated over time. The System’s return on assets each year will not equal exactly 5.5% but will, over the long run, have a high likelihood of achieving this rate of return. Based on the hypothetical future return rates in Table I-5 below, which yield an average 5.5% rate of return over the projection period, the projected funded status will show higher and lower levels of funding based upon the market value of assets.
Fiscal Year 2014 2015 2016 2017 2018 2019 2020 2021 2022 2023Return 12.00% 15.00% -10.00% 14.00% 11.00% 8.00% -2.00% 4.00% 14.00% -10.00%
Fiscal Year 2024 2025 2026 2027 2028 2029 2030 2031 2032 2033Return 6.00% -10.50% 4.00% 7.50% 6.50% 14.00% 10.00% 7.00% 8.75% 6.90%
Table I-5Projected Returns Equal to the Valuation Rate

PENNSYLVANIA MUNICIPAL RETIREMENT SYSTEM ACTUARIAL VALUATION AS OF JANUARY 1, 2014
SECTION I BOARD SUMMARY
13
Based on this illustration, there is potential for the System to have funding level improvement which reflects some of the real expectations for future returns. However without returns averaging in excess of 5.5% the fund can go from surplus to deficit due to market volatility over time and the negative cash flows anticipated. The potential volatility is even more apparent when we project investment returns that vary but now are expected to produce an average return over time of 7.5% as summarized in Table I-6. The fund could come out of deficit before returning to a surplus position at the end of the period.
Fiscal Year 2014 2015 2016 2017 2018 2019 2020 2021 2022 2023Return 12.50% 15.00% -8.00% 17.00% 12.00% 9.00% 3.00% 5.00% 16.00% -8.00%
Fiscal Year 2024 2025 2026 2027 2028 2029 2030 2031 2032 2033Return 7.50% -8.00% 7.00% 10.00% 12.00% 16.00% 12.00% 9.00% 9.00% 7.50%
Table I-6Projected Returns Equal to 7.5%
PENNSYLVANIA MUNICIPAL RETIREMENT SYSTEM ACTUARIAL VALUATION AS OF JANUARY 1, 2014
SECTION II ASSETS
14
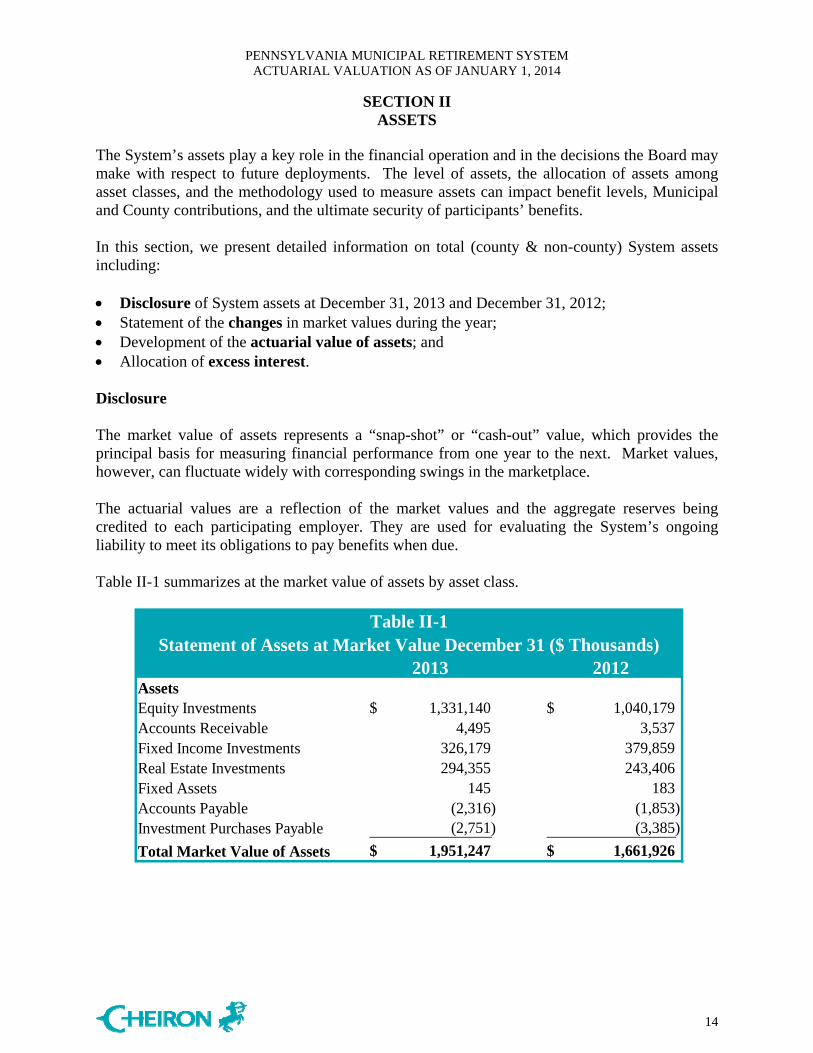
The System’s assets play a key role in the financial operation and in the decisions the Board may make with respect to future deployments. The level of assets, the allocation of assets among asset classes, and the methodology used to measure assets can impact benefit levels, Municipal and County contributions, and the ultimate security of participants’ benefits. In this section, we present detailed information on total (county & non-county) System assets including: Disclosure of System assets at December 31, 2013 and December 31, 2012; Statement of the changes in market values during the year; Development of the actuarial value of assets; and Allocation of excess interest. Disclosure
The market value of assets represents a “snap-shot” or “cash-out” value, which provides the principal basis for measuring financial performance from one year to the next. Market values, however, can fluctuate widely with corresponding swings in the marketplace.
The actuarial values are a reflection of the market values and the aggregate reserves being credited to each participating employer. They are used for evaluating the System’s ongoing liability to meet its obligations to pay benefits when due. Table II-1 summarizes at the market value of assets by asset class.
2013 2012AssetsEquity Investments 1,331,140$ 1,040,179$ Accounts Receivable 4,495 3,537 Fixed Income Investments 326,179 379,859 Real Estate Investments 294,355 243,406 Fixed Assets 145 183 Accounts Payable (2,316) (1,853) Investment Purchases Payable (2,751) (3,385)
Total Market Value of Assets 1,951,247$ 1,661,926$
Statement of Assets at Market Value December 31 ($ Thousands)Table II-1
PENNSYLVANIA MUNICIPAL RETIREMENT SYSTEM ACTUARIAL VALUATION AS OF JANUARY 1, 2014
SECTION II ASSETS
15
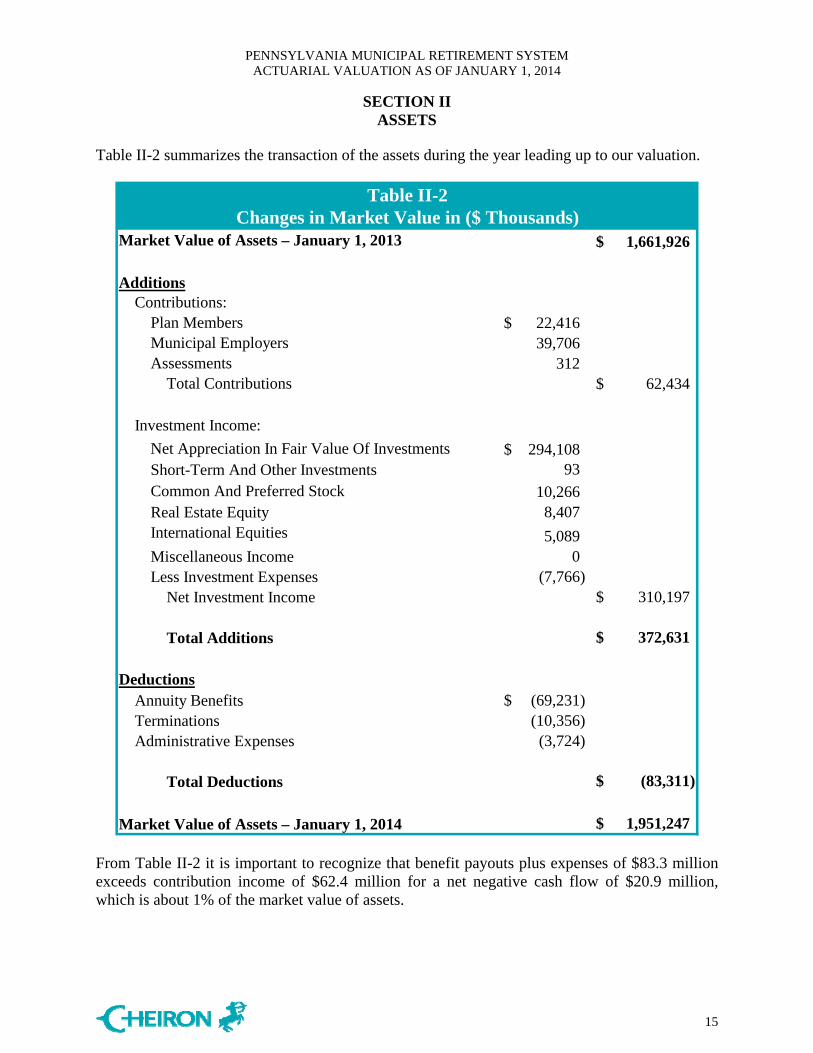
Table II-2 summarizes the transaction of the assets during the year leading up to our valuation.
Market Value of Assets – January 1, 2013 1,661,926$
Additions Contributions: Plan Members 22,416$ Municipal Employers 39,706 Assessments 312 Total Contributions 62,434$
Investment Income:
Net Appreciation In Fair Value Of Investments 294,108$ Short-Term And Other Investments 93 Common And Preferred Stock 10,266 Real Estate Equity 8,407 International Equities 5,089 Miscellaneous Income 0 Less Investment Expenses (7,766) Net Investment Income 310,197$
Total Additions 372,631$
Deductions Annuity Benefits (69,231)$ Terminations (10,356) Administrative Expenses (3,724)
Total Deductions (83,311)$
Market Value of Assets – January 1, 2014 1,951,247$
Table II-2Changes in Market Value in ($ Thousands)
From Table II-2 it is important to recognize that benefit payouts plus expenses of $83.3 million exceeds contribution income of $62.4 million for a net negative cash flow of $20.9 million, which is about 1% of the market value of assets.

PENNSYLVANIA MUNICIPAL RETIREMENT SYSTEM ACTUARIAL VALUATION AS OF JANUARY 1, 2014
SECTION II ASSETS
16
Actuarial Value of Assets The actuarial value of assets is developed based on the individual municipal account balances maintained by PMRS, also referred to as reserves. This asset valuation method also takes into account the calculation of excess interest which is derived from income in excess of the long-term investment return assumption and when market asset values exceed the actuarial asset value. The steps in the determination of the actuarial asset value as of December 31, 2013 are shown below. The difference between the market value of assets and the actuarial value of assets is considered the surplus when this value is positive. However the market value of assets is less than the reserves by $21.0 million as of December 31, 2013. This deficit represents 1.1% of the Market Value of Assets which is an improvement from 13.5% as of December 31, 2012. Based on the funding structure of the System, it is currently anticipated that this difference will be made up by future investment returns in excess of the long-term crediting assumption of 5.5%.
1. Prior Year Actuarial Value: 1,886,704$
2. Total Audited Reserve Accounts: 1,968,862$
3. Expected Administrative Expenses Net of Assessment: 3,412
4. Preliminary Actuarial Value (2+3): 1,972,274$
5. Current Year Market Value of Assets: 1,951,247
6. Prior Year Market Value of Assets: 1,661,926
7. New Surplus {Minimum of [(5-4)&(5-4)-(6-1)]}: (21,027)
8. Percentage of New Surplus Credited as Excess Interest:a 0.000%
9. Excess Interest (Maximum of 0 and (7x8)) available: 0$
10. Excess Interest awarded 0$
11. Current Year Actuarial Value of Assets (4+10): 1,972,274$
Development of Actuarial Value of Assets ($ Thousands)Table II-3
a See Table II-4b

PENNSYLVANIA MUNICIPAL RETIREMENT SYSTEM ACTUARIAL VALUATION AS OF JANUARY 1, 2014
SECTION II ASSETS
17
Excess Interest Allocation Each year, municipalities may be eligible to receive a supplemental allocation of investment monies beyond the regular 5.5% interest rate. This “excess interest” award is derived as a portion of “new surplus” created during the year. “Surplus” refers to the excess of market value over the actuarial value of assets. Once the preliminary actuarial asset value has been determined, a formula is used to determine the new surplus. Depending on the relative size of surplus to market value “margin,” between 10% and 90% of new surplus will be designated as “excess interest.” For the year ended December 31, 2013 there was no surplus because the market value of assets is less than the actuarial value of assets. The calculation in Table II-4a details the calculation that leads to no excess interest for this year.
1. Assetsa. Market value 1,951,247$ b. Preliminary Actuarial Value 1,972,274 c. Available Surplus (1a. - 1b.) (21,027)$
2. Reservesa. Members 416,473$ b. Municipal 769,572
c. Disability 165 d. Retired 782,283 e. DROP Participant Reserve Account 369 f. Total (2a. + 2b. + 2c. + 2d. + 2e.) 1,968,862$
3. Last year's surplus 0$
4. New surplus (1c. - 3.) (21,027)$
5. Excess percent of New Surplus (see Table II-4b) 0.000%
6. Excess Interest Awarded 0$
7. Percent of reserve {6. / (2f. - 2c.)} 0.00%
8. Trial Surplus (1c. - 6.) (21,027)$
9. Trial margin percent {8. / 1a.} 0.00%
Table II-4aDetermination of Excess Interest ($ Thousands)

PENNSYLVANIA MUNICIPAL RETIREMENT SYSTEM ACTUARIAL VALUATION AS OF JANUARY 1, 2014
SECTION II ASSETS
18
1. Market Value of Assets 1,951,247$
2. Available Surplus 0$
3. Margin (2. / 1.) 0.00%
4. New Surplus 0$
5. New Margin (4. / 1.) 0.00%
6. Excess Percent (10% + 8*3.) / (100% + 8*5.) 0.00%
Table II-4bDetermination of Excess Percent of New Surplus ($ Thousands)
Because there is a net deficit, there is no excess interest to award to participating municipalities and counties.
PENNSYLVANIA MUNICIPAL RETIREMENT SYSTEM ACTUARIAL VALUATION AS OF JANUARY 1, 2014
SECTION III LIABILITIES
19
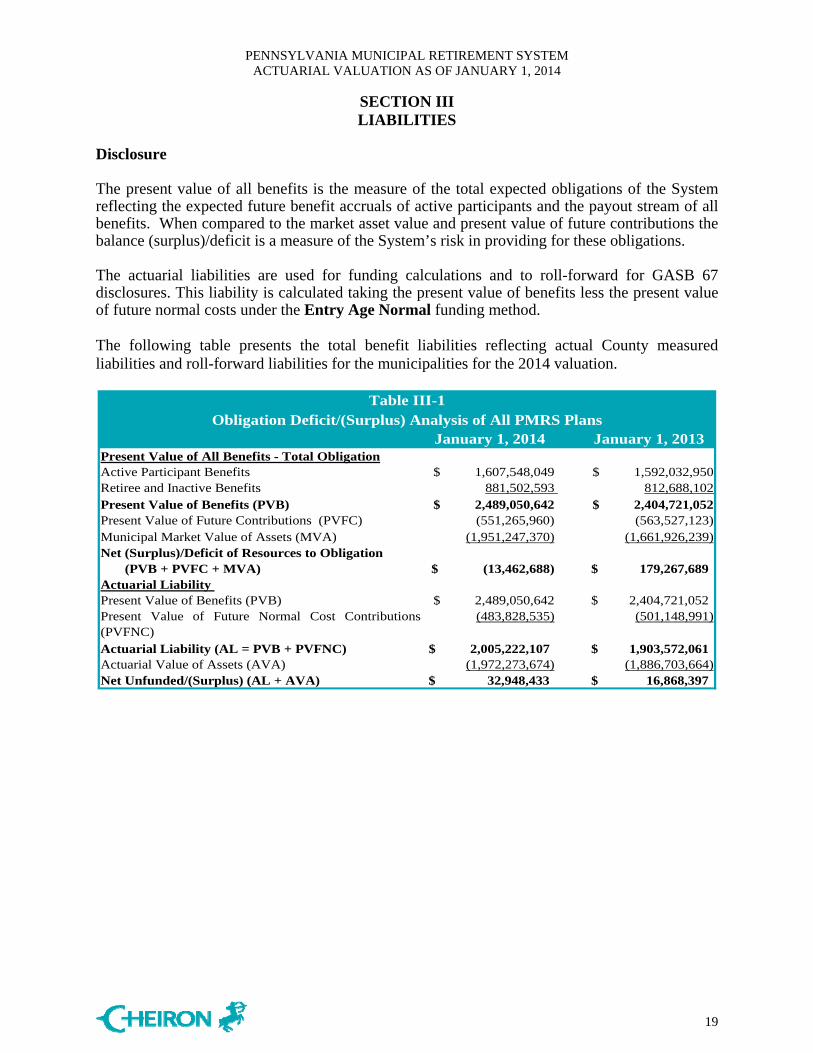
Disclosure The present value of all benefits is the measure of the total expected obligations of the System reflecting the expected future benefit accruals of active participants and the payout stream of all benefits. When compared to the market asset value and present value of future contributions the balance (surplus)/deficit is a measure of the System’s risk in providing for these obligations. The actuarial liabilities are used for funding calculations and to roll-forward for GASB 67 disclosures. This liability is calculated taking the present value of benefits less the present value of future normal costs under the Entry Age Normal funding method. The following table presents the total benefit liabilities reflecting actual County measured liabilities and roll-forward liabilities for the municipalities for the 2014 valuation.
January 1, 2014 January 1, 2013Present Value of All Benefits - Total ObligationActive Participant Benefits $ 1,607,548,049 $ 1,592,032,950 Retiree and Inactive Benefits 881,502,593 812,688,102 Present Value of Benefits (PVB) $ 2,489,050,642 $ 2,404,721,052 Present Value of Future Contributions (PVFC) (551,265,960) (563,527,123)Municipal Market Value of Assets (MVA) (1,951,247,370) (1,661,926,239)Net (Surplus)/Deficit of Resources to Obligation (PVB + PVFC + MVA) $ (13,462,688) 179,267,689$ Actuarial Liability Present Value of Benefits (PVB) $ 2,489,050,642 2,404,721,052$ Present Value of Future Normal Cost Contributions(PVFNC)
(483,828,535) (501,148,991)
Actuarial Liability (AL = PVB + PVFNC) $ 2,005,222,107 1,903,572,061$ Actuarial Value of Assets (AVA) (1,972,273,674) (1,886,703,664)Net Unfunded/(Surplus) (AL + AVA) $ 32,948,433 16,868,397$
Obligation Deficit/(Surplus) Analysis of All PMRS PlansTable III-1
PENNSYLVANIA MUNICIPAL RETIREMENT SYSTEM ACTUARIAL VALUATION AS OF JANUARY 1, 2014
SECTION IV CONTRIBUTIONS
20
In the process of evaluating the financial condition of any pension plan, the actuary analyzes the assets and liabilities to determine what contributions are needed based upon the funding policy established for the Plan. Typically, the actuarial process will use a funding technique that will result in a pattern of contributions that are both stable and predictable. For each of the plans covered by the System, the funding cost method as stipulated by law to be applied in the determination of the liability is the Entry Age Normal Actuarial Cost Method. Based upon this cost method, the statutory methods for funding any unfunded liability, there are four components that are used to determine the total contribution: the normal cost, the amortization of initial unfunded actuarial liability, and any amortizations of increases/decreases in the unfunded actuarial liability / or adjustment for surplus expressed as a percent of payroll, and expenses applied at the rate of $20 per participant. The statutory funding method requires that increases/decreases resulting from experience gains or losses get amortized over the lesser of 20 years or the future working life of the active participants. Increases/decreases from assumption changes are amortized over 15 years or the future working life of the active participants. Changes in liabilities as a result of changes in benefits are amortized over 20 years if state mandated, otherwise over 10 years for active employees and 1 year for inactive employees. There are exceptions to some of these rules for plans in differing levels of “distress” as defined by under Act 205. For plans with a surplus, the contribution rate is the normal cost offset by 10% of the surplus again expressed as a percent of payroll. This report provides an analysis of the aggregate assets and liabilities but not the aggregation of the Minimum Municipal Obligations required for each participating municipality covered by the 2013 Act 205 forms. The combination of underfunded and surplus plans would not necessarily be informative in reviewing the overall funded status of the System. Below we describe the cost components and provide graphically the distribution of costs among the participating municipalities. The normal cost rate (i.e., normal cost as a percent of payroll) is determined in the following steps. First, for a typical new entrant an individual normal cost rate is determined by taking the present value, as of entry age into the plan, of that member’s projected future benefits. This value is then divided by the present value, also at entry age, of the member’s expected future salary during their working lifetime. Finally, the total normal cost rate is reduced by the member contribution rate to produce the employer normal cost rate. If a plan provides for a Separate Member Annuity through required member contributions, this contribution rate is then added to the total normal cost rate to determine the final total normal cost rate.
PENNSYLVANIA MUNICIPAL RETIREMENT SYSTEM ACTUARIAL VALUATION AS OF JANUARY 1, 2014
SECTION IV CONTRIBUTIONS
21
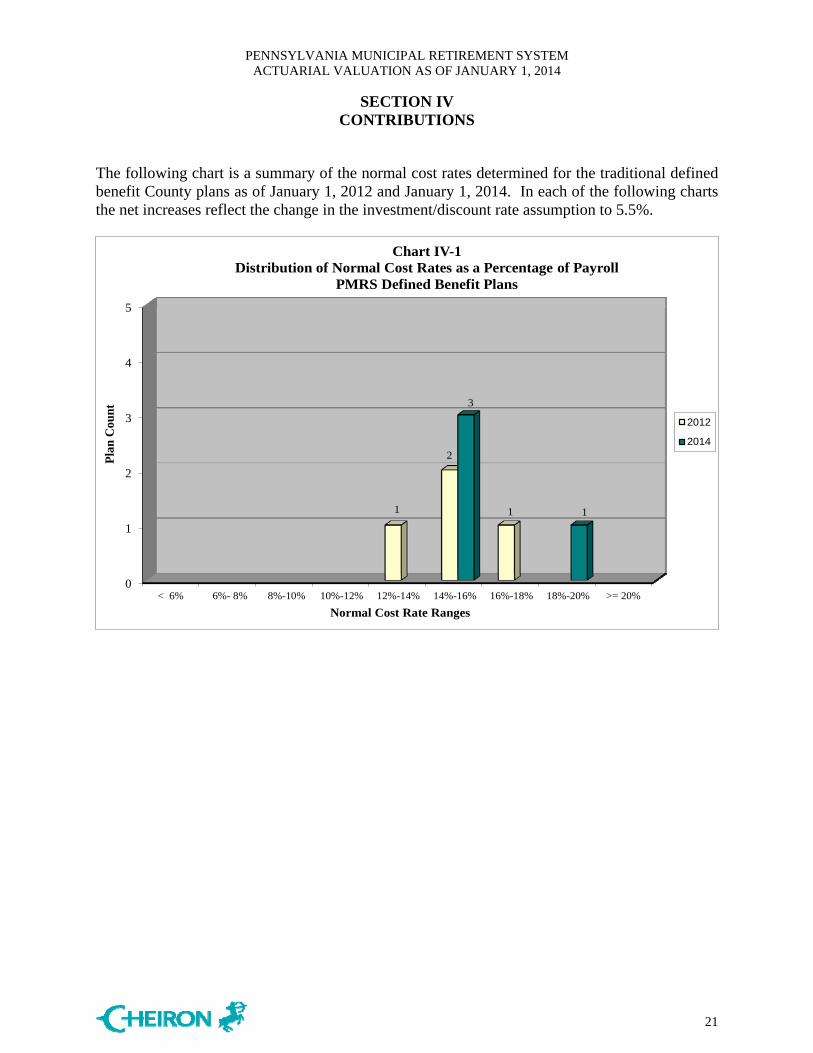
The following chart is a summary of the normal cost rates determined for the traditional defined benefit County plans as of January 1, 2012 and January 1, 2014. In each of the following charts the net increases reflect the change in the investment/discount rate assumption to 5.5%.
0
1
2
3
4
5
< 6% 6%- 8% 8%-10% 10%-12% 12%-14% 14%-16% 16%-18% 18%-20% >= 20%
1
2
1
3
1
Pla
n C
ount
Normal Cost Rate Ranges
Chart IV-1Distribution of Normal Cost Rates as a Percentage of Payroll
PMRS Defined Benefit Plans
2012
2014
PENNSYLVANIA MUNICIPAL RETIREMENT SYSTEM ACTUARIAL VALUATION AS OF JANUARY 1, 2014
SECTION IV CONTRIBUTIONS
22
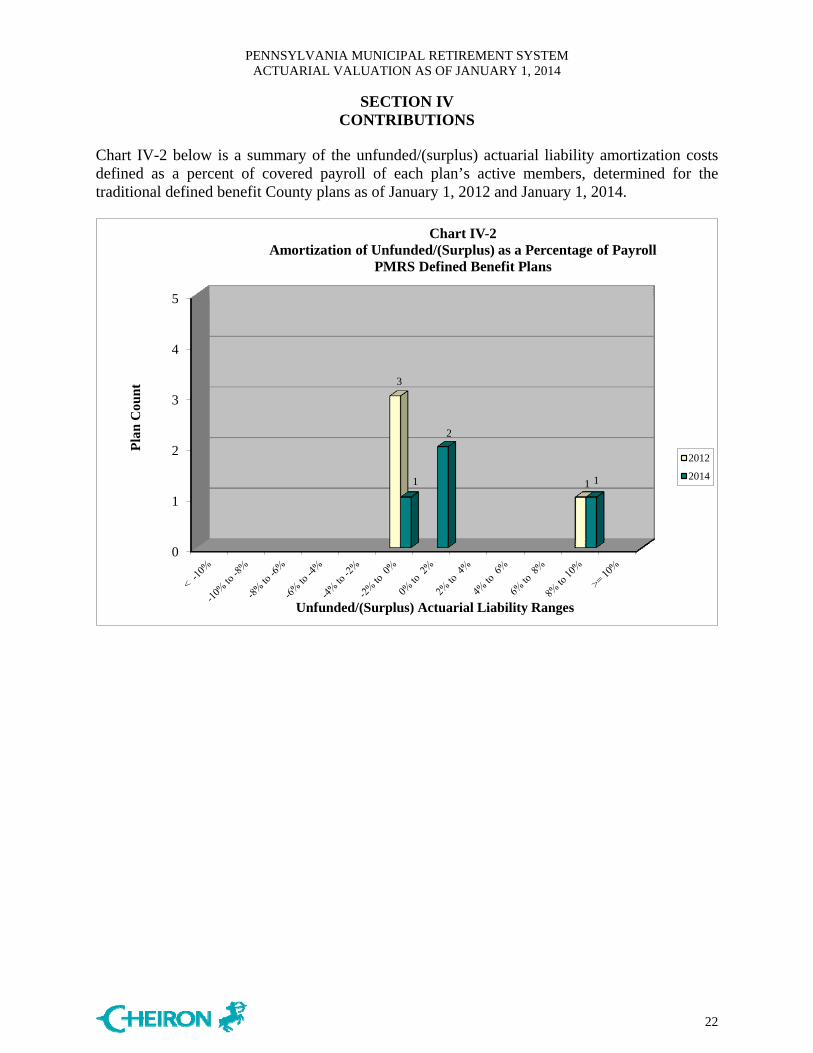
Chart IV-2 below is a summary of the unfunded/(surplus) actuarial liability amortization costs defined as a percent of covered payroll of each plan’s active members, determined for the traditional defined benefit County plans as of January 1, 2012 and January 1, 2014.
0
1
2
3
4
5
3
11
2
1
Pla
n C
ount
Unfunded/(Surplus) Actuarial Liability Ranges
Chart IV-2Amortization of Unfunded/(Surplus) as a Percentage of Payroll
PMRS Defined Benefit Plans
2012
2014
PENNSYLVANIA MUNICIPAL RETIREMENT SYSTEM ACTUARIAL VALUATION AS OF JANUARY 1, 2014
SECTION IV CONTRIBUTIONS
23
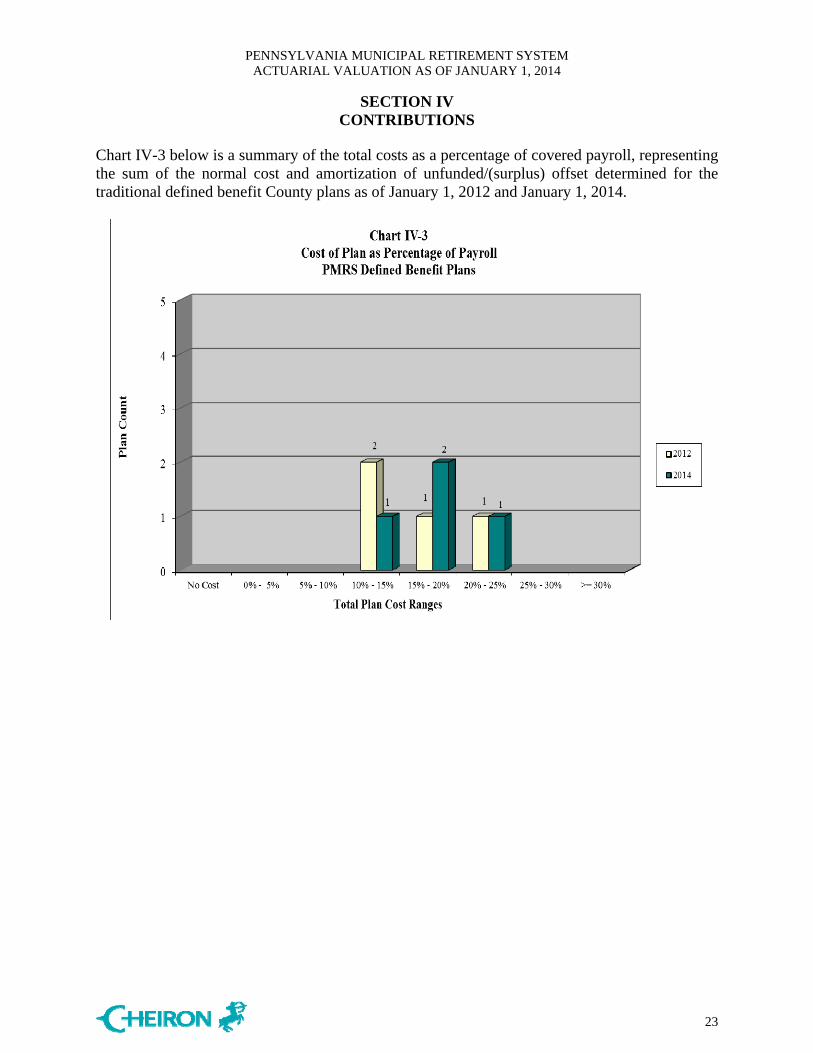
Chart IV-3 below is a summary of the total costs as a percentage of covered payroll, representing the sum of the normal cost and amortization of unfunded/(surplus) offset determined for the traditional defined benefit County plans as of January 1, 2012 and January 1, 2014.

PENNSYLVANIA MUNICIPAL RETIREMENT SYSTEM ACTUARIAL VALUATION AS OF JANUARY 1, 2014
SECTION V ACCOUNTING STATEMENT INFORMATION
24
GASB Statement No. 25 (GASB 25) established standards for disclosure of pension information by public employee retirement systems and governmental employers in notes to financial statements and supplementary information. After this year reporting will be based only on GASB Statement No. 67, which initially begins for the fiscal year ending December 31, 2014. The GASB 25 actuarial liability is the same as the actuarial liability amount calculated for funding purposes. The actuarial liability is determined assuming that the System is on-going and participants continue to terminate employment, retire, etc., in accordance with the actuarial assumptions. Liabilities are discounted at the assumed valuation interest rate of 5.50% per annum. GASB 25 requires the actuarial liability be compared with the actuarial value of assets for funding purposes. The relevant amounts as of January 1, 2014 are exhibited in Table V-1. Tables V-2 through V-7 are exhibits which can be used with the System’s Comprehensive Annual Financial Report:
Table V-2 is the Note to Required Supplementary Information; Table V-3 is the Solvency Test which shows the portion of Actuarial Liability covered by
Assets; Table V-4 is the Funded Status of Actuarial Liabilities; Table V-5 is the Schedule of Retirees and Beneficiaries; Table V-6 is the Schedule of Total Membership; and Table V-7 is the Schedule of Total Membership Funded Status of Actuarial Liabilities.

PENNSYLVANIA MUNICIPAL RETIREMENT SYSTEM ACTUARIAL VALUATION AS OF JANUARY 1, 2014
SECTION V ACCOUNTING STATEMENT INFORMATION
25
January 1, 2014 January 1, 2013A. GASB No. 25 Basis1
1. Actuarial Liabilities for retirees and beneficiaries 881,502,593$ 812,688,102$ currently receiving benefits and terminated
not yet receiving benefits
2. Actuarial Liabilities for current employees 1,123,719,514 1,090,883,959
3. Total Actuarial Liability (1. + 2.) 2,005,222,107$ 1,903,572,061$
4. Net Final Actuarial Assets available for benefits 1,972,273,674 1,886,703,664
5. Unfunded/(Surplus) Actuarial Liability (3. - 4.) 32,948,433$ 16,868,397$ 1 The January 1, 2013 numbers reflect the 2013 assumption change to a 5.5% discount rate
Table V-1
Accounting Statement Information

PENNSYLVANIA MUNICIPAL RETIREMENT SYSTEM ACTUARIAL VALUATION AS OF JANUARY 1, 2014
SECTION V ACCOUNTING STATEMENT INFORMATION
26
Table V-2 NOTE TO REQUIRED SUPPLEMENTARY INFORMATION
The information presented in the required supplementary schedules was determined as part of the actuarial valuation at the date indicated. Additional information as of the latest actuarial valuation follows.
Valuation date January 1, 2014 Actuarial cost method Entry Age Normal Amortization method Level dollar for Plan Bases and an average for
Aggregate Gain/Loss, 10% of surplus is credited against aggregate cost where applicable
Actuarial assumptions:
Investment rate of return* 5.50%Projected salary increases* 3.0%-8.3%*Includes inflation at 3.0%Cost-of-living adjustments
ad hoc
The actuarial assumptions used have been adopted by the System’s Board based on the most recent review of the System’s experience completed in 2010. The rate of employer contributions to the System is composed of the normal cost, amortization of the unfunded actuarial liability and an allowance for administrative expenses. The normal cost is a level percent of payroll cost which, along with member contributions, will pay for projected benefits at retirement for the average plan participant. The actuarial liability is that portion of the present value of projected benefits that will not be paid by future employer normal costs or member contributions. The difference between this liability and the funds accumulated as of the same date is the unfunded actuarial liability. The allowance for administrative expenses is based upon the System’s actual administrative expenses.

PENNSYLVANIA MUNICIPAL RETIREMENT SYSTEM ACTUARIAL VALUATION AS OF JANUARY 1, 2014
SECTION V ACCOUNTING STATEMENT INFORMATION
27
Valuation Actuarial ValueDate
January 1, (1)* (2) (3) (1) (2) (3)2014 $416,472,872 $881,502,593 $707,246,642 $1,972,273,674 100% 100% 95%2013 418,163,830 812,688,102 672,720,129 1,886,703,664 100% 100% 97%2012 407,199,633 639,260,852 680,756,784 1,792,809,433 100% 100% 110%2011 395,048,320 655,645,661 623,210,164 1,713,751,974 100% 100% 106%2010 348,126,106 589,362,501 622,868,929 1,620,150,779 100% 100% 110%2009 333,142,928 538,733,517 579,760,819 1,540,152,742 100% 100% 115%
Retirees & Beneficiaries
Active Member of Reported
Assets
Portion of Accrued Liabilities Covered by Reported Assets
Active Member Employer Financed
Contributions
Table V-3
SOLVENCY TESTAggregate Accrued Liabilities for
* This includes the sum of the active member employee contribution balances, the member separate annuity account balances, the municipal for separate annuity account balances, and the excess interest allocations.
Actuarial Value Actuarial Liability Unfunded AL FundedValuation Date of Assets (AL) Entry Age (Surplus) Ratio
January 1, (A) (B) (B-A) (A/B)2014 $1,972,273,674 $2,005,222,107 $32,948,433 98.4%
2013 1,886,703,664 1,903,572,061 16,868,397 99.1%2012 1,792,809,433 1,727,217,269 (65,592,164) 103.8%2011 1,713,751,974 1,673,904,145 (39,847,829) 102.4%2010 1,620,150,779 1,560,357,536 (59,793,243) 103.8%2009 1,540,152,742 1,451,637,264 (88,515,478) 106.1%
Table V-4Funded Status of Actuarial Liabilities
GASB Statement No. 25 Disclosure
The actuarial assumptions as of January 1, 2014 are shown in the assumptions and methods section. The above information was derived from the following membership data and number of pension plans, as provided by the System.
Valuation Date Valuation of Defined Benefit Liabilities Cash Balance PlansExplicit Valuation Roll-Forward
January 1, 2014 4 712 268 January 1, 2013 710 4 251January 1, 2012 4 705 240January 1, 2011 702 5 229January 1, 2010 5 691 202January 1, 2009 691 5 203January 1, 2008 4 688 183
PENNSYLVANIA MUNICIPAL RETIREMENT SYSTEM ACTUARIAL VALUATION AS OF JANUARY 1, 2014
SECTION V ACCOUNTING STATEMENT INFORMATION
28
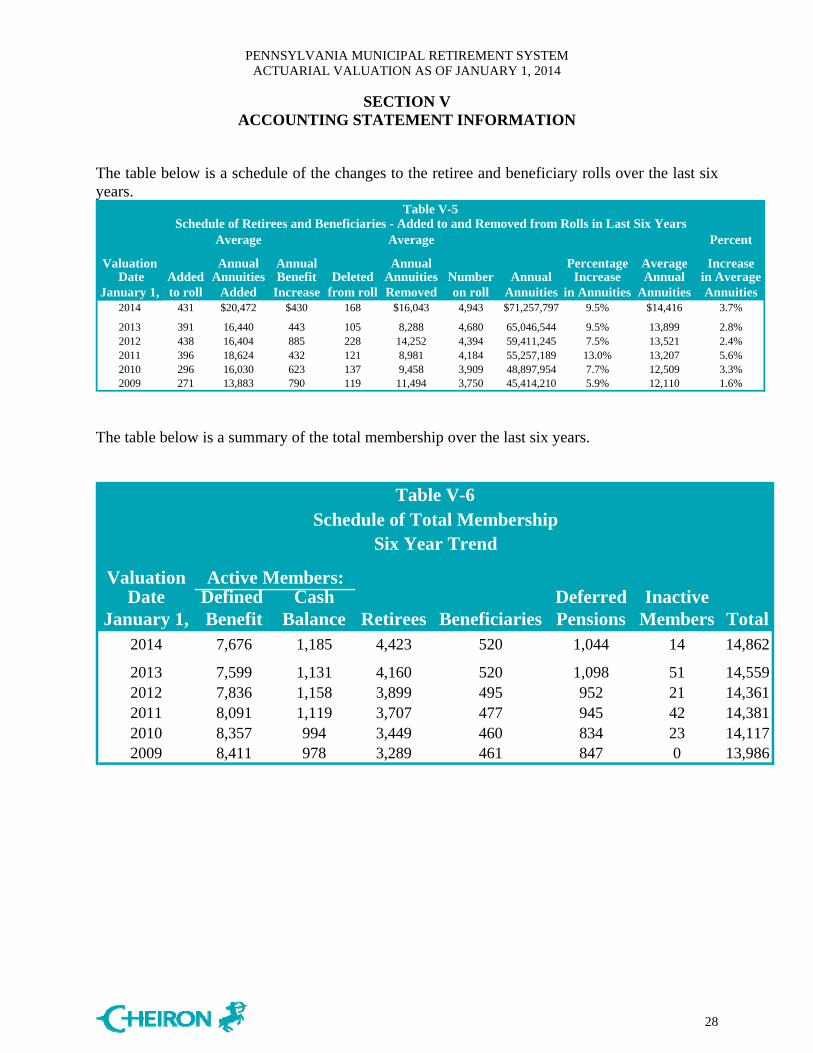
The table below is a schedule of the changes to the retiree and beneficiary rolls over the last six years.
Average Average Percent
Valuation Annual Annual Annual Percentage Average Increase Date Added Annuities Benefit Deleted Annuities Number Annual Increase Annual in Average
January 1, to roll Added Increase from roll Removed on roll Annuities in Annuities Annuities Annuities2014 431 $20,472 $430 168 $16,043 4,943 $71,257,797 9.5% $14,416 3.7%
2013 391 16,440 443 105 8,288 4,680 65,046,544 9.5% 13,899 2.8%2012 438 16,404 885 228 14,252 4,394 59,411,245 7.5% 13,521 2.4%2011 396 18,624 432 121 8,981 4,184 55,257,189 13.0% 13,207 5.6%2010 296 16,030 623 137 9,458 3,909 48,897,954 7.7% 12,509 3.3%2009 271 13,883 790 119 11,494 3,750 45,414,210 5.9% 12,110 1.6%
Schedule of Retirees and Beneficiaries - Added to and Removed from Rolls in Last Six YearsTable V-5
The table below is a summary of the total membership over the last six years.
ValuationDate Defined Cash Deferred Inactive
January 1, Benefit Balance Retirees Beneficiaries Pensions Members Total2014 7,676 1,185 4,423 520 1,044 14 14,862
2013 7,599 1,131 4,160 520 1,098 51 14,5592012 7,836 1,158 3,899 495 952 21 14,3612011 8,091 1,119 3,707 477 945 42 14,3812010 8,357 994 3,449 460 834 23 14,1172009 8,411 978 3,289 461 847 0 13,986
Six Year Trend
Table V-6Schedule of Total Membership
Active Members:

PENNSYLVANIA MUNICIPAL RETIREMENT SYSTEM ACTUARIAL VALUATION AS OF JANUARY 1, 2014
SECTION V ACCOUNTING STATEMENT INFORMATION
29
The table below is a schedule of the total membership over the last four years.
2014 2013 2012 2011
a. Retirees currently receiving benefits 4,423 4,160 3,899 3,707
b. Beneficiaries currently receiving benefits 520 520 495 477
c. Terminated vested employees entitled to future benefits from Defined Benefit Plans 753 800 723 711
d. Terminated non-vested employees entitled to
contribution refunds from Defined Benefit Plans 14 51 21 42
e. Active employees in defined benefit plans 7,676 7,599 7,836 8,091
i. Aggregate Salaryb $389,410,214 $376,296,674 $366,882,467 $383,802,844
ii. Vestedc 4,881 4,885 4,964 4,992 iii. Non-vested 2,795 2,715 2,872 3,099
f. Participants in cash balance plans 1,476 1,429 1,387 1,353 i. Aggregate Salary $45,193,710 $44,490,671 $41,143,383 $41,683,065ii. Active 1,185 1,131 1,158 1,119 iii. Inactive 291 298 229 234
Table V-7Schedule of Total Membership
As of January 1a
Funded Status of Actuarial Liabilities
a Includes traditional defined benefit non-county plans, traditional defined benefit county plans, and cash
balance plans b Actual salary for preceding valuation date c Count of vested participants estimated based on service as of the valuation date
PENNSYLVANIA MUNICIPAL RETIREMENT SYSTEM ACTUARIAL VALUATION AS OF JANUARY 1, 2014
APPENDIX A MEMBERSHIP INFORMATION
30

PENNSYLVANIA MUNICIPAL RETIREMENT SYSTEM ACTUARIAL VALUATION AS OF JANUARY 1, 2014
APPENDIX A MEMBERSHIP INFORMATION
31

PENNSYLVANIA MUNICIPAL RETIREMENT SYSTEM ACTUARIAL VALUATION AS OF JANUARY 1, 2014
APPENDIX A MEMBERSHIP INFORMATION
32
PENNSYLVANIA MUNICIPAL RETIREMENT SYSTEM ACTUARIAL VALUATION AS OF JANUARY 1, 2014
APPENDIX A MEMBERSHIP INFORMATION
33
PENNSYLVANIA MUNICIPAL RETIREMENT SYSTEM ACTUARIAL VALUATION AS OF JANUARY 1, 2014
APPENDIX A MEMBERSHIP INFORMATION
34
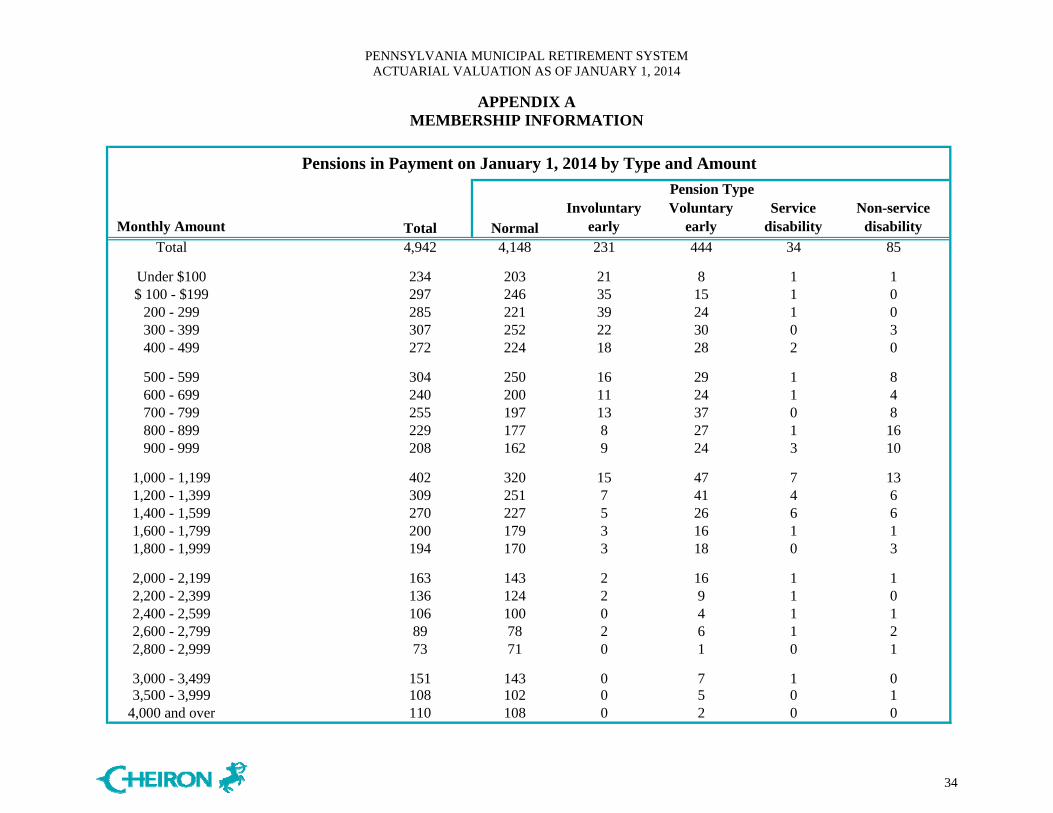
Monthly Amount Total NormalInvoluntary
earlyVoluntary
earlyService
disabilityNon-service
disability
Total 4,942 4,148 231 444 34 85
Under $100 234 203 21 8 1 1$ 100 - $199 297 246 35 15 1 0
200 - 299 285 221 39 24 1 0300 - 399 307 252 22 30 0 3400 - 499 272 224 18 28 2 0
500 - 599 304 250 16 29 1 8600 - 699 240 200 11 24 1 4700 - 799 255 197 13 37 0 8800 - 899 229 177 8 27 1 16900 - 999 208 162 9 24 3 10
1,000 - 1,199 402 320 15 47 7 131,200 - 1,399 309 251 7 41 4 61,400 - 1,599 270 227 5 26 6 61,600 - 1,799 200 179 3 16 1 11,800 - 1,999 194 170 3 18 0 3
2,000 - 2,199 163 143 2 16 1 12,200 - 2,399 136 124 2 9 1 02,400 - 2,599 106 100 0 4 1 12,600 - 2,799 89 78 2 6 1 22,800 - 2,999 73 71 0 1 0 1
3,000 - 3,499 151 143 0 7 1 03,500 - 3,999 108 102 0 5 0 1
4,000 and over 110 108 0 2 0 0
Pensions in Payment on January 1, 2014 by Type and Amount
Pension Type

PENNSYLVANIA MUNICIPAL RETIREMENT SYSTEM ACTUARIAL VALUATION AS OF JANUARY 1, 2014
APPENDIX A MEMBERSHIP INFORMATION
35
Year Ended December 31: Number
Average Monthly Amount Number
Average Monthly Amount Number
Average Monthly Amount Number
Average Monthly Amount
Average Monthly Amount
2004 247 1,126 189 1,185 35 994 13 653 10 (1) 1,100 2005 264 1,270 217 1,290 23 1,257 11 639 13 (4) 1,493 2006 252 1,069 192 1,082 19 572 32 1,196 9 (2) 1,373 2007 236 1,065 227 1,056 6 1,259 - - 3 (0) 1,350 2008 271 1,157 223 1,150 7 843 36 1,259 5 (3) 1,162 2009 296 1,336 249 1,412 17 339 26 1,300 4 (0) 1,067 2010 396 1,552 341 1,632 13 364 37 1,250 5 (0) 1,407 2011 438 1,367 352 1,496 37 459 40 1,180 9 (3) 888 2012 390 1,370 341 1,421 20 520 22 1,614 7 (2) 709 2013 431 1,706 364 1,800 17 905 34 1,280 16 (2) 1,319
Voluntary early
Pensions Awarded in Prior Ten Years, by Type and Monthly Amount
Number*
Total Normal Involuntary early Disability
* Numbers of service-related disability pensions are shown in parentheses.
PENNSYLVANIA MUNICIPAL RETIREMENT SYSTEM ACTUARIAL VALUATION AS OF JANUARY 1, 2014
APPENDIX B
ACTUARIAL ASSUMPTIONS AND METHODS
36
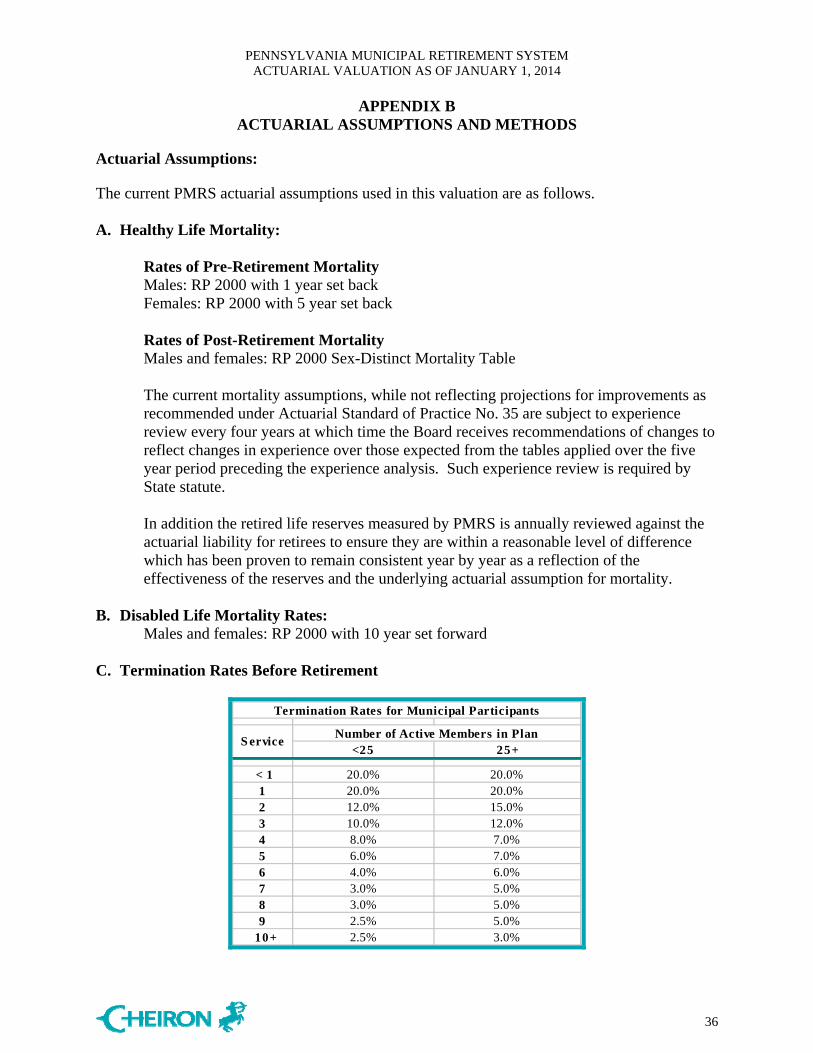
Actuarial Assumptions: The current PMRS actuarial assumptions used in this valuation are as follows. A. Healthy Life Mortality:
Rates of Pre-Retirement Mortality Males: RP 2000 with 1 year set back Females: RP 2000 with 5 year set back
Rates of Post-Retirement Mortality Males and females: RP 2000 Sex-Distinct Mortality Table The current mortality assumptions, while not reflecting projections for improvements as recommended under Actuarial Standard of Practice No. 35 are subject to experience review every four years at which time the Board receives recommendations of changes to reflect changes in experience over those expected from the tables applied over the five year period preceding the experience analysis. Such experience review is required by State statute. In addition the retired life reserves measured by PMRS is annually reviewed against the actuarial liability for retirees to ensure they are within a reasonable level of difference which has been proven to remain consistent year by year as a reflection of the effectiveness of the reserves and the underlying actuarial assumption for mortality.
B. Disabled Life Mortality Rates: Males and females: RP 2000 with 10 year set forward
C. Termination Rates Before Retirement
<25 25+
< 1 20.0% 20.0%1 20.0% 20.0%2 12.0% 15.0%3 10.0% 12.0%4 8.0% 7.0%5 6.0% 7.0%6 4.0% 6.0%7 3.0% 5.0%8 3.0% 5.0%9 2.5% 5.0%
10+ 2.5% 3.0%
Termination Rates for Municipal Participants
S erviceNumber of Active Members in Plan
PENNSYLVANIA MUNICIPAL RETIREMENT SYSTEM ACTUARIAL VALUATION AS OF JANUARY 1, 2014
APPENDIX B
ACTUARIAL ASSUMPTIONS AND METHODS
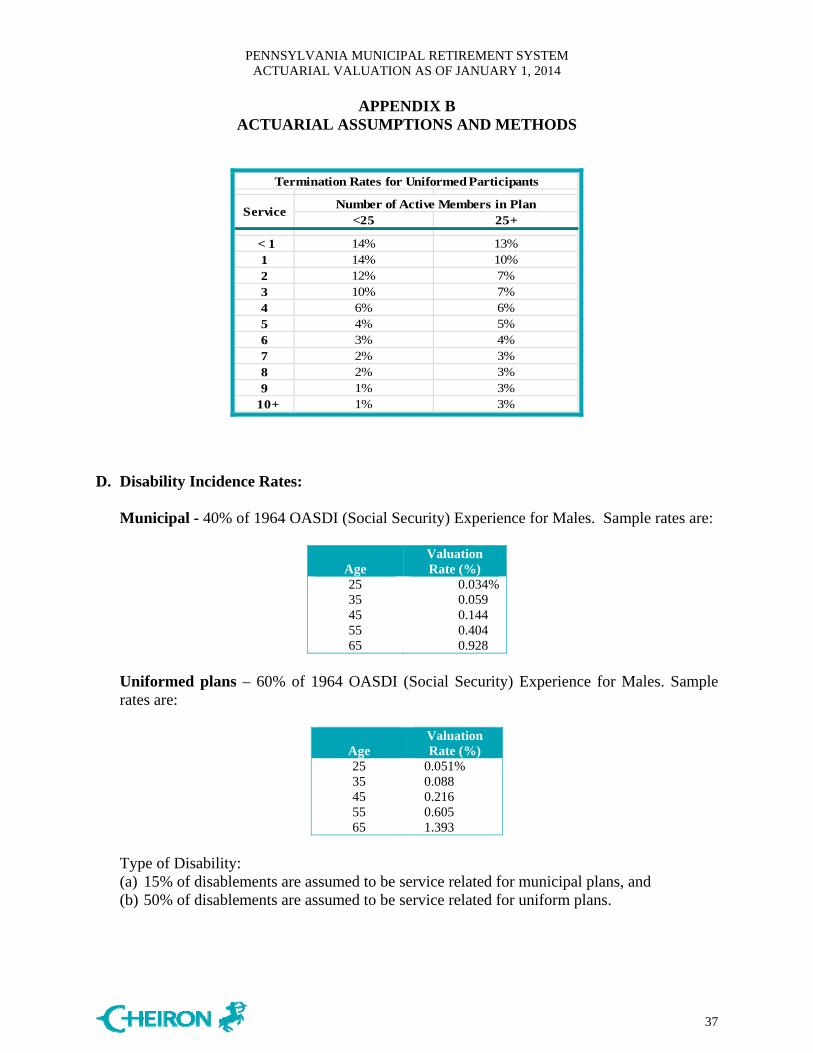
37
<25 25+
< 1 14% 13%1 14% 10%2 12% 7%3 10% 7%4 6% 6%5 4% 5%6 3% 4%7 2% 3%8 2% 3%9 1% 3%
10+ 1% 3%
Service
Termination Rates for Uniformed Participants
Number of Active Members in Plan
D. Disability Incidence Rates:
Municipal - 40% of 1964 OASDI (Social Security) Experience for Males. Sample rates are:
Age
Valuation Rate (%)
25 0.034% 35 0.059 45 0.144 55 0.404 65 0.928
Uniformed plans – 60% of 1964 OASDI (Social Security) Experience for Males. Sample rates are:
Age Valuation Rate (%)
25 0.051% 35 0.088 45 0.216 55 0.605 65 1.393
Type of Disability: (a) 15% of disablements are assumed to be service related for municipal plans, and (b) 50% of disablements are assumed to be service related for uniform plans.
PENNSYLVANIA MUNICIPAL RETIREMENT SYSTEM ACTUARIAL VALUATION AS OF JANUARY 1, 2014
APPENDIX B
ACTUARIAL ASSUMPTIONS AND METHODS
38
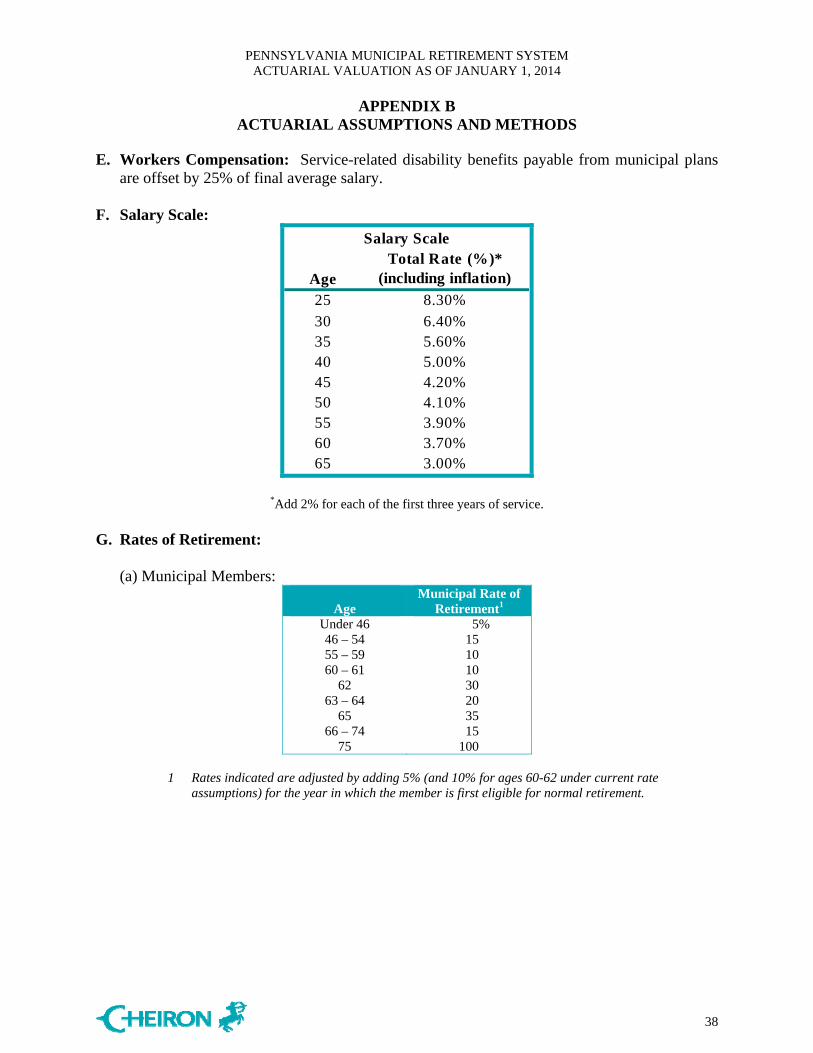
E. Workers Compensation: Service-related disability benefits payable from municipal plans are offset by 25% of final average salary.
F. Salary Scale:
Total Rate (%)*Age (including inflation)
25 8.30%30 6.40%35 5.60%40 5.00%45 4.20%50 4.10%55 3.90%60 3.70%65 3.00%
Salary Scale
*Add 2% for each of the first three years of service. G. Rates of Retirement:
(a) Municipal Members:
Age Municipal Rate of
Retirement1 Under 46 5% 46 – 54 15 55 – 59 10 60 – 61 10
62 30 63 – 64 20
65 35 66 – 74 15
75 100
1 Rates indicated are adjusted by adding 5% (and 10% for ages 60-62 under current rate assumptions) for the year in which the member is first eligible for normal retirement.
PENNSYLVANIA MUNICIPAL RETIREMENT SYSTEM ACTUARIAL VALUATION AS OF JANUARY 1, 2014
APPENDIX B
ACTUARIAL ASSUMPTIONS AND METHODS
39
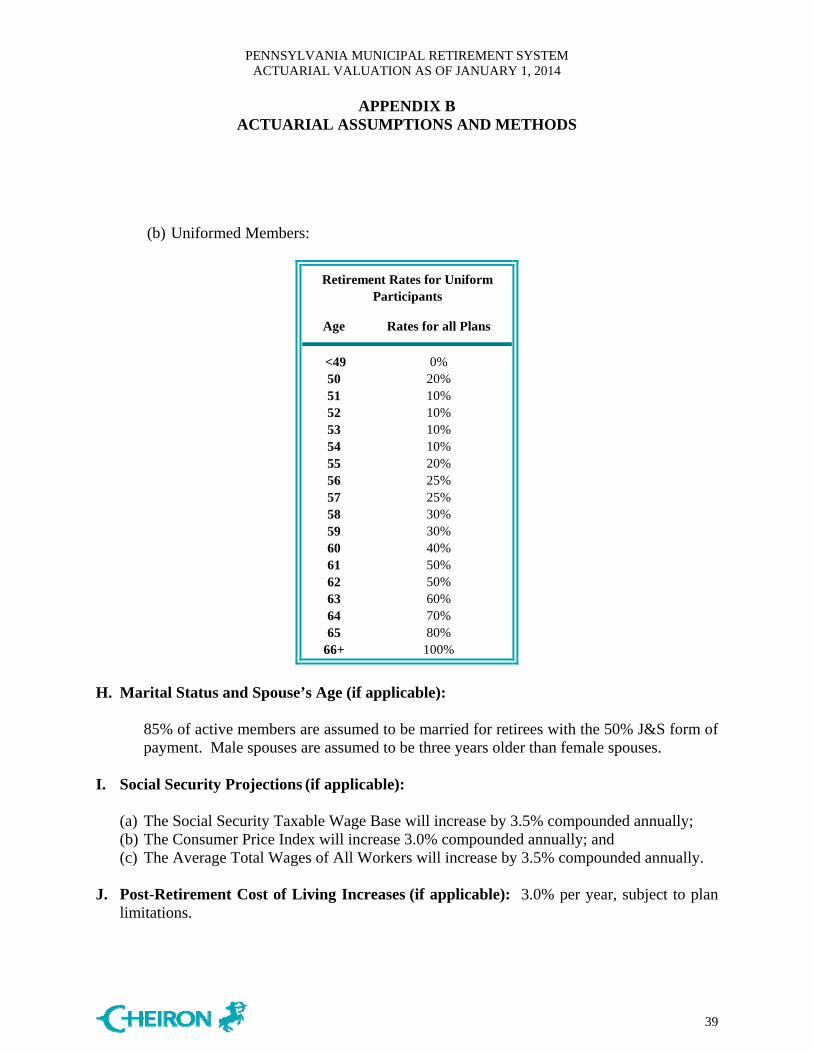
(b) Uniformed Members:
<49 0%50 20%51 10%52 10%53 10%54 10%55 20%56 25%57 25%58 30%59 30%60 40%61 50%62 50%63 60%64 70%65 80%
66+ 100%
Age
Retirement Rates for Uniform Participants
Rates for all Plans
H. Marital Status and Spouse’s Age (if applicable):
85% of active members are assumed to be married for retirees with the 50% J&S form of payment. Male spouses are assumed to be three years older than female spouses.
I. Social Security Projections (if applicable):
(a) The Social Security Taxable Wage Base will increase by 3.5% compounded annually; (b) The Consumer Price Index will increase 3.0% compounded annually; and (c) The Average Total Wages of All Workers will increase by 3.5% compounded annually.
J. Post-Retirement Cost of Living Increases (if applicable): 3.0% per year, subject to plan
limitations.
PENNSYLVANIA MUNICIPAL RETIREMENT SYSTEM ACTUARIAL VALUATION AS OF JANUARY 1, 2014
APPENDIX B
ACTUARIAL ASSUMPTIONS AND METHODS
40
K. Investment Return Assumption:
5.50% compounded annually, net of investment expenses.
L. Administrative Expenses: The expense assumption is based upon the expected expenses for the current year.
Actuarial Methods:
Contribution requirements are individually determined for each participating municipality, on an actuarial basis as described below, at least biennially. The frequency of the actuarial valuation is determined by applicable Commonwealth statute (Act 205 of 1984 and Act 293 of 1972). The following actuarial methods were adopted effective January 1, 1985, unless indicated otherwise.
Actuarial Value of Assets:
Sum of all audited reserve accounts as of the valuation date, including Member, Municipal, Retired, Disability, and DROP Reserves, and a one-year administration expense reserve, plus the portion of any additional investment income to be distributed as “excess interest.” The actuarial value can never be less than 90 percent of fair market value.
Each year, municipalities may receive an excess interest allocation derived as a portion of new surplus created during the prior year based on the current financial standing of the System. “Surplus” refers to the excess of fair market value over the actuarial value of assets. Once the preliminary actuarial asset value has been determined, a formula is used to allocate the new surplus. Generally, depending on the relative size of surplus to fair market value, between 10 percent and 90 percent of the new surplus will become excess interest.
Based on the unique legislative structure of PMRS, because assets are set equal to reserves under the System, they do not necessarily relate directly or indirectly with the current market value of assets as required under Actuarial Standard of Practice Statement No. 44 which states under Section 3.3:
“…the actuary should select an asset valuation method that is designed to produce actuarial values of assets that bear a reasonable relationship to the corresponding market values. The qualities of such an asset valuation method include the following: a. The asset valuation method is likely to produce actuarial values of assets that are
sometimes greater than and sometimes less than the corresponding market values. b. The asset valuation method is likely to produce actuarial values of assets that, in the
actuary’s professional judgment, satisfy both of the following: 1. The asset values fall within a reasonable range around the corresponding market
values. For example, there might be a corridor centered at market value, outside of which the actuarial value of assets may not fall, in order to assure that the difference from market value is not greater than the actuary deems reasonable.

PENNSYLVANIA MUNICIPAL RETIREMENT SYSTEM ACTUARIAL VALUATION AS OF JANUARY 1, 2014
APPENDIX B
ACTUARIAL ASSUMPTIONS AND METHODS
41
2. Any differences between the actuarial value of assets and the market value are recognized within a reasonable period of time. For example, the actuary might use a method where the actuarial value of assets converges toward market value at a pace that the actuary deems reasonable, if the investment return assumption is realized in future periods.
In lieu of satisfying both (1) and (2) above, an asset valuation method could satisfy section 3.3(b) if, in the actuary’s professional judgment, the asset valuation method either (i) produces values within a sufficiently narrow range around market value or (ii) recognizes differences from market value in a sufficiently short period.”
On this basis, the administrative rules adopted by the PMRS Board in conjunction with Pennsylvania Municipal Retirement System Law, which are not subject to comply with Actuarial Standards of Practice (ASOP), when defining the Actuarial Value of Assets, does not necessarily meet the requirement of ASOP 44 Selection and Use of Asset Valuation Methods for Pension Valuation.
Actuarial Cost Method:
Entry Age Normal Actuarial Cost Method.
Entry age is defined as attained age less credited service. The normal cost rate is derived as a level percent of future compensation of current employees, on an individual basis. This rate is applied to the projected payroll and projected employee contributions are deducted. Actuarial gains (or losses), including the effect of contributions greater or lesser than the previously determined actuarial level, are reflected by decreases (or increases) in the unfunded actuarial liability. Under Act 205 of 1984, and updated by Act 44, the unfunded actuarial liability is amortized as a level dollar amount over the lesser of:
(a) (i) 30 years, with respect to the initial liability as of 1/1/85 (or first valuation); (ii) 20 years, with respect to actuarial gains and losses; (iii) 15 years, with respect to changes due to actuarial assumptions; (iv) 20 years, with respect to changes due to plan provisions (if state mandated); (v) 10 years, with respect to changes in benefits for currently active members and 1 year
of retired members (if local benefit changes); or
(b) The average assumed working lifetime of active employees as of the date the liability was established. If there are no active employees, the unfunded liability is amortized one year after the liability was established.

PENNSYLVANIA MUNICIPAL RETIREMENT SYSTEM ACTUARIAL VALUATION AS OF JANUARY 1, 2014
APPENDIX B
ACTUARIAL ASSUMPTIONS AND METHODS
42
With the two exceptions which follow, the funding method is applied individually with respect to each municipality:
1) Retired and disabled members are paid monthly benefits from the System’s Retired Reserve account, which at the time of retirement receives a transfer from the municipal and member accounts in an amount actuarially determined to be sufficient to pay all future benefits for the member (and, if applicable, a surviving beneficiary). Thus, post-retirement experience is pooled with the System. (However, this procedure does not apply to the legislated ad-hoc adjustments effective January 1, 1989.)
2) A disabled member’s pension is met in part from the amount that can be provided by the value of that portion of the member’s accrued benefit attributable to municipal contributions, with the balance of the pension being provided by the appropriate transfer from the Disability Reserve Account. The amount of annual transfer from the accumulated municipal contributions to the Disability Reserve Account is determined on the one year term cost basis, i.e., the expected cost of disabilities in the coming year.
Method to estimate roll forward liabilities:
The defined benefit pension plans for municipalities are valued explicitly every odd calendar year. For the even calendar years, the liabilities for these plans are estimated by rolling forward the liabilities associated with the active and vested terminated employees from the prior year valuation date to the current year. The retiree liabilities for these municipal pension plans are explicitly valued every year. Therefore, in order to not double count liabilities for the new retirees as of January 1, 2014, the prior year liabilities for these new retirees are excluded from the rolled forward liabilities. Changes in Actuarial Assumptions and Methods: There were no changes in the actuarial assumptions from last year to this year for the municipal plans. For the county plans there was a change in the investment return assumption, which decreased from 6.00% in 2012 to 5.50% in 2014 for the county plans. The valuation programming was improved to ensure the disability decrements were not applied for any county plans that do not provide any additional benefits if an active participant becomes disabled from active status.


