Pennsylvania Nonprofit Employment Lester M. Salamon Stephanie Lessans Geller with the technical assistance of S. Wojciech Sokolowski A Joint Product of the Johns Hopkins Center for Civil Society Studies and the Pennsylvania Association of Nonprofit Organizations Johns Hopkins Nonprofit Employment Data Project Nonprofit Employment Bulletin Number 18
Transcript
Pennsylvania Nonprofit Employment
Lester M. Salamon
Stephanie Lessans Geller
with the technical assistance of
S. Wojciech Sokolowski
A Joint Product of the Johns Hopkins Center for Civil Society Studies and the Pennsylvania Association of Nonprofit Organizations
Joh
ns
Ho
pki
ns
No
np
rofi
t Em
plo
yme
nt
Da
ta P
roje
ct
Nonprofit Employment Bulletin Number 18
This report was prepared for the Pennsylvania Association of Nonprofit Organizations by Lester M. Salamon and Stephanie Lessans Geller at the Center for Civil Society Studies, Institute for Policy Studies, Johns Hopkins University.
AcknowledgmentsWe are grateful to Joe Geiger and his staff at the Pennsylvania Association of Nonprofit Organizations, M&T Bank and The United Way of Pennsylvania for their financial support; Amy Knapp at the U.S. Bureau of Labor Statistics; Claudine Holaska (design and production), Mimi Bilzor (editorial guidance), and Anne DeCesaro (technical sup-port) at The Johns Hopkins University.
Suggested CitationPennsylvania Nonprofit Employment, by Lester M. Salamon and Stephanie Lessans Geller (Baltimore: Johns Hopkins Center for Civil Society Studies, January 2005). Copies of this report are available on the Center for Civil Society Studies Web site (www.jhu.edu/ccss).
We are grateful to the following organizations for their financial support:
United Way of Pennsylvania
Not-for-Profit Group
PENNSYLVANIANONPROFIT
EMPLOYMENT
LESTER M. SALAMON
AND
STEPHANIE LESSANS GELLER
WITH THE TECHNICAL ASSISTANCE OF
S. WOJCIECH SOKOLOWSKI
JANUARY 2005
A JOINT PRODUCT OF
THE JOHNS HOPKINS
CENTER FOR CIVIL
SOCIETY STUDIES
AND
THE PENNSYLVANIA
ASSOCIATION OF
NONPROFIT ORGANIZATIONS
KEY FINDINGS
1. The nonprofit sector is a major economic force in Pennsylvania,accounting for one out of every nine paid workers—close totwice as many workers as the state’s metal and machines man-ufacturing industry, including the steel industry. In the city ofPhiladelphia, nonprofits account for a striking 27 percent of allprivate employment (see pages 3 and 6).
2. The 634,098 nonprofit employees in Pennsylvania earned over$21.1 billion in wages in 2003, or nearly 11 percent of thestate’s total (see page 3).
3. While nonprofit employment in Pennsylvania is primarily con-centrated in the Philadelphia and Pittsburgh metropolitan areas,it is not restricted to any one region. In fact, the nonprofit sec-tor accounts for almost as large a share of Pennsylvania’s totalprivate employment in rural areas as it does in urbanized ones(see page 5).
4. Three fifths of all nonprofit jobs in the state are in the health ser-vices field (see page 6).
5. Over the past eight years, nonprofit employment grew by 25percent—more than three times the 7 percent growth rateachieved by the for-profit sector. Moreover, during the recenteconomic downturn of 2000-03, for-profit jobs actuallydeclined while nonprofit jobs continued their upward trend (seepage 7).
6. Between 1995 and 2003, nonprofit job growth was especiallystrong in the fields of membership organizations (117 percent)and elementary and secondary schools (106 percent). In con-trast, nonprofit home health providers experienced a 25 percentdecline in jobs (see pages 7-8).
7. Nonprofit job growth was not confined to a few areas ofPennsylvania. Rather, in all regions of the state, nonprofitsadded jobs at a rate significantly above that of the for-profit sec-tor (see page 9).
8. Overall weekly wages of nonprofit employees are lower thanthose of for-profit and government workers. But, in industriesin which nonprofits and for-profits are both significantlyinvolved, nonprofit average weekly wages generally outpacefor-profit wages (see page 10).
INTRODUCTION
Nonprofit organizations contribute to the quality of life forall Pennsylvania citizens through the health care, educa-tion, job training, youth development, nursing home care,arts, culture, and other services they provide, and throughthe opportunities they offer for democratic participation inthe life of Pennsylvania communities. What is not widelyappreciated, however, is that nonprofit organizations arealso a major force in the state’s economy, and in theeconomies of all the state’s regions.
This report presents new information on the size, composi-tion, distribution, and growth of paid employment in theprivate nonprofit sector in Pennsylvania as of the secondquarter of 2003. The report draws on data generated by thePennsylvania Department of Labor through the quarterlysurveys of Pennsylvania workplaces it carries out under thenational ES-202 labor market information program admin-istered by the U.S. Bureau of Labor Statistics as part of theunemployment insurance program. These data are com-piled from quarterly reports submitted by employers incompliance with U.S. and Pennsylvania law.
By law, all nonprofit places of employment are required tocomplete these quarterly surveys and either be covered bythe federal unemployment insurance system or make otherarrangements to provide unemployment coverage to laid-off workers. The one major exclusion is religious congre-gations, which are not required to take part in the unem-ployment insurance system, although the significance ofthis exclusion is unknown as some religious organizationsnevertheless elect to be covered by unemployment insur-ance.
For the purpose of this report, we have chosen to focus onthe “charitable” portion of the nonprofit sector. Thisincludes organizations registered with the U.S. InternalRevenue Service under Section 501(c)(3) of the InternalRevenue Code, which embraces private, not-for-profit hos-pitals, clinics, colleges, universities, elementary schools,social service agencies, day care centers, orchestras, muse-ums, theaters, environmental organizations, homeless shel-ters, soup kitchens, and many more.
For further information on the ES-202 data source, the def-inition of the nonprofit sector, and the method used here toextract data on nonprofit organizations from thePennsylvania ES-202 records, see Appendix A.
3
Figure 1: Nonprofit share of total employment, Pennsylvania vs. the nation
Source: Johns Hopkins Nonprofit Employment Data Project based onPennsylvania ES-202 data, and Census of Service Industries (2002).
DETAILED FINDINGS
I. A MAJOR ECONOMIC FORCE
The private nonprofit sector in Pennsylvania, includingprivate hospitals, clinics, colleges, universities, schools,day care centers, social service providers, museums, the-aters, soup kitchens, and many more, is a major economicforce in the state.
Employment: Pennsylvania’s private, nonprofit organiza-tions employed 634,098 paid workers as of the secondquarter of 2003.
l This represents 11.5 percent of the total Pennsylvaniaworkforce (or 1 out of every 9 workers) and 13.3 per-cent of total private employment in the state (or rough-ly 1 out of every 8 private workers). This putsPennsylvania significantly above the U.S. average interms of the nonprofit share of total employment (11.5percent vs. 6.9 percent) (see Figure 1).
11.5%
6.9%
0%
2%
4%
6%
8%
10%
12%
14%
Pennsylvania United StatesP
erce
nt
of
tota
l em
plo
ymen
t
634.1
486.0
360.0
269.9249.0
227.7
126.8 124.0
30.1
0
100
200
300
400
500
600
700
NonprofitOrganizations
LocalGovernment
Metal andMachines
Manufacturing
Finance andInsurance
Construction WholesaleTrade
Transportation Information Utilities
No
mb
er o
f em
plo
yees
(in
tho
usa
nd
s)
Nonprofit Industries Government
Source: Johns Hopkins Nonprofit Employment Data Project based on Pennsylvania ES-202 data.
Figure 2: Employment in the Pennsylvania nonprofit sector in comparison to selected industries, 2003
l Nonprofit organizations thus accounted for 10.7 per-cent of the state’s total payroll.
l Nonprofit payrolls exceeded those for:
– Utilities ($2.2 billion);
– Transportation ($4.3 billion);
– Information ($6.0 billion);
– State government ($6.2 billion);
– Construction ($10 billion);
– Wholesale trade ($10.8 billion);
– Finance and insurance ($14.1 billion);
– Metal and machines manufacturing ($15.8 billion);and
– Local government ($18.6 billion).
Through the wages they pay, Pennsylvania nonprofits thuscontribute significantly to the state’s economy and to thesales and income tax revenues of its government.
4
l As shown in Figure 2, the Pennsylvania nonprofit sec-tor employed:
– More than 21 times as many workers as the state’sutilities industry;1
– More than five times as many workers as thestate’s transportation industry and its informationindustry;2
– Close to three times as many workers as the state’swholesale trade industry;
– About two and a half times as many workers as thestate’s finance and insurance industry and its con-struction industry;
– Close to twice as many workers as the state’s metaland machines manufacturing industry, includingthe steel industry;3
– Nearly a third more people than all ofPennsylvania’s local governments combined.
Payroll: The 634,098 nonprofit employees inPennsylvania earned over $21.1 billion in wages in 2003.4
Source: Johns Hopkins Nonprofit Employment Data Project based on Pennsylvania ES-202 data.
Figure 3: Distribution of Pennsylvania nonprofit employment, by region, 2003
Erie2.4%
Williamsport0.9%
Altoona1.0%
Southwest/Central2.9%
Johnsontown1.4%
State College0.5%
North Central2.1%
Pittsburgh21.5%
Youngstown1.0%
Northwest1.8%
Pocono Region1.9%
Scranton-Wilkes Barre4.5%
Newark-Union0.0%
Reading1.9%
Allentown-Bethlehem-
Easton4.5%
Philadelphia38.6%
Lancaster3.1%
Lebanon0.6%
Harrisburg-Carlisle4.5%
York-Hanover
2.1%
Susquehanna Valley2.5%
5
II. REGIONAL PRESENCE
Nonprofit employment is not restricted to any one region inPennsylvania. Rather, it is distributed broadly throughoutthe state.
Similar to Pennsylvania’s population, most of the state’snonprofit employment is located in the state’s metropolitanareas.5
l Nearly 89 percent of Pennsylvania’s nonprofit employ-ment is located in the state’s urbanized MetropolitanStatistical Areas. This is roughly equivalent to the 86percent of all private jobs in these areas.6
l The urbanized areas with the largest shares of thestate’s nonprofit employment are the PhiladelphiaMSA and the Pittsburgh MSA. Combined, these areasaccount for 60 percent of the state’s total nonprofitemployment (see Figure 3).
l As the largest city in the state and the fifth largest cityin the nation, Philadelphia employs a quarter (23 per-cent) of the state’s nonprofit workers.
Within the state’s major metropolitan areas, the bulk ofnonprofit employment is concentrated in urban centers.
But a substantial portion is now also located in the suburbs.
l Thus, in the Philadelphia MSA, 59 percent of nonprof-it employment is located in Philadelphia, but theremaining 41 percent is located in its surrounding sub-urbs.
l The difference between the urban and suburban sharesof nonprofit employment is even greater in thePittsburgh MSA, where 86 percent of the region’s non-profit employment is concentrated in AlleghenyCounty, which contains the City of Pittsburgh. But thiscounty itself includes numerous suburbs, and another14 percent of the MSA’s nonprofit employment islocated in the suburbs beyond Allegheny County.
However, nonprofit employment is hardly an exclusivelyurban and suburban phenomenon in Pennsylvania. Rather,it accounts for a significant share of total private employ-ment in all regions of the state (see Figure 4). In particu-lar:
l Nonprofits account for almost as large a share ofPennsylvania’s total private employment in rural areasas in urbanized areas (12.6 percent vs. 13.6 percent,respectively).
Source: Johns Hopkins Nonprofit Employment Data Project based on Pennsylvania ES-202 data.
Figure 4: Nonprofit employment as a percent of total private employment, by region, 2003
Erie13.7%
Williamsport13.1%
Altoona12.5%
Southwest/Central12.1%
Johnsontown18.5%
State College8.1%
North Central14.0%
Pittsburgh14.2%
Youngstown15.6%
Northwest13.5%
Pocono Region10.1%
Scranton-Wilkes Barre13.1%
Newark-Union4.3%
Reading8.4%
Allentown-Bethlehem-
Easton11.8%
Philadelphia15.4%
Lancaster9.8%
Lebanon9.8%
Harrisburg-Carlisle11.5%
York-Hanover
9.2%
Susquehanna Valley14.0%
l Sixty percent of all nonprofit jobs in Pennsylvania(nearly 380,200 jobs) are in health services. Hospitalsaccount for the bulk of these jobs, employing 35 per-cent of the state’s nonprofit workforce, or about 1 outof every 3 nonprofit workers, but health clinics andnursing homes account for an impressive 25 percent.
l Another 19 percent of all nonprofit jobs inPennsylvania (118,325 jobs) are in educational ser-vices, including elementary and secondary schools,colleges, and universities.
l Ten percent of all nonprofit jobs in Pennsylvania (over61,200 jobs) are in social assistance. This includesemployment in individual and family services, com-munity food services, housing services, child day care,and vocational rehabilitation.
l Five percent of all nonprofit jobs are in various mem-bership organizations (close to 30,300 jobs). Thisincludes jobs in religious organizations, grant-makingand giving services, advocacy organizations, civic andsocial organizations, and the charitable arms of variousprofessional associations.
l As shown in Figure 6, the distribution of nonprofitemployment in Pennsylvania diverges from that of the
– In some non-metropolitan areas, nonprofitemployment exceeds even this level. Thus, inMontour County in rural Susquehanna Valley, non-profits account for nearly 57 percent of total pri-vate employment, largely due to the presence thereof the nonprofit Geisinger Health System.
– Nonprofit employment also reaches over 20 per-cent in some individual counties, such as BradfordCounty (21 percent) in the Pocono region, andUnion County (25 percent) in the SusquehannaValley.
l Urbanized counties with especially sizable nonprofitshares of private employment include Philadelphia (27percent), Cambria (19 percent), Lackawanna (17 per-cent), Mercer (16 percent), Allegheny (16 percent), andDelaware (15 percent).
For a county-by-county breakdown of nonprofit employ-ment, see Appendix B.
III. HEALTH DOMINANCE
Health organizations account for the vast majority ofPennsylvania’s nonprofit jobs, but educational and socialservices organizations also account for significant shares(see Figure 5 and Appendix C).
Other5%
Hospitals35%
Professional, Scientific Services
1%Educational
Services19%
Nursing and Residential
Care16%
Clinics and Home Health
Care9%
Social Assistance
10%
Museums, Historical Sites
1%
Membership Organizations
5%
6
Source: Johns Hopkins Nonprofit Employment Data Project based onPennsylvania ES-202 data.
Figure 5: Distribution of Pennsylvania nonprofit employment, by field, 2003
16%15%
1%
38%
13%
4%2%
35%
10%
3%
11%9%
0%
5%
10%
15%
20%
25%
30%
35%
40%
Hospita
ls
Nursing
and R
eside
ntial C
are
College
s and
Univers
ities
Socia
l Assi
stance
Elemen
tary a
nd Se
cond
ary Sc
hools
Home H
ealth
Care Se
rvice
Per
cen
t of t
ota
l no
np
rofit
em
plo
ymen
t
Pennsylvania
United States
Source: Johns Hopkins Nonprofit Employment Data Project based onPennsylvania ES-202 data.
Figure 6: Distribution of nonprofit employment, Pennsylvania vs. the nation
Nursingand
ResidentialCare
Hospitals HomeHealthCare
SocialAssistance
Elementaryand
SecondarySchools
Collegesand
Universities
7
nation. In particular, Pennsylvania has a considerablylarger share of nonprofit employment in nursing andresidential care and colleges and universities than thenational average (16.4 percent and 14.5 percent vs.11.3 and 9.0 percent, respectively), and a noticeablysmaller share in social assistance and hospitals than thenation (9.7 percent and 34.8 percent vs. 12.5 percentand 38.0 percent, respectively).
IV. A GROWING SECTOR
The nonprofit sector has been a particularly importantdriver of Pennsylvania’s economy in recent years, addingjobs at a more rapid rate than the state’s for-profit sector.
l Overall growth. Between 1995 and 2003, nonprofitemployment in Pennsylvania grew by 25 percent, or anaverage of 3.1 percent per year, adding about 126,000jobs to the state’s total. This was more than three timesthe 6.9 percent growth rate achieved by the for-profitsector during this period, as shown in Figure 7.
l With about 12 percent of Pennsylvania’s privateemployment when this period began, the nonprofit sec-tor thus accounted for an impressive 32 percent of thestate’s total private job growth between 1995 and 2003.
l The disparity between nonprofit and for-profit jobgrowth was especially marked during the recent eco-nomic downturn of 2000-03, when for-profit jobs actu-ally declined while nonprofit jobs continued theirupward trend (see Figure 8). Thus, between 2000 and2002, nonprofit employment grew by an average of 2.5percent per year while for-profit employmentdecreased by close to 1 percent per year; between 2002and 2003, nonprofit employment grew by 2.1 percent,while for-profit employment decreased by 1.5 percent.
Source: Johns Hopkins Nonprofit Employment Data Project based onPennsylvania ES-202 data.
24.9%
6.9%
0%
5%
10%
15%
20%
25%
30%
Nonprofit For-profit
Gro
wth
rat
e
Figure 7: Change in for-profit vs. nonprofit employment in Pennsylvania, 1995-2003
Figure 8: Average change per year in for-profit vs. nonprofitemployment in Pennsylvania, 1995-2003
Source: Johns Hopkins Nonprofit Employment Data Project based onPennsylvania ES-202 data.
2.5%2.1%
-0.9%
-1.5%
3.3%3.1%
2.1%
0.9%
-2.0%
-1.0%
0.0%
1.0%
2.0%
3.0%
4.0%
1995 - 2003 1995 - 2000 2000 - 2002 2002 - 2003
Ave
rag
e g
row
th r
ate
Nonprofit
For-profit
l Variations by field. Although overall nonprofitemployment grew 25 percent between 1995 and 2003,in certain fields it clearly did better than in others,while in some it experienced negative job growth. Inparticular, as shown in Figure 9:
– Nonprofit employment growth was especiallystrong among membership organizations (117 per-cent) and elementary and secondary schools (106percent).
8
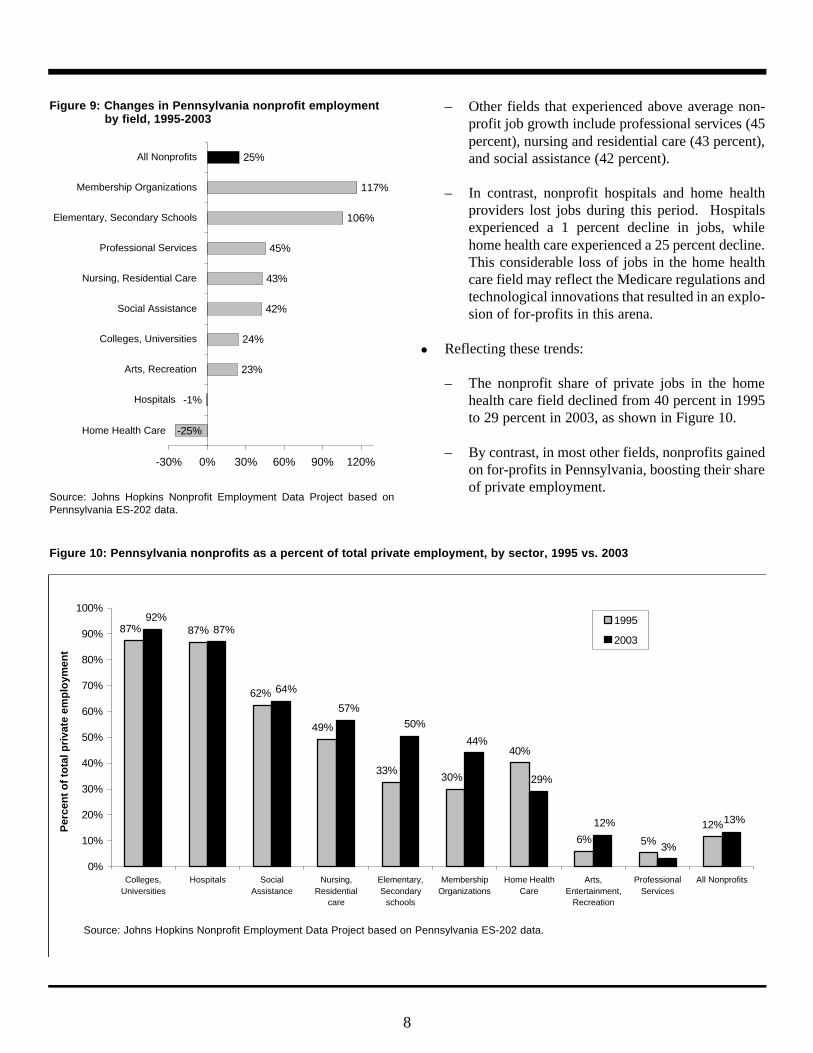
– Other fields that experienced above average non-profit job growth include professional services (45percent), nursing and residential care (43 percent),and social assistance (42 percent).
– In contrast, nonprofit hospitals and home healthproviders lost jobs during this period. Hospitalsexperienced a 1 percent decline in jobs, whilehome health care experienced a 25 percent decline.This considerable loss of jobs in the home healthcare field may reflect the Medicare regulations andtechnological innovations that resulted in an explo-sion of for-profits in this arena.
l Reflecting these trends:
– The nonprofit share of private jobs in the homehealth care field declined from 40 percent in 1995to 29 percent in 2003, as shown in Figure 10.
– By contrast, in most other fields, nonprofits gainedon for-profits in Pennsylvania, boosting their shareof private employment.
Figure 9: Changes in Pennsylvania nonprofit employment by field, 1995-2003
-1%
23%
24%
42%
43%
45%
106%
117%
25%
-25%
-30% 0% 30% 60% 90% 120%
Arts, Recreation
Colleges, Universities
Social Assistance
Nursing, Residential Care
Professional Services
Elementary, Secondary Schools
Membership Organizations
All Nonprofits
Home Health Care
Hospitals
Source: Johns Hopkins Nonprofit Employment Data Project based onPennsylvania ES-202 data.
87%
40%
6% 5%
12%
30%33%
87%
62%
49%
3%
29%
87%92%
64%
57%50%
44%
12% 13%
0%
10%
20%
30%
40%
50%
60%
70%
80%
90%
100%
Colleges,Universities
Hospitals SocialAssistance
Nursing,Residential
care
Elementary,Secondary
schools
MembershipOrganizations
Home HealthCare
Arts,Entertainment,
Recreation
ProfessionalServices
All Nonprofits
Per
cen
t of t
ota
l pri
vate
em
plo
ymen
t
1995
2003
Source: Johns Hopkins Nonprofit Employment Data Project based on Pennsylvania ES-202 data.
Figure 10: Pennsylvania nonprofits as a percent of total private employment, by sector, 1995 vs. 2003
9
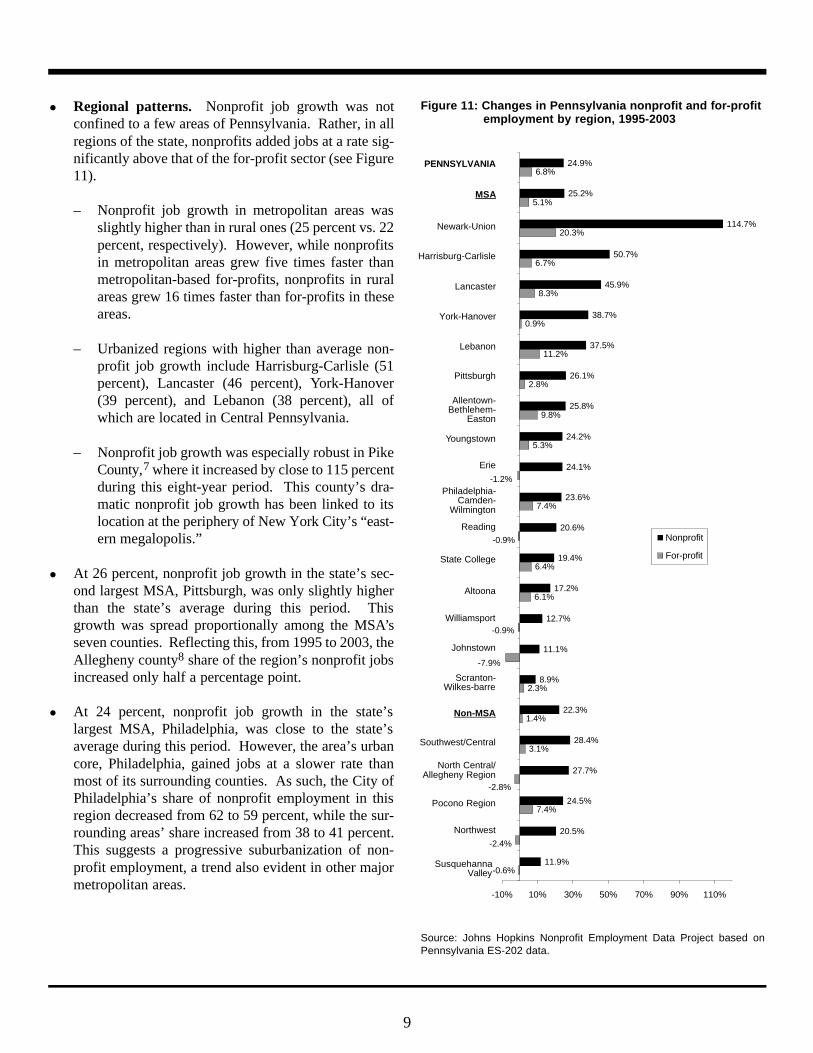
l Regional patterns. Nonprofit job growth was notconfined to a few areas of Pennsylvania. Rather, in allregions of the state, nonprofits added jobs at a rate sig-nificantly above that of the for-profit sector (see Figure11).
– Nonprofit job growth in metropolitan areas wasslightly higher than in rural ones (25 percent vs. 22percent, respectively). However, while nonprofitsin metropolitan areas grew five times faster thanmetropolitan-based for-profits, nonprofits in ruralareas grew 16 times faster than for-profits in theseareas.
– Urbanized regions with higher than average non-profit job growth include Harrisburg-Carlisle (51percent), Lancaster (46 percent), York-Hanover(39 percent), and Lebanon (38 percent), all ofwhich are located in Central Pennsylvania.
– Nonprofit job growth was especially robust in PikeCounty,7 where it increased by close to 115 percentduring this eight-year period. This county’s dra-matic nonprofit job growth has been linked to itslocation at the periphery of New York City’s “east-ern megalopolis.”
l At 26 percent, nonprofit job growth in the state’s sec-ond largest MSA, Pittsburgh, was only slightly higherthan the state’s average during this period. Thisgrowth was spread proportionally among the MSA’sseven counties. Reflecting this, from 1995 to 2003, theAllegheny county8 share of the region’s nonprofit jobsincreased only half a percentage point.
l At 24 percent, nonprofit job growth in the state’slargest MSA, Philadelphia, was close to the state’saverage during this period. However, the area’s urbancore, Philadelphia, gained jobs at a slower rate thanmost of its surrounding counties. As such, the City ofPhiladelphia’s share of nonprofit employment in thisregion decreased from 62 to 59 percent, while the sur-rounding areas’ share increased from 38 to 41 percent.This suggests a progressive suburbanization of non-profit employment, a trend also evident in other majormetropolitan areas.
Source: Johns Hopkins Nonprofit Employment Data Project based onPennsylvania ES-202 data.
-0.6%
7.4%
3.1%
1.4%
2.3%
6.1%
6.4%
7.4%
5.3%
9.8%
2.8%
11.2%
0.9%
8.3%
6.7%
20.3%
5.1%
6.8%
11.9%
20.5%
24.5%
27.7%
28.4%
22.3%
8.9%
11.1%
12.7%
17.2%
19.4%
20.6%
23.6%
24.1%
24.2%
25.8%
26.1%
37.5%
38.7%
45.9%
50.7%
114.7%
25.2%
24.9%
-1.2%
-0.9%
-0.9%
-2.8%
-2.4%
-7.9%
-10% 10% 30% 50% 70% 90% 110%
Northwest
Pocono Region
North Central/Allegheny Region
Southwest/Central
Non-MSA
Scranton-Wilkes-Barre
Johnstown
Williamsport
Altoona
State College
Reading
Philadelphia- Camden- Wilmington
Erie
Youngstown
Allentown-Bethlehem- Easton
Pittsburgh
Lebanon
York-Hanover
Lancaster
Harrisburg-Carlisle
Newark-Union
MSA
Pennsylvania
Nonprofit
For-profit
Figure 11: Changes in Pennsylvania nonprofit and for-profitemployment by region, 1995-2003
PENNSYLVANIA
MSA
Non-MSA
Newark-Union
Harrisburg-Carlisle
Lancaster
Allentown-Bethlehem-
Easton
Pittsburgh
Lebanon
York-Hanover
Youngstown
Erie
Philadelphia-Camden-
Wilmington
Reading
State College
Altoona
Williamsport
Johnstown
Scranton-Wilkes-barre
Southwest/Central
North Central/Allegheny Region
Pocono Region
Northwest
SusquehannaValley
10
V. RELATIVELY HIGH WAGES
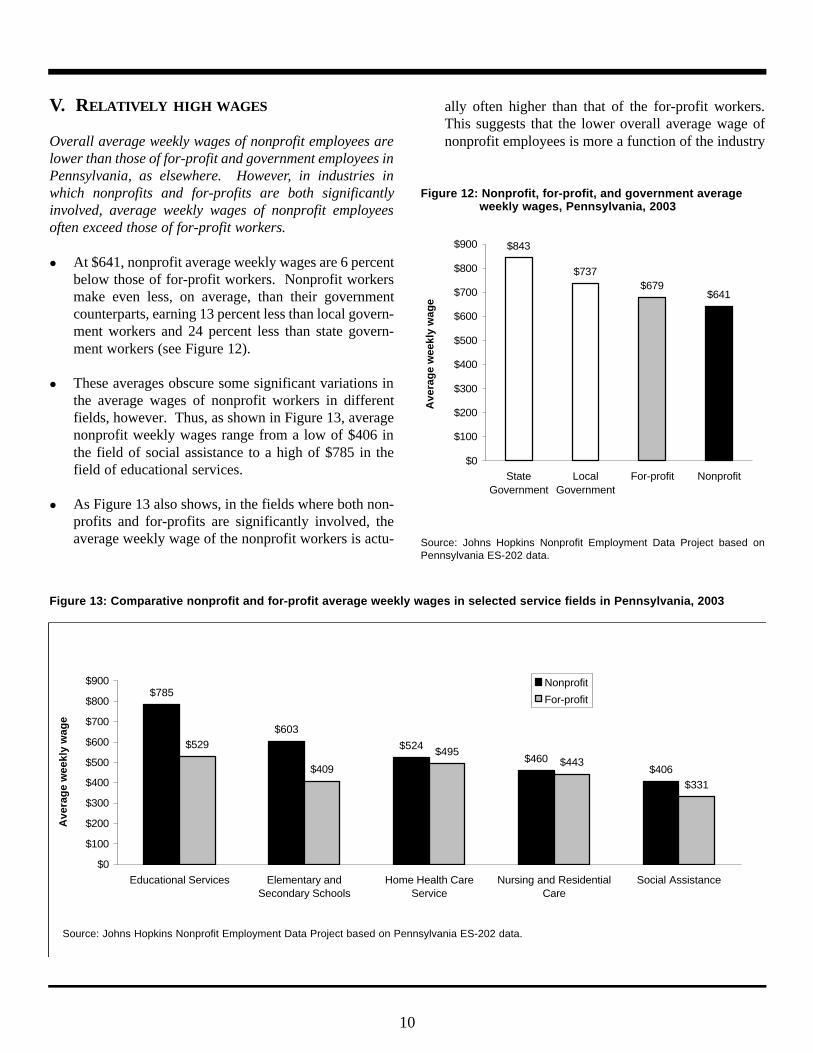
Overall average weekly wages of nonprofit employees arelower than those of for-profit and government employees inPennsylvania, as elsewhere. However, in industries inwhich nonprofits and for-profits are both significantlyinvolved, average weekly wages of nonprofit employeesoften exceed those of for-profit workers.
l At $641, nonprofit average weekly wages are 6 percentbelow those of for-profit workers. Nonprofit workersmake even less, on average, than their governmentcounterparts, earning 13 percent less than local govern-ment workers and 24 percent less than state govern-ment workers (see Figure 12).
l These averages obscure some significant variations inthe average wages of nonprofit workers in differentfields, however. Thus, as shown in Figure 13, averagenonprofit weekly wages range from a low of $406 inthe field of social assistance to a high of $785 in thefield of educational services.
l As Figure 13 also shows, in the fields where both non-profits and for-profits are significantly involved, theaverage weekly wage of the nonprofit workers is actu-
ally often higher than that of the for-profit workers.This suggests that the lower overall average wage ofnonprofit employees is more a function of the industry
Source: Johns Hopkins Nonprofit Employment Data Project based onPennsylvania ES-202 data.
$843
$737$679
$641
$0
$100
$200
$300
$400
$500
$600
$700
$800
$900
StateGovernment
LocalGovernment
For-profit Nonprofit
Ave
rag
e w
eekl
y w
age
Figure 12: Nonprofit, for-profit, and government average weekly wages, Pennsylvania, 2003
Source: Johns Hopkins Nonprofit Employment Data Project based on Pennsylvania ES-202 data.
Figure 13: Comparative nonprofit and for-profit average weekly wages in selected service fields in Pennsylvania, 2003
11
mix of nonprofit employment than it is of the wage lev-els of nonprofit organizations. In fact, the nonprofitjobs in these industries tend to be better paying. Forexample:
– Nonprofit workers in home health care earn 6 per-cent more, on average, than their for-profit coun-terparts;
– Nonprofit social assistance providers earn close toa quarter more than their counterparts in for-profitfacilities;
– Similarly, in the elementary and secondary educa-tion field, nonprofit salaries average nearly 50 per-cent more than for-profit ones.
l These variations in comparative earnings may be aresult of a heavier use of part-time workers on the partof for-profit employers, but it is not possible to deter-mine this from the available data.9
1 Utilities includes establishments that provide electric power, naturalgas, steam supply, water supply, or sewage removal.2 Information includes publishing industries, broadcasting and telecom-munications, information and data processing services, and the motionpicture and sound recording industries.3 This category refers to NAICS sector 33 and includes primary metalmanufacturing; fabricated metal product manufacturing; machinerymanufacturing; computer and electronic product manufacturing; electri-cal equipment, appliance, and component manufacturing; transportationequipment manufacturing; and furniture and related product manufac-turing.4 All payroll data are annual estimates computed by multiplying secondquarter data by 4. Actual annual payrolls may differ slightly due toseasonal variations.5 Due to disclosure limitations, county-by-county data are only avail-able for private employers. As such, sections of this report relating tothe regional breakdown of employment compare nonprofit employmentto private employment rather than to total employment.
6 According to the U.S. Office of Management and Budget, an MSA is:1) a county or group of contiguous counties that contains at least onecity of 50,000 inhabitants or more, or 2) an urbanized area of at least50,000 inhabitants and a total MSA population of at least 100,000 inhab-itants. The contiguous counties are included in an MSA if, according tocertain criteria, they are essentially metropolitan in character and aresocially and economically integrated with the central city or cities. Fora list of Pennsylvania MSAs and their component counties, seeAppendix B.7 Pike County is located in the Newark-Union MSA. The MSA alsoincludes five counties in the state of New Jersey, which are not analyzedin this report.8 Allegheny County is the urban center of the Pittsburgh MSA.9 The average weekly wage reported in the ES-202 survey data makesno adjustment for full-time or part-time work. Industries with a greaternumber of part-time workers could appear to have lower average week-ly wages than those with fewer part-time workers even if the actual payrates are equal.
CONCLUSION
Throughout the state of Pennsylvania, nonprofit organiza-tions serve citizens and communities, addressing issues ofconcern and improving the quality of life. Pennsylvania’snonprofits range from hospitals to boys and girls clubs,from universities to environmental groups, and from muse-ums and theaters to organizations working with the elder-ly, veterans, and the disabled.
But nonprofit organizations are not only vital toPennsylvania communities; they are also a major force inthe state’s economy and in the economies of the state’sregions. Regrettably, however, the economic significanceof the nonprofit sector as a source of jobs and wages is notwell understood. As a result, this sector is often over-looked in economic development as well as in educationand training efforts that could prove extremely beneficialto the sector in the long term. The data presented in thisreport are intended to correct this situation, promotegreater understanding of the economic contributions andimpact of the nonprofit sector, and demonstrate theimmense stake that Pennsylvania citizens consequentlyhave in this sector’s continued health.
12
SOURCE OF DATA
The major source of employment and wage data for thisreport is the Covered Employment and Wages Program,commonly referred to as the ES-202 program, a coopera-tive initiative involving State Employment SecurityAgencies and the Bureau of Labor Statistics. The ES-202program produces a comprehensive tabulation of employ-ment and wage information for workers covered by stateUnemployment Insurance (UI) laws and federal workerscovered by the Unemployment Compensation for FederalEmployees Program. Data contained in this report repre-sent all employees covered by the UnemploymentInsurance (UI) Law of Pennsylvania as well as federalworkers covered by the Unemployment Compensation ofFederal Employees Program. The data on state-insuredworkers are compiled from quarterly contribution reportssubmitted by employers subject to Pennsylvania law.Employment data pertaining to the federal government areobtained from similarly required reports submitted by thevarious government installations in Pennsylvania.
SCOPE OF COVERAGE
The ES-202 program accounts for approximately 98 per-cent of all wage and salary civilian employment nationally(the program does not cover self-employed and familyworkers). The principal exclusions from the ES-202 dataset are employees of religious organizations, railroad work-ers, small-scale agriculture, domestic service, crew mem-bers on small vessels, state and local government electedofficials, and insurance and real estate agents who receivepayment solely by commission. In terms of nonprofitemployment, the exclusion of religious organizations is themost significant; however, religious organizations mayelect to be covered by the UI program and those that do arecovered in the data. At this time, the level of noncoverageis unknown.
The number of employees is measured by the number offilled jobs for the pay period that includes the 12th day ofeach month as reported by the employer. Both part-timeand full-time employees are included in the data set. If aperson holds two jobs, that person would be counted twicein the data set. Wages include bonuses, stock options, the
cash value of meals and lodging, and tips and other gratu-ities.
The employment data for nonprofit organizations wereidentified by matching ES-202 files for Pennsylvania withregistries of tax-exempt firms provided by the U.S. InternalRevenue Service.
For the purpose of this report, we have chosen to focus onthe “charitable” portion of the nonprofit sector. Thisincludes organizations registered with the U.S. InternalRevenue Service under Section 501(c)(3) of the InternalRevenue Code, which embraces private, not-for-profit hos-pitals, clinics, colleges, universities, elementary schools,social service agencies, day care centers, orchestras, muse-ums, theaters, homeless shelters, soup kitchens, and manymore. In addition to Section 501(c)(3), the InternalRevenue Code contains 25 other subsections under whichorganizations can claim exemption from federal incometaxation as nonprofit organizations. Section 501(c)(3) is byfar the most important of these, the one that covers the bulkof nonprofit organizations, and the one with the organiza-tions most commonly associated with the nonprofit sector.
APPENDIX A: THE ES-202 UNEMPLOYMENT INSURANCE LABOR MARKET
INFORMATION PROGRAM
13
APPENDIX B: NONPROFIT EMPLOYMENT IN PENNSYLVANIA, BY REGION AND
COUNTY, IN COMPARISON TO TOTAL PRIVATE EMPLOYMENT AND METAL AND
MACHINE MANUFACTURING EMPLOYMENT, 2003
Region County
Nonprofit employment
501(c)(3)
Metal and machine
manufacturing employment
Total private employment
Nonprofit employment as a percent of total private
Nonprofit employment as a percent of total private
employment Beaver 5,925 3,543 46,066 12.9% Butler 5,965 8,886 61,826 9.6% Fayette 3,964 1,840 34,906 11.4% Washington 6,543 6,482 65,264 10.0% Westmoreland 11,704 16,762 115,734 10.1% Total 136,103 65,304 960,409 14.2% Reading Berks 11,778 18,616 139,591 8.4% Total 11,778 18,616 139,591 8.4% Scranton-Wilkes- Lackawanna 14,152 4,382 85,826 16.5% Barre Luzerne 13,421 7,692 121,688 11.0% Wyoming 826 52 8,721 9.5% Total 28,399 12,126 216,234 13.1% State College Centre 3,392 2,617 42,073 8.1% Total 3,392 2,617 42,073 8.1% Williamsport Lycoming 5,799 5,945 44,121 13.1% Total 5,799 5,945 44,121 13.1% York-Hanover York 13,479 21,595 146,496 9.2% Total 13,479 21,595 146,496 9.2% Youngstown Mercer 6,576 6,716 42,096 15.6% Total 6,576 6,716 42,096 15.6% MSA TOTAL 561,019 276,388 4,120,845 13.6%
Non-MSA Regions Pocono Region Bradford 4,140 962 19,649 21.1% Susquehanna 699 94 6,397 10.9% Wayne 1,358 272 12,042 11.3% Sullivan 148 D 1,323 11.2% Monroe 2,576 1,253 41,173 6.3% Schuylkill 3,390 3,702 40,921 8.3% Total 12,311 6,284 121,505 10.1% Susquehanna Clinton 644 184 10,297 6.3% Valley Columbia 825 1,115 20,698 4.0% Juniata 289 663 5,601 5.2% Mifflin 1,974 112 13,584 14.5% Montour 6,257 D 11,062 56.6% Northumberland 1,541 2,123 24,381 6.3% Snyder 821 2,196 14,168 5.8%
15
[D] Data unavailable because of federal restrictions of disclosure of data that can identify individual establishments. The total nonprofit employmentin the counties with such disclosure restrictions is 622, or 9.1 percent of total private employment.
[NR] Not reported due to unavailability of data on nonprofit employment in this county.
* Totals may be greater than the sum of individual counties due to the restrictions of disclosure of data.
Region County
Nonprofit employment
501(c)(3)
Metal and machine
manufacturing employment
Total private employment
Nonprofit employment as a percent of total private
employment Union 3,611 264 14,294 25.3% Total 15,962 6,658 114,086 14.0% Southwest/ Bedford 817 1,037 13,598 6.0% Central Fulton 427 1,328 3,932 10.9% Greene 1,084 89 8,446 12.8% Huntingdon 1,800 314 9,558 18.8% Indiana 2,609 1,386 24,491 10.7% Somerset 2,566 2,901 21,571 11.9% Adams 3,737 1,423 27,076 13.8% Franklin 5,036 5,076 41,139 12.2% Total 18,077 13,554 149,811 12.1% North Central/ Cameron 164 1,136 2,143 7.7% Allegheny Region Clarion 1,187 450 11,508 10.3% Clearfield 3,872 1,426 27,302 14.2% Elk 2,178 5,491 13,790 15.8% Forest D NR NR NR Jefferson 1,672 1,849 13,214 12.7% McKean 2,471 1,364 14,819 16.7% Potter D NR NR NR Tioga 1,579 98 10,662 14.8% Total 13,123 11,813 93,438 14.0% Northwest Crawford 4,069 4,203 26,284 15.5% Lawrence 3,027 2,343 26,759 11.3% Warren 1,443 1,172 12,710 11.4% Venango 2,671 2,647 17,219 15.5% Total 11,210 10,365 82,973 13.5% NON-MSA TOTAL* 70,682 48,739 561,812 12.6%
GRAND TOTAL FOR STATE* 634,098 359,972 4,772,001 13.3%
16
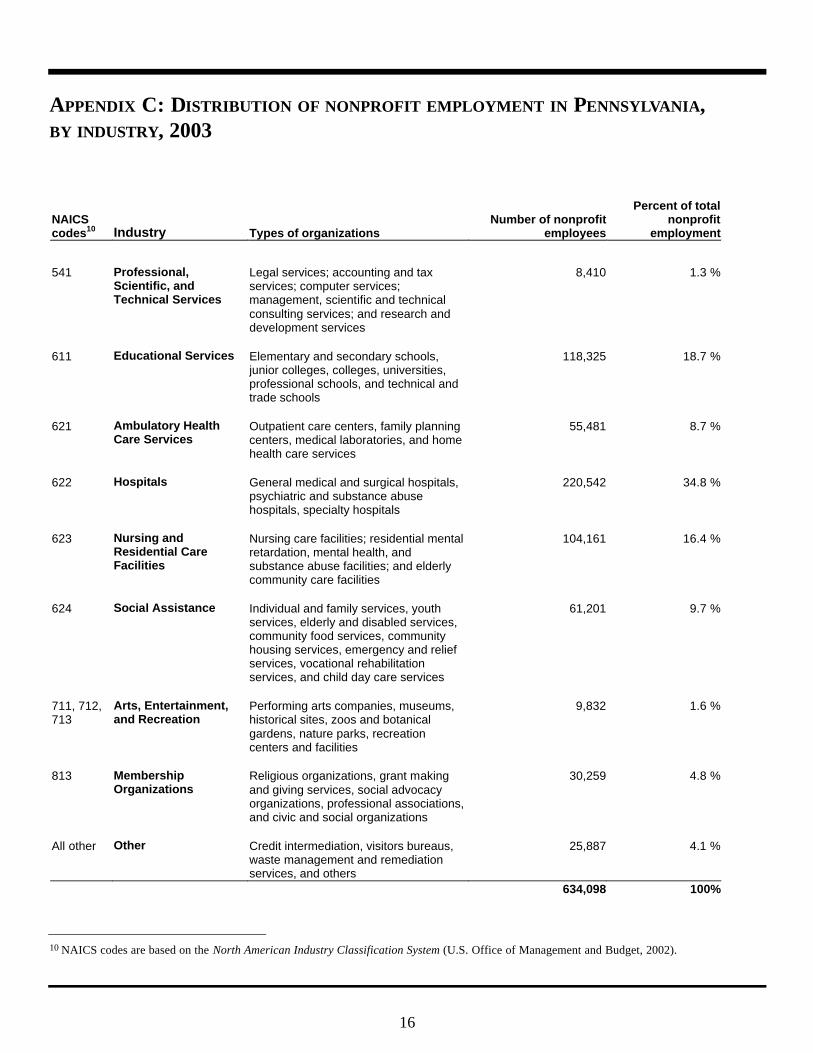
APPENDIX C: DISTRIBUTION OF NONPROFIT EMPLOYMENT IN PENNSYLVANIA,BY INDUSTRY, 2003
NAICS codes10 Industry Types of organizations
Number of nonprofit employees
Percent of total nonprofit
employment
541 Professional, Scientific, and Technical Services
Legal services; accounting and tax services; computer services; management, scientific and technical consulting services; and research and development services
8,410
1.3 %
611 Educational Services Elementary and secondary schools, junior colleges, colleges, universities, professional schools, and technical and trade schools
118,325
18.7 %
621 Ambulatory Health Care Services
Outpatient care centers, family planning centers, medical laboratories, and home health care services
55,481
8.7 %
622 Hospitals General medical and surgical hospitals, psychiatric and substance abuse hospitals, specialty hospitals
220,542
34.8 %
623 Nursing and Residential Care Facilities
Nursing care facilities; residential mental retardation, mental health, and substance abuse facilities; and elderly community care facilities
104,161
16.4 %
624 Social Assistance Individual and family services, youth services, elderly and disabled services, community food services, community housing services, emergency and relief services, vocational rehabilitation services, and child day care services
61,201
9.7 %
711, 712, 713
Arts, Entertainment, and Recreation
Performing arts companies, museums, historical sites, zoos and botanical gardens, nature parks, recreation centers and facilities
9,832
1.6 %
813 Membership Organizations
Religious organizations, grant making and giving services, social advocacy organizations, professional associations, and civic and social organizations
30,259
4.8 %
All other Other Credit intermediation, visitors bureaus, waste management and remediation services, and others
25,887 4.1 %
634,098 100%
10 NAICS codes are based on the North American Industry Classification System (U.S. Office of Management and Budget, 2002).
The Johns Hopkins Nonprofit Employment Data Project
The Nonprofit Employment Data (NED) Project is utilizing a previously untapped source of up-to-date data to
shed new light on nonprofit employment and wages in the U.S. and to chart the relationship among nonprofit, for-
profit, and government employment both nationally and locally. To do so, the project is drawing on data compiled
as part of the U.S. Unemployment Insurance program. A collaboration between the Center for Civil Society Studies
and state employment security agencies, the U.S. Bureau of Labor Statistics, and state nonprofit associations, the
NED Project is yielding a vital new resource for understanding the nonprofit sector.
The Johns Hopkins Center for Civil Society Studies
The Johns Hopkins Center for Civil Society Studies seeks to improve understanding and the effective functioning of
not-for-profit, philanthropic, or “civil society” organizations in the United States and throughout the world in order
to enhance the contribution these organizations can make to democracy and the quality of human life. The Center
is part of the Johns Hopkins Institute for Policy Studies and carries out its work through a combination of research,
training, and information-sharing both domestically and internationally.
The Pennsylvania Association of Nonprofit Organizations
The Pennsylvania Association of Nonprofit Organizations (PANO) is the statewide membership organization serv-
ing and advancing the charitable nonprofit sector through leadership, advocacy, education and services in order to
improve the quality of life in Pennsylvania.
Center for Civil Society Studies Institute for Policy Studies
The Johns Hopkins University3400 N. Charles St.
Wyman Park Bldg., 5th FloorBaltimore, MD 21218-2688, USA