24
Cumbria County Council Serving the people of Cumbria cumbria.gov.uk Penrith Local Plan Transport Modelling Report April 2015

Cumbria County Council
Serving the people of Cumbria
cumbria.gov.uk
Penrith Local Plan Transport Modelling
Report
April 2015

Penrith Local Plan Transport Modelling Report
April 2015 Page i
Executive Summary
i. The Penrith Local Plan transport modelling report summarises the transport modelling study undertaken to assess the cumulative impact of the Eden Local Plan proposals in Penrith. The report summarises the methodology and results of the modelling study and forms part of the evidence base for the Eden Local Plan.
ii. The study used the Penrith transport model to assess the local plan proposals. The Penrith transport model is a traffic model of the Penrith urban area and the surrounding district. It covers the morning and evening weekday peak periods and was updated in 2012 following the opening of Penrith New Squares.
iii. The study considers a future year of 2032 in line with the plan period. Traffic growth was applied to the base traffic demand to take account of forecast changes in traffic demand in line with guidance from the Department of Transport.
iv. The model was amended to include changes to the highway network, which include the Gilwilly Access Improvements scheme and proposed site accesses for the development sites. The traffic generation and distribution of future developments was also estimated and included within the model.
v. The results of the forecast scenarios were then analysed to assess the impact of the local plan proposals. The model outputs include traffic flows, queues, delays and the ratio of flow to capacity, which is a measure of congestion.
vi. The results show that congestion and journey times are forecast to increase on key routes from 2014 to 2032 as a result of the local plan proposals.

Penrith Local Plan Transport Modelling Report
April 2015 Page ii
Penrith Local Plan Transport Modelling Report
April 2015 Page iii
Contents
1 Introduction ...................................................................................................... 1
1.1 Overview ............................................................................................................ 1
1.2 Contents ............................................................................................................ 1
2 Methodology .................................................................................................... 2
2.1 Overview ............................................................................................................ 2
2.2 Penrith transport model...................................................................................... 2
2.3 Forecasting ........................................................................................................ 2
3 Development scenarios ................................................................................... 4
3.1 Introduction ........................................................................................................ 4
3.2 Scenario 1: 2032 Base....................................................................................... 4
3.3 Scenario 2: 2032 Local Plan .............................................................................. 5
3.4 Trip distribution .................................................................................................. 6
3.5 Summary of development scenarios .................................................................. 7
4 Traffic growth ................................................................................................... 8
4.1 Introduction ........................................................................................................ 8
4.2 Forecast traffic demand ..................................................................................... 8
5 Results ............................................................................................................ 10
5.1 Introduction ...................................................................................................... 10
5.2 2012 Base results ............................................................................................ 11
5.3 Scenario 1: 2032 Base results ......................................................................... 12
5.4 Scenario 2: 2032 Local Plan results................................................................. 13
5.5 Summary ......................................................................................................... 14
6 Conclusion ..................................................................................................... 16
6.1 Summary ......................................................................................................... 16
6.2 Next steps ........................................................................................................ 16

Penrith Local Plan Transport Modelling Report
April 2015 Page iv
Appendix
Appendix A:
Figure A1: 2032 Base development
Figure A2: 2032 Local Plan development
Site details and trip generation
Trip rates and TRICS output
Appendix B:
Traffic growth factors
Appendix C:
Table C1: Forecast junction performance
Figure C1: Forecast junction performance

Penrith Local Plan Transport Modelling Report
April 2015 Page v
List of Tables
Table 3.1: Scenario 1: 2032 Base trip generation ...................................................... 5
Table 3.2: Scenario 2: 2032 Local Plan trip generation .............................................. 6
Table 3.3: Forecast development sites traffic demand ............................................... 7
Table 3.4: Forecast pass-by trips traffic demand ....................................................... 7
Table 4.1: Forecast traffic demand excluding specific development sites .................. 9
Table 4.2: Forecast traffic demand including specific development sites ................... 9
Table 5.1: 2012 Base: junction performance results ................................................ 11
Table 5.2: 2012 Base: journey time summary results............................................... 12
Table 5.3: Scenario 1 2032 Base: junction performance results .............................. 12
Table 5.4: Scenario 2 2032 Base: journey time summary results............................. 13
Table 5.5: Scenario 3 2032 Local Plan: junction performance results ...................... 13
Table 5.6: Scenario 3 2032 Local Plan: journey time summary results .................... 14
Table 5.7: Summary of over capacity junction results .............................................. 14
Table 5.8: Summary of approaching capacity junction results ................................. 14
Table 5.9: Average speed across Penrith (kph) ....................................................... 15

Penrith Local Plan Transport Modelling Report
April 2015 Page vi

Penrith Local Plan Transport Modelling Report
April 2015 Page 1
1 Introduction
1.1 Overview
1.1.1 Cumbria County Council has undertaken a transport modelling study as part of Eden District Council’s Local Plan. The plan is the district council’s strategy for growth from 2014 to 2032. The district council has a statutory duty to prepare a local plan, which will be used to guide development and inform planning decisions once adopted.
1.1.2 The purpose of the modelling study is to assess the cumulative transport impact of the local plan proposals. The study identifies locations on the highway network which are forecast to suffer increased delays as a result of the proposals.
1.1.3 This report summarises the methodology and results of the modelling study.
1.1.4 The results of this study are to be used in further work to help identify potential transport improvements in the Penrith Transport Improvements Study. This infrastructure study will inform Eden District Council’s Infrastructure Delivery Plan, which forms part of the evidence base for the local plan.
1.2 Contents
1.2.1 The report includes the following information:
The methodology of the transport study
The assumptions used for forecasting future travel demand
A summary of the key results
Conclusions and recommendations
Penrith Local Plan Transport Modelling Report
April 2015 Page 2
2 Methodology
2.1 Overview
2.1.1 The transport modelling study has been undertaken using Cumbria County Council’s Penrith transport model.
2.1.2 The methodology used was based on information available in the Department for Transport’s Transport Appraisal Guidance (TAG) and the Planning Practical Guidance document Transport evidence bases in plan making.
2.2 Penrith transport model
2.2.1 The Penrith transport model is a strategic SATURN traffic model of the Penrith urban area and surrounding district. The model covers the morning and evening weekday period periods of 8–9am and 5–6pm. The model considers car, light goods vehicle (van) and heavy goods vehicle trips. The car trips are segmented by trip purpose.
2.2.2 The model was originally constructed with a base year of 2011. The model was subsequently updated to a base year of 2012 following the opening of the Penrith New Squares development.
2.2.3 Further info on the structure of the Penrith transport model is provided in the following report:
Penrith SATURN Model Local Model Validation Report, Parsons Brinckerhoff, July 2012
2.3 Forecasting
2.3.1 The study considered a future year of 2032 in line with the plan period. This future year scenario contains various assumptions relating to potential changes to the highway network and traffic demand.
2.3.2 The future year scenarios considered in this study are shown below. More detail on each scenario is provided in Section 3.
1. 2032 Base
2. 2032 Local Plan
2.3.3 Traffic growth was applied to the base model to account for forecast changes in traffic demand. The growth was calculated based on best practice guidance and future housing targets.
2.3.4 Committed changes to the highway network were included the model. These generally took the form of site accesses for specific sites. Committed improvements to improve access to Gilwilly industrial estate were also included at the following locations:
Penrith Local Plan Transport Modelling Report
April 2015 Page 3
Newton Road/Gilwilly Road
Newton Road/Haweswater Road
Ullswater Road/Haweswater Road
2.3.5 Although not included as part of the improvement package, it was also assumed that further improvements would be made to the Gilwilly Road/Cowper Road junction.
2.3.6 Further details on this improvements project are available in the Access Improvements to Gilwilly Industrial Estate pinch point bid1.
2.3.7 The traffic demand related to specific development sites were added to the model. This involved estimating the traffic demand of each development, and distributing these trips across the model.
2.3.8 The model outputs were used to assess the impact of these scenarios. The model outputs include traffic flows, forecast junction capacity, queues and delays.
2.3.9 The outputs from the model are to be used to inform a further study which identifies potential transport improvements in Penrith. The improvements study will identify potential measures and costs and assesses their effectiveness using detailed modelling software.
1 http://www.cumbria.gov.uk/roads-transport/localpinchpoint.asp
Penrith Local Plan Transport Modelling Report
April 2015 Page 4
3 Development scenarios
3.1 Introduction
3.1.1 Two future year demand scenarios were considered as part of the study. The future year demand scenarios are summarised below:
1. 2032 Base
2. 2032 Local Plan
3.1.2 Scenario 1, 2032 Base, is the reference case scenario. It includes development which is considered as likely to occur by 2032. Specifically, this scenario includes developments that have recently been completed, and developments which have received planning permission.
3.1.3 Scenario 2, 2032 Local Plan, is the local plan scenario. As well as the development in Scenario 1, it includes all development at sites identified within the local plan up to 2032.
3.1.4 The estimated traffic demand for all developments in these scenarios was estimated using the TRICS database. TRICS is a database of traffic and person surveys from different development sites throughout the UK. TRICS is used to estimate the trip generation of a proposed development by selecting surveys from similar sites in the database based on use class, size and location. The output of TRICS includes a trip rate which estimates the traffic or person trip generation per unit of the proposed development.
3.1.5 A separate TRICS analysis was undertaken for each development type included in the future year scenarios. More details on the development assumptions and trip generation in each scenario is provided in the following sections. The trip rates and overall trip generation are provided in the appendix.
3.2 Scenario 1: 2032 Base
3.2.1 Scenario 1 consists of the following assumptions
Developments which have been completed between 2012 and 2014
Developments which have been granted planning permission
3.2.2 Scenario 1 includes a mix of development types, including residential, employment and other developments such as retail. A plan showing the location of development sites in Scenario 1 is provided in the appendix as Figure A1 in Appendix A.
3.2.3 The development included in Scenario 1 includes the following:
Penrith Local Plan Transport Modelling Report
April 2015 Page 5
600 residential dwellings, including
o 375 houses
o 125 apartments
o 72 retirement flats
o 28-bed extra care facility
5,100 square metres of B1/B2/B8 employment development
Mixed/other developments, including:
o 12,498 square metres of A1 non-food retail development
o 60-bed hotel
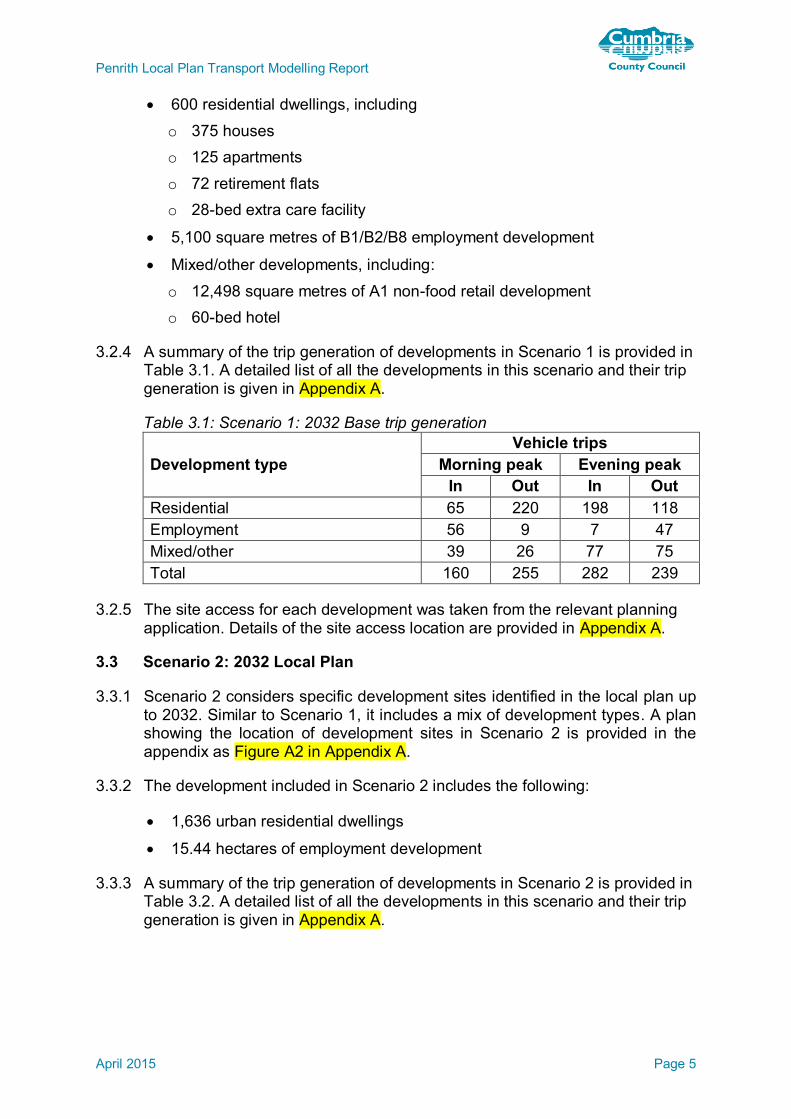
3.2.4 A summary of the trip generation of developments in Scenario 1 is provided in Table 3.1. A detailed list of all the developments in this scenario and their trip generation is given in Appendix A.
Table 3.1: Scenario 1: 2032 Base trip generation
Development type
Vehicle trips
Morning peak Evening peak
In Out In Out
Residential 65 220 198 118
Employment 56 9 7 47
Mixed/other 39 26 77 75
Total 160 255 282 239
3.2.5 The site access for each development was taken from the relevant planning application. Details of the site access location are provided in Appendix A.
3.3 Scenario 2: 2032 Local Plan
3.3.1 Scenario 2 considers specific development sites identified in the local plan up to 2032. Similar to Scenario 1, it includes a mix of development types. A plan showing the location of development sites in Scenario 2 is provided in the appendix as Figure A2 in Appendix A.
3.3.2 The development included in Scenario 2 includes the following:
1,636 urban residential dwellings
15.44 hectares of employment development
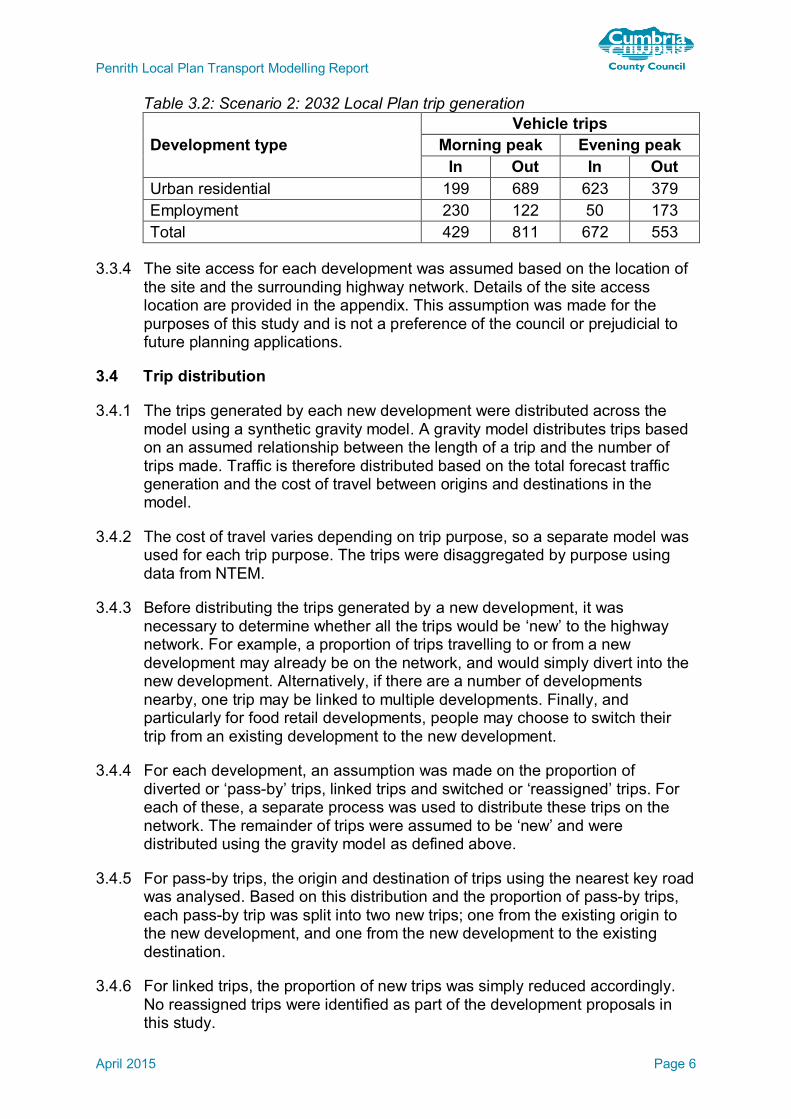
3.3.3 A summary of the trip generation of developments in Scenario 2 is provided in Table 3.2. A detailed list of all the developments in this scenario and their trip generation is given in Appendix A.
Penrith Local Plan Transport Modelling Report
April 2015 Page 6
Table 3.2: Scenario 2: 2032 Local Plan trip generation
Development type
Vehicle trips
Morning peak Evening peak
In Out In Out
Urban residential 199 689 623 379
Employment 230 122 50 173
Total 429 811 672 553
3.3.4 The site access for each development was assumed based on the location of the site and the surrounding highway network. Details of the site access location are provided in the appendix. This assumption was made for the purposes of this study and is not a preference of the council or prejudicial to future planning applications.
3.4 Trip distribution
3.4.1 The trips generated by each new development were distributed across the model using a synthetic gravity model. A gravity model distributes trips based on an assumed relationship between the length of a trip and the number of trips made. Traffic is therefore distributed based on the total forecast traffic generation and the cost of travel between origins and destinations in the model.
3.4.2 The cost of travel varies depending on trip purpose, so a separate model was used for each trip purpose. The trips were disaggregated by purpose using data from NTEM.
3.4.3 Before distributing the trips generated by a new development, it was necessary to determine whether all the trips would be ‘new’ to the highway network. For example, a proportion of trips travelling to or from a new development may already be on the network, and would simply divert into the new development. Alternatively, if there are a number of developments nearby, one trip may be linked to multiple developments. Finally, and particularly for food retail developments, people may choose to switch their trip from an existing development to the new development.
3.4.4 For each development, an assumption was made on the proportion of diverted or ‘pass-by’ trips, linked trips and switched or ‘reassigned’ trips. For each of these, a separate process was used to distribute these trips on the network. The remainder of trips were assumed to be ‘new’ and were distributed using the gravity model as defined above.
3.4.5 For pass-by trips, the origin and destination of trips using the nearest key road was analysed. Based on this distribution and the proportion of pass-by trips, each pass-by trip was split into two new trips; one from the existing origin to the new development, and one from the new development to the existing destination.
3.4.6 For linked trips, the proportion of new trips was simply reduced accordingly. No reassigned trips were identified as part of the development proposals in this study.

Penrith Local Plan Transport Modelling Report
April 2015 Page 7
3.4.7 The gravity model used for trip distribution in this study was of the form
𝑇𝑖𝑗 = 𝛼𝑂𝑖𝐷𝑗𝑓(𝑐𝑖𝑗) (1)
where 𝑇𝑖𝑗 is the number of trips between origin 𝑖 and destination 𝑗, 𝛼 is a
proportionality factor, 𝑂𝑖 is the total number of trips starting at origin 𝑖, 𝐷𝑗 is the
total number of trips ending at destination 𝑗 and 𝑓(𝑐𝑖𝑗) is a generalised
function of travel costs known as the deterrence function.
3.4.8 The deterrence function used was of the form
𝑓(𝑐𝑖𝑗) = 𝑐𝑖𝑗𝑛 𝑒𝛽𝑐𝑖𝑗 (2)
where 𝑐𝑖𝑗 is the cost of travel between origin 𝑖 and destination 𝑗 and 𝑛, 𝛽 are
parameters to be defined.
3.4.9 Finally, the furness procedure was applied to the future year matrix to ensure the trip totals for each development are correct.
3.5 Summary of development scenarios
3.5.1 The forecast traffic demand from development sites is shown in Table 3.3. These totals are cumulative, so the 2032 Local Plan totals include traffic demand from both Scenario 1 and Scenario 2. The forecast pass-by trips traffic demand is shown in Table 3.4.
Table 3.3: Forecast development sites traffic demand
Time period 2012 Base
2032 Base
2032 Local Plan
Morning peak 0 395 1,628
Evening peak 0 476 1,664
Table 3.4: Forecast pass-by trips traffic demand
Time period 2012 Base
2032 Base
2032 Local Plan
Morning peak 0 3 3
Evening peak 0 14 14
Penrith Local Plan Transport Modelling Report
April 2015 Page 8
4 Traffic growth
4.1 Introduction
4.1.1 Traffic growth is the change over time of the number of cars and goods vehicles on the highway network. When forecasting the performance of the highway network in the future, it is necessary to allow for changes in traffic demand.
4.1.2 Traffic growth can be split into two broad areas:
1. New trips: Changes in population, employment and car ownership
directly affect how many vehicles travel on the highway network.
2. Frequency of trips: Changes in GDP, income and travel costs affect how
frequently people travel.
4.2 Forecast traffic demand
4.2.1 Growth in traffic demand in the future year scenarios was considered in line with the fixed demand approach defined in TAG Unit M4 forecasting and uncertainty. A fixed demand approach ignores effects such as induced or suppressed traffic due to changes in travel costs, and changes in travel choice such as peak spreading. A fixed demand approach was used so the impact of the proposed development can be clearly assessed between scenarios without the impact of other variables.
4.2.2 Uncertainty in relation to the growth factors has not been considered as part of the study. It is considered that this is not necessary as the key outputs of the study are the differing impacts between scenarios.
4.2.3 The National Trip End Model (NTEM) dataset represents the Department for Transport’s standard assumptions about growth in travel demand. Access to the dataset is provided through the TEMPRO software.
4.2.4 TEMPRO was used to calculate growth factors for cars based on the future year, trip purpose, time period and the origin and destination of trips. The assumptions within NTEM were adjusted using the alternative assumptions facility within TEMPRO.
4.2.5 The Eden Local Plan has an annual average housing target of 200 dwellings from 2014, 50 per cent of which are to be in the Penrith urban area. This was used as the baseline for future housing numbers. The housing numbers from the specific developments in each scenario were then subtracted from this baseline, and the housing assumptions within TEMPRO were adjusted to match this target.
Penrith Local Plan Transport Modelling Report
April 2015 Page 9
4.2.6 This ensures that the impact of new housing is not double-counted by including the developments in the model directly as well as applying a growth factor. The growth factors still account for other forecast changes that may affect traffic growth, such as demographic changes and car ownership.
4.2.7 As a fixed demand approach was used, fuel and income factors were calculated using TAG Databook Table M4.2.1 Forecast fuel price and income adjustment factors. These factors are based on relationships between car travel, household income and fuel costs.
4.2.8 Growth factors for light goods vehicles and heavy goods vehicles were estimated from the National Transport Model, adjusted using local NTEM factors.
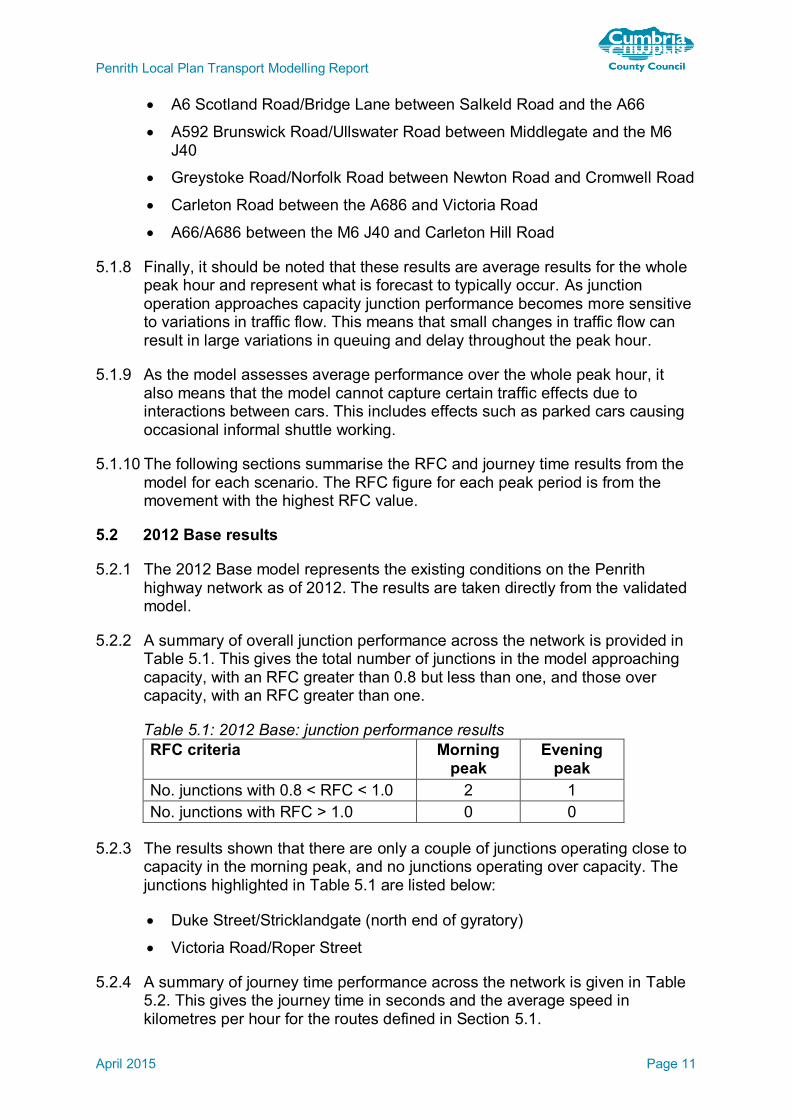
4.2.9 The forecast traffic demand totals for each scenario is shown in Table 4.1. The totals shown exclude the additional traffic generation from specific development sites. The traffic generation for specific sites is provided in Section 3.
Table 4.1: Forecast traffic demand excluding specific development sites
Time period 2012 Base
2032 Base
2032 Local Plan
Morning peak 13,137 15,233 15,018
Evening peak 12,507 14,774 14,409
4.2.10 The growth factors used in the forecasting are provided in Appendix B.
4.2.11 The forecast traffic demand totals for each scenario is shown in Table 4.2. The totals shown include the additional traffic generation from specific development sites.
Table 4.2: Forecast traffic demand including specific development sites
Time period 2012 Base
2032 Base
2032 Local Plan
Morning peak 13,137 15,628 16,647
Evening peak 12,507 15,250 16,074

Penrith Local Plan Transport Modelling Report
April 2015 Page 10
5 Results
5.1 Introduction
5.1.1 The forecast scenarios were created by amending the network to include new accesses, applying traffic growth and including additional development traffic to the validated base model.
5.1.2 The forecast scenarios also included a traffic signal optimising procedure. The signal timings contained within the model are fixed, and changes in traffic flow due to developments may result in the original timings becoming inappropriate. The signalised junctions within Penrith operate on systems which detect vehicles and amend signal timings accordingly, so junction capacity at these locations may be underestimated without optimisation.
5.1.3 The results of the forecast scenarios were then analysed. The model outputs include traffic flows, queues, delays, and the Ratio of Flow to Capacity (RFC) for junctions and links in the model.
5.1.4 The RFC of a movement at a junction is a measure of the congestion of that movement. For example, a movement with a capacity of 1,000 vehicles per hour and a traffic demand of 800 vehicles per hour has an RFC of 0.8.
5.1.5 The maximum ideal junction performance is when all movements have an RFC of around 0.8–0.9. A junction is defined as operating over capacity if it has a movement with an RFC greater than one. Over capacity junctions experience an increased sensitivity to variations in traffic flow which manifest in unreliable journey times and an increase in queuing.
5.1.6 The RFC results for key junctions in the model are included as Table C1 and Figure C1 in Appendix C. This details the maximum RFC for any movement at each junction for each forecast scenario. This also details the results for the tested improvement schemes.
5.1.7 The RFC of a junction can be an abstract concept as it is not easy to relate to when travelling along a road. To counter this, the impact of development can also be assessed by using journey times. Five routes along key corridors have been selected for journey time analysis, with separate journey times calculated for each direction of travel. These routes are presented below.
Penrith Local Plan Transport Modelling Report
April 2015 Page 11
A6 Scotland Road/Bridge Lane between Salkeld Road and the A66
A592 Brunswick Road/Ullswater Road between Middlegate and the M6 J40
Greystoke Road/Norfolk Road between Newton Road and Cromwell Road
Carleton Road between the A686 and Victoria Road
A66/A686 between the M6 J40 and Carleton Hill Road
5.1.8 Finally, it should be noted that these results are average results for the whole peak hour and represent what is forecast to typically occur. As junction operation approaches capacity junction performance becomes more sensitive to variations in traffic flow. This means that small changes in traffic flow can result in large variations in queuing and delay throughout the peak hour.
5.1.9 As the model assesses average performance over the whole peak hour, it also means that the model cannot capture certain traffic effects due to interactions between cars. This includes effects such as parked cars causing occasional informal shuttle working.
5.1.10 The following sections summarise the RFC and journey time results from the model for each scenario. The RFC figure for each peak period is from the movement with the highest RFC value.
5.2 2012 Base results
5.2.1 The 2012 Base model represents the existing conditions on the Penrith highway network as of 2012. The results are taken directly from the validated model.
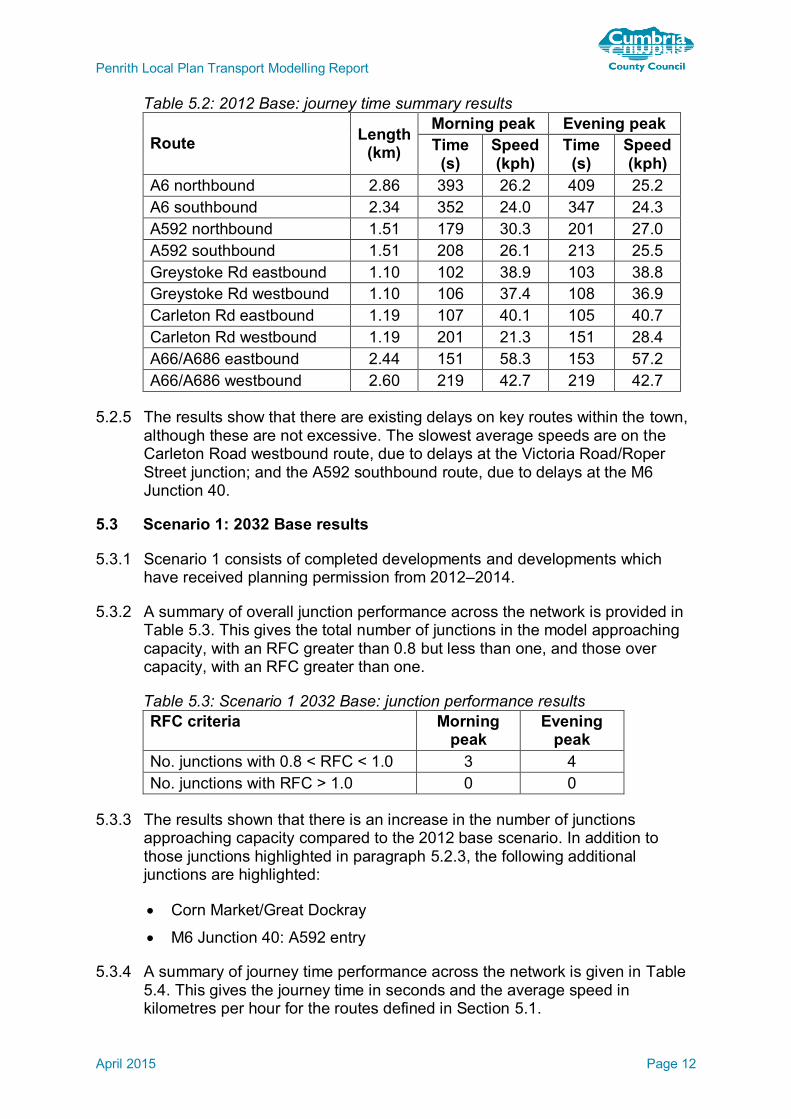
5.2.2 A summary of overall junction performance across the network is provided in Table 5.1. This gives the total number of junctions in the model approaching capacity, with an RFC greater than 0.8 but less than one, and those over capacity, with an RFC greater than one.
Table 5.1: 2012 Base: junction performance results
RFC criteria Morning peak
Evening peak
No. junctions with 0.8 < RFC < 1.0 2 1
No. junctions with RFC > 1.0 0 0
5.2.3 The results shown that there are only a couple of junctions operating close to capacity in the morning peak, and no junctions operating over capacity. The junctions highlighted in Table 5.1 are listed below:
Duke Street/Stricklandgate (north end of gyratory)
Victoria Road/Roper Street
5.2.4 A summary of journey time performance across the network is given in Table 5.2. This gives the journey time in seconds and the average speed in kilometres per hour for the routes defined in Section 5.1.
Penrith Local Plan Transport Modelling Report
April 2015 Page 12
Table 5.2: 2012 Base: journey time summary results
Route Length
(km)
Morning peak Evening peak
Time (s)
Speed (kph)
Time (s)
Speed (kph)
A6 northbound 2.86 393 26.2 409 25.2
A6 southbound 2.34 352 24.0 347 24.3
A592 northbound 1.51 179 30.3 201 27.0
A592 southbound 1.51 208 26.1 213 25.5
Greystoke Rd eastbound 1.10 102 38.9 103 38.8
Greystoke Rd westbound 1.10 106 37.4 108 36.9
Carleton Rd eastbound 1.19 107 40.1 105 40.7
Carleton Rd westbound 1.19 201 21.3 151 28.4
A66/A686 eastbound 2.44 151 58.3 153 57.2
A66/A686 westbound 2.60 219 42.7 219 42.7
5.2.5 The results show that there are existing delays on key routes within the town, although these are not excessive. The slowest average speeds are on the Carleton Road westbound route, due to delays at the Victoria Road/Roper Street junction; and the A592 southbound route, due to delays at the M6 Junction 40.
5.3 Scenario 1: 2032 Base results
5.3.1 Scenario 1 consists of completed developments and developments which have received planning permission from 2012–2014.
5.3.2 A summary of overall junction performance across the network is provided in Table 5.3. This gives the total number of junctions in the model approaching capacity, with an RFC greater than 0.8 but less than one, and those over capacity, with an RFC greater than one.
Table 5.3: Scenario 1 2032 Base: junction performance results
RFC criteria Morning peak
Evening peak
No. junctions with 0.8 < RFC < 1.0 3 4
No. junctions with RFC > 1.0 0 0
5.3.3 The results shown that there is an increase in the number of junctions approaching capacity compared to the 2012 base scenario. In addition to those junctions highlighted in paragraph 5.2.3, the following additional junctions are highlighted:
Corn Market/Great Dockray
M6 Junction 40: A592 entry
5.3.4 A summary of journey time performance across the network is given in Table 5.4. This gives the journey time in seconds and the average speed in kilometres per hour for the routes defined in Section 5.1.

Penrith Local Plan Transport Modelling Report
April 2015 Page 13
Table 5.4: Scenario 2 2032 Base: journey time summary results
Route Length
(km)
Morning peak Evening peak
Time (s)
Speed (kph)
Time (s)
Speed (kph)
A6 northbound 2.86 424 24.3 431 23.9
A6 southbound 2.34 378 22.3 357 23.6
A592 northbound 1.51 189 28.8 211 25.7
A592 southbound 1.51 223 24.3 225 24.1
Greystoke Rd eastbound 1.10 122 32.4 125 31.9
Greystoke Rd westbound 1.10 129 30.1 130 30.6
Carleton Rd eastbound 1.19 114 37.7 110 38.8
Carleton Rd westbound 1.19 175 24.5 170 25.2
A66/A686 eastbound 2.44 152 57.6 156 56.1
A66/A686 westbound 2.60 232 40.3 232 40.4
5.3.5 The results show a general increase in journey times from 2012, particularly on routes entering the city. This is due to the increase in traffic from background traffic growth and the consideration of the specific sites identified in Section 3.2.
5.4 Scenario 2: 2032 Local Plan results
5.4.1 Scenario 2 consists of specific development sites identified in the local plan up to 2032, in addition to the development included in Scenario 1.
5.4.2 A summary of overall junction performance across the network is provided in Table 5.5. This gives the total number of junctions in the model approaching capacity, with an RFC greater than 0.8 but less than one, and those over capacity, with an RFC greater than one.
Table 5.5: Scenario 3 2032 Local Plan: junction performance results
RFC criteria Morning peak
Evening peak
No. junctions with 0.8 < RFC < 1.0 6 6
No. junctions with RFC > 1.0 1 1
5.4.3 The results show increases in the number of junctions approaching capacity and a small increase in the number of junctions operating over capacity. In addition to those junctions highlighted in paragraph 5.2.3 and 5.3.3, the following additional junctions are highlighted:
Middlegate/Burrowgate
Stricklandgate/Portland Place
Eamont Bridge signals
Carleton Avenue/Carleton Road
Carleton Avenue/Carleton Hall Road

Penrith Local Plan Transport Modelling Report
April 2015 Page 14
M6 Junction 40: A66 (E) entry
5.4.4 A summary of journey time performance across the network is given in Table 5.6. This gives the journey time in seconds and the average speed in kilometres per hour for the routes defined in Section 5.1.
Table 5.6: Scenario 3 2032 Local Plan: journey time summary results
Route Length
(km)
Morning peak Evening peak
Time (s)
Speed (kph)
Time (s)
Speed (kph)
A6 northbound 2.86 428 24.1 441 23.4
A6 southbound 2.34 406 20.8 370 22.8
A592 northbound 1.51 192 28.3 219 24.8
A592 southbound 1.51 231 23.5 233 23.3
Greystoke Rd eastbound 1.10 125 31.9 127 31.4
Greystoke Rd westbound 1.10 130 30.6 131 30.2
Carleton Rd eastbound 1.19 126 34.0 120 35.8
Carleton Rd westbound 1.19 184 23.2 136 25.3
A66/A686 eastbound 2.44 155 56.7 160 54.9
A66/A686 westbound 2.60 241 38.8 240 39.1
5.4.5 The results show a further increase in journey times along all routes in Scenario 2, particularly along the routes with the largest development sites. This indicates that the local plan sites would have an impact on journey times along these key routes.
5.5 Summary
5.5.1 A summary of the junction performance results for all scenarios is presented below in Table 5.7 and Table 5.8. The summary shows how the number of over capacity junctions is expected to increase in each scenario.
Table 5.7: Summary of over capacity junction results
Scenario Morning peak
Evening peak
2012 Base 0 0
Scenario 1: 2032 Base 0 0
Scenario 2: 2032 Local Plan 1 1
Table 5.8: Summary of approaching capacity junction results
Scenario Morning peak
Evening peak
2012 Base 2 1
Scenario 1: 2032 Base 3 4
Scenario 2: 2032 Local Plan 6 6
Penrith Local Plan Transport Modelling Report
April 2015 Page 15
5.5.2 The summary tables show that the number of over capacity junctions is forecast to marginally increase in the future as a result of additional development. There are larger increases in the number of junctions approaching capacity.
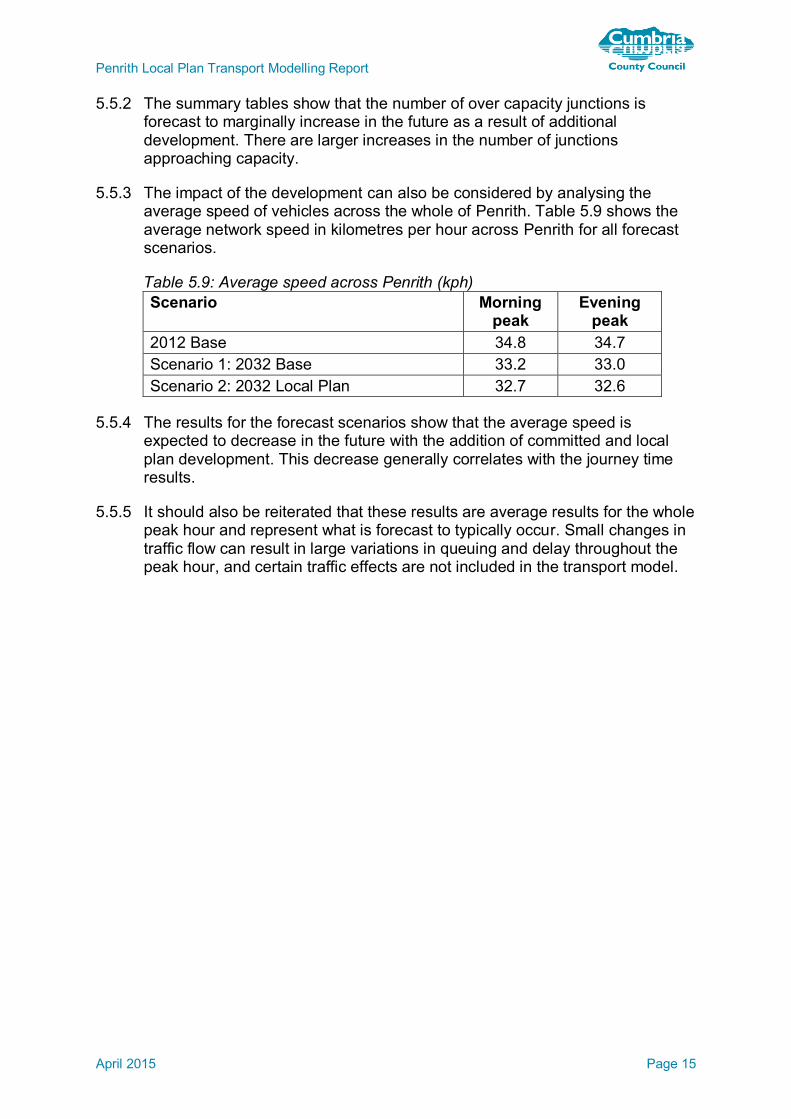
5.5.3 The impact of the development can also be considered by analysing the average speed of vehicles across the whole of Penrith. Table 5.9 shows the average network speed in kilometres per hour across Penrith for all forecast scenarios.
Table 5.9: Average speed across Penrith (kph)
Scenario Morning peak
Evening peak
2012 Base 34.8 34.7
Scenario 1: 2032 Base 33.2 33.0
Scenario 2: 2032 Local Plan 32.7 32.6
5.5.4 The results for the forecast scenarios show that the average speed is expected to decrease in the future with the addition of committed and local plan development. This decrease generally correlates with the journey time results.
5.5.5 It should also be reiterated that these results are average results for the whole peak hour and represent what is forecast to typically occur. Small changes in traffic flow can result in large variations in queuing and delay throughout the peak hour, and certain traffic effects are not included in the transport model.
Penrith Local Plan Transport Modelling Report
April 2015 Page 16
6 Conclusion
6.1 Summary
6.1.1 The results of the forecast scenarios have been analysed to assess the impact of the local plan proposals. This included assessing the number of junctions forecast to operate over capacity and the journey times along key routes within Penrith.
6.1.2 The results forecast that the Eden Local Plan proposals would lead to an increase in congestion in Penrith, based on the maximum RFC of junctions, compared to the base scenario. Journey times are forecast to increase on key routes in the city, particularly on routes where a large proportion of development is located.
6.1.3 The outputs from the model have been used to identify areas of Penrith which are forecast to experience increased queuing and delay with the local plan proposals.
6.2 Next steps
6.2.1 The results of this study are to be used in further work to help identify potential transport improvements in Penrith. The junctions identified as approaching capacity in this study will be investigated further, along with other known pinch-points on the network which are not accurately represented in the Penrith transport model.
6.2.2 The improvements study will consider highways measures to improve capacity and the indicative costs of these improvements. The study will also propose measures to increase the attractiveness and mode share of walking, cycling and public transport, along with indicative costs for these measures.


